e Journal of Transdisciplinary Environmental Studies vol. 3, no. 1, 2004 e Journal of Transdisciplinary Environmental Studies, ISSN 1602-2297 http://www.journal-tes.dk/ 10,000 Years of Climate Change and Human Impact on the Environment in the Area Surrounding Lejre. N. Schrøder, L. Højlund Pedersen, R. Juel Bitsch. Department of Environment, Technology and Social Studies, Roskilde University. Denmark. E-mail: [email protected] Abstract: e classical site for Holocene studies of the impact of humans and climatic changes – Lejre (Denmark) and its surroundings – has been re-examined. A detailed geological/geophysi- cal mapping of the area and geochemical/palynological analysis of two selected cores confirms that climate change has been the decisive factor behind the main changes in human activities in the area. It also confirms that the Blytt-Sernander model fits very well with the climatic proxies from the Lejre area. Finally, it is concluded that the Holocene climatic history of the Lejre area and of Greenland are closely correlated with strong ties to global causes of climate change. Key words: Holocene, climatic change, geology, archaeology, pollen, Blytt-Sernander model. Introduction For more than 350 years, the area around Lejre has been a classical object of investigations into natural history with the aim of studying the interaction between human activity and environmental change (Worm 1642, Anchersen 1745, Dau 1829, Forch- hammer et al. 1852-1856, Rørdam 1900). During the last 25 years, Roskilde University has made de- tailed geological/geophysical mapping of the area. In recent years, there has been a debate concerning the establishment of a national park in the Roskilde Fjord/Lejre area, the main aim of which would be to communicate knowledge about the interaction between its natural and cultural histories. During the same period, the authors of this article have finished pollen and geochemical analysis of cores from a drill hole in Roskilde Fjord (RF6), and from a drill hole in lake Kornerup. It has been debated if the climatic (environmental) changes have been the effect of human activity, or whether the changing human activity has been the effect of climatic change (Bondesen 1998, Diamond 1998). It will be one aim of this paper to interpret the analytical data from the two drill holes in the framework of the detailed geological mapping of the area, and to compare the results with the national archaeological database (www.dkconline.dk), in order to clarify this problem. Also we will present data that shows that the Blytt-Sernander model of Holocene climatic change fits well with the climatic indicators in the Lejre area. e Blytt-Sernander model For more than one hundred years, vegetational inferred climatic changes have provided the basis for subdividing the NW European Holocene. Until recently, the Blytt-Sernander model based on peat stratigraphy has been the dominant theory. Blytt (1876) explained the occurrence of tree-stumps layers as evidence of an alternation between dry and rainy periods, due to the work of Sernander (1908) the model gained a better foundation and won general acceptance. e Blytt-Sernander model divided the last 10,000 years of the Holocene into four phases: Boreal (dry), Atlantic (humid), Subboreal (dry and warm) and Subatlantic (humid and cool). e transitions

Welcome message from author
This document is posted to help you gain knowledge. Please leave a comment to let me know what you think about it! Share it to your friends and learn new things together.
Transcript

The Journal of Transdisciplinary Environmental Studies vol. 3, no. 1, 2004
The Journal of Transdisciplinary Environmental Studies, ISSN 1602-2297http://www.journal-tes.dk/
10,000 Years of Climate Change and Human Impact on the Environment in the Area
Surrounding Lejre.N. Schrøder, L. Højlund Pedersen, R. Juel Bitsch.Department of Environment, Technology and Social Studies, Roskilde University. Denmark.E-mail: [email protected]
Abstract: The classical site for Holocene studies of the impact of humans and climatic changes – Lejre (Denmark) and its surroundings – has been re-examined. A detailed geological/geophysi-cal mapping of the area and geochemical/palynological analysis of two selected cores confirms that climate change has been the decisive factor behind the main changes in human activities in the area. It also confirms that the Blytt-Sernander model fits very well with the climatic proxies from the Lejre area. Finally, it is concluded that the Holocene climatic history of the Lejre area and of Greenland are closely correlated with strong ties to global causes of climate change.
Key words: Holocene, climatic change, geology, archaeology, pollen, Blytt-Sernander model.
IntroductionFor more than 350 years, the area around Lejre has been a classical object of investigations into natural history with the aim of studying the interaction between human activity and environmental change (Worm 1642, Anchersen 1745, Dau 1829, Forch-hammer et al. 1852-1856, Rørdam 1900). During the last 25 years, Roskilde University has made de-tailed geological/geophysical mapping of the area. In recent years, there has been a debate concerning the establishment of a national park in the Roskilde Fjord/Lejre area, the main aim of which would be to communicate knowledge about the interaction between its natural and cultural histories. During the same period, the authors of this article have finished pollen and geochemical analysis of cores from a drill hole in Roskilde Fjord (RF6), and from a drill hole in lake Kornerup. It has been debated if the climatic (environmental) changes have been the effect of human activity, or whether the changing human activity has been the effect of climatic change (Bondesen 1998, Diamond 1998). It will be one aim of this paper to interpret the analytical data from the two drill holes in the
framework of the detailed geological mapping of the area, and to compare the results with the national archaeological database (www.dkconline.dk), in order to clarify this problem. Also we will present data that shows that the Blytt-Sernander model of Holocene climatic change fits well with the climatic indicators in the Lejre area.
The Blytt-Sernander modelFor more than one hundred years, vegetational inferred climatic changes have provided the basis for subdividing the NW European Holocene. Until recently, the Blytt-Sernander model based on peat stratigraphy has been the dominant theory. Blytt (1876) explained the occurrence of tree-stumps layers as evidence of an alternation between dry and rainy periods, due to the work of Sernander (1908) the model gained a better foundation and won general acceptance. The Blytt-Sernander model divided the last 10,000 years of the Holocene into four phases: Boreal (dry), Atlantic (humid), Subboreal (dry and warm) and Subatlantic (humid and cool). The transitions
2
Schrøder el al.: 10,000 years of climate change and human impact on the environment.......
between the periods were considered rather abrupt. Sernander even believed that the Subboreal-Sub-atlantic represented a climatic catastrophe – the Fimbul winter of the Sagas.With the subsequent development of palynology, pollen zones were fitted to the Blytt- Sernander periods. However, the Atlantic period was divided in two zones the Early Atlantic Period and the Full Atlantic Period (Jessen 1937, Jørgensen 1963).
With the application of 14C dating it has become clear that the changes in vegetation were time-trans-gressive (Magnerud et al., 1982), and some geolo-gists have since used the Blytt-Sernander periods as crono stratigraphic units only. In addition, the archaeologists are now rejecting the theory of the “catastrophic” period-shifts. Jørgen Jensen (2003 p.23-24), in his monumental and authoritative review of Danish prehistory, sees the Subboreal-Subatlantic change as just one of many cyclic cli-matic variations, which is in contrast to the former authoritative review of Danish prehistory (Brønsted 1940,1977) in particular, he opposes the popular description of climatic change presented by Martin A. Hansen (1952) a writer (and amateur archaeolo-gist) who lived in and interpreted the prehistory of the Lejre area. Consequently, the Blytt-Sernander periodisation is now falling into disuse. However, the scheme was established to describe the situation in Scandinavia, and in this investigation, the Blytt-Sernander climat-ic zones show up clearly in the lithology (chemical
analysis) of the marine core (RF6). Furthermore, the lithological changes are synchronous with the shift in pollen zones. Therefore, we employ these zonings in the description of the Holocene climate. Moreover, as the results of the analysis show the changes in vegetation that define the transition between the periods are the result of climatic change that must cover much greater areas than Sjælland. We observe the same development in vegetation change in the two sites. However, the chemical analysis of cores from Lake Kornerup mainly shows the impact of human activity on the landscape (Schrøder et al. 1996), while the chemical analysis of the cores from Roskilde Fjord reflects changes in salinity, tides and rainfall.This reflection of more general climatic indicators is due to the very unique environment around drill hole RF6 in Roskilde Fjord. As seen on the maps, the inner part of Roskilde Fjord is configured as an evaporation pan, in the middle of Sjælland, with fluctuating inflows of seawater and freshwater.
Data and interpretation methodsDrill hole analysis,Core samples from the drill holes in Roskilde Fjord (RF6) and Lake Kornerup were recovered in 5cm thickness.
Pollen analysis: Pollen were counted in 40 levels in Roskilde Fjord (RF6). In every level 500 – 600 pollen were counted. In Lake Kornerup pollen were
Figure 1. Location of the Lejre study area – figures 2, 3,18-21 and the Roskilde area – figures 14-17.
3
The Journal of Transdisciplinary Environmental Studies (TES)
counted in 62 levels. In every level about 1000 pollen were counted. All samples had well preserved pollen (Højlund Pedersen 2003). Dating: In this study, the Blytt-Sernander climatic zones have been established using the traditional pol-len indicators namely the distinct elm-fall at the Full Atlantic/Subboreal transition, and the rise of Beech at the Subboreal/Subatlantic transition. In dating the zones, we follow the investigations in Store Bælt (Christensen et al.1997). However, 14C datings in RF6 of both the top of Boreal (AAR-3347) and the bottom of Early Atlantic (AAR-3346) confirmed the date of 7000 BC. Similarly, dating the elm-fall in both RF6 (AAR-3345) and Lake Kornerup (AAR-6263) confirmed the date of 3800 BC. Chemical analysis: 40 levels in Roskilde Fjord (RF6) were analysed for:Ba, Ca, Sr, Mg, Fe, Mn, Cr, Zn, Pb, Cd, Cu, Ni, Co, Hg (Enøe 2003). Destruction was undertaken in a Milestone, MLS-1200 MEGA microwave oven, using the following sequence of chemical reagents: HNO3 (65% Su-prapur), H2O2 (30%, p.a.). This solution in exact volume with deionizated water was then analysed on AAS, (Varian, SpectrAA 250 Plus). Standards were made from a Stock-standard solution with the concentration 1000 mg/L, BDH Spectrsol. Hg was measured on Hydrid system VGA 76 on the same Varian, using 25% SnCl2 in 20% HCl suprapur quality.
Geological mappingDuring the last 25 years, Roskilde University has made detailed geological/geophysical mapping of the area in order to provide a basis for a more sustain-able use of the groundwater and mineral resources in the area (see figures 2-3, for review and reference list see Schrøder 1997). Roskilde Fjord has also been mapped in detail (for review and reference list see Bondesen 2002). The configuration of the former coastlines (figures 14 and 15) is based partly on drill hole information (Bondesen 1988). However, the details mainly come from the geoelectrical mapping (see figure 13) of Roskilde Fjord and Isefjord, where more than 500 km of profiling has been measured in the map area. This is as seismic profiles are unable to establish the thickness of the Holocene deposits due to the high gas content (Bondesen et al. 1979, Schrøder 1992).
Hydrogeological modellingThe distribution of wetlands on the palaeo-geo-graphical maps of figures 14 to 16 has been deter-mined from hydrogeological models, based on the geological maps, and calibrated by the modelling of the known effects of the establishment of the groundwater pumping in 1936 (see fig. 4). It has also been determined by the observed rise of groundwater level in Lake Kornerup (figure 5) and in Lavringe (Sørensen 1986) from Boreal to Full Atlantic.
Archaeological and historical dataThe archaeological Mesolithic settlement data shown in figures 14 to 16 and the data on stone graves from the Neolithic period and grave mounds from the Bronze Age (figures 18 to 19) are from the national archaeological database (www.dkconline.dk). Some grave mounds may be from the Iron Age, but known iron ages mounds have been ignored.
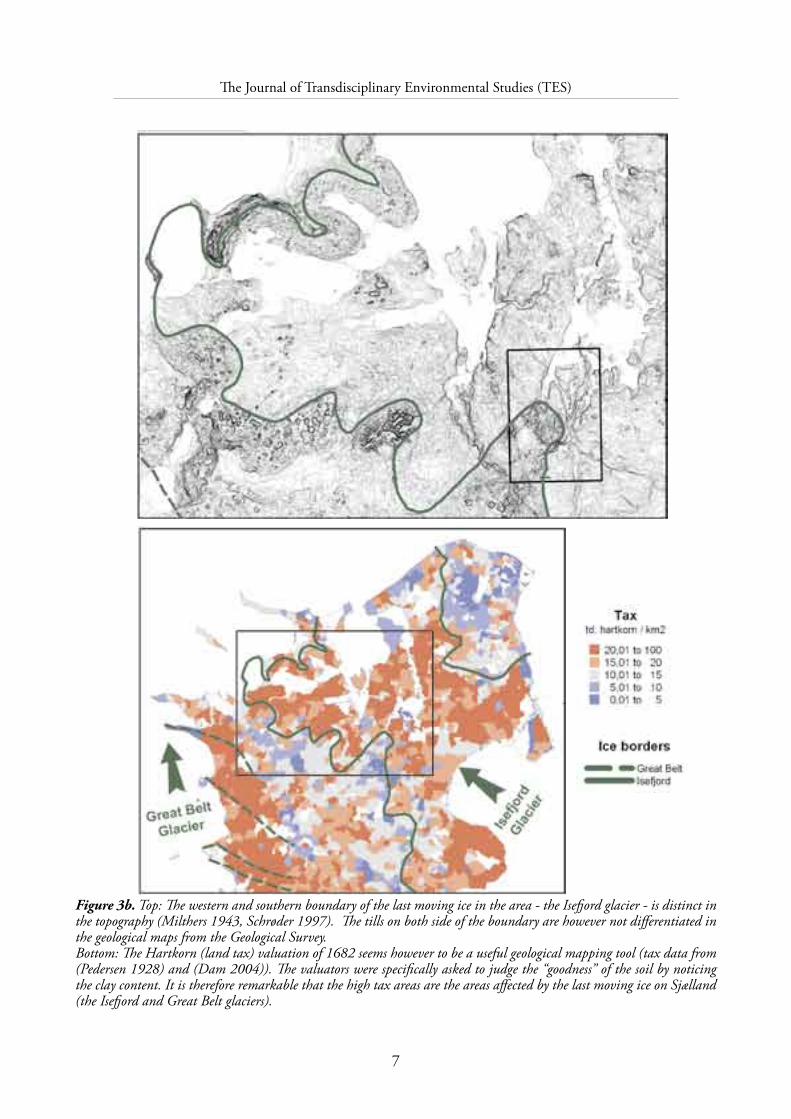
The mapping of villages around 600 AD and of villages and manor houses in 1682 AD (figures 20 to 21) is based on the Hartkorn (land tax) of the 1682 (Pedersen 1928) and on place name studies (Jørgensen 1996).The Hartkorn (land tax) valuation of 1682 seems also to be a useful geological mapping tool. The valuators were specifically asked to judge the “good-ness” of the soil by noticing the clay content. It is therefore worth noting that the areas with the high tax are the areas affected by the last ice movements on Sjælland (see figure 3b). Lodgement (bottom) till being dominant in the areas affected by the Isefjord and Great Belt glaciers could explain it. Whereas the central Sjælland was dominated by stagnant ice - and flow till.
4
Schrøder el al.: 10,000 years of climate change and human impact on the environment.......
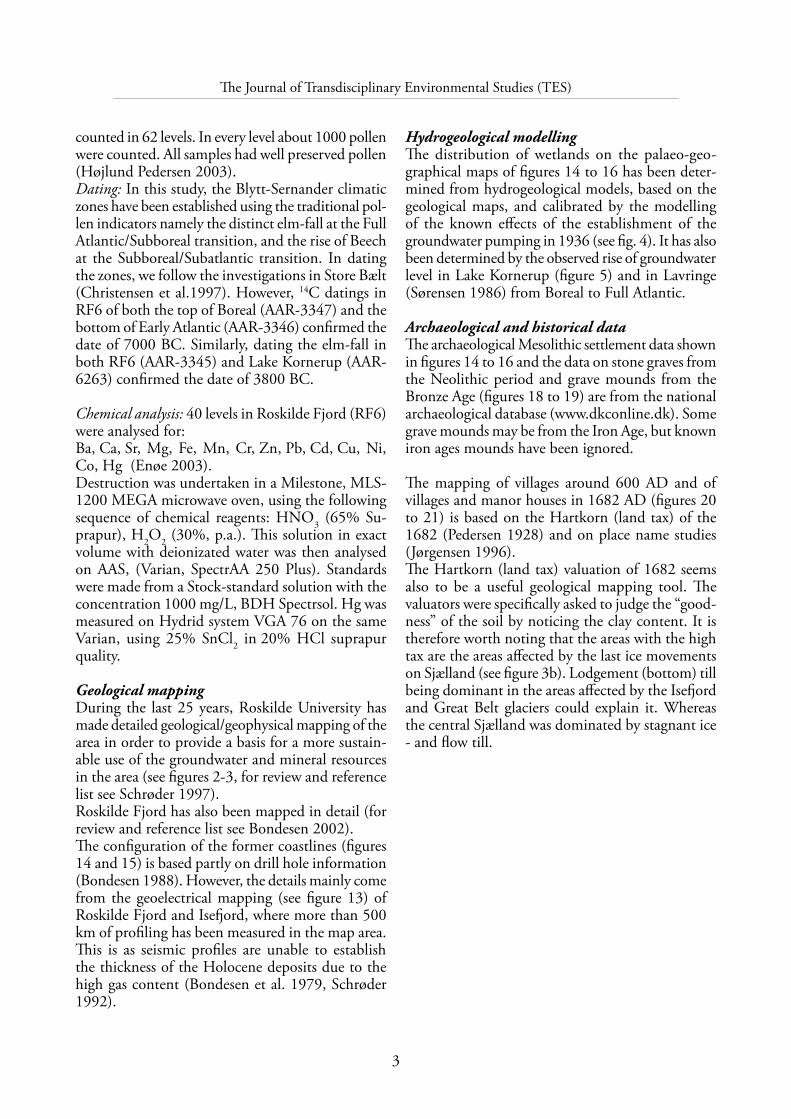
Figure 2a. The pre-Quaternary map of the Lejre area, with the location of profiles show in figure 2b. Contours show the boundary face between Tertiary and Quaternary deposits. The contours are based on the drill holes and geoelectrical soundings indicated (after Schrøder et al. 1989).
5
The Journal of Transdisciplinary Environmental Studies (TES)
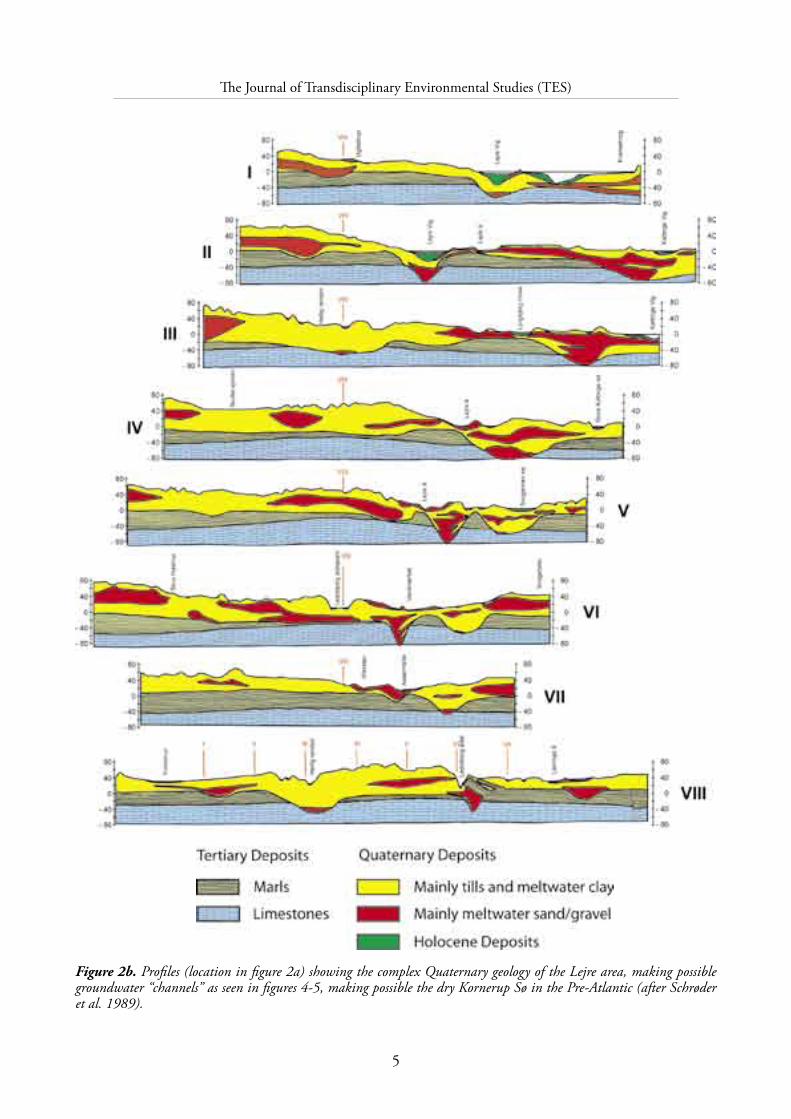
Figure 2b. Profiles (location in figure 2a) showing the complex Quaternary geology of the Lejre area, making possible groundwater “channels” as seen in figures 4-5, making possible the dry Kornerup Sø in the Pre-Atlantic (after Schrøder et al. 1989).
6
Schrøder el al.: 10,000 years of climate change and human impact on the environment.......
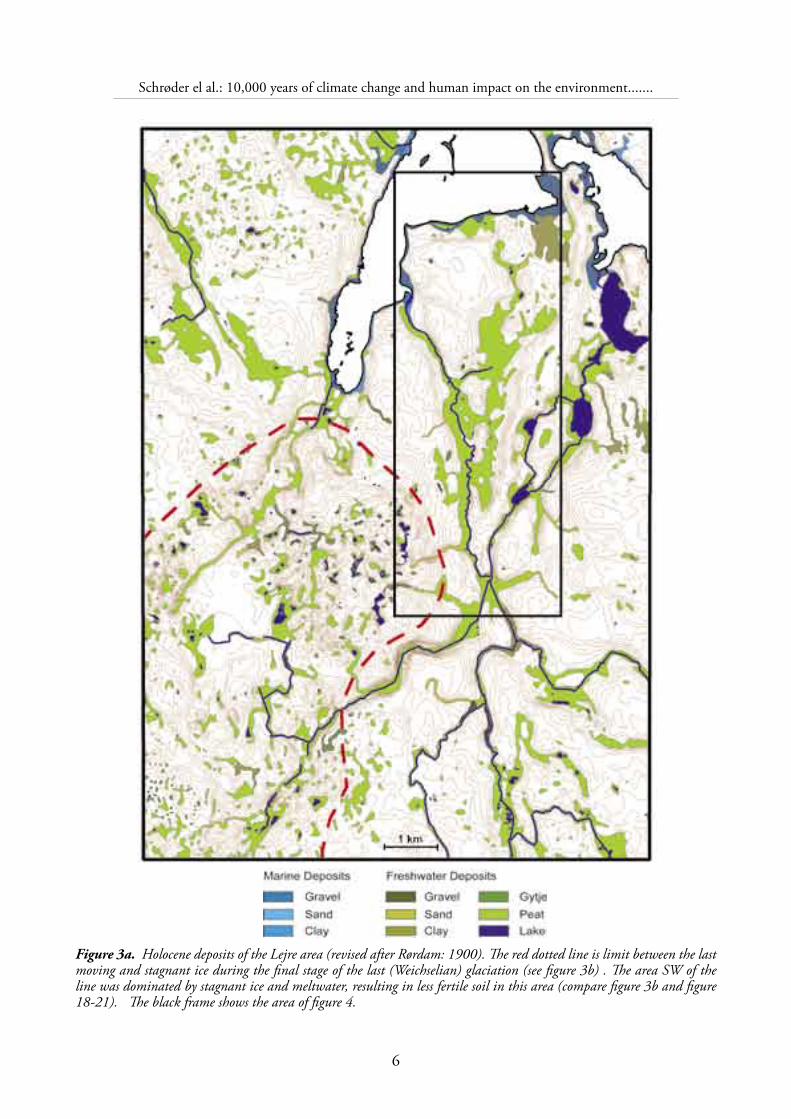
Figure 3a. Holocene deposits of the Lejre area (revised after Rørdam: 1900). The red dotted line is limit between the last moving and stagnant ice during the final stage of the last (Weichselian) glaciation (see figure 3b) . The area SW of the line was dominated by stagnant ice and meltwater, resulting in less fertile soil in this area (compare figure 3b and figure 18-21). The black frame shows the area of figure 4.
7
The Journal of Transdisciplinary Environmental Studies (TES)
Figure 3b. Top: The western and southern boundary of the last moving ice in the area - the Isefjord glacier - is distinct in the topography (Milthers 1943, Schrøder 1997). The tills on both side of the boundary are however not differentiated in the geological maps from the Geological Survey. Bottom: The Hartkorn (land tax) valuation of 1682 seems however to be a useful geological mapping tool (tax data from (Pedersen 1928) and (Dam 2004)). The valuators were specifically asked to judge the “goodness” of the soil by noticing the clay content. It is therefore remarkable that the high tax areas are the areas affected by the last moving ice on Sjælland (the Isefjord and Great Belt glaciers).
8
Schrøder el al.: 10,000 years of climate change and human impact on the environment.......
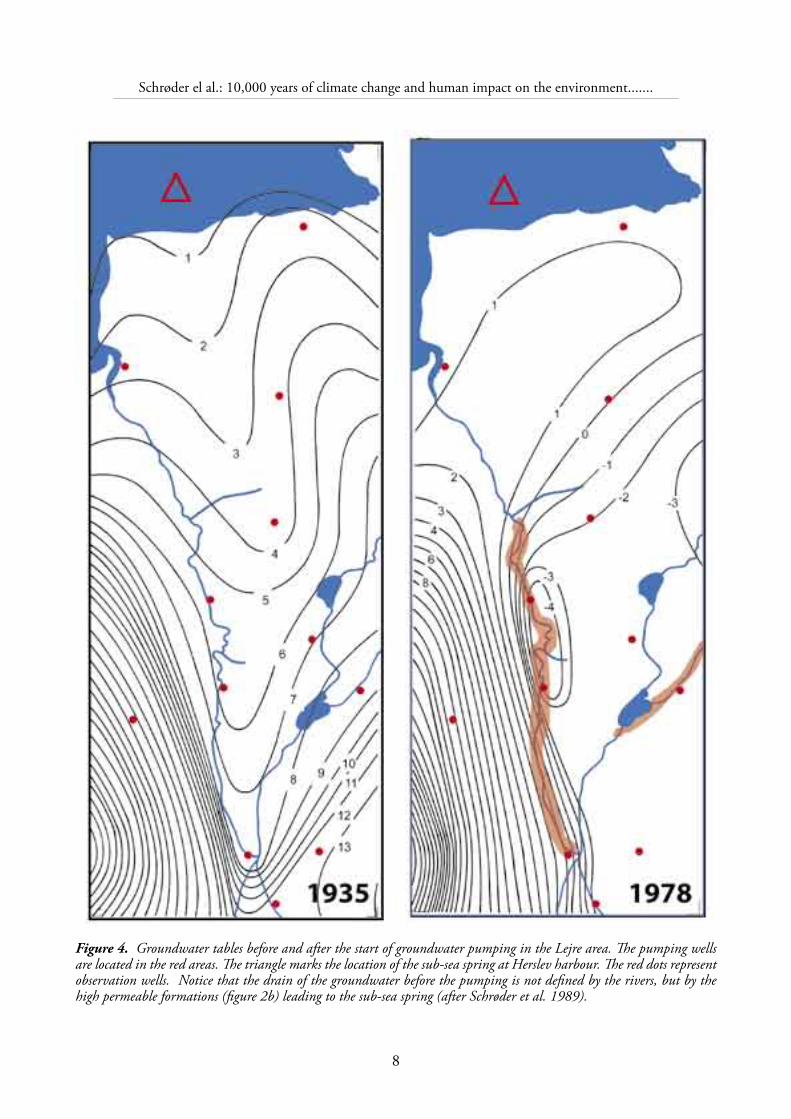
Figure 4. Groundwater tables before and after the start of groundwater pumping in the Lejre area. The pumping wells are located in the red areas. The triangle marks the location of the sub-sea spring at Herslev harbour. The red dots represent observation wells. Notice that the drain of the groundwater before the pumping is not defined by the rivers, but by the high permeable formations (figure 2b) leading to the sub-sea spring (after Schrøder et al. 1989).

9
The Journal of Transdisciplinary Environmental Studies (TES)
Figure 5. Schematic profiles through Kornerup Sø, Herslev harbour spring, Roskilde fjord (RF6). Illustrating the change in the aquatic environment in Roskilde Fjord, and explaining why the Pre-Atlantic deposits are lacking in Kornerup Sø.

10
Schrøder el al.: 10,000 years of climate change and human impact on the environment.......
10,000 years of proxies describing the climatic periods
Boreal (8000-7000 BC)In accordance with the Blytt-Sernander climate the-ory, we find evidence of low water levels in Roskilde Fjord in the Boreal period. Dau (1829) described the existence of pine stumps in local peat bogs from the Boreal/Atlantic transition, but explained this as a result of human activities. However, Forchhammer et al. (1852-1856) correctly interpreted the pine stumps as a result of the general rise in sea level in the North-Sea area at the end of the Boreal time.It is not easy to see from RF6 if the low level of the lake is due to sedimentation (filling up of the Prebo-real lake), low rainfall, or lowering of the ground-water level due to the falling sea level in Kattegat. We know however from sea-level studies in Kattegat (Mörner 1969) that the Holocene sea level in the southern part of Kattegat was at it’s lowest just before the Boreal period.The filling up of the Preboreal lake and the results of
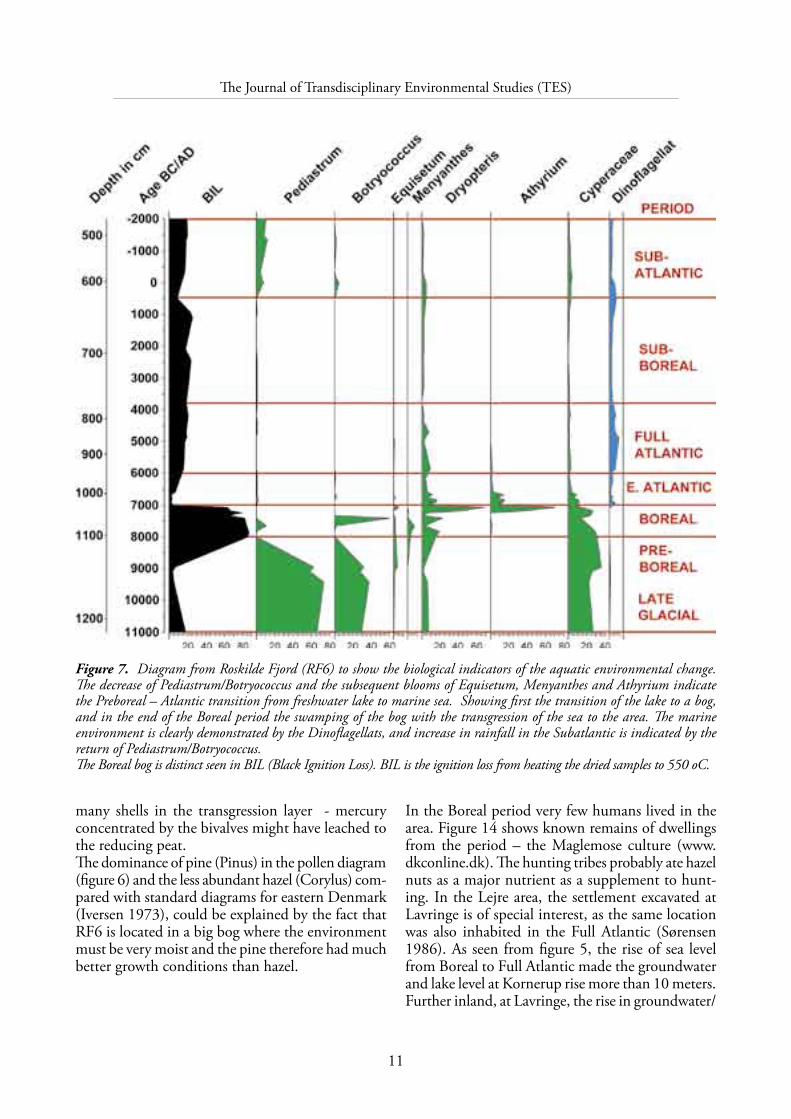
the sinking Preboreal groundwater level are seen in figure 7. Here we see the decrease of Pediastrum and the subsequent blooms of Equisetum, Menyanthes and Athyrium. This evidence shows first the transi-tion of the lake to a bog, and then, at the end of the Boreal period, the swamping of the bog followed by the transgression of the sea to the area.The sediment of the Boreal period consists of brown peat in the first half, and black peat in the second half, also indicated by the iron content as shown in the diagram (figure 8). In the first half of the period, the environment around RF6 was a bog with water supply coming only in the form of rainwater/surface water. Later the sea level /groundwater level rose and groundwater (with iron) seeped into the bog.As the sediments of the period are peat, one is not surprised to find a low lead content (figure 8), how-ever the relatively high mercury content especially in the top of the Boreal (higher than in the industrial impacted sediments in the top layer) has given rise to much speculation – is it volcanic or meteoric fallout? It could also be a secondary effect of the
Figure 6. Pollendiagram Roskilde Fjord (RF6). The Blytt-Sernander climatic zones have been established with the traditional pollen indicators, as the distinct elm-fall at the Full Atlantic/ Subboreal transition, and the rise of beech at the Subboreal/Subatlantic transition. In dating the zones we follow the investigations in Store Bælt (Christensen et al.1997). The few samples below 1100 cm seem to have missed the Younger Dryas, so the transition Preboreal/Late Glacial is not drawn up.
11
The Journal of Transdisciplinary Environmental Studies (TES)
Figure 7. Diagram from Roskilde Fjord (RF6) to show the biological indicators of the aquatic environmental change. The decrease of Pediastrum/Botryococcus and the subsequent blooms of Equisetum, Menyanthes and Athyrium indicate the Preboreal – Atlantic transition from freshwater lake to marine sea. Showing first the transition of the lake to a bog, and in the end of the Boreal period the swamping of the bog with the transgression of the sea to the area. The marine environment is clearly demonstrated by the Dinoflagellats, and increase in rainfall in the Subatlantic is indicated by the return of Pediastrum/Botryococcus.The Boreal bog is distinct seen in BIL (Black Ignition Loss). BIL is the ignition loss from heating the dried samples to 550 oC.
many shells in the transgression layer - mercury concentrated by the bivalves might have leached to the reducing peat. The dominance of pine (Pinus) in the pollen diagram (figure 6) and the less abundant hazel (Corylus) com-pared with standard diagrams for eastern Denmark (Iversen 1973), could be explained by the fact that RF6 is located in a big bog where the environment must be very moist and the pine therefore had much better growth conditions than hazel.
In the Boreal period very few humans lived in the area. Figure 14 shows known remains of dwellings from the period – the Maglemose culture (www.dkconline.dk). The hunting tribes probably ate hazel nuts as a major nutrient as a supplement to hunt-ing. In the Lejre area, the settlement excavated at Lavringe is of special interest, as the same location was also inhabited in the Full Atlantic (Sørensen 1986). As seen from figure 5, the rise of sea level from Boreal to Full Atlantic made the groundwater and lake level at Kornerup rise more than 10 meters. Further inland, at Lavringe, the rise in groundwater/
12
Schrøder el al.: 10,000 years of climate change and human impact on the environment.......
A
B
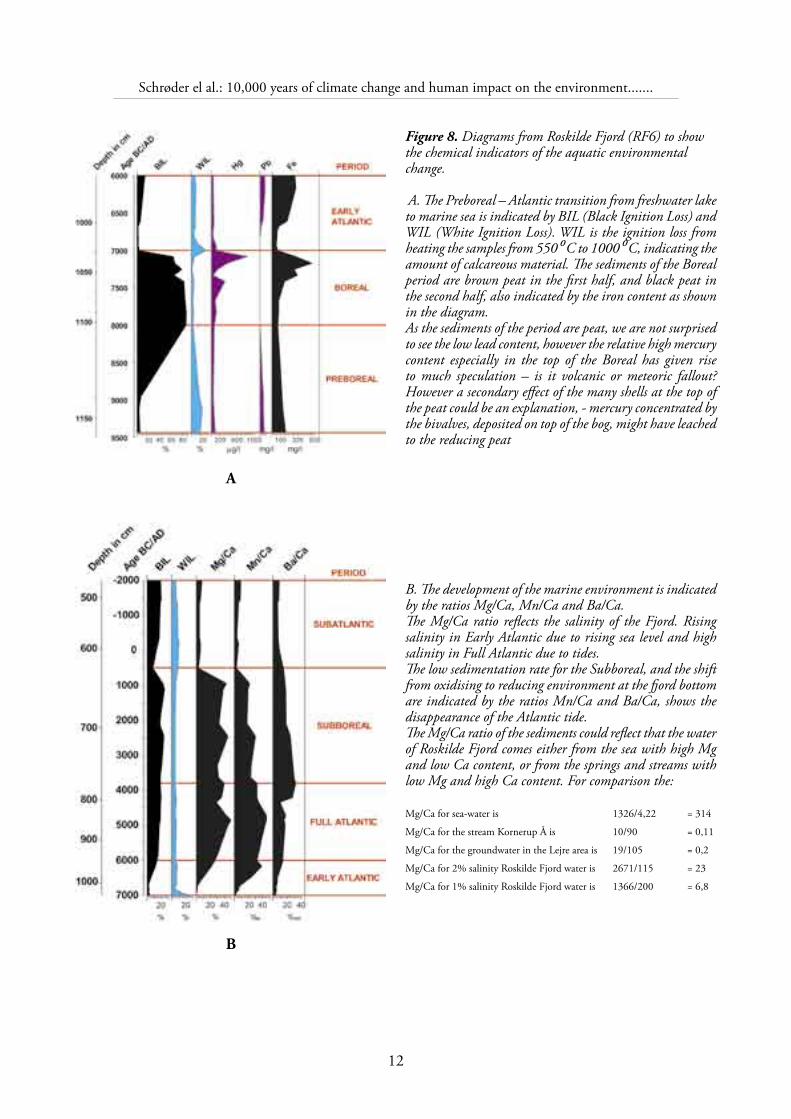
Figure 8. Diagrams from Roskilde Fjord (RF6) to show the chemical indicators of the aquatic environmental change.
A. The Preboreal – Atlantic transition from freshwater lake to marine sea is indicated by BIL (Black Ignition Loss) and WIL (White Ignition Loss). WIL is the ignition loss from heating the samples from 550 oC to 1000 oC, indicating the amount of calcareous material. The sediments of the Boreal period are brown peat in the first half, and black peat in the second half, also indicated by the iron content as shown in the diagram. As the sediments of the period are peat, we are not surprised to see the low lead content, however the relative high mercury content especially in the top of the Boreal has given rise to much speculation – is it volcanic or meteoric fallout? However a secondary effect of the many shells at the top of the peat could be an explanation, - mercury concentrated by the bivalves, deposited on top of the bog, might have leached to the reducing peat
B. The development of the marine environment is indicated by the ratios Mg/Ca, Mn/Ca and Ba/Ca. The Mg/Ca ratio reflects the salinity of the Fjord. Rising salinity in Early Atlantic due to rising sea level and high salinity in Full Atlantic due to tides. The low sedimentation rate for the Subboreal, and the shift from oxidising to reducing environment at the fjord bottom are indicated by the ratios Mn/Ca and Ba/Ca, shows the disappearance of the Atlantic tide.The Mg/Ca ratio of the sediments could reflect that the water of Roskilde Fjord comes either from the sea with high Mg and low Ca content, or from the springs and streams with low Mg and high Ca content. For comparison the:
Mg/Ca for sea-water is 1326/4,22 = 314
Mg/Ca for the stream Kornerup Å is 10/90 = 0,11
Mg/Ca for the groundwater in the Lejre area is 19/105 = 0,2
Mg/Ca for 2% salinity Roskilde Fjord water is 2671/115 = 23
Mg/Ca for 1% salinity Roskilde Fjord water is 1366/200 = 6,8

13
The Journal of Transdisciplinary Environmental Studies (TES)
lake level, as recorded by the excavations was only around 1 meter (Sørensen 1986).
Early Atlantic (7000-6000 BC)Around 7000 BC the sea invaded the lowland, flood-ing lakes and bogs, creating the Roskilde Fjord. As shown by 14C datings (Bondesen 2002), the trans-gression was almost simultaneous over the entire fjord, and the Boreal bog in RF6 (10.20 m below present sea level) is covered by 20 cm of littoral shell deposits, which were later followed by five meters of marine gyttja.Also in the Early Atlantic period considerable erosion took place in the narrow parts. The configuration of the Early Atlantic fjord (figures 14 and 15) was ex-treme, with very narrow passages. The configuration of the former coastlines is based partly on drill hole information (Bondesen 1988), but the details mainly
come from the geoelectrical mapping (see figure 13) of Roskilde Fjord and Isefjord, where more than 500 km of profiling has been measured in the map area (seismic profiles are unable to establish the thickness of the Holocene deposits due to the high gas content (Bondesen et al. 1979)). The pollen curves shown in figure 6 illustrate how the climax trees oak (Quercus) and lime (Tilia) oust the pioneer trees birch (Betula) and pine (Pinus). Also the grass-pollen decreases due to the increasing shade of the climax trees (this could however also be due to varying size of the swamp).During the Early Atlantic, humans (the Kongemose culture) moved their dwellings to the coast as seen in figure 15.
Full Atlantic (6000-3800 BC)In Roskilde Fjord the Full Atlantic period is char-acterised by the formation of oyster banks in the
Figure 9. Diagrams from Roskilde Fjord (RF6). The relative abundance of period 4 elements shows the change of the marine environment. In calculating the relative abundance (REL) the top two samples are excluded from the mean (due to modern industrial impact). The general pattern reflects the salinity (like the Mg/Ca ratio of figure 8.), indicating the rise in salinity in the Early Atlantic and the “catastrophe” at the Subboreal/Subatlantic transition. However we also observe a distinct change at the Full Atlantic/Subboreal transition. In the Subboreal, the elements with the highest atomic number are most abundant whereas the opposite is the case in the Full Atlantic. We see the boundaries even more distinctly if the relative abundance (REL) is divided with the White Ignition Loss – WIL.

14
Schrøder el al.: 10,000 years of climate change and human impact on the environment.......
Figure 10. Pollendiagram Kornerup Sø. The Blytt-Sernander climatic zones have been established with the traditional pollen indicators as the distinct elm-fall at the Full Atlantic/ Subboreal transition, and the rise of beech at the Subboreal/Subatlantic transition. In dating the zones, we follow the investigations in Store Bælt (Christensen et al.1997).
narrows of the fjord. 14C datings of oysters range from 5700 BC for the lowermost and oldest to 3700 BC for oysters from the top of the oyster banks (Bondesen 2002). In the beginning of the Full Atlantic, the sea reached its present level and by the end of the period it was three meters above the present sea level.In this period, the salinity of the fjord must have been above 2.2%, the lowest salinity at which the oyster can breed. Moreover, the summer temperature is critical for the oysters’ ability to breed, thus it must have been warmer than today (Spärck 1936).The high salinity is also indicated by the Mg/Ca ratio in the gyttja of RF6 (see figure 8).
The high productivity of the oyster in the narrows of the fjord (thickness of oyster banks often more than 10 meters) also indicates the presence of tides in the Atlantic times.On the sandy Island of Anholt, in the middle of Kattegat, coastlines from all of the Holocene can be studied, making it possible to reconstruct the dominant wind direction during the Holocene (see figure 24), and it seems also possible to find evi-dence of tides in Kattegat during the Full Atlantic Period (Schrøder 1990). The strand lines from the Full Atlantic are characterised by a high abundance of iron concretions (local name: “dværgkrukker” = gnome pots). Today there are no tides on Anholt,
15
The Journal of Transdisciplinary Environmental Studies (TES)
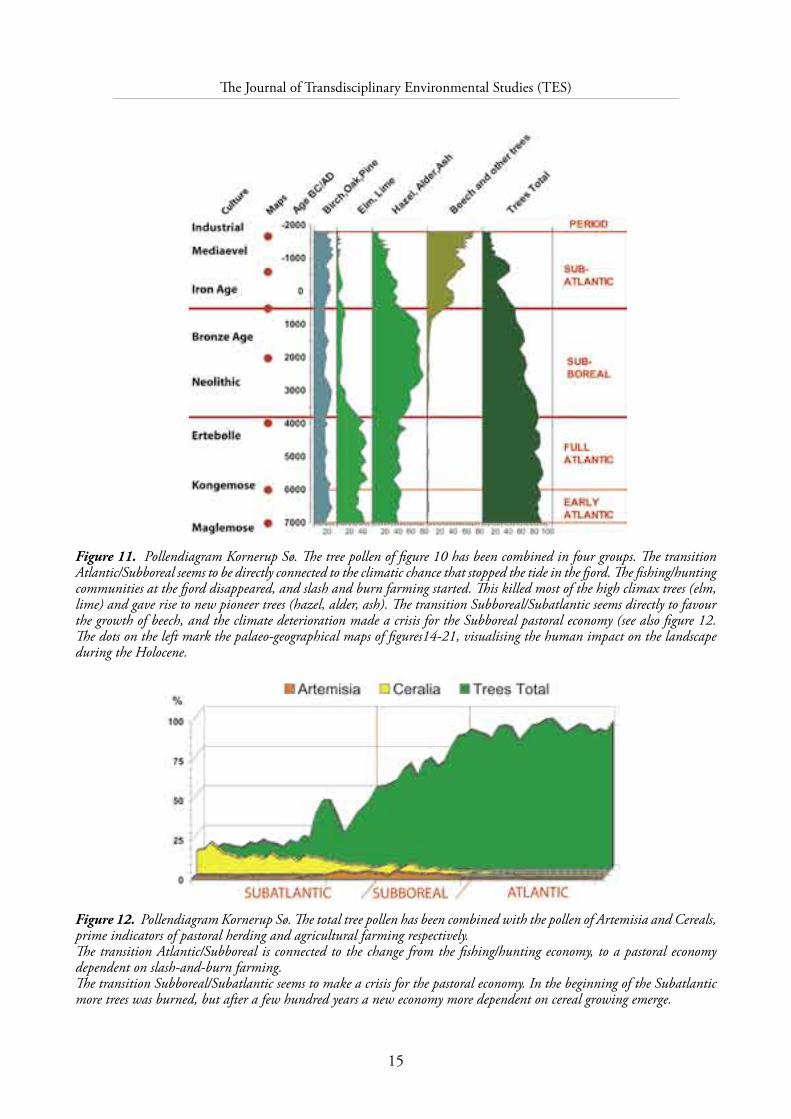
Figure 11. Pollendiagram Kornerup Sø. The tree pollen of figure 10 has been combined in four groups. The transition Atlantic/Subboreal seems to be directly connected to the climatic chance that stopped the tide in the fjord. The fishing/hunting communities at the fjord disappeared, and slash and burn farming started. This killed most of the high climax trees (elm, lime) and gave rise to new pioneer trees (hazel, alder, ash). The transition Subboreal/Subatlantic seems directly to favour the growth of beech, and the climate deterioration made a crisis for the Subboreal pastoral economy (see also figure 12. The dots on the left mark the palaeo-geographical maps of figures14-21, visualising the human impact on the landscape during the Holocene.
Figure 12. Pollendiagram Kornerup Sø. The total tree pollen has been combined with the pollen of Artemisia and Cereals, prime indicators of pastoral herding and agricultural farming respectively. The transition Atlantic/Subboreal is connected to the change from the fishing/hunting economy, to a pastoral economy dependent on slash-and-burn farming.The transition Subboreal/Subatlantic seems to make a crisis for the pastoral economy. In the beginning of the Subatlantic more trees was burned, but after a few hundred years a new economy more dependent on cereal growing emerge.
16
Schrøder el al.: 10,000 years of climate change and human impact on the environment.......
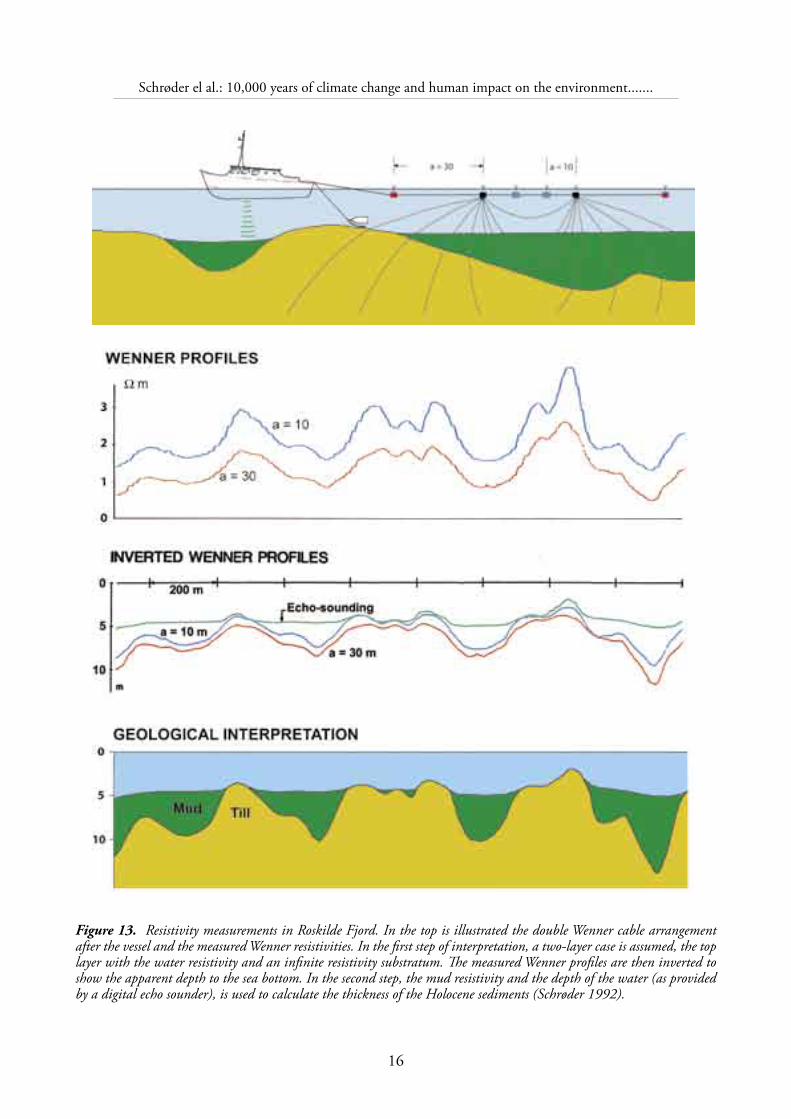
Figure 13. Resistivity measurements in Roskilde Fjord. In the top is illustrated the double Wenner cable arrangement after the vessel and the measured Wenner resistivities. In the first step of interpretation, a two-layer case is assumed, the top layer with the water resistivity and an infinite resistivity substratum. The measured Wenner profiles are then inverted to show the apparent depth to the sea bottom. In the second step, the mud resistivity and the depth of the water (as provided by a digital echo sounder), is used to calculate the thickness of the Holocene sediments (Schrøder 1992).
17
The Journal of Transdisciplinary Environmental Studies (TES)
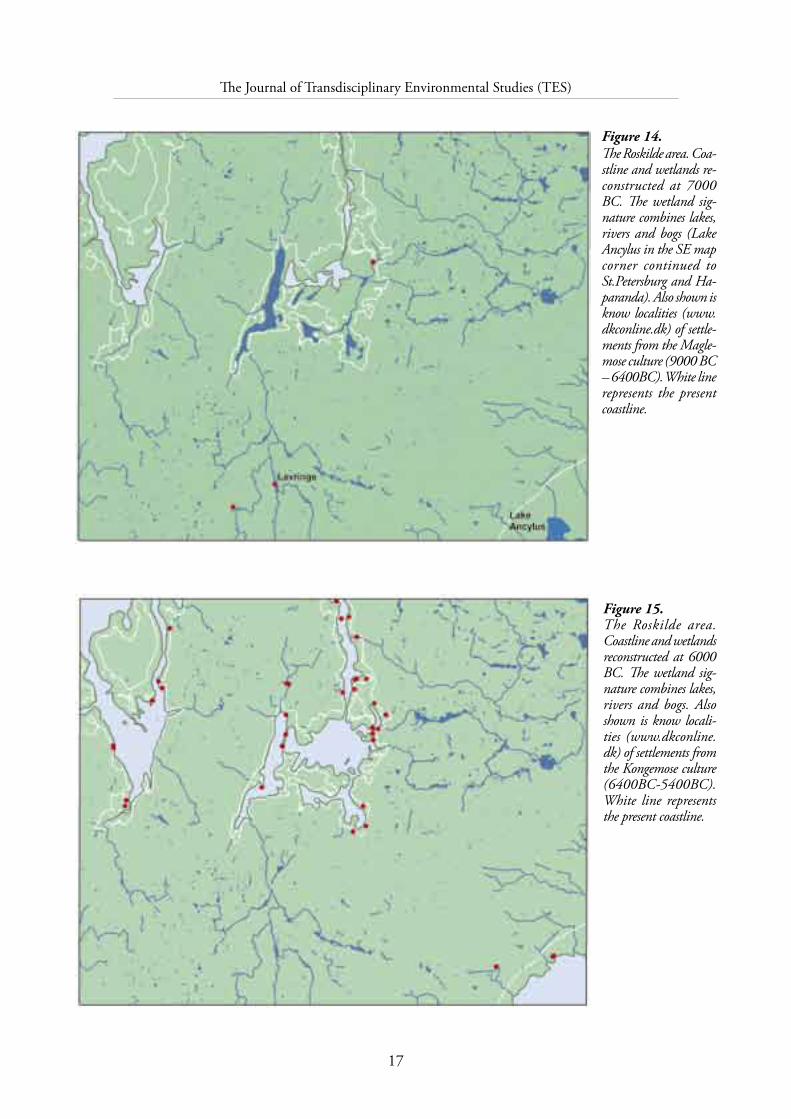
Figure 14. The Roskilde area. Coa-stline and wetlands re-constructed at 7000 BC. The wetland sig-nature combines lakes, rivers and bogs (Lake Ancylus in the SE map corner continued to St.Petersburg and Ha-paranda). Also shown is know localities (www.dkconline.dk) of settle-ments from the Magle-mose culture (9000 BC – 6400BC). White line represents the present coastline.
Figure 15. The Roskilde area. Coastline and wetlands reconstructed at 6000 BC. The wetland sig-nature combines lakes, rivers and bogs. Also shown is know locali-ties (www.dkconline.dk) of settlements from the Kongemose culture (6400BC-5400BC). White line represents the present coastline.
18
Schrøder el al.: 10,000 years of climate change and human impact on the environment.......
and the groundwater leaves the island in a narrow zone at the coast (Schrøder et al. 1976). In Cape Cod (Mass. USA) with a similar geology, but with tides, hydrogeological investigations (Urish et al.1990, 2001) have shown that the outflow zone is much thicker and that the tides also give rise to oxidation of the groundwater, and subsequent precipitation of iron in the coastal sand and gravel.Excavations of coastal settlements at Store Bælt and Øresund (Christensen 2001) show however that the amplitude of the tides could not have been more than one meter.
On the basis of numerous palaeo-botanical stud-ies, Iversen (1973) has constructed average July temperatures for Holocene in Denmark (see figure 24), this shows a summer temperature more than
two degrees higher than present for the Full Atlantic (mainly from the occurrence in Denmark of plants as the water chestnut (Trapa natans), higher tem-peratures are also indicated by skeleton finds of the Dalmatian pelican, a bird that nowadays lives only in SE Europe).
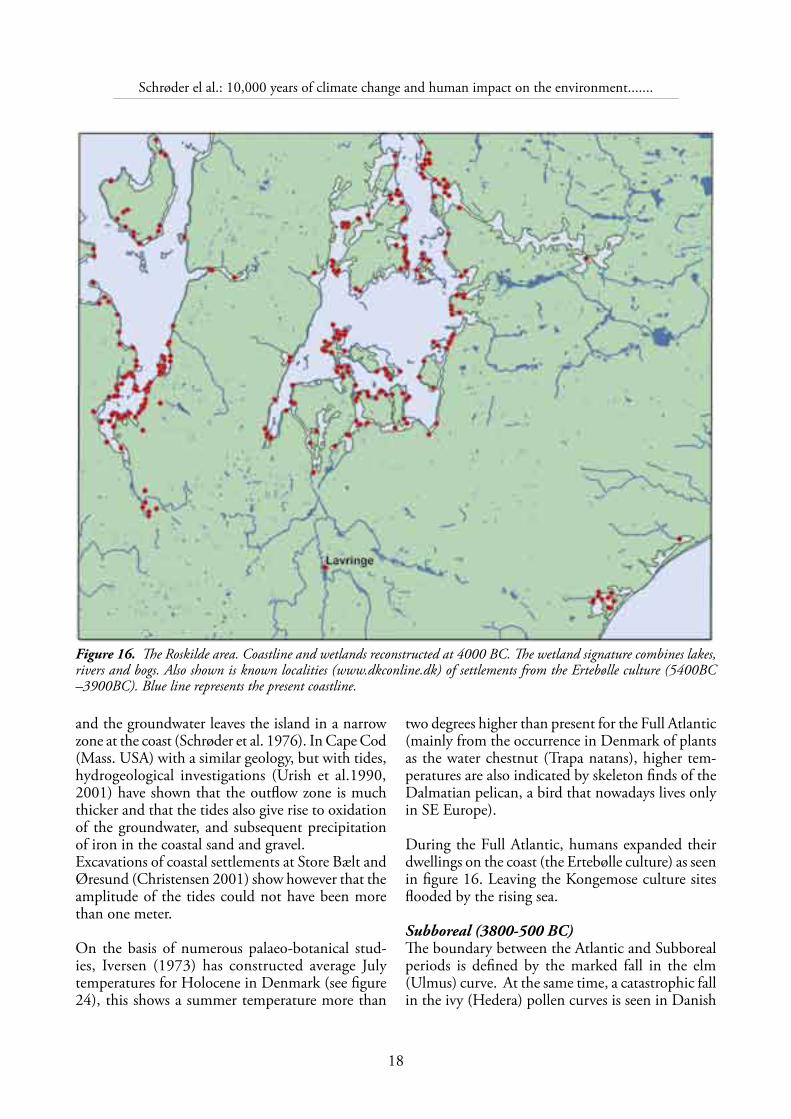
During the Full Atlantic, humans expanded their dwellings on the coast (the Ertebølle culture) as seen in figure 16. Leaving the Kongemose culture sites flooded by the rising sea.
Subboreal (3800-500 BC)The boundary between the Atlantic and Subboreal periods is defined by the marked fall in the elm (Ulmus) curve. At the same time, a catastrophic fall in the ivy (Hedera) pollen curves is seen in Danish
Figure 16. The Roskilde area. Coastline and wetlands reconstructed at 4000 BC. The wetland signature combines lakes, rivers and bogs. Also shown is known localities (www.dkconline.dk) of settlements from the Ertebølle culture (5400BC –3900BC). Blue line represents the present coastline.
19
The Journal of Transdisciplinary Environmental Studies (TES)
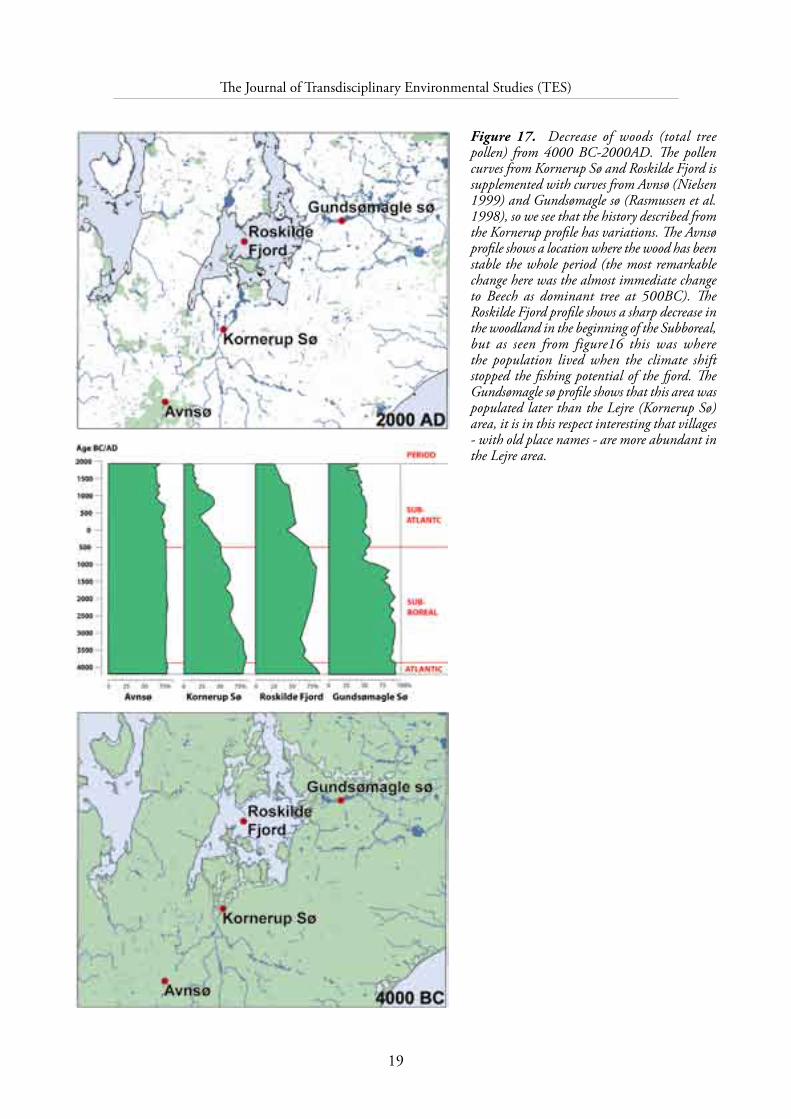
Figure 17. Decrease of woods (total tree pollen) from 4000 BC-2000AD. The pollen curves from Kornerup Sø and Roskilde Fjord is supplemented with curves from Avnsø (Nielsen 1999) and Gundsømagle sø (Rasmussen et al. 1998), so we see that the history described from the Kornerup profile has variations. The Avnsø profile shows a location where the wood has been stable the whole period (the most remarkable change here was the almost immediate change to Beech as dominant tree at 500BC). The Roskilde Fjord profile shows a sharp decrease in the woodland in the beginning of the Subboreal, but as seen from figure16 this was where the population lived when the climate shift stopped the fishing potential of the fjord. The Gundsømagle sø profile shows that this area was populated later than the Lejre (Kornerup Sø) area, it is in this respect interesting that villages - with old place names - are more abundant in the Lejre area.
20
Schrøder el al.: 10,000 years of climate change and human impact on the environment.......
21
The Journal of Transdisciplinary Environmental Studies (TES)
0
20
40
60
80
100
120
140
160
180
0 100 200 300 400 500 600 700 800
arable land (td.land)
tax
(td. h
artk
orn)
old -by, -sø -rup +
Særlø
se
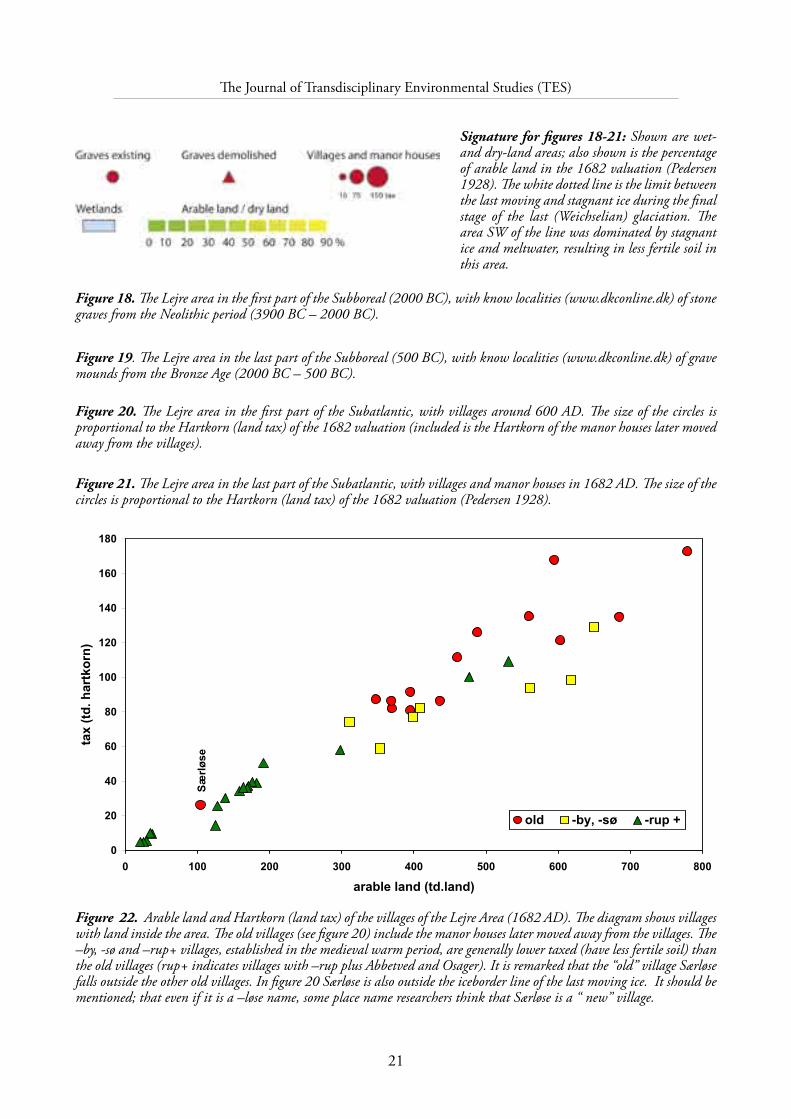
Figure 22. Arable land and Hartkorn (land tax) of the villages of the Lejre Area (1682 AD). The diagram shows villages with land inside the area. The old villages (see figure 20) include the manor houses later moved away from the villages. The –by, -sø and –rup+ villages, established in the medieval warm period, are generally lower taxed (have less fertile soil) than the old villages (rup+ indicates villages with –rup plus Abbetved and Osager). It is remarked that the “old” village Særløse falls outside the other old villages. In figure 20 Særløse is also outside the iceborder line of the last moving ice. It should be mentioned; that even if it is a –løse name, some place name researchers think that Særløse is a “ new” village.
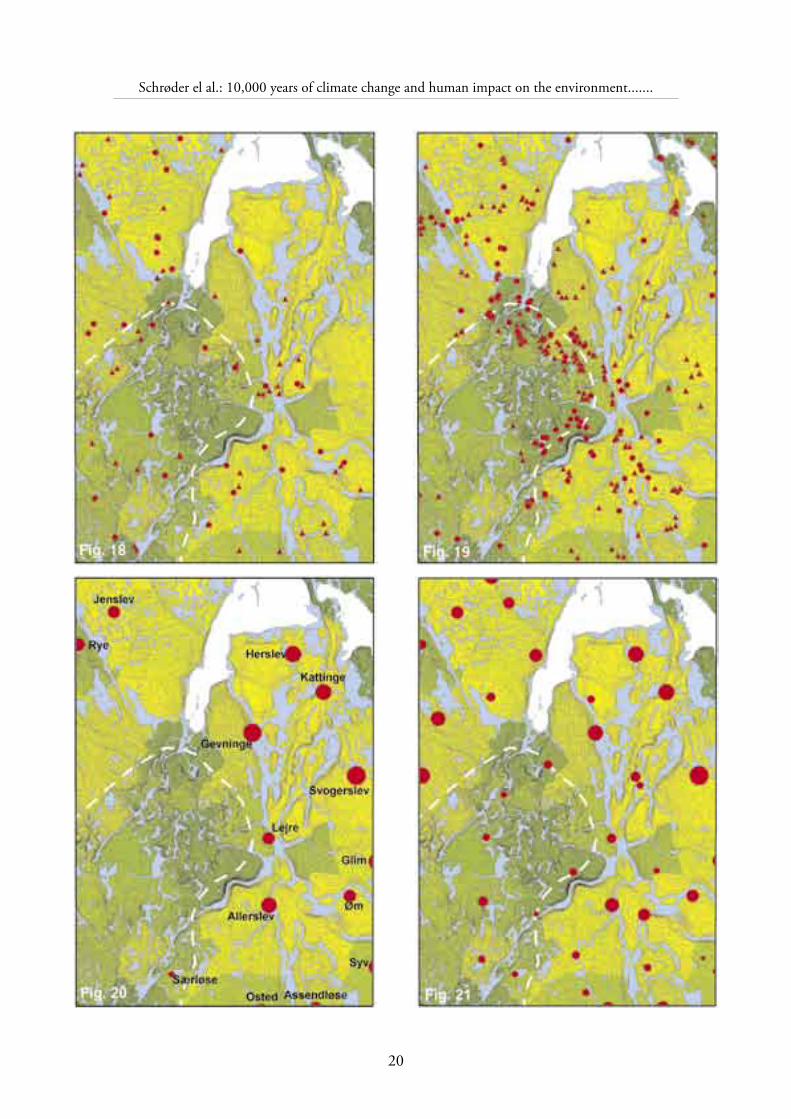
Figure 21. The Lejre area in the last part of the Subatlantic, with villages and manor houses in 1682 AD. The size of the circles is proportional to the Hartkorn (land tax) of the 1682 valuation (Pedersen 1928).
Figure 20. The Lejre area in the first part of the Subatlantic, with villages around 600 AD. The size of the circles is proportional to the Hartkorn (land tax) of the 1682 valuation (included is the Hartkorn of the manor houses later moved away from the villages).
Signature for figures 18-21: Shown are wet- and dry-land areas; also shown is the percentage of arable land in the 1682 valuation (Pedersen 1928). The white dotted line is the limit between the last moving and stagnant ice during the final stage of the last (Weichselian) glaciation. The area SW of the line was dominated by stagnant ice and meltwater, resulting in less fertile soil in this area.
Figure 19. The Lejre area in the last part of the Subboreal (500 BC), with know localities (www.dkconline.dk) of grave mounds from the Bronze Age (2000 BC – 500 BC).
Figure 18. The Lejre area in the first part of the Subboreal (2000 BC), with know localities (www.dkconline.dk) of stone graves from the Neolithic period (3900 BC – 2000 BC).
22
Schrøder el al.: 10,000 years of climate change and human impact on the environment.......
pollen diagrams. This fall is especially striking in coastal areas. It seems that the fjords in Subboreal times (due to lack of tides?) started to freeze in the winters, thereby reversing the climatic effect of the sea (Iversen 1973). However, the Subboreal was still part of the Holocene warm period. Mistletoe was still widespread and the existence of pollen from the grape vine has been demonstrated (Iversen 1973). As the tide disappears we should have expected a fall in the salinity, but high salinity is still indicated by the Mg/Ca ratio the gyttja of RF6 (see figure 8). This can be explained by a fall in rainfall or higher evaporation. As the July temperature (figure 25) fell in the Subboreal, a significant fall in rainfall must be the only explanation. The records shown in figures 8 b, 9 and 24, also indicate low sedimentation rate for the Subboreal, and the shift from oxidising to reducing environ-ment at the fjord bottom. Fishing must have decreased significantly as a result of the changing fjord environment, and herding of cattle started to be the main occupation. This meant the introduction of slash and burn farming. The wooded area needed to be decreased to give room for grazing, and in the newly burned forest grounds were excellent for sown cereals. The effect on the vegetation is clearly seen in the diagrams figures 11-12. The Total Tree index declines and the former dominant lime and elm become scarce, and on the burned areas pioneer trees hazel, alder and ash gain ground.Through the Subboreal, the clearance of the woods continues and as seen from the maps in figures 18-19, it seems that as the expansion continues, more sandy (less fertile) areas are used. The graves from the Neolithic period tend to be located in the areas with the most fertile soils (highest Hartkorn in the land valuation of 1682 AD), whereas the Bronze Age graves are also abundant in the less fertile areas.
Subatlantic (500 BC - 2000 AD)The Subatlantic is characterised by high rainfall (as is the case to-day), the Mg/Ca ratio (figure 8) and the Pediastrum/Botryococcus signal in figure 7, clearly re-flects that rainfall now is much higher than the evapo-ration (Roskilde Amt has the last 10 years measured the salinity of the fjord and found a strong correlation with net rainfall (S. Hedal pers. comm.)).The higher rainfall also resulted in higher ground-water-levels, and gave rise to a spreading of mires
and bogs. The Subatlantic climate also provided special conditions for beech, which quickly became the dominant tree in the woods as seen the Avnsø pollen diagram (Nielsen 1999). In the colder and rainier Subatlantic times, the output of herding must have fallen. As a response to this crisis we observe (figure 11) an increase in the rate of deforestation in the period 500BC-300AD. From 300AD-600AD (the time of the Beowulf legend) the total trees percentages returns to the level from 500BC. At the same time, the settlements (villages) becomes permanent, now localised close to springs or shallow groundwater, and close to wetland areas where (nu-trient rich) runoff could be transformed to (winter) hay for the cattle (figure 20). The building of stables also made possible the distribution of manure to the fields and thereby an extension of cereal growth (figure 12). The change from pastoral to agricultural farming economy may have been followed by a new religion. In Anchersen´s (1745) interpretation of Taticus, he suggests that the Lejre population used the spring distribution of manure in the praising of the goddess Hertha = Nertus/Gaia.In the Medieval warm period (900-1200AD), the number of settlements increased (new villages and manor houses), and again the less valued land is also inhabited (figure 21-22).
Discussion of the climatic changesIt has been widely discussed whether the transitions of the Blytt-Sernander periods have been just four of many cyclic climatic variations in the Holocene, or if they represent “catastrophic” changes in the climate. However, this investigation shows that the period transitions (as defined by the pollen zones) are closely correlated with climatic indicators (sum-marised in figure 24).In the Lejre area, the Boreal/Early Atlantic transition seems rather catastrophic, at 7000BC the aquatic en-vironment changes from limnic to marine. However, this is surely due to the general rise of the sea level in the period, and hence this “catastrophe” must have been time trangressive over the NW European coastal areas. In the period 7000-6000 BC, the rise of the sea level in the region was very rapid (as seen in figure 23), and as the sea conquered the fresh water Ancylus Lake, the climate gradually changed from continental to coastal. It is therefore reasonable to interpret the transitions Boreal/Early Atlantic and

23
The Journal of Transdisciplinary Environmental Studies (TES)
Figure 23. The general coastline of NW Europe 7000 BC and 6000 BC (interpreted from various drill holes and sea level curves (Mörner 1969, Denys &Bateman 1995, Jelgersma 1979, Behre et al. 1979). It is obvious that this rapid increase of the sea in the area, and the change from fresh to salt water in the Baltic must have a profound influence on the climate of the Lejre area.
Figure 24. Diagrams from Roskilde Fjord (RF6) summarising that the period transitions (as defined by the main pollen indicators) are closely correlated with transitions in other indicators of climatic change. The Boreal/Early Atlantic transition seems rather catastrophic, at 7000BC the aquatic environment changes from limnic to marine. In the period 7000-6000 BC, the rise of the sea level in the region was very rapid (as seen in figure 23), and as the sea conquered the area the sedimentation rate (measured in ignition residue) was very high. Low sedimentation rate for the Subboreal, and the shift from oxidising to reducing environment at the fjord bottom, indicated by the Fe and Mn contents, shows the disappearance of the Atlantic tide; whereas the Mg/Ca ratio and Pediastrum shows the increase in rainfall in the Subatlantic.
24
Schrøder el al.: 10,000 years of climate change and human impact on the environment.......
Early Atlantic/Full Atlantic as local climatic bounda-ries in a general trend of rising temperatures.
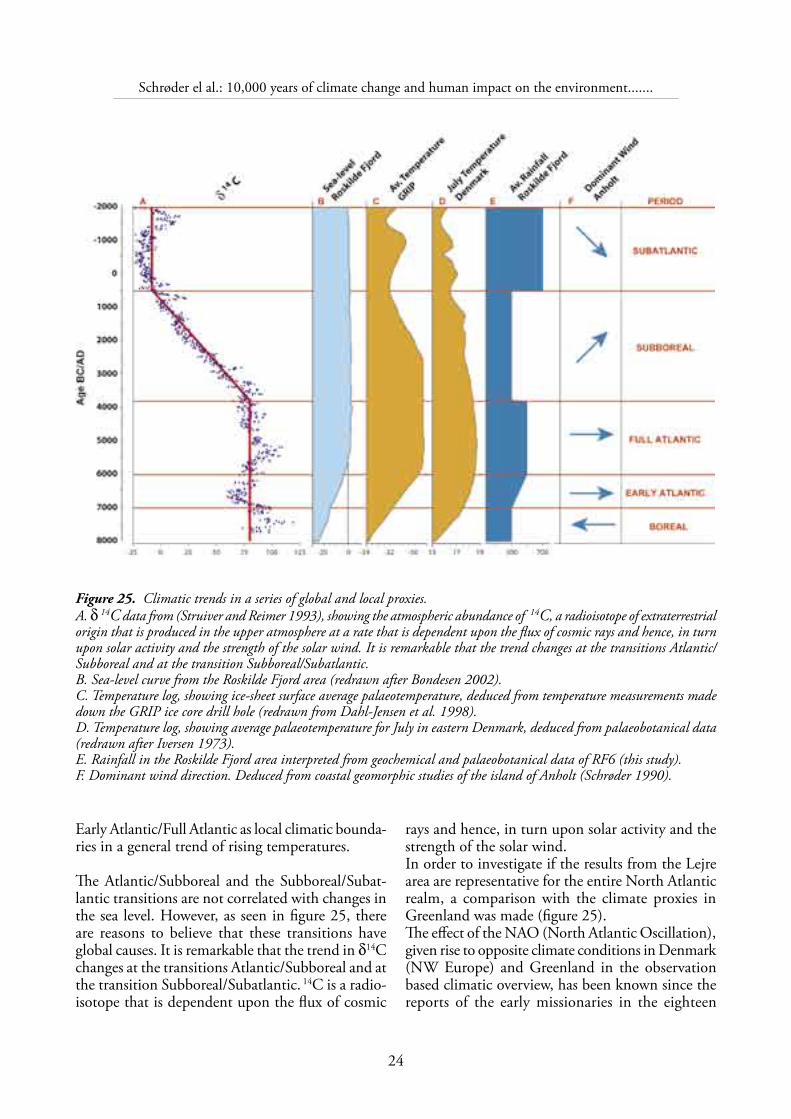
The Atlantic/Subboreal and the Subboreal/Subat-lantic transitions are not correlated with changes in the sea level. However, as seen in figure 25, there are reasons to believe that these transitions have global causes. It is remarkable that the trend in δ14C changes at the transitions Atlantic/Subboreal and at the transition Subboreal/Subatlantic. 14C is a radio-isotope that is dependent upon the flux of cosmic
Figure 25. Climatic trends in a series of global and local proxies. A. δ 14C data from (Struiver and Reimer 1993), showing the atmospheric abundance of 14C, a radioisotope of extraterrestrial origin that is produced in the upper atmosphere at a rate that is dependent upon the flux of cosmic rays and hence, in turn upon solar activity and the strength of the solar wind. It is remarkable that the trend changes at the transitions Atlantic/Subboreal and at the transition Subboreal/Subatlantic.B. Sea-level curve from the Roskilde Fjord area (redrawn after Bondesen 2002).C. Temperature log, showing ice-sheet surface average palaeotemperature, deduced from temperature measurements made down the GRIP ice core drill hole (redrawn from Dahl-Jensen et al. 1998).D. Temperature log, showing average palaeotemperature for July in eastern Denmark, deduced from palaeobotanical data (redrawn after Iversen 1973).E. Rainfall in the Roskilde Fjord area interpreted from geochemical and palaeobotanical data of RF6 (this study).F. Dominant wind direction. Deduced from coastal geomorphic studies of the island of Anholt (Schrøder 1990).
rays and hence, in turn upon solar activity and the strength of the solar wind. In order to investigate if the results from the Lejre area are representative for the entire North Atlantic realm, a comparison with the climate proxies in Greenland was made (figure 25).The effect of the NAO (North Atlantic Oscillation), given rise to opposite climate conditions in Denmark (NW Europe) and Greenland in the observation based climatic overview, has been known since the reports of the early missionaries in the eighteen

25
The Journal of Transdisciplinary Environmental Studies (TES)
century (Saabye 1942). However, temperature measurements in the GRIP drill hole (Dahl-Jensen et al. 1998), show that mayor climatic shifts in the last millennium (the medieval warm period and the little ice age) are synchronous in Greenland and NW Europe.
The δ18O records from the Greenland Ice Sheet represent, without doubt, important information on the temperature in the atmosphere over Greenland, when the snow was formed (Dansgaard 1964). When the GRIP drilling and the adjacent GISP2 drilling presented their isotopic records (Grootes et al 1993), it was clear that the records were similar for Holocene and Weichsel. Both records were stable for the last 10,000 years. Later analyses of the drill hole temperature (Dahl-Jensen et al 1998) showed, however, significant temperature differences at the ice surface during the Holocene (see figure 25). The lack of a clear climate optimum in the isotope record could be explained, as suggested by Hammer (2002), as an effect of an increased winter snowfall in the climatic optimum (a likely consequence of the warming).
Also pollen studies in “Johannes Iversen Sø” and 14 other lakes in West Greenland (Fredskild 1984) showed similar patterns. Fredskild concluded that in Boreal and Atlantic times increasing temperatures and a gradual penetration of warm moist air passing Labrador was reaching all of West Greenland. At the end of Subboreal times, the southward movement of the polar front caused winds from the Canadian taiga and tundra to reach West Greenland.
ConclusionThis study of the Lejre area has confirmed that cli-mate change can be observed not only in the changes in pollen assemblages, but even more distinct in the chemical indicators of the sediments.The presented data also confirms that climate change has been the main factor behind the change in the use of the resource base in the area: 1. The change from the Maglemose hunter and
food-gather culture to the Kongemose/Ertebølle culture specialising in coastal fishing and hunting is directly correlated to the rise of sea level and the change from continental to coastal climate.
2. The change from the Kongemose/Ertebølle cul-ture to the Neolithic/Bronze Age pastoral herding
culture is directly correlated to the disappearance of tide (and fishing potential). Which again can be correlated to a change to a drier climate.
3. The change from the Neolithic/Bronze Age pastoral herding culture to the Iron Age culture where cultivation of crops gains in impor-tance may not be directly correlated. But the economic crises following the Subboreal/Sub-atlantic climatic transition have most prob-ably induced the new agricultural practice.
Many archaeologists describe this kind of argument as natural determinism, which often has a poor repu-tation. However, in the Lejre area there are now so many hard facts, which support the “catastrophic” transitions of the Blytt-Sernander periods and the determinism arguments that even Martin A. Hansen poetic descriptions could be defended.
It can also be concluded that the Blytt-Sernander model fits very well with the climatic proxies from the Lejre area, and that climatic history of the Lejre area and that of Greenland is closely correlated - with strong ties to global causes of climate change.
AcknowledgementsIn this work L. Højlund Pedersen carried out the pollen analysis, R. Juel Bitsch took care of drafting and GIS work, whereas the first author is responsible for the compilation and interpretation of data. We are however grateful for advice and stimulating dis-cussions with Bent Aaby, Erling Bondesen, Charlie Christensen, Andrew Crabtree, Peder Dam, Lykke Enøe, Bent Fredskild, Leif Færregaard, Søren Hedal, Bent Odgaard, Henrik Schultz and Henrik Suadi-cani. Also we have had many stimulating discussions and co-operations on the general development of the climate in the Baltic with geologists from the Department of Regional Geoecology & Marine Geology of the All-Russian Geological Institute (VSEGEI). A co-operation made possible by the Nordic Grant Scheme for Network Co-operation with the Baltic Countries and Northwest Russia.

26
Schrøder el al.: 10,000 years of climate change and human impact on the environment.......
ReferencesAnchersen, H.P. (1745): Herthedal og det gamle Dannemark.
Det Kongelige Danske Lærde Scocietæt i Kiøbenhavn.
Behre, K-E, Menke, B & Streif, H. (1979): The Quaternary geological development of the German part of the North Sea. In: Oele E., Schüttenheim, RTE & Wiggers AJ (eds.): The Quaternary History of the North Sea. Acta Universitatis Upsaliuensis.
Blytt A. (1876): Essay on the immigration of the Norwegian flora.
Bondesen E. (1988): Havbundsundersøgelser - Råstoffer og Fredningsinteresser. Roskilde Fjord. Skov- og Natursty-relsen, Miljøministeriet Okt. 1988. 220 p.
Bondesen E. (1998): Nature and Natural Science – Planning and Planning Science
Bondesen E. (2002): Roskilde Fjord. In Crumlin-Petersen O, Olsen O,(eds) The Skuldelev Ships I. Roskilde 2002.
Bondesen E. og Schrøder N. (1979): Roskilde Fjord - Ge-ofysiske og geologiske undersøgelser 1979. Inst. f. Miljø, Teknologi og Samfund, Roskilde Universitetscenter, Dec. 1979, 64 p.
Brønsted J. (1940): Danmarks Oldtid . København.
Brønsted J. (1977): Danmarks Oldtid. Bind 1 af Danstrup og Hal Koch (Red.) Danmarks Historie. 3.udg. Politikens Forlag. København.
Christensen C (2001): Kystbosættelse og havniveauændringer i stenalderen. In Jensen O L, Sørensen S A & Hansen K M: Danmarks Jægerstenalder – Status og Perspektiver. Hørsholm Egns Museum.
Christensen C., Fisher A, Rørbeck Mathiassen D, (1997): Den store havstigning i Storebælt. In Pedersen L, Fisher A, Aaby B.: Sorebælt i 10,000 år. A/S Storebæltsforbindelsen.
Enøe L.(2003): Geochemical analysis of RF.6 Roskilde Fjord. Internal report. Dept of environment, technology and social studies. RUC.
Dahl-Jensen D, Mosegaard N, Gundestrup N, Clow GD, Johnsen SJ, Hansen AV, Balling N (1998): Past Tempera-tures Directly from the Greenlandian Ice Sheet. Science 282:268-271.
Dam P (2004): Landbrugsproduktivitet og arealanvendelse I 1600- og 1700-tallet. Geoforum Perpektiv , jan. 2004.
Dansgaard W (1964): Stable isotopes in precipitation. Tellus 16:436-468
Dau H. (1829): Allerunterthänigster Bericht…über die Torf-moore Seeland. (Kbh. og Leipzig).
Denys, L. & Baeteman, C.(1995): Holocene evolution of relative sea-level and local mean tide in Belgium. Marine Geology 124:1-19.
Diamond J (1998): Gun, germs and steel : a short history of everybody for the last 13.000 years. Vintage.
Forchhammer, Steenstrup og Worsaae (1852-56): Lejre-komiteens undersøgelser i geologisk-antiqvarisk retning. Videnskabernes Selskab.
Fredskild B (1984): Holocene palaeo-winds and climatic changes in West Greenland as indicated by long-distance transported and local pollen in lake sediments. In Mörner N-A, Karlén W (eds.), Climatic Changes on a yearly to Mil-lenial Basis. pp 163-171. D. Reidel Publishing Company.
Grootes PM, Stuiver M, White JWC, Johnsen S, Jouzel J (1993): Comparison of oxygen isotope records from the GISP2 and GRIP Greenland ice-cores. Nature 366:552-554.
Hammer C.U (2002): Holocene Climate and Past Volcanism: Greenland- Northern Europe. In Wefer G, Berger W, Behre K-E, Jansen E (eds.) 2002, Climate Development and His-tory of the North Atlantic Realm. Springer – Verlag. Berlin Heidelberg pp 149-163
Hansen M.A. (1952): Orm og Tyr. Wivels Forlag
Højlund Pedersen L.(2003): Pollen analyses of (RF6) Roskilde Fjord and Kornerup Sø. Internal report. Dept of environ-ment, technology and social studies. RUC.
Iversen, J. (1973): The Development of Denmark’s Nature since the Last Glacial. Geological Survey of Denmark V. Series No. 7-C.
Jelgesema, S. (1979): Sea level changes in the North Sea Basin. In: Oele E., Schüttenheim, RTE & Wiggers AJ (eds.): The Quaternary History of the North Sea. Acta Universitatis Upsaliensis.
Jessen K. (1937): Some west Baltic pollen diagrams. Quartär,1, 129-139.
Jensen, J. (2003): Danmarks Oldtid. Ældre Jernalder. Gyldendal.
Jørgensen, B. (1996). Stednavne ordbog. Gyldendal.
Jørgensen S. (1963): Early Postglacial in Aamosen. Geological Survey of Denmark II. Series No.87.
27
The Journal of Transdisciplinary Environmental Studies (TES)
Magnerud, J., Birks, H.J.B. and Jager, K.D. (eds) (1982): Cronostratigraphic subdivision of the Holocene, Striae, 16.
Mörner N-A (1969): The Late Quaternary history of the Kat-tegat Sea and the Swedish west coast. Sveriges Geologiska Undersökning. C 640.
Nielsen A B (1999): Vegetationshistorien i området omkring Avnsø… Botanisk Institut, Københavns Universitet.
Pedersen H.(1928): De Danske Landbrug. Fremstillet paa Grundlag af Forarbejderne til Christian V.s Matrikel. Gyldendalske Boghandel. København.
Rasmussen P, Hansen H J, Nielsen L B (1998): Kulturlandska-bets udvikling i et langtidsperspektiv. In Nationalmuseets arbejdsmark 1998.
Rørdam K(1900): Kortbladene København Roskilde, Dan-marks geol. Undersøgelse I. Rk. Nr. 7, 1900
Saabye H.E.(1942): Brudstykker af en Dagbog holden i Grønland i aarene 1770-1778. Meddelelser om Grønland 1942-1946., bd. 129.
Schrøder N et al. (1989): Geologisk-geofysisk kortlægning af Lejreområdet. Institut for miljø, teknologi og samfund.
Schrøder N. (1990): Brudstykker af Anholts naturhistorie. . Institut for miljø, teknologi og samfund.
Schrøder N. (1992): Resistivity at Sea. In. R.A.Geyer (edit.), CRC Handbook of Geophysical Exploration at Sea. CRC Press, pp.323-339.
Schrøder, N (1995): Vandplanlægning og vandforvaltning omkring Roskilde. In Perdersen K (red.) Planlægning Mellem genstand, viden og magt. Teksam-forlaget RUC august1995.
Schrøder N. (1997): Geofysiske udsagn om råstoffer, vandmiljø og naturhistorie i Roskilde. I Agger, P. og Land, B (eds.) Råstoferfaringer. Roskilde Universitetsforlag.
Schrøder N and Øbro H (1976): Ground Water Model for the Island of Anholt, Denmark. Nordic Hydrology. 7, p 281-292.
Schrøder N, Bitsch R, Bruun B, Enøe L, and Højlund Pedersen L (1996): Nogle miljøhistorier fra Kornerup Sø. Lethrica 17. april 1996.
Sernander R. (1908): On the evidence of post-glacial changes of climate furnished by the peat mosses of northern Eu-rope. Geologiska Föreningens i Stockholm Förhaldlinger 30: 365-478.
Spärck R (1936): On the relation between metabolism and temperature in some marine lamellibrancha and its zooge-ographical significance. Vid. Selsk. Biol. Medd.13.
Stuiver M, Reimer PJ (1993): Extended 14C database and revised CALIB radiocarbon calibration program. Radio-carbon 35 :215-230.
Sørensen S A (1986): Lavringe mose, en jagtstation og en hyt-tetomt fra ældre stenalder. ROMU (Årsskrift fra Roskilde Museum.
Urish D W, Frohlich R K (1990): Surface electrical resistivity in coastal groundwater exploration. Geoexploration, 26: 267-289.
Urish D W, Gomez A L (2001): The Temporal and Spatial Distribution of Coastal Groundwater Seepage. Monitoring, Modeling and Management. Essaouria, Morocco, April 23-25, 2001.
Worm O. (1642): Danicorum monumentorum libri sex.
Related Documents