THE ENERGY REPORT 100% RENEWABLE ENERGY BY 2050 THIS REPORT HAS BEEN PRODUCED IN COLLABORATION WITH: REPORT INT 2011 OMA AMO

Welcome message from author
This document is posted to help you gain knowledge. Please leave a comment to let me know what you think about it! Share it to your friends and learn new things together.
Transcript
THE ENERGY REPORT100% RENEWABLE ENERGY BY 2050
THIS REPORT HAS BEEN PRODUCED IN COLLABORATION WITH:
REPORT
REPORT
INT
2011
OMAAMO
Front cover photo: © Wild Wonders of Europe / Inaki Relanzon / WWF
WWFWWF is one of the world’s largest and most experienced independent conservation organizations, with over 5 million supporters and a global Network active in more than 100 countries.WWF’s mission is to stop the degradation of the planet’s natural environment and to build a future in which humans live in harmony with nature, by conserving the world’s bio-logical diversity, ensuring that the use of renewable natural resources is sustainable, and promoting the reduction of pollution and wasteful consumption.
ECOFYSEstablished in 1984 with the mission of achieving a sustainable energy supply for everyone, Ecofys has become a leader in energy saving, sustainable energy solutions and climate policies. The unique synergy between our fields of competence is the key to this success. We create smart, effective, practical and sustainable solutions for and with our clients.
OMA The Office for Metropolitan Architecture (OMA) is a leading international partnership practicing contemporary architecture, urbanism, and cultural analysis. The counterpart to OMA’s architectural practice is the company’s research-based think tank, AMO. While OMA remains dedicated to the realization of buildings and master plans, AMO operates in areas beyond the boundaries of architecture and urbanism such as media, politics, sociology, technology, energy, fashion, publishing and graphic design.
WWF InternationalAvenue du Mont-Blanc1196 GlandSwitzerlandwww.panda.org
EcofysP.O. Box 84083503 RK UtrechtThe Netherlandswww.ecofys.com
OMAHeer Bokelweg 1493032 AD RotterdamThe Netherlandswww.oma.eu
ISBN 978-2-940443-26-0
This report was made possible by the generous support of ENECO.
3WWF The Energy Report Page
CONTRIBUTORSEditor in Chief: Stephan SingerTechnical Editor: Jean-Philippe DenruyterPrincipal Writer Part 1: Barney Jeffries
Editorial Team Part 1: Owen Gibbons, Ellen Hendrix, Martin Hiller, Richard McLellan, Donald Pols
With special thanks for review and contributions from:Keith Allott, Jason Anderson, Bryn Baker, Jessica Battle, Esther Blom, Kellie Caught, Kirsty Clough, Keya Chatterjee, Thomas Duveau, Wendy Elliott, Magnus Emfel, Lynn Englum, Mariangiola Fabbri, Ian Gray, Bart Geneen, Inna Gritsevich, Johan van de Gronden, May Guerraoui, Piers Hart, Joerg Hartmann, Stefan Henningson, Patrick Hofstetter, Richard Holland, Yanli Hou, Nora Ibrahim, Andrea Kaszewski, Sampsa Kiianmaa, Alexey Kokorin, Li Lifeng, Pete Lockley, Paul Maassen, Yosuke Masako, David McLaughlin, László Máthé, Elisabeth McLellan, Martin von Mirbach, Kevin Ogorzalek, Stuart Orr, Mireille Perrin, Duncan Pollard, Voahirana Randriambola, Georg Rast, Peter Roberntz, Rafael Senga, Shirish Sinha, Gerald Steindlegger, Rod Taylor, Ivan Valencia, Arianna Vitali, Heikki Willstedt, Mattias de Woul, Richard Worthington, Naoyuki Yamagishi
Partner organizationsEcofys (Part 2)Principal Writers: Yvonne Deng, Stijn Cornelissen, Sebastian KlausPrincipal Reviewers: Kees van der Leun, Bart Wesselink, Kornelis Blok(See complete list of contributing authors, reviewers and advising experts on page 91 Part 2.)
The OMA-AMO team was led by Partner Reinier de Graaf and Associate Laura BairdTeam: Tanner Merkeley, Federico D’Amico Vilhelm Christensen, Amelia McPhee, Tim Cheung, Dicle Uzunyayla
100% RENEW-ABLE ENERGY
4WWF The Energy Report Page
100% RENEW-ABLE ENERGY
CONTENTS10 Recommendations for a 100% Renewable Energy Future 8
PART 1 Introduction 11A renewable energy future: why we need it 13Energy facts we have to face 13100% possible 23The Ecofys scenario in a nutshell 24The energy mix 29The challenges ahead 43• Energy conservation 44• Electrification 51• Equity 56• Land and sea use 60• Lifestyle 66• Finance 72• Innovation 78• The future is in your hands 84
PART 2 The Ecofys energy scenario 87Executive summary 92Introduction 103Approach 107Demand 115Supply – Renewable energy (excl. bioenergy) 139Supply – Sustainable bioenergy 157Investments and savings 192Policy considerations 217Conclusions 229
APPENDICES 231
REFERENCES 242
GLOSSARY 252
5WWF The Energy Report Page
© Fritz P
ölking / WW
F

Map 1: A new perspective on the world - looking towards 2050. Global GIS Database: Complete GlobaL Set, 2002 © AMO
6WWF The Energy Report Page
“By 2050, we could get all the energy we need from renewable sources. This report shows that such a transition is not only possible but also cost-effective, providing energy that is affordable for all and producing it in ways that can be sustained by the global economy and the planet. The transition will present significant challenges, but I hope this report will inspire governments and business to come to grips with those challenges and, at the same time, to move boldly to bring the renewable economy into reality. There is nothing more important to our ability to create a sustainable future.”James P. LeapeDirector General WWF International
7WWF The Energy Report Page
8WWF The Energy Report Page
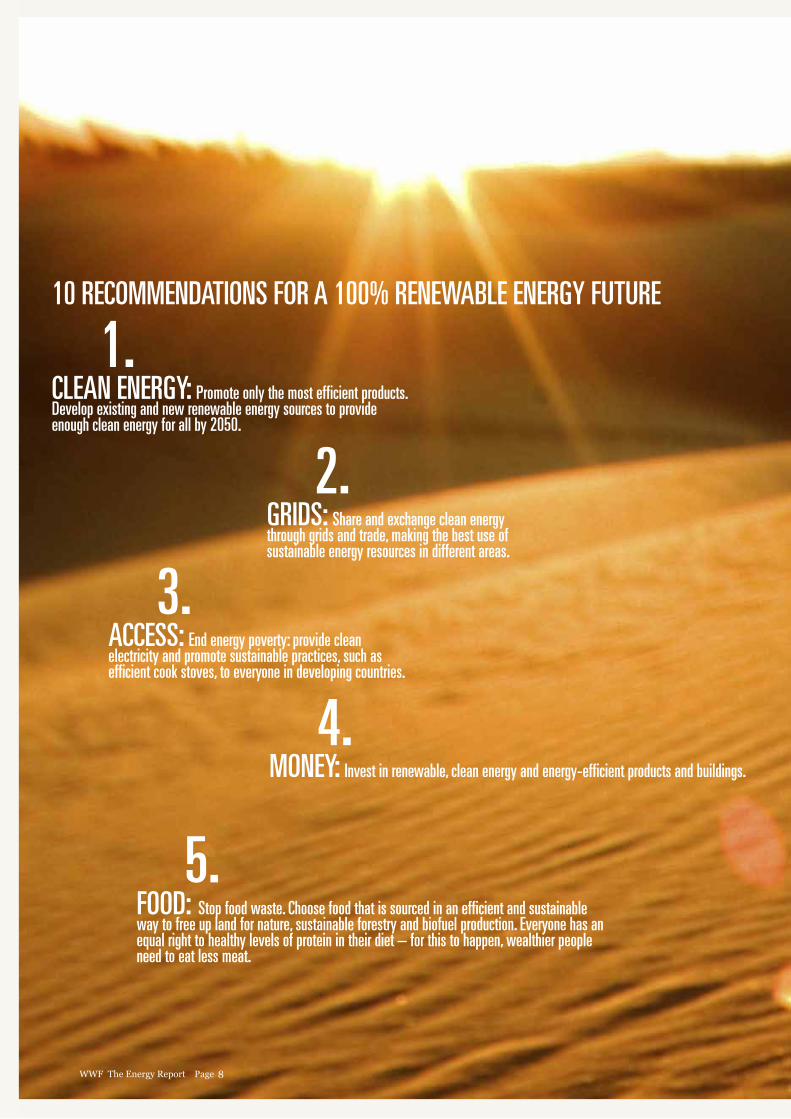
2. GRIDS: Share and exchange clean energy through grids and trade, making the best use of sustainable energy resources in different areas.
3.
ACCESS: End energy poverty: provide clean electricity and promote sustainable practices, such as efficient cook stoves, to everyone in developing countries.
4. MONEY: Invest in renewable, clean energy and energy-efficient products and buildings.
5.
FOOD: Stop food waste. Choose food that is sourced in an efficient and sustainable way to free up land for nature, sustainable forestry and biofuel production. Everyone has an equal right to healthy levels of protein in their diet – for this to happen, wealthier people need to eat less meat.
1. CLEAN ENERGY: Promote only the most efficient products. Develop existing and new renewable energy sources to provide enough clean energy for all by 2050.
10 RECOMMENDATIONS FOR A 100% RENEWABLE ENERGY FUTURE
9WWF The Energy Report Page
4. MONEY: Invest in renewable, clean energy and energy-efficient products and buildings.
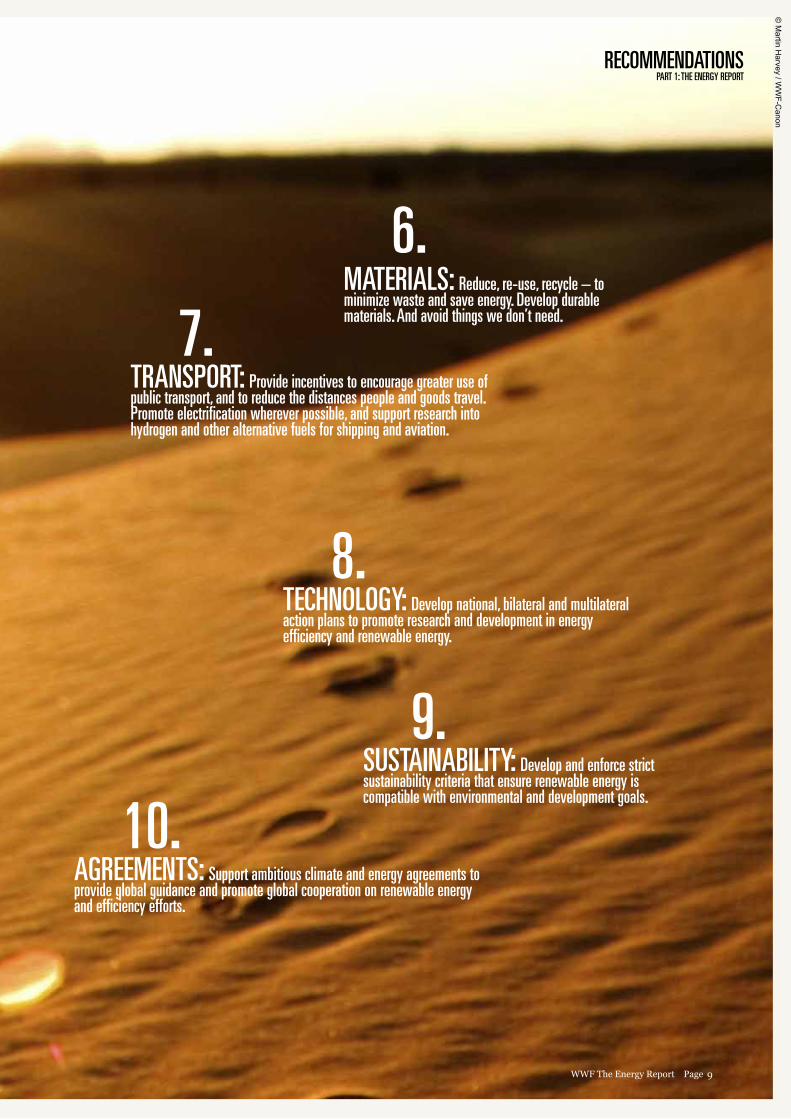
6. MATERIALS: Reduce, re-use, recycle – to minimize waste and save energy. Develop durable materials. And avoid things we don’t need. 7.
TRANSPORT: Provide incentives to encourage greater use of public transport, and to reduce the distances people and goods travel. Promote electrification wherever possible, and support research into hydrogen and other alternative fuels for shipping and aviation.
8. TECHNOLOGY: Develop national, bilateral and multilateral action plans to promote research and development in energy efficiency and renewable energy.
9.
SUSTAINABILITY: Develop and enforce strict sustainability criteria that ensure renewable energy is compatible with environmental and development goals.
10.
AGREEMENTS: Support ambitious climate and energy agreements to provide global guidance and promote global cooperation on renewable energy and efficiency efforts.
RECOMMENDATIONSPART 1: THE ENERGY REPORT
© M
artin Harvey / W
WF-C
anon
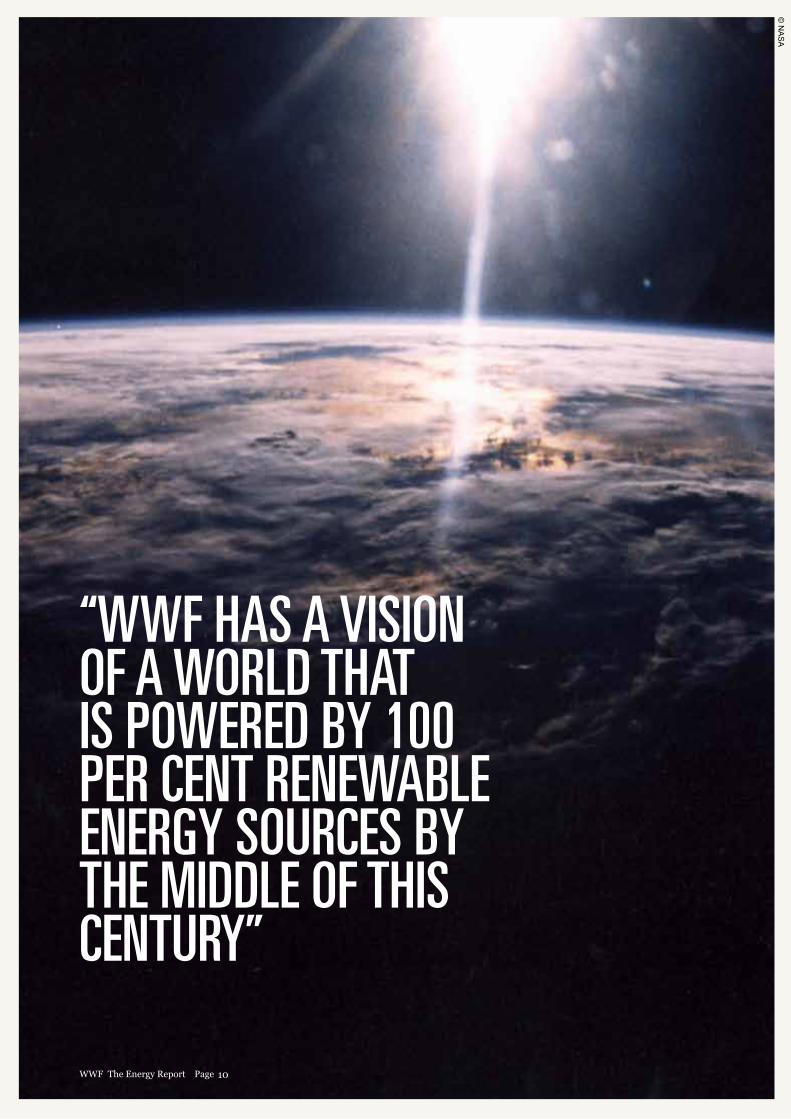
“WWF HAS A VISION OF A WORLD THAT IS POWERED BY 100 PER CENT RENEWABLE ENERGY SOURCES BY THE MIDDLE OF THIS CENTURY”
10WWF The Energy Report Page
© N
AS
A
INTRODUCTIONPART 1: THE ENERGY REPORT
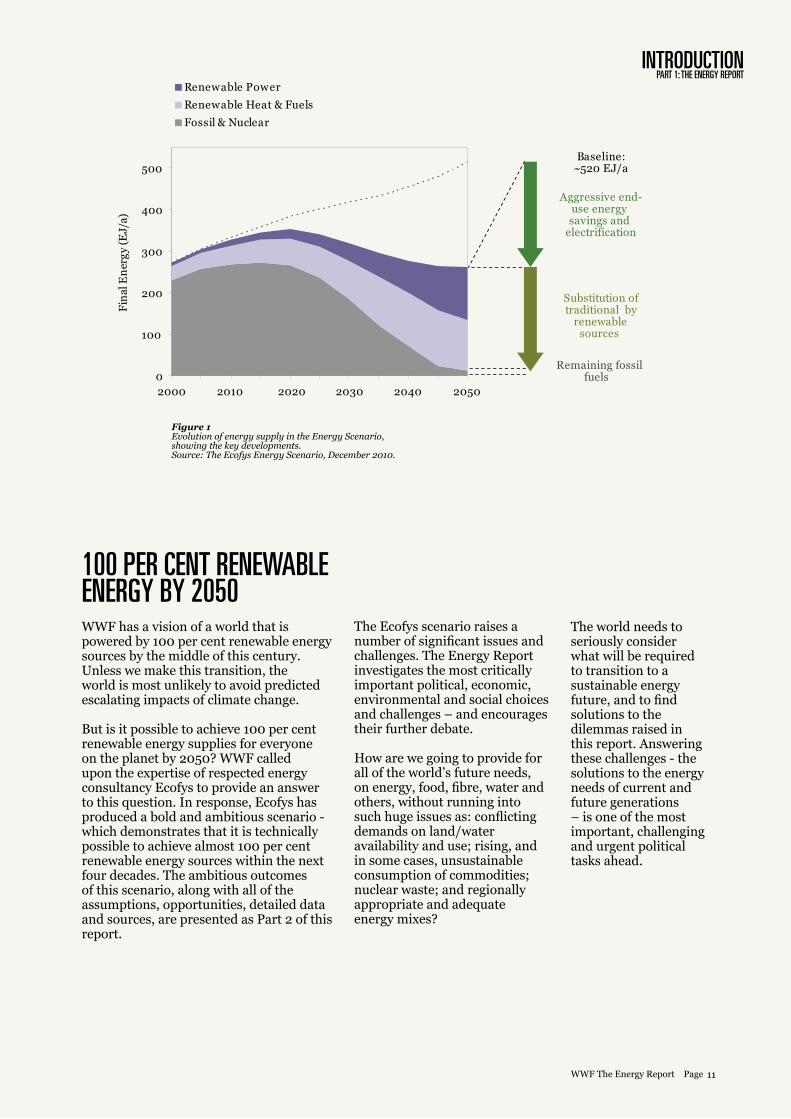
100 PER CENT RENEWABLE ENERGY BY 2050WWF has a vision of a world that is powered by 100 per cent renewable energy sources by the middle of this century. Unless we make this transition, the world is most unlikely to avoid predicted escalating impacts of climate change.
But is it possible to achieve 100 per cent renewable energy supplies for everyone on the planet by 2050? WWF called upon the expertise of respected energy consultancy Ecofys to provide an answer to this question. In response, Ecofys has produced a bold and ambitious scenario - which demonstrates that it is technically possible to achieve almost 100 per cent renewable energy sources within the next four decades. The ambitious outcomes of this scenario, along with all of the assumptions, opportunities, detailed data and sources, are presented as Part 2 of this report.
The Ecofys scenario raises a number of significant issues and challenges. The Energy Report investigates the most critically important political, economic, environmental and social choices and challenges – and encourages their further debate.
How are we going to provide for all of the world’s future needs, on energy, food, fibre, water and others, without running into such huge issues as: conflicting demands on land/water availability and use; rising, and in some cases, unsustainable consumption of commodities; nuclear waste; and regionally appropriate and adequate energy mixes?
The world needs to seriously consider what will be required to transition to a sustainable energy future, and to find solutions to the dilemmas raised in this report. Answering these challenges - the solutions to the energy needs of current and future generations – is one of the most important, challenging and urgent political tasks ahead.
500
2000 2010 2020 2030 2040 2050
Remaining fossil fuels
Substitution of traditional by renewable sources
Aggressive end use energy savings and electrification
Baseline:~520 EJ/a
400
300
200
100
0
Fossil & Nuclear
Renewable Heat & Fuels
Renewable Power
Fina
l Ene
rgy
(EJ/
a)
Fossil & Nuclear
Renewable Heat & Fuels
11WWF The Energy Report Page
Figure 1Evolution of energy supply in the Energy Scenario, showing the key developments. Source: The Ecofys Energy Scenario, December 2010.
12WWF The Energy Report Page
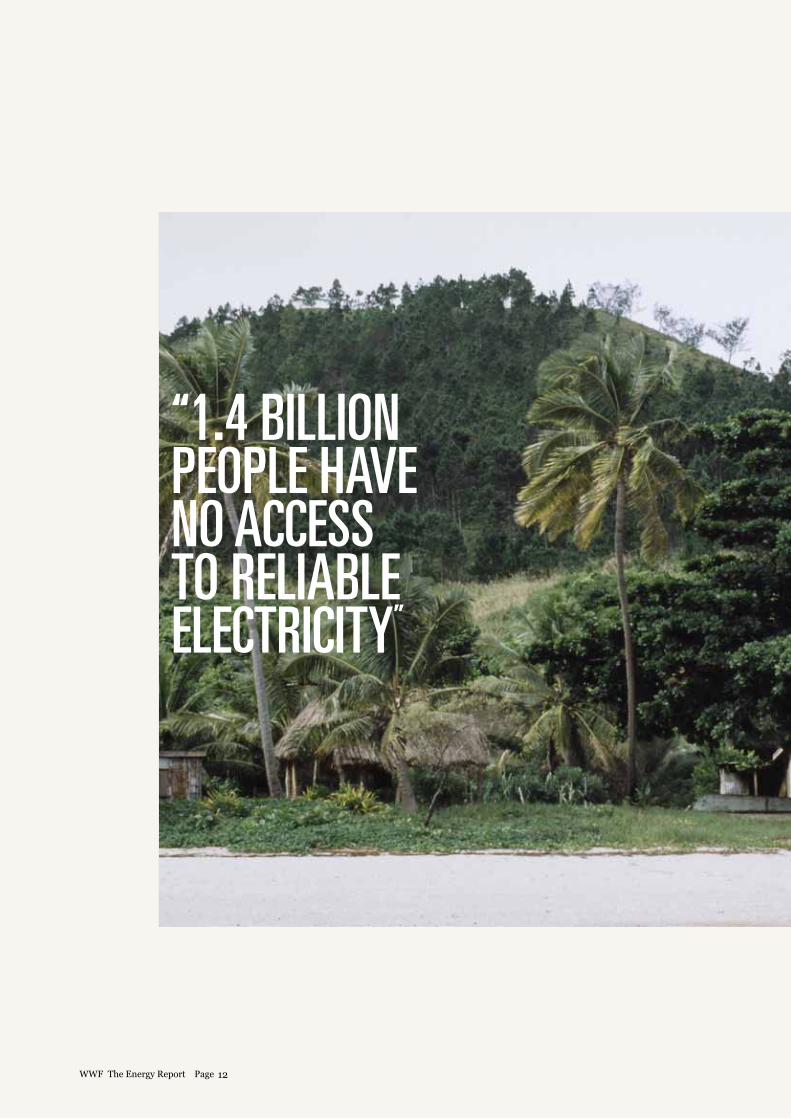
“1.4 BILLION PEOPLE HAVE NO ACCESS TO RELIABLE ELECTRICITY”
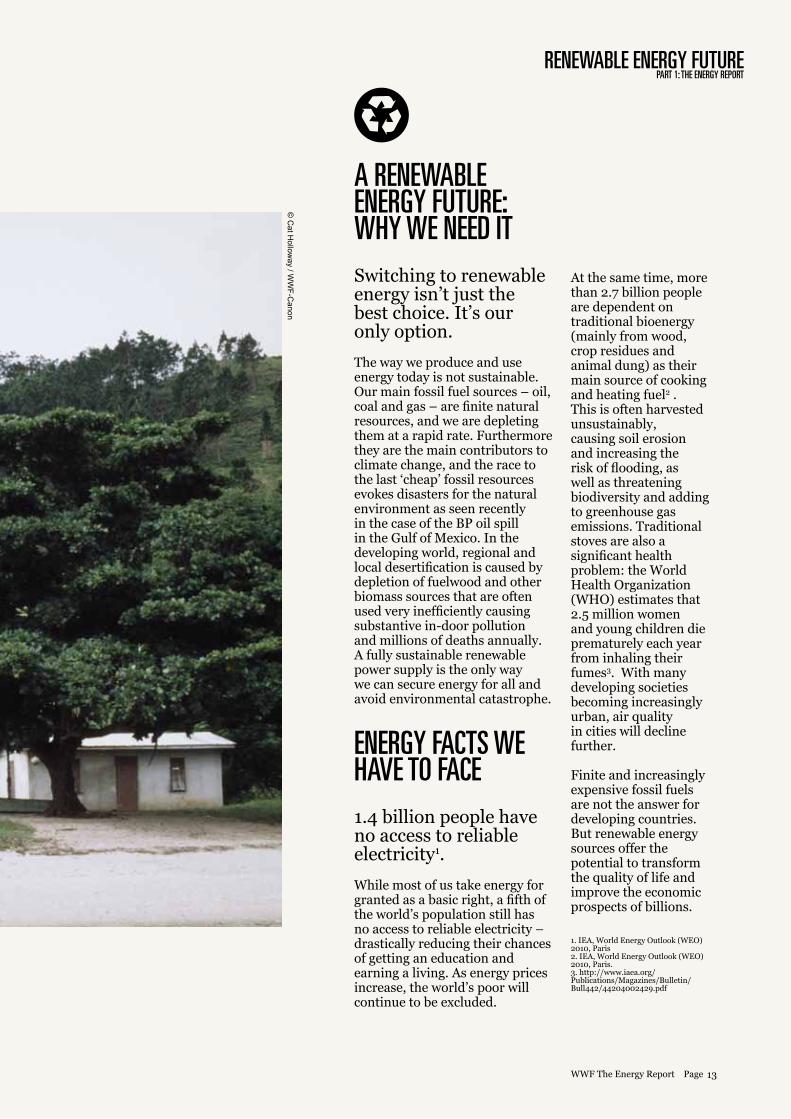
A RENEWABLE ENERGY FUTURE: WHY WE NEED IT Switching to renewable energy isn’t just the best choice. It’s our only option.
The way we produce and use energy today is not sustainable. Our main fossil fuel sources – oil, coal and gas – are finite natural resources, and we are depleting them at a rapid rate. Furthermore they are the main contributors to climate change, and the race to the last ‘cheap’ fossil resources evokes disasters for the natural environment as seen recently in the case of the BP oil spill in the Gulf of Mexico. In the developing world, regional and local desertification is caused by depletion of fuelwood and other biomass sources that are often used very inefficiently causing substantive in-door pollution and millions of deaths annually. A fully sustainable renewable power supply is the only way we can secure energy for all and avoid environmental catastrophe.
ENERGY FACTS WE HAVE TO FACE1.4 billion people have no access to reliable electricity1.
While most of us take energy for granted as a basic right, a fifth of the world’s population still has no access to reliable electricity – drastically reducing their chances of getting an education and earning a living. As energy prices increase, the world’s poor will continue to be excluded.
At the same time, more than 2.7 billion people are dependent on traditional bioenergy (mainly from wood, crop residues and animal dung) as their main source of cooking and heating fuel2 . This is often harvested unsustainably, causing soil erosion and increasing the risk of flooding, as well as threatening biodiversity and adding to greenhouse gas emissions. Traditional stoves are also a significant health problem: the World Health Organization (WHO) estimates that 2.5 million women and young children die prematurely each year from inhaling their fumes3. With many developing societies becoming increasingly urban, air quality in cities will decline further.
Finite and increasingly expensive fossil fuels are not the answer for developing countries. But renewable energy sources offer the potential to transform the quality of life and improve the economic prospects of billions.
1. IEA, World Energy Outlook (WEO) 2010, Paris2. IEA, World Energy Outlook (WEO) 2010, Paris.3. http://www.iaea.org/Publications/Magazines/Bulletin/Bull442/44204002429.pdf
13WWF The Energy Report Page
RENEWABLE ENERGY FUTUREPART 1: THE ENERGY REPORT
© C
at Hollow
ay / WW
F-Canon
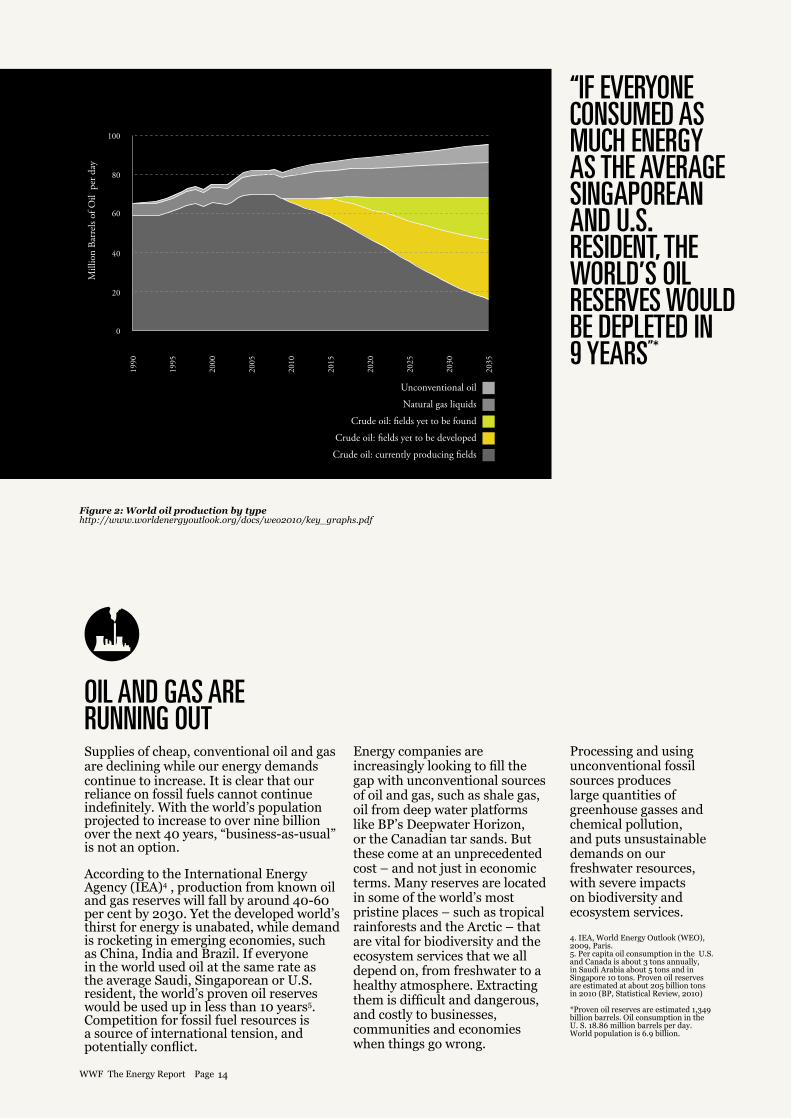
Figure 2: World oil production by typehttp://www.worldenergyoutlook.org/docs/weo2010/key_graphs.pdf
OIL AND GAS ARE RUNNING OUTSupplies of cheap, conventional oil and gas are declining while our energy demands continue to increase. It is clear that our reliance on fossil fuels cannot continue indefinitely. With the world’s population projected to increase to over nine billion over the next 40 years, “business-as-usual” is not an option.
According to the International Energy Agency (IEA)4 , production from known oil and gas reserves will fall by around 40-60 per cent by 2030. Yet the developed world’s thirst for energy is unabated, while demand is rocketing in emerging economies, such as China, India and Brazil. If everyone in the world used oil at the same rate as the average Saudi, Singaporean or U.S. resident, the world’s proven oil reserves would be used up in less than 10 years5. Competition for fossil fuel resources is a source of international tension, and potentially conflict.
Energy companies are increasingly looking to fill the gap with unconventional sources of oil and gas, such as shale gas, oil from deep water platforms like BP’s Deepwater Horizon, or the Canadian tar sands. But these come at an unprecedented cost – and not just in economic terms. Many reserves are located in some of the world’s most pristine places – such as tropical rainforests and the Arctic – that are vital for biodiversity and the ecosystem services that we all depend on, from freshwater to a healthy atmosphere. Extracting them is difficult and dangerous, and costly to businesses, communities and economies when things go wrong.
Processing and using unconventional fossil sources produces large quantities of greenhouse gasses and chemical pollution, and puts unsustainable demands on our freshwater resources, with severe impacts on biodiversity and ecosystem services.
4. IEA, World Energy Outlook (WEO), 2009, Paris. 5. Per capita oil consumption in the U.S. and Canada is about 3 tons annually, in Saudi Arabia about 5 tons and in Singapore 10 tons. Proven oil reserves are estimated at about 205 billion tons in 2010 (BP, Statistical Review, 2010)
*Proven oil reserves are estimated 1,349 billion barrels. Oil consumption in the U. S. 18.86 million barrels per day. World population is 6.9 billion.
“IF EVERYONE CONSUMED AS MUCH ENERGY AS THE AVERAGE SINGAPOREAN AND U.S. RESIDENT, THE WORLD’S OIL RESERVES WOULD BE DEPLETED IN 9 YEARS”*
14WWF The Energy Report Page
OIL AND GAS ARE RUNNING OUTPART 1: THE ENERGY REPORT
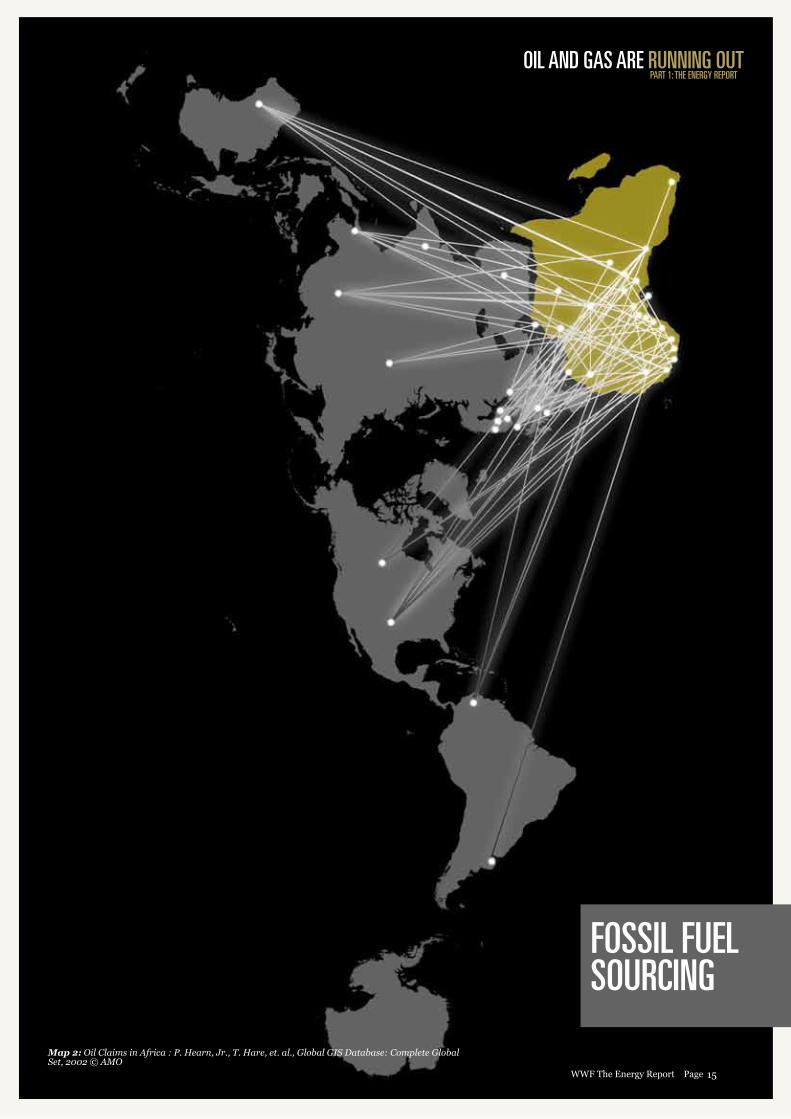
Map 2: Oil Claims in Africa : P. Hearn, Jr., T. Hare, et. al., Global GIS Database: Complete Global Set, 2002 © AMO
15WWF The Energy Report Page
FOSSIL FUEL SOURCING

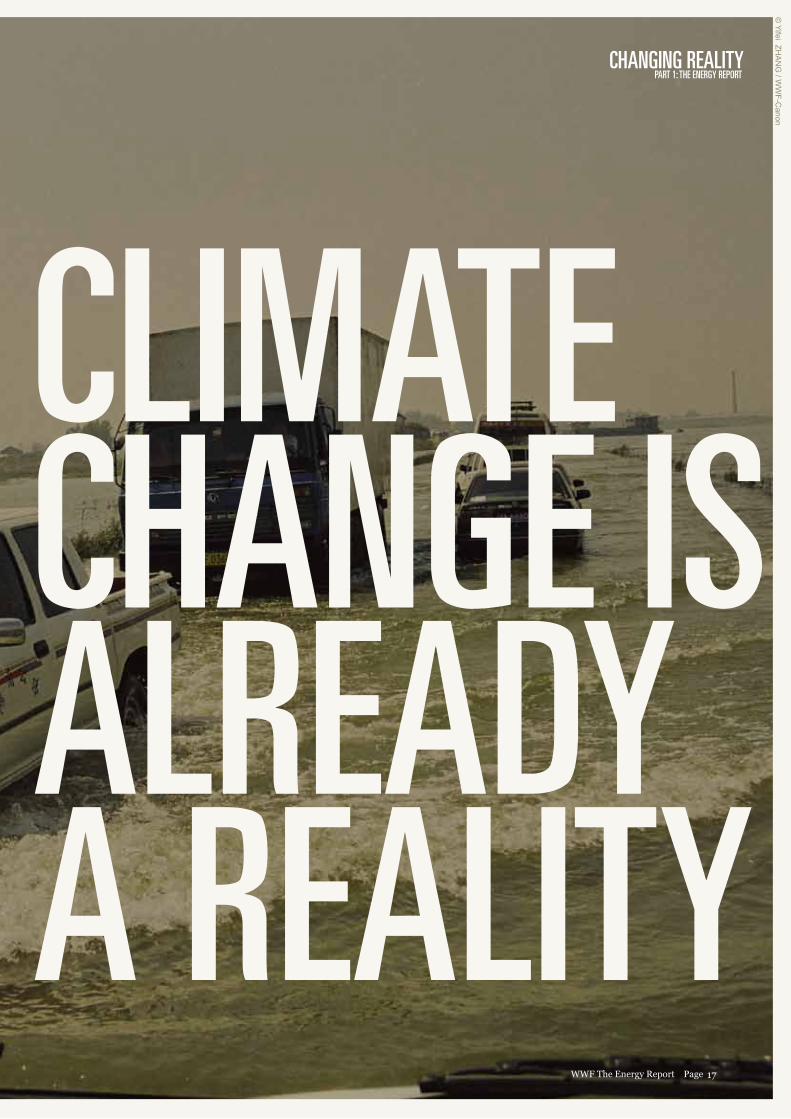
CLIMATE CHANGE IS ALREADY A REALITYEven if fossil fuel supplies were infinite, we would have another compelling reason for an urgent switch to renewableenergy: climate change. Hundreds of millions of people worldwide are already affected by water shortages, crop failures, tropical diseases, flooding and extreme weather events – conditions that are likely to be made worse by increasing concentrations of greenhouse gasses in the Earth’s atmosphere. The WHO estimates that climate change is already causing more than 150,000 deaths a year6.
Global warming threatens the fragile balance of our planet’s ecosystems, and could consign a quarter of all species to extinction7. The loss of ecological services from forests, coral reefs and other ecosystems will also have huge economic implications8.The costs of adapting to climate change will be colossal: a recent report suggests that by 2030, the world may need to spend more than €200 billion a year on measures such as building flood defences, transporting water for agriculture and rebuilding infrastructure affected by climate change9.To avoid devastating consequences, we must keep eventual global warming below 1.5°C compared to pre-Industrial temperatures. To have a chance of doing that, global greenhouse gas emissions need to start falling within the next five years, and we need to cut them by at least 80 per cent globally by 2050 (from 1990 levels) – and even further beyond that date.
The global energy sector holds the key. It is responsible for around two-thirds of global greenhouse gas emissions, an amount that is increasing at a faster rate than for any other sector. Coal is the most carbon-intensive fuel and the single largest source of global greenhouse gas emissions. Embracing renewable energy, along with ambitious energy-saving measures, is the best way to achieve the rapid emissions reductions we need.
6. http://www.who.int/globalchange/news/fsclimandhealth/en/index.html 7. http://www.nature.com/nature/journal/v427/n6970/abs/nature02121.html 8. For a report on the effects of climate change on ecosystem services, see The Economics of Ecosystems and Biodiversity (TEEB) TEEB Climate Issues Update. September 20099. Martin Parry, Nigel Arnell, Pam Berry, David Dodman, Samuel Fankhauser, Chris Hope, Sari Kovats, Robert Nicholls, David Satterthwaite, Richard Tiffin, Tim Wheeler (2009) Assessing the Costs of Adaptation to Climate Change: A Review of the UNFCCC and Other Recent Estimates, International Institute for Environment and Development and Grantham Institute for Climate Change, London.
16WWF The Energy Report Page
CLIMATECHANGE ISALREADY A REALITY
CHANGING REALITYPART 1: THE ENERGY REPORT
17WWF The Energy Report Page
© Yifei ZH
AN
G / W
WF-C
anon
18WWF The Energy Report Page
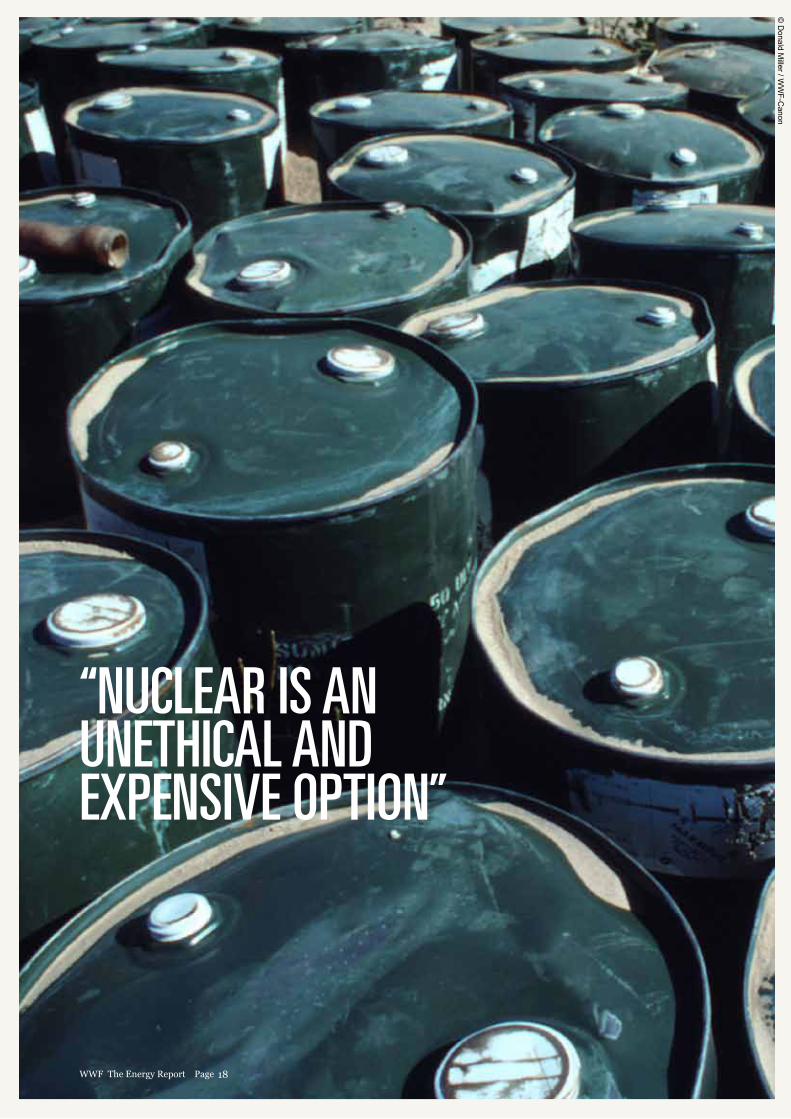
“NUCLEAR IS AN UNETHICAL AND EXPENSIVE OPTION”
© D
onald Miller / W
WF-C
anon
Operational Nuclear Reactors
10,000 YRS OF HARMFUL WASTEPART 1: THE ENERGY REPORT
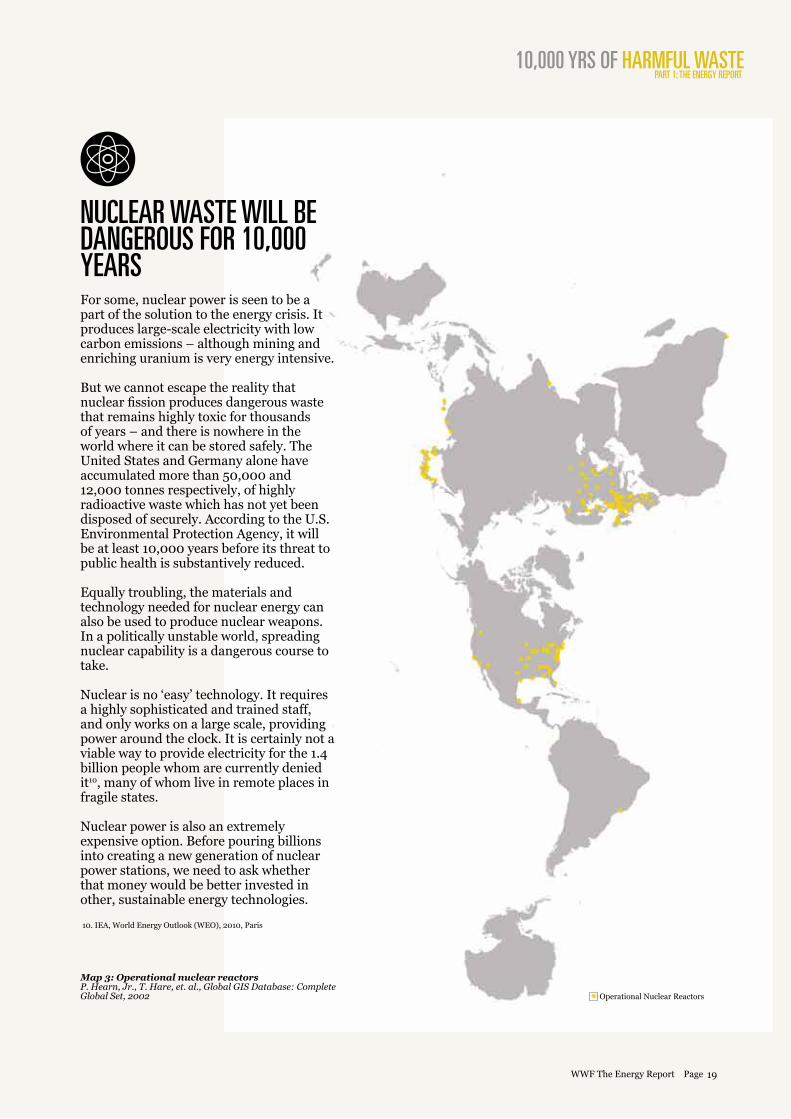
Map 3: Operational nuclear reactors P. Hearn, Jr., T. Hare, et. al., Global GIS Database: Complete Global Set, 2002
NUCLEAR WASTE WILL BE DANGEROUS FOR 10,000 YEARSFor some, nuclear power is seen to be a part of the solution to the energy crisis. It produces large-scale electricity with low carbon emissions – although mining and enriching uranium is very energy intensive.
But we cannot escape the reality that nuclear fission produces dangerous waste that remains highly toxic for thousands of years – and there is nowhere in the world where it can be stored safely. The United States and Germany alone have accumulated more than 50,000 and 12,000 tonnes respectively, of highly radioactive waste which has not yet been disposed of securely. According to the U.S. Environmental Protection Agency, it will be at least 10,000 years before its threat to public health is substantively reduced.
Equally troubling, the materials and technology needed for nuclear energy can also be used to produce nuclear weapons. In a politically unstable world, spreading nuclear capability is a dangerous course to take.
Nuclear is no ‘easy’ technology. It requires a highly sophisticated and trained staff, and only works on a large scale, providing power around the clock. It is certainly not a viable way to provide electricity for the 1.4 billion people whom are currently denied it10, many of whom live in remote places in fragile states.
Nuclear power is also an extremely expensive option. Before pouring billions into creating a new generation of nuclear power stations, we need to ask whether that money would be better invested in other, sustainable energy technologies.
10. IEA, World Energy Outlook (WEO), 2010, Paris
19WWF The Energy Report Page
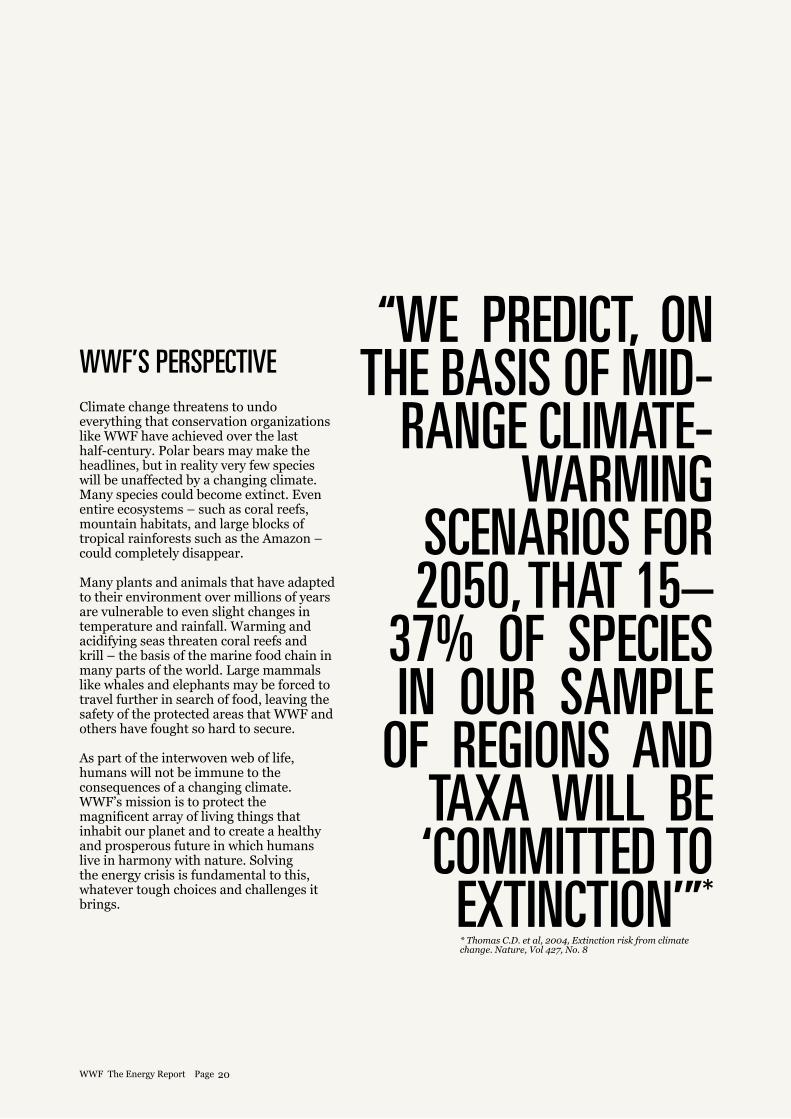
WWF’S PERSPECTIVEClimate change threatens to undo everything that conservation organizations like WWF have achieved over the last half-century. Polar bears may make the headlines, but in reality very few species will be unaffected by a changing climate. Many species could become extinct. Even entire ecosystems – such as coral reefs, mountain habitats, and large blocks of tropical rainforests such as the Amazon – could completely disappear.
Many plants and animals that have adapted to their environment over millions of years are vulnerable to even slight changes in temperature and rainfall. Warming and acidifying seas threaten coral reefs and krill – the basis of the marine food chain in many parts of the world. Large mammals like whales and elephants may be forced to travel further in search of food, leaving the safety of the protected areas that WWF and others have fought so hard to secure.
As part of the interwoven web of life, humans will not be immune to the consequences of a changing climate. WWF’s mission is to protect the magnificent array of living things that inhabit our planet and to create a healthy and prosperous future in which humans live in harmony with nature. Solving the energy crisis is fundamental to this, whatever tough choices and challenges it brings.
“WE PREDICT, ON THE BASIS OF MID-
RANGE CLIMATE-WARMING
SCENARIOS FOR 2050, THAT 15–
37% OF SPECIES IN OUR SAMPLE
OF REGIONS AND TAXA WILL BE ‘COMMITTED TO
EXTINCTION’”* * Thomas C.D. et al, 2004, Extinction risk from climate change. Nature, Vol 427, No. 8
20WWF The Energy Report Page
WWF PERSPECTIVEPART 1: THE ENERGY REPORT
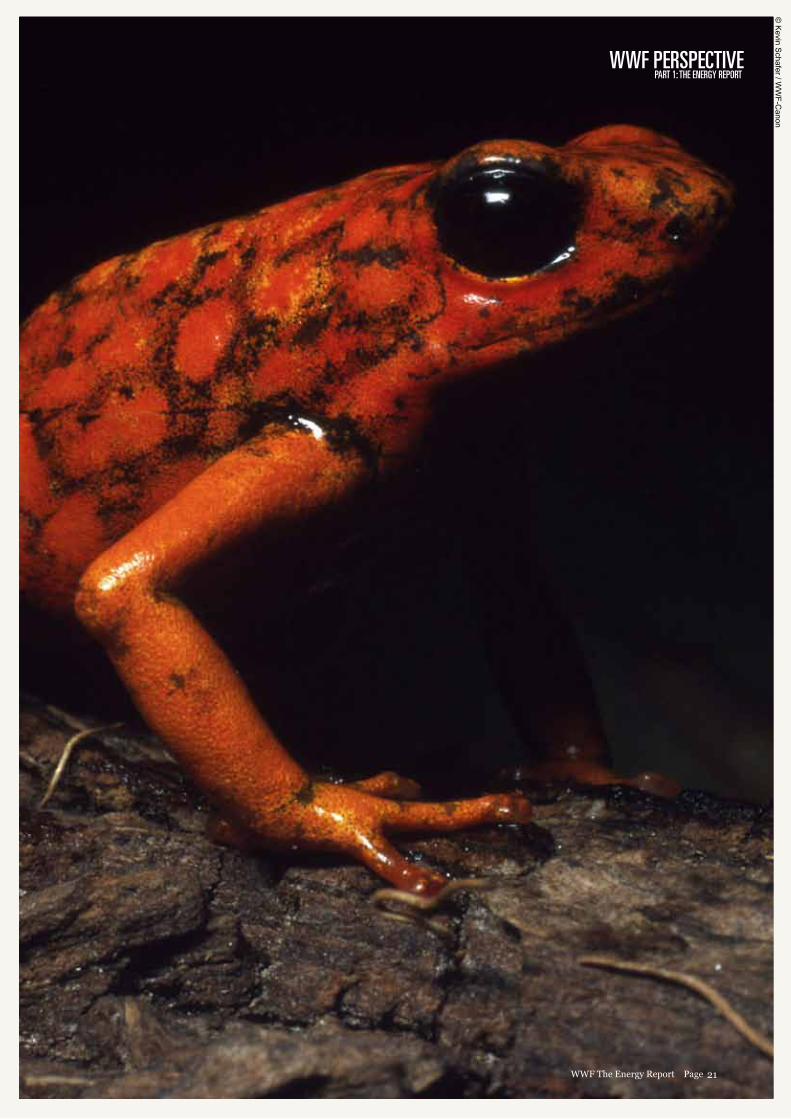
21WWF The Energy Report Page
© K
evin Schafer / W
WF-C
anon
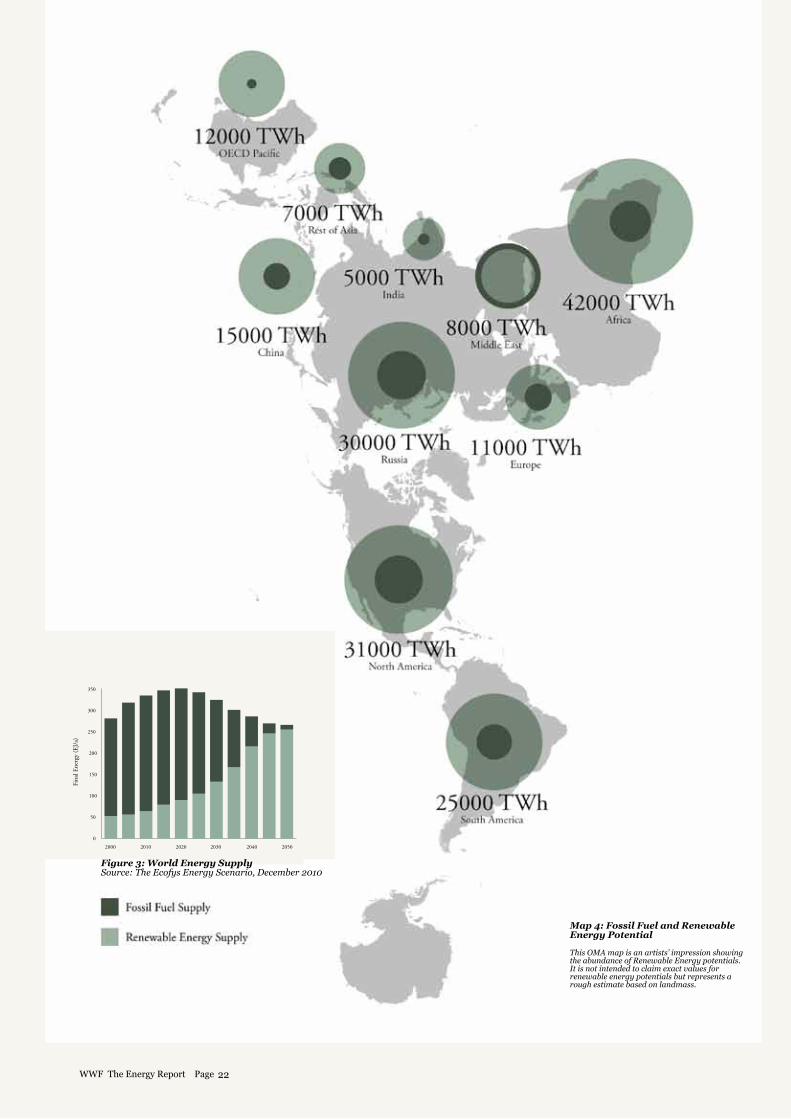
Map 4: Fossil Fuel and Renewable Energy Potential
This OMA map is an artists’ impression showing the abundance of Renewable Energy potentials. It is not intended to claim exact values for renewable energy potentials but represents a rough estimate based on landmass.
Figure 3: World Energy SupplySource: The Ecofys Energy Scenario, December 2010
22WWF The Energy Report Page
100% POSSIBLEPART 1: THE ENERGY REPORT
100% POSSIBLESwitching to a fully renew-able energy supply by 2050 is achievable, but there are chal-lenges to overcome.
The global energy crisis is a daunting challenge. Yet we do not have to look far for the solutions. Energy derived from the sun, the wind, the Earth’s heat, water and the sea has the potential to meet the world’s electricity needs many times over, even allowing for fluctuations in supply and demand. We can greatly reduce the amount of energy we use through simple measures like insulating buildings, recycling materials and installing efficient biomass stoves. Biomass from waste, crops and forest resources has potential to provide a renewable source of energy – although this raises significant social and environmental issues, which we will discuss later in this report.
Around the world, people are taking steps in the right direction. In 2009, China added 37GW of renewable energy, bringing its total renewable capacity to 226GW – equivalent to four times the capacity required to satisfy the total peak electrical power consumption of Great Britain11 or over twice the total electric capacity of Africa!12 In Europe and the U.S., more than half of all new power capacity installed in 2009 came from renewable sources. In the developing world, more than 30 million households have their own biogas generators for cooking and lighting. Over 160 million use “improved” biomass stoves, which are more efficient and produce less greenhouse gas and other pollutants. Solar water heating is used by 70 million households around the world. Wind power capacity has grown by 70 per cent, and solar power (PV) by a massive 190 per cent in the last two years (2008 and 2009). During the same period, total investment into all renewables has increased from about $US 100 billion in 2007 to more than $US 150 billion in 200913.
But the pace of change is far too slow. Non-hydro renewables still only comprise a mere 3 per cent of all electricity consumed. Huge quantities of fossil fuels continue to be extracted and used, and global carbon emissions are still rising. Government subsidies and private investments in fossil fuels and nuclear power ventures still vastly outweigh those into renewable energy and energy efficiency, even though the latter would give a far greater long-
term return. While thousands of houses throughout the world, especially in Germany and Scandinavia, have been built to “passive house” standards that require almost no energy for heating and cooling, many more construction projects follow old-fashioned, energy-inefficient designs.
Moving to a fully renewable energy future by 2050 is a radical departure from humanity’s current course. It is an ambitious goal. But WWF believes that it is a goal we can and must achieve. This conviction led us to establish a collaborative partnership with Ecofys, one of the world’s leading climate and energy consultancies. We commissioned Ecofys to assess whether it would be possible to secure a fully renewable, sustainable energy supply for everyone on the planet by 2050.
The Ecofys scenario, which forms the second part of this report, is the most ambitious analysis of its kind to date. It demonstrates that it is technically feasible to supply everyone on the planet in 2050 with the energy they need, with 95 per cent of this energy coming from renewable sources. This would reduce greenhouse gas emissions from the energy sector by about 80 per cent while taking account of residual land-based emissions from bioenergy production.
The task ahead is, of course, a huge one, raising major challenges. However, the scenario Ecofys has mapped out is practically possible. It is based only on the technologies the world already has at its disposal, and is realistic about the rate at which these can be brought up to scale. Although significant investment will be required, the economic outlay is reasonable, with net costs never rising above 2 per cent of global GDP. The Ecofys scenario accounts for
projected increases in population, long-distance travel and increased economic wealth – it does not demand radical changes to the way we live.
The scenario detailed by Ecofys for this report is not the only solution, nor is it intended to be a prescriptive plan. Indeed, it raises a number of major challenges and difficult questions – particularly for a conservation organization like WWF – which we will discuss in more detail on the following pages. To realize our vision of a 100 per cent renewable and sustainable energy supply, we need to further advance the Ecofys scenario; and we propose some of the social and technological changes that could help us do this.
In presenting the Ecofys scenario, WWF aims to show that a fully renewable energy future is not an unattainable utopia. It is technically and economically possible, and there are concrete steps we can take – starting right now – to achieve it.
11. Figures for UK energy demand come from the National Grid’s website: http://www.nationalgrid.com/uk/Electricity/Data/Demand+Data/12. EIA World Electric Data 2006 http://www.eia.doe.gov/iea/elec.html13. Renewables 2010 Global Status Report, REN 21.
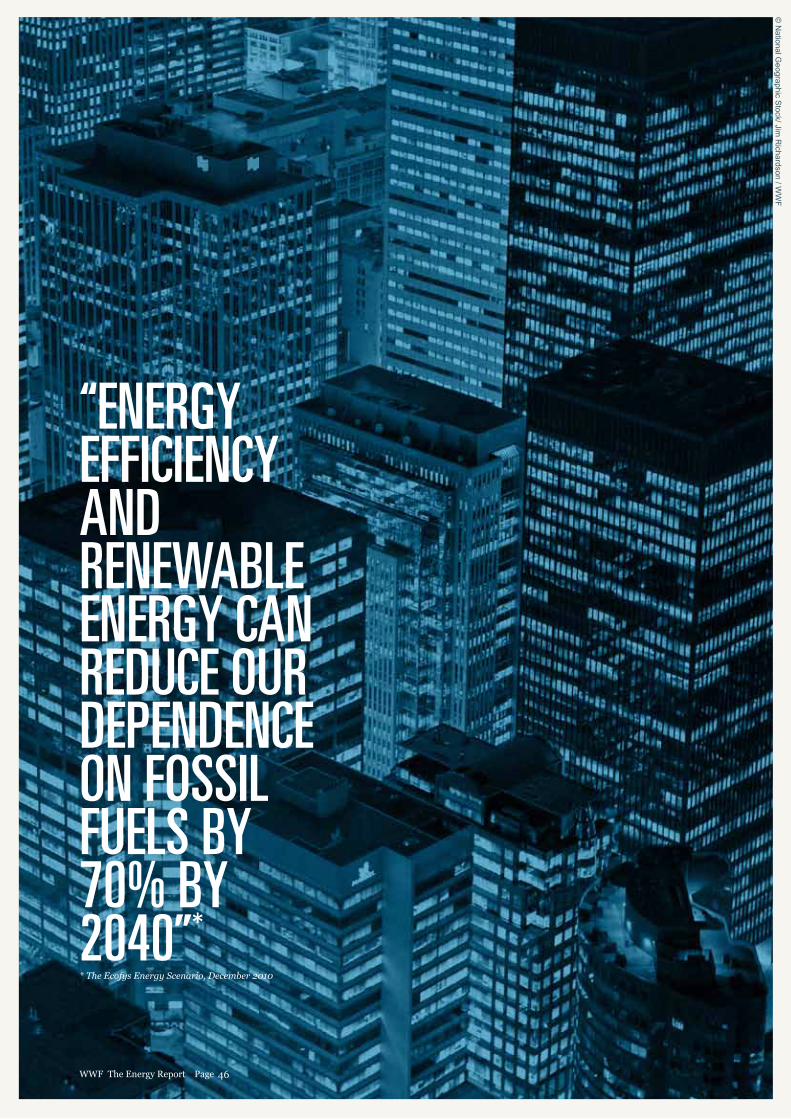
“WE CAN REDUCE OUR RELIANCE ON FOSSIL FUELS BY 70% BY 2040”*
* Source: The Ecofys Energy Scenario, December 2010
23WWF The Energy Report Page
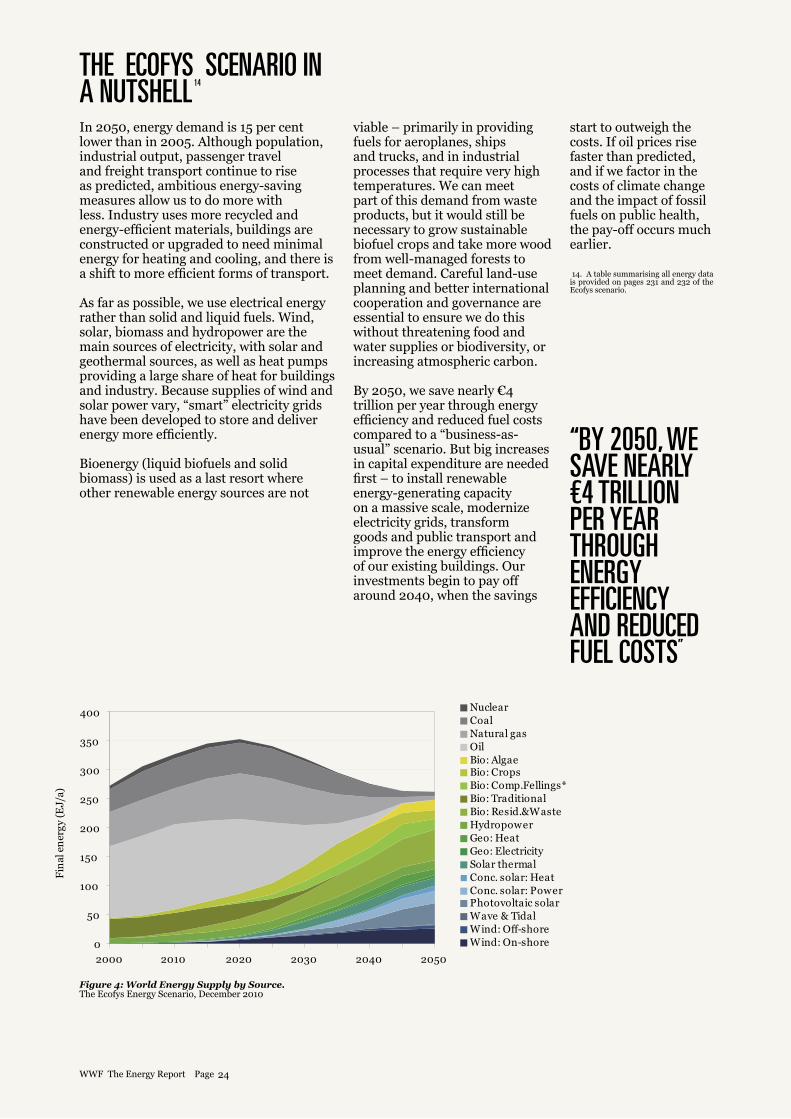
Figure 4: World Energy Supply by Source. The Ecofys Energy Scenario, December 2010
THE ECOFYS SCENARIO IN A NUTSHELLIn 2050, energy demand is 15 per cent lower than in 2005. Although population, industrial output, passenger travel and freight transport continue to rise as predicted, ambitious energy-saving measures allow us to do more with less. Industry uses more recycled and energy-efficient materials, buildings are constructed or upgraded to need minimal energy for heating and cooling, and there is a shift to more efficient forms of transport.
As far as possible, we use electrical energy rather than solid and liquid fuels. Wind, solar, biomass and hydropower are the main sources of electricity, with solar and geothermal sources, as well as heat pumps providing a large share of heat for buildings and industry. Because supplies of wind and solar power vary, “smart” electricity grids have been developed to store and deliver energy more efficiently.
Bioenergy (liquid biofuels and solid biomass) is used as a last resort where other renewable energy sources are not
viable – primarily in providing fuels for aeroplanes, ships and trucks, and in industrial processes that require very high temperatures. We can meet part of this demand from waste products, but it would still be necessary to grow sustainable biofuel crops and take more wood from well-managed forests to meet demand. Careful land-use planning and better international cooperation and governance are essential to ensure we do this without threatening food and water supplies or biodiversity, or increasing atmospheric carbon.
By 2050, we save nearly €4 trillion per year through energy efficiency and reduced fuel costs compared to a “business-as-usual” scenario. But big increases in capital expenditure are needed first – to install renewable energy-generating capacity on a massive scale, modernize electricity grids, transform goods and public transport and improve the energy efficiency of our existing buildings. Our investments begin to pay off around 2040, when the savings
“BY 2050, WE SAVE NEARLY €4 TRILLION PER YEAR THROUGH ENERGY EFFICIENCY AND REDUCED FUEL COSTS”
start to outweigh the costs. If oil prices rise faster than predicted, and if we factor in the costs of climate change and the impact of fossil fuels on public health, the pay-off occurs much earlier.
14. A table summarising all energy data is provided on pages 231 and 232 of the Ecofys scenario.
14
500
2000 2010 2020 2030 2040 2050
Remaining fossil fuels
Substitution of traditional by renewable sources
Aggressive end use energy savings and electrification
Baseline:~520 EJ/a
400
300
200
100
0
Fossil & Nuclear
Renewable Heat & Fuels
Renewable Power
Fina
l Ene
rgy
(EJ/
a)
Fossil & Nuclear
Renewable Heat & Fuels
24WWF The Energy Report Page
15
THE ECOFYS SCENARIO IN A NUTSHELL PART 1: THE ENERGY REPORT
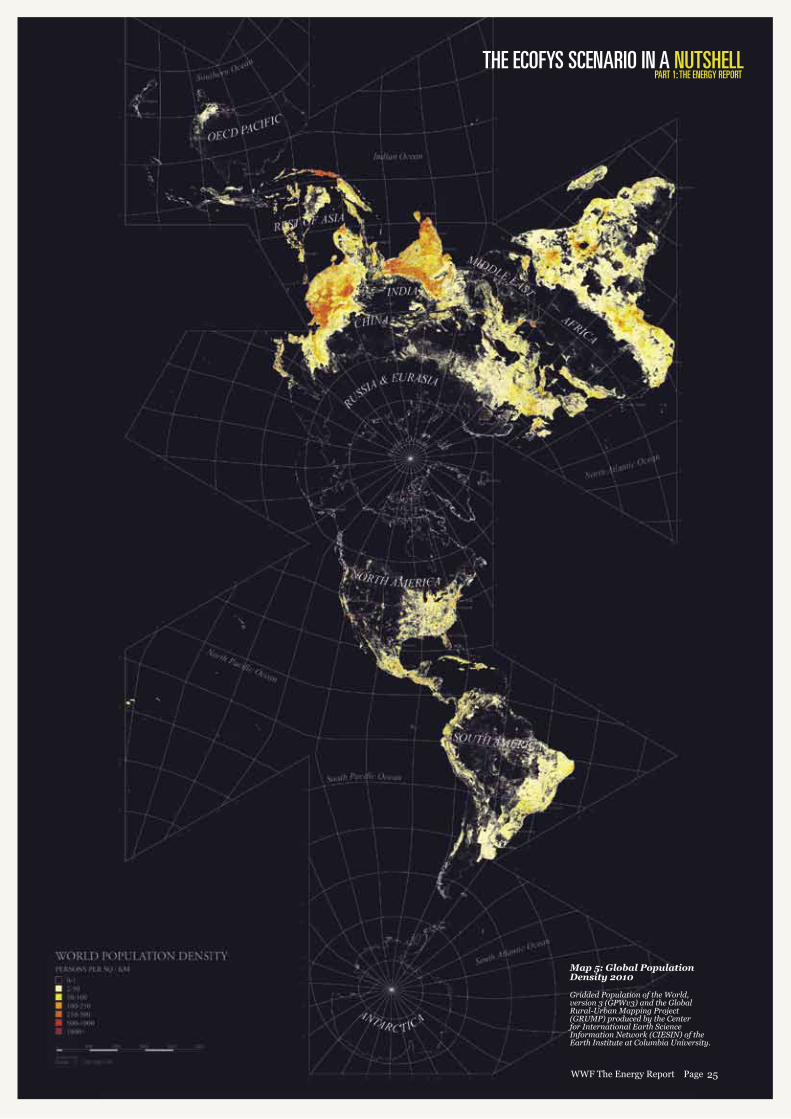
Map 5: Global Population Density 2010
Gridded Population of the World, version 3 (GPWv3) and the Global Rural-Urban Mapping Project (GRUMP) produced by the Center for International Earth Science Information Network (CIESIN) of the Earth Institute at Columbia University.
25WWF The Energy Report Page

ENERGY FOR A NEW FUTURE
26WWF The Energy Report Page

CHANGING REALITYPART 1: THE ENERGY REPORT
© C
hris Martin B
ahr / WW
F-Canon
ENERGY FOR A NEW FUTURE
27WWF The Energy Report Page
© C
hris Martin B
ahr / WW
F-Canon
ENERGY OF THE FUTURE
Global potential of wind power
Global potential of water power
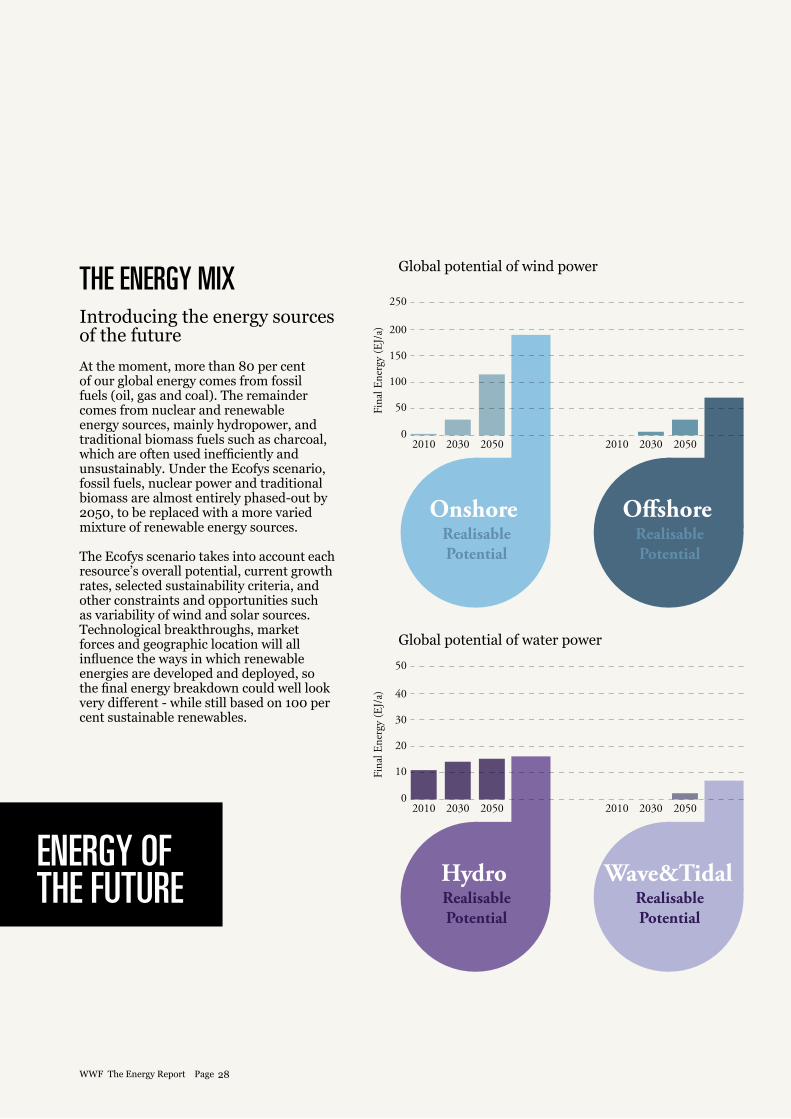
THE ENERGY MIX Introducing the energy sources of the future
At the moment, more than 80 per cent of our global energy comes from fossil fuels (oil, gas and coal). The remainder comes from nuclear and renewable energy sources, mainly hydropower, and traditional biomass fuels such as charcoal, which are often used inefficiently and unsustainably. Under the Ecofys scenario, fossil fuels, nuclear power and traditional biomass are almost entirely phased-out by 2050, to be replaced with a more varied mixture of renewable energy sources.
The Ecofys scenario takes into account each resource’s overall potential, current growth rates, selected sustainability criteria, and other constraints and opportunities such as variability of wind and solar sources. Technological breakthroughs, market forces and geographic location will all influence the ways in which renewable energies are developed and deployed, so the final energy breakdown could well look very different - while still based on 100 per cent sustainable renewables.
28WWF The Energy Report Page
THE ENERGY MIX PART 1: THE ENERGY REPORT
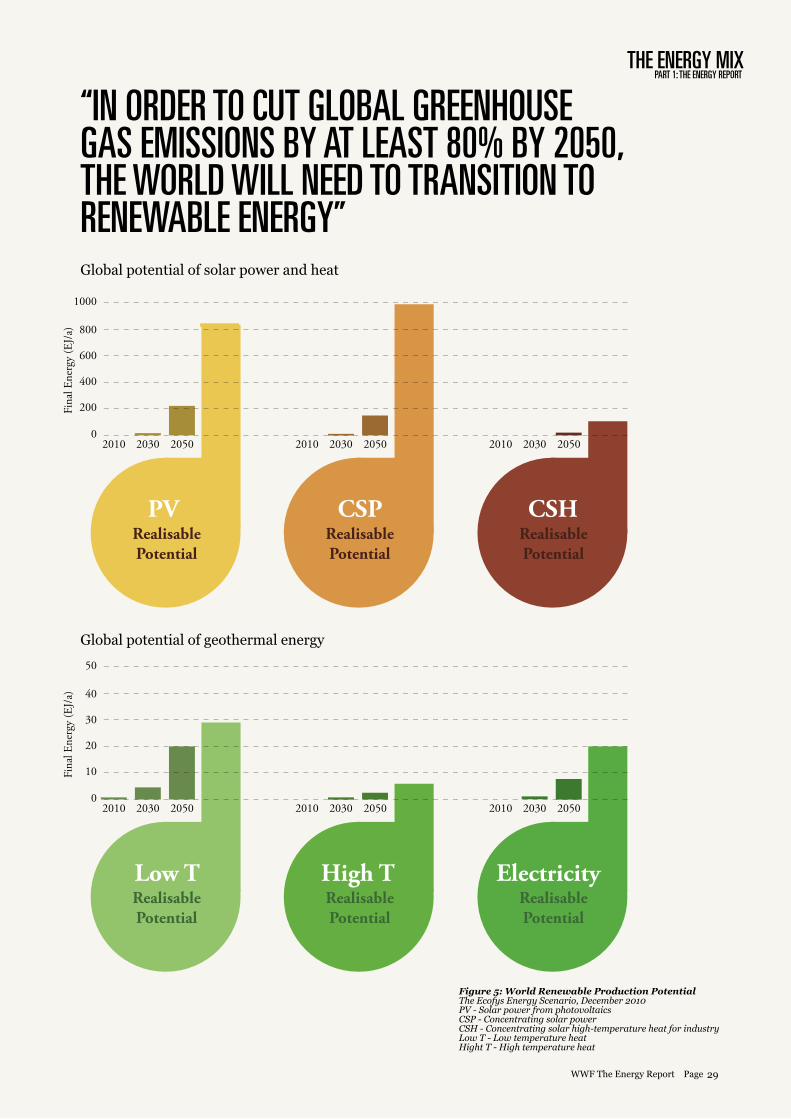
Global potential of solar power and heat
Global potential of geothermal energy
“IN ORDER TO CUT GLOBAL GREENHOUSE GAS EMISSIONS BY AT LEAST 80% BY 2050, THE WORLD WILL NEED TO TRANSITION TO RENEWABLE ENERGY”
Figure 5: World Renewable Production PotentialThe Ecofys Energy Scenario, December 2010PV - Solar power from photovoltaicsCSP - Concentrating solar powerCSH - Concentrating solar high-temperature heat for industryLow T - Low temperature heat Hight T - High temperature heat
29WWF The Energy Report Page
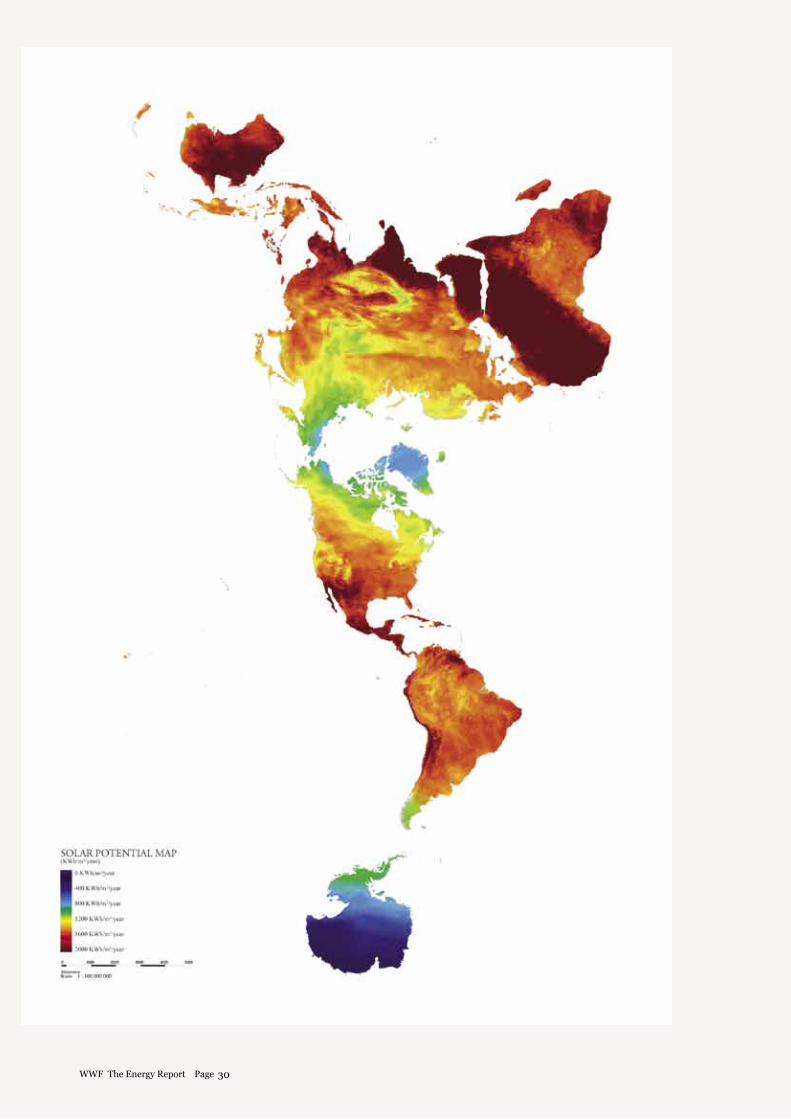
Map 6: Global Solar PotentialNASA Map of World Solar Energy Potential
30WWF The Energy Report Page
SOLAR ENERGY MIXPART 1: THE ENERGY REPORT
* Bridgette Meinhold, Desertec Foundation, 2009
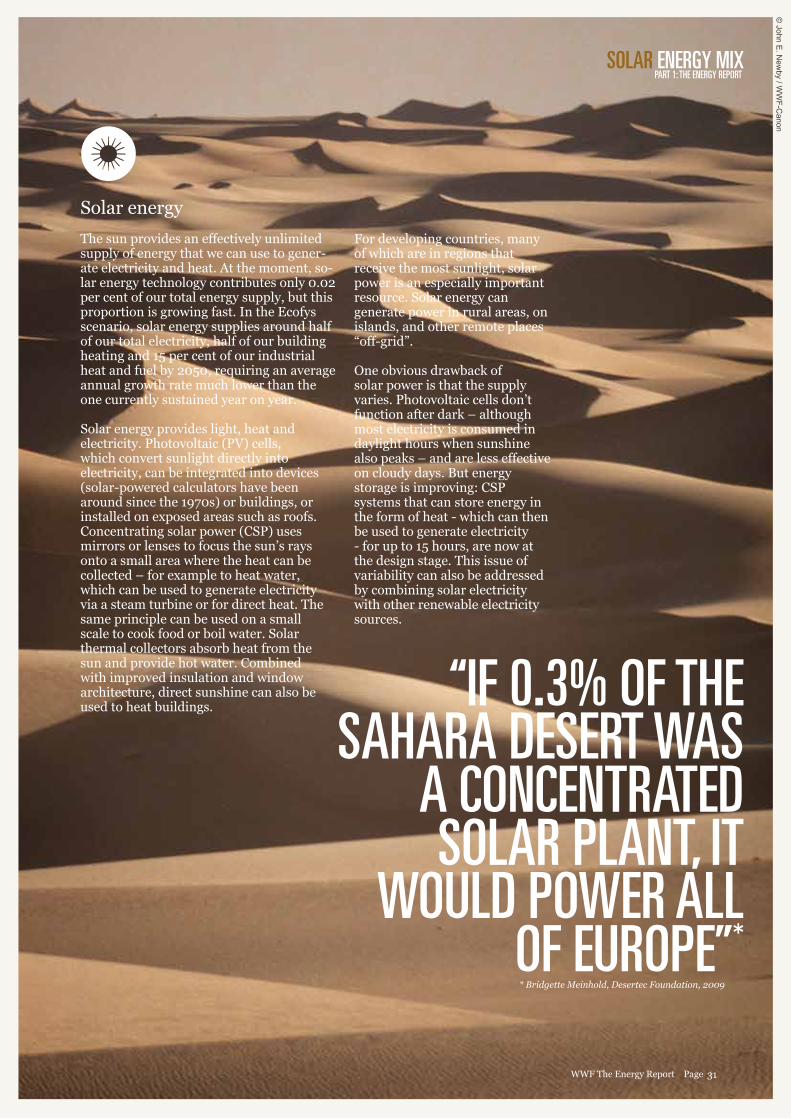
Solar energy
The sun provides an effectively unlimited supply of energy that we can use to gener-ate electricity and heat. At the moment, so-lar energy technology contributes only 0.02 per cent of our total energy supply, but this proportion is growing fast. In the Ecofys scenario, solar energy supplies around half of our total electricity, half of our building heating and 15 per cent of our industrial heat and fuel by 2050, requiring an average annual growth rate much lower than the one currently sustained year on year.
Solar energy provides light, heat and electricity. Photovoltaic (PV) cells, which convert sunlight directly into electricity, can be integrated into devices (solar-powered calculators have been around since the 1970s) or buildings, or installed on exposed areas such as roofs. Concentrating solar power (CSP) uses mirrors or lenses to focus the sun’s rays onto a small area where the heat can be collected – for example to heat water, which can be used to generate electricity via a steam turbine or for direct heat. The same principle can be used on a small scale to cook food or boil water. Solar thermal collectors absorb heat from the sun and provide hot water. Combined with improved insulation and window architecture, direct sunshine can also be used to heat buildings.
For developing countries, many of which are in regions that receive the most sunlight, solar power is an especially important resource. Solar energy can generate power in rural areas, on islands, and other remote places “off-grid”.
One obvious drawback of solar power is that the supply varies. Photovoltaic cells don’t function after dark – although most electricity is consumed in daylight hours when sunshine also peaks – and are less effective on cloudy days. But energy storage is improving: CSP systems that can store energy in the form of heat - which can then be used to generate electricity - for up to 15 hours, are now at the design stage. This issue of variability can also be addressed by combining solar electricity with other renewable electricity sources.
“IF 0.3% OF THE SAHARA DESERT WAS
A CONCENTRATED SOLAR PLANT, IT
WOULD POWER ALL OF EUROPE”*
31WWF The Energy Report Page
© John E
. New
by / WW
F-Canon
32WWF The Energy Report Page
WIND ENERGY MIXPART 1: THE ENERGY REPORT
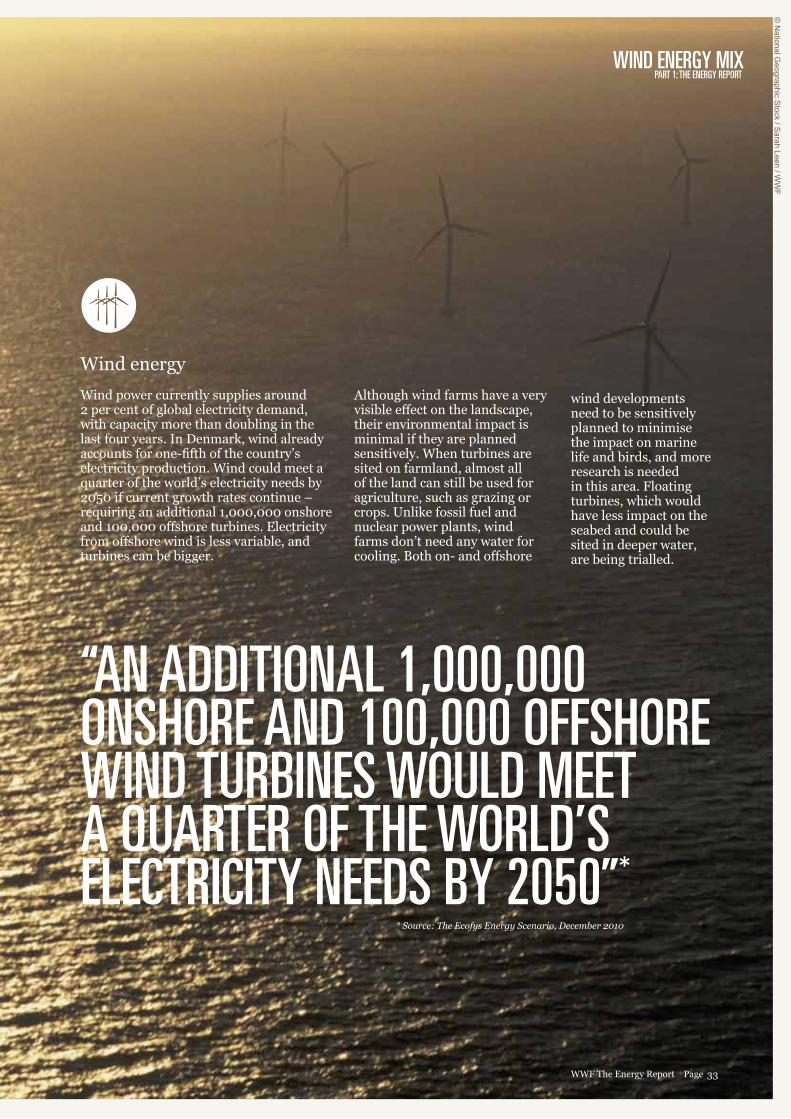
Wind energy
Wind power currently supplies around 2 per cent of global electricity demand, with capacity more than doubling in the last four years. In Denmark, wind already accounts for one-fifth of the country’s electricity production. Wind could meet a quarter of the world’s electricity needs by 2050 if current growth rates continue – requiring an additional 1,000,000 onshore and 100,000 offshore turbines. Electricity from offshore wind is less variable, and turbines can be bigger.
“AN ADDITIONAL 1,000,000 ONSHORE AND 100,000 OFFSHORE WIND TURBINES WOULD MEET A QUARTER OF THE WORLD’S ELECTRICITY NEEDS BY 2050”*
Although wind farms have a very visible effect on the landscape, their environmental impact is minimal if they are planned sensitively. When turbines are sited on farmland, almost all of the land can still be used for agriculture, such as grazing or crops. Unlike fossil fuel and nuclear power plants, wind farms don’t need any water for cooling. Both on- and offshore
wind developments need to be sensitively planned to minimise the impact on marine life and birds, and more research is needed in this area. Floating turbines, which would have less impact on the seabed and could be sited in deeper water, are being trialled.
33WWF The Energy Report Page
* Source: The Ecofys Energy Scenario, December 2010
© N
ational Geographic S
tock / Sarah Leen / W
WF
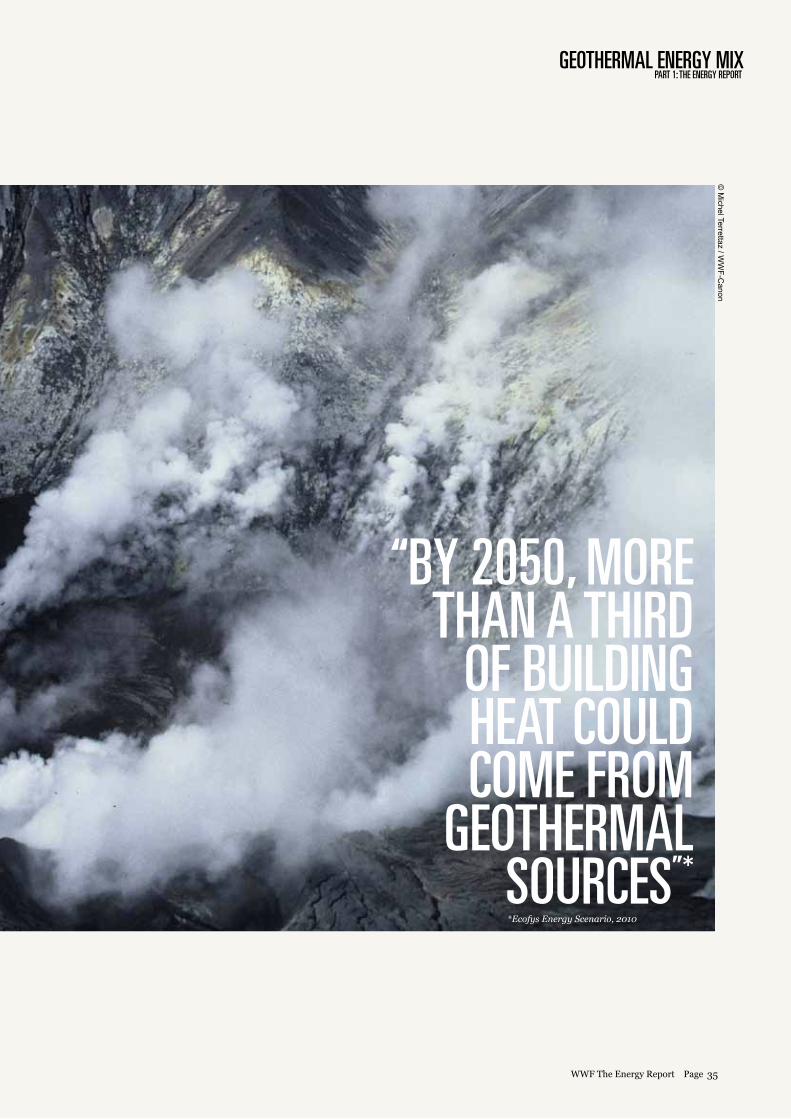
Geothermal energy
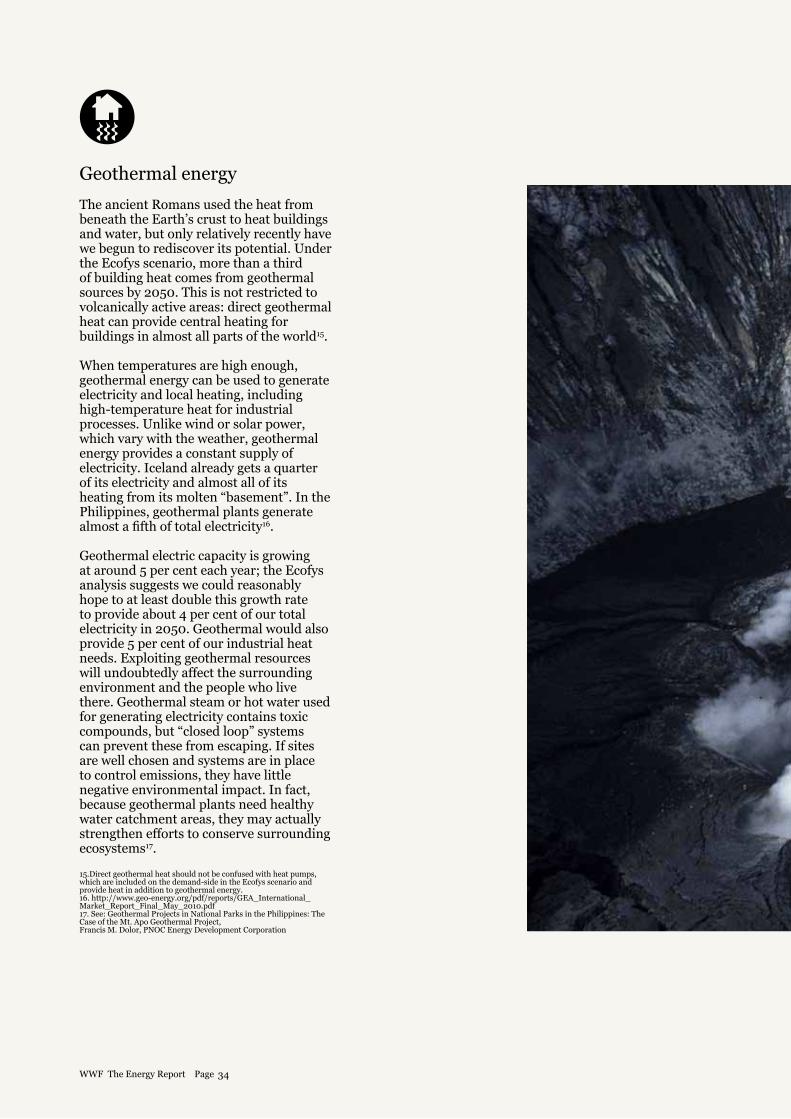
The ancient Romans used the heat from beneath the Earth’s crust to heat buildings and water, but only relatively recently have we begun to rediscover its potential. Under the Ecofys scenario, more than a third of building heat comes from geothermal sources by 2050. This is not restricted to volcanically active areas: direct geothermal heat can provide central heating for buildings in almost all parts of the world15.
When temperatures are high enough, geothermal energy can be used to generate electricity and local heating, including high-temperature heat for industrial processes. Unlike wind or solar power, which vary with the weather, geothermal energy provides a constant supply of electricity. Iceland already gets a quarter of its electricity and almost all of its heating from its molten “basement”. In the Philippines, geothermal plants generate almost a fifth of total electricity16.
Geothermal electric capacity is growing at around 5 per cent each year; the Ecofys analysis suggests we could reasonably hope to at least double this growth rate to provide about 4 per cent of our total electricity in 2050. Geothermal would also provide 5 per cent of our industrial heat needs. Exploiting geothermal resources will undoubtedly affect the surrounding environment and the people who live there. Geothermal steam or hot water used for generating electricity contains toxic compounds, but “closed loop” systems can prevent these from escaping. If sites are well chosen and systems are in place to control emissions, they have little negative environmental impact. In fact, because geothermal plants need healthy water catchment areas, they may actually strengthen efforts to conserve surrounding ecosystems17.
15.Direct geothermal heat should not be confused with heat pumps, which are included on the demand-side in the Ecofys scenario and provide heat in addition to geothermal energy. 16. http://www.geo-energy.org/pdf/reports/GEA_International_Market_Report_Final_May_2010.pdf 17. See: Geothermal Projects in National Parks in the Philippines: The Case of the Mt. Apo Geothermal Project, Francis M. Dolor, PNOC Energy Development Corporation
34WWF The Energy Report Page
GEOTHERMAL ENERGY MIXPART 1: THE ENERGY REPORT
*Ecofys Energy Scenario, 2010
“BY 2050, MORE THAN A THIRD
OF BUILDING HEAT COULD COME FROM
GEOTHERMAL SOURCES”*
35WWF The Energy Report Page
© M
ichel Terrettaz / WW
F-Canon
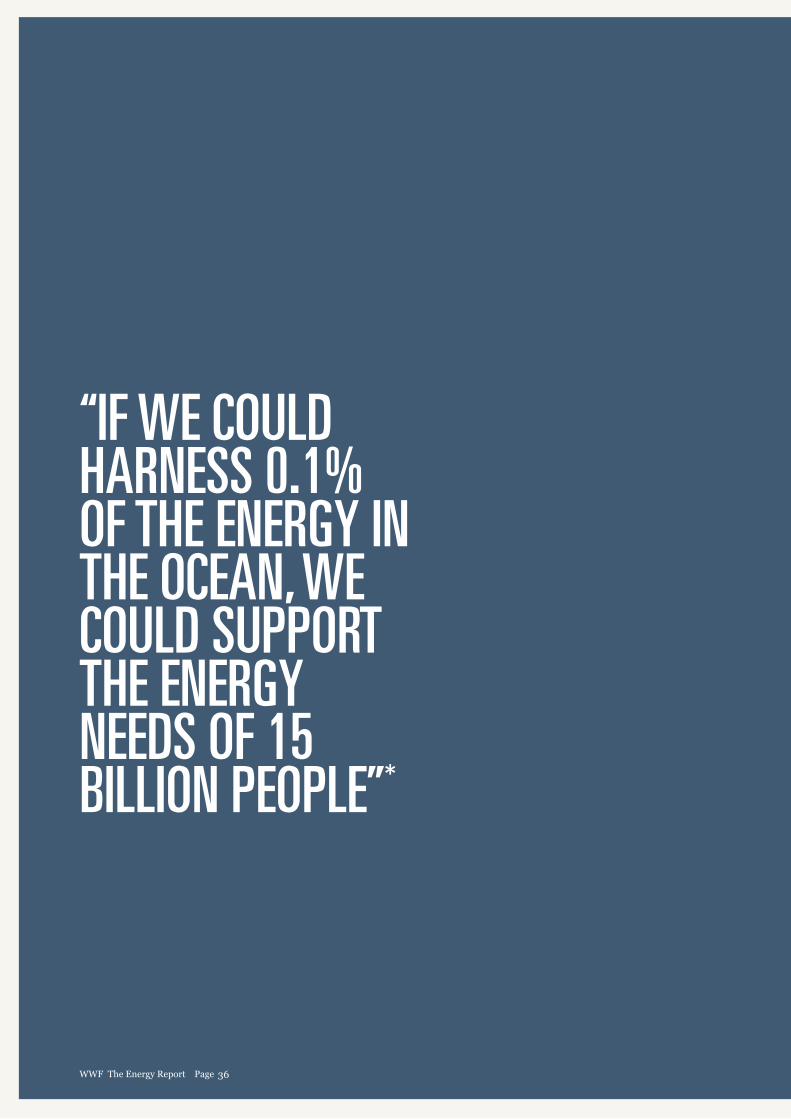
“IF WE COULD HARNESS 0.1% OF THE ENERGY IN THE OCEAN, WE COULD SUPPORT THE ENERGY NEEDS OF 15 BILLION PEOPLE”*
36WWF The Energy Report Page
OCEAN ENERGY MIXPART 1: THE ENERGY REPORT
* M.M. Bernitsas, et al., Vortex Induced Vibration Aquatic Clean Energy): A New Concept in Generation of Clean and Renewable Energy from Fluid Flow” OMAE ’06
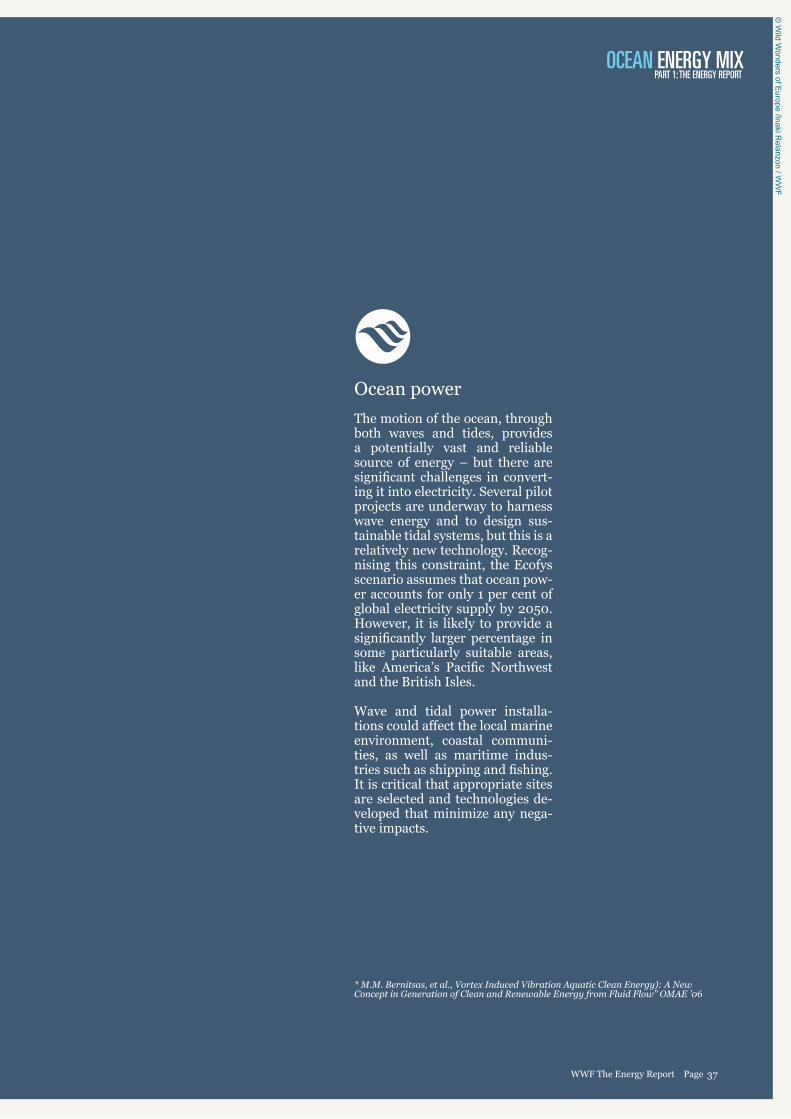
Ocean power
The motion of the ocean, through both waves and tides, provides a potentially vast and reliable source of energy – but there are significant challenges in convert-ing it into electricity. Several pilot projects are underway to harness wave energy and to design sus-tainable tidal systems, but this is a relatively new technology. Recog-nising this constraint, the Ecofys scenario assumes that ocean pow-er accounts for only 1 per cent of global electricity supply by 2050. However, it is likely to provide a significantly larger percentage in some particularly suitable areas, like America’s Pacific Northwest and the British Isles.
Wave and tidal power installa-tions could affect the local marine environment, coastal communi-ties, as well as maritime indus-tries such as shipping and fishing. It is critical that appropriate sites are selected and technologies de-veloped that minimize any nega-tive impacts.
37WWF The Energy Report Page
© W
ild Wonders of E
urope /Inaki Relanzon / W
WF
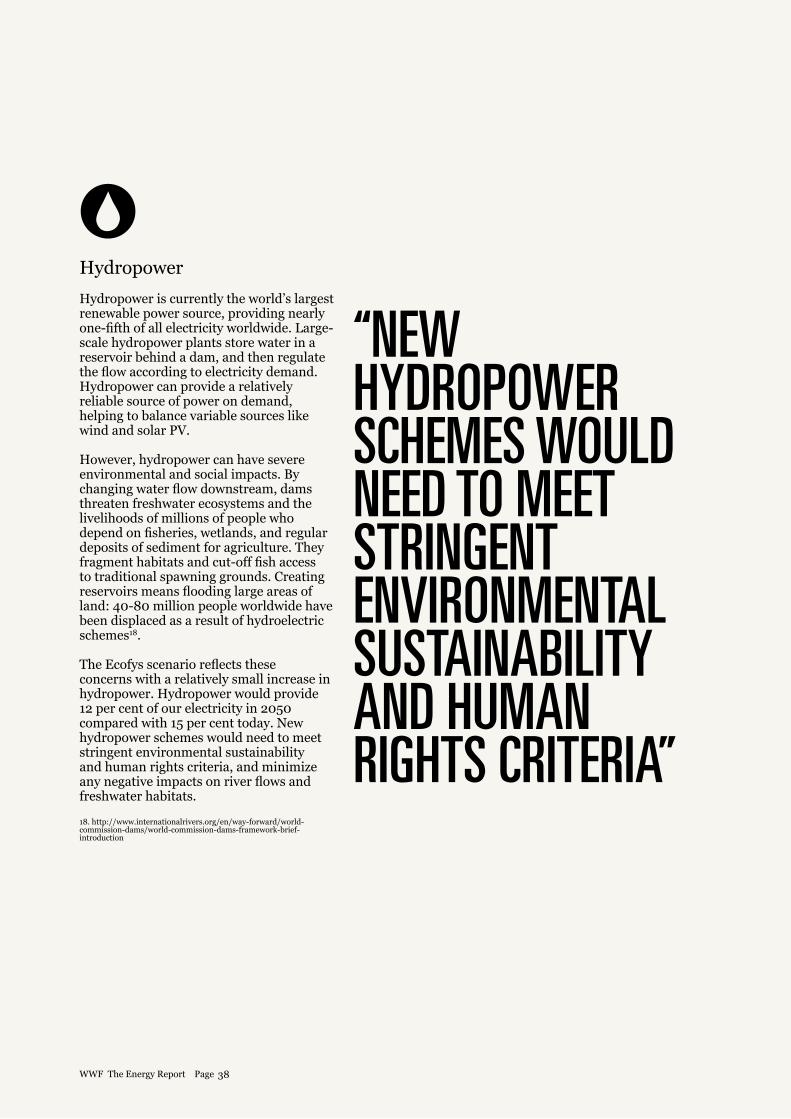
“NEW HYDROPOWER SCHEMES WOULD NEED TO MEET STRINGENT ENVIRONMENTAL SUSTAINABILITY AND HUMAN RIGHTS CRITERIA”
Hydropower
Hydropower is currently the world’s largest renewable power source, providing nearly one-fifth of all electricity worldwide. Large-scale hydropower plants store water in a reservoir behind a dam, and then regulate the flow according to electricity demand. Hydropower can provide a relatively reliable source of power on demand, helping to balance variable sources like wind and solar PV.
However, hydropower can have severe environmental and social impacts. By changing water flow downstream, dams threaten freshwater ecosystems and the livelihoods of millions of people who depend on fisheries, wetlands, and regular deposits of sediment for agriculture. They fragment habitats and cut-off fish access to traditional spawning grounds. Creating reservoirs means flooding large areas of land: 40-80 million people worldwide have been displaced as a result of hydroelectric schemes18.
The Ecofys scenario reflects these concerns with a relatively small increase in hydropower. Hydropower would provide 12 per cent of our electricity in 2050 compared with 15 per cent today. New hydropower schemes would need to meet stringent environmental sustainability and human rights criteria, and minimize any negative impacts on river flows and freshwater habitats.
18. http://www.internationalrivers.org/en/way-forward/world-commission-dams/world-commission-dams-framework-brief-introduction
38WWF The Energy Report Page

HYDRO ENERGY MIXPART 1: THE ENERGY REPORT
39WWF The Energy Report Page
© H
artmut Jungius / W
WF-C
anon
Bio energy
Energy from biomass – materials derived from living or recently living organisms, such as plant materials or animal waste – is potentially the most challenging part of the Ecofys scenario. Bioenergy comes from a large variety of sources and is used in many different ways. Wood and charcoal have traditionally provided the main source of fuel for cooking and heating for hundreds of millions of people in the developing world. More recently, biofuels have begun to replace some petrol and diesel in vehicles.
In principle, biomass is a renewable resource – it is possible to grow new plants to replace the ones we use. Greenhouse gas emissions are lower than from fossil fuels, provided there is enough regrowth to absorb the carbon dioxide released, and good management practices are applied. Bioenergy also has potential to provide sustainable livelihoods for millions of people, particularly in Africa, Asia and Latin America. However, if produced unsustainably its environmental and social impacts can be devastating. We need comprehensive policies and mandatory certification to ensure bioenergy is produced to the highest standards.
Although the Ecofys scenario favours other renewable resources wherever possible, there are some applications where bioenergy is currently the only suitable replacement for fossil fuels. Aviation, shipping and long-haul trucking require liquid fuels with a high energy density; they cannot, with current technology and fuelling infrastructure, be electrified or powered by hydrogen. Some industrial processes, such as steel manufacturing, require fuels not only for their energy content, but as feedstocks with specific material properties. By 2050, 60 per cent of industrial fuels and heat will come from biomass. 13 per cent of building heat will come from biomass and some biomass will still be needed in the electricity mix (about 13 per cent), for balancing purposes with other renewable energy technologies.
We can derive a significant proportion of the bioenergy needs in the Ecofys scenario from products that would otherwise go to waste. These include some plant residues from agriculture and food processing; sawdust and residues from forestry and wood processing; manure; and municipal
waste. Using these resources up to a sustainable level has other environmental benefits, such as cutting methane and nitrogen emissions and water pollution from animal slurry, and reducing the need for landfill. In developing countries, more than 30 million households have their own biogas digesters for cooking and lighting. Some residues and waste products are already used, for example as soil conditioners; the Ecofys scenario accounts for these. The second major source of biomass comes from forests. According to the Ecofys scenario, we will need more than 4.5 billion cubic metres of wood products for energy purposes by 2050 coming from harvesting and processing residues, wood waste and “complementary fellings” – the difference between the amount of wood we use and the maximum amount that we could sustainably harvest in forests that are already used commercially. This is preferable to taking wood from virgin forests and disturbing important habitats, although more intensive forestry is bound to affect biodiversity. In addition, some of the biomass traditionally used for heating and cooking in the developing world, which will largely be replaced by renewable energy sources such as solar energy, can also be used for more efficient bioenergy uses. All the same, meeting demand sustainably will be a huge challenge.
Bioenergy crops provide a possible source of liquid fuel – either vegetable oils from plants such as rapeseed, or in the form of ethanol derived from crops high in sugar, starch or cellulose. The Ecofys scenario suggests we will need around 250 million hectares of bioenergy crops – equal to about one-sixth of total global cropland – to meet projected demand. This has the potential to cause
deforestation, food and water shortages, and other social and environmental impacts, so must be considered with utmost care.
With an expected 2 billion more mouths to feed by 2050, it is vital that increased biofuel cultivation does not use land and water that is needed to grow food for people or to sustain biodiversity. This is no easy challenge. While Ecofys has applied a series of safeguards in its analysis, land and water implications of bioenergy feedstock production will need further research, especially at the landscape level.
A possible long-term alternative source of high-density fuel included in this scenario is algae. Algae can be grown in vats of saltwater or wastewater on land not suitable for agriculture. Large-scale cultivation of algae for biofuel is currently in development. In the Ecofys scenario, algae begins to appear as a viable energy source around 2030, and only a fraction of its potential is included by 2050.
The apparent need for large amounts of land for bioenergy is the aspect of the Ecofys scenario that produces the hardest challenges and raises the hardest questions. We will discuss these further on pages 60-61.
40WWF The Energy Report Page
© naturepl.com
/ Tim Lam
an / WW
F
BIOENERGY MIXPART 1: THE ENERGY REPORT
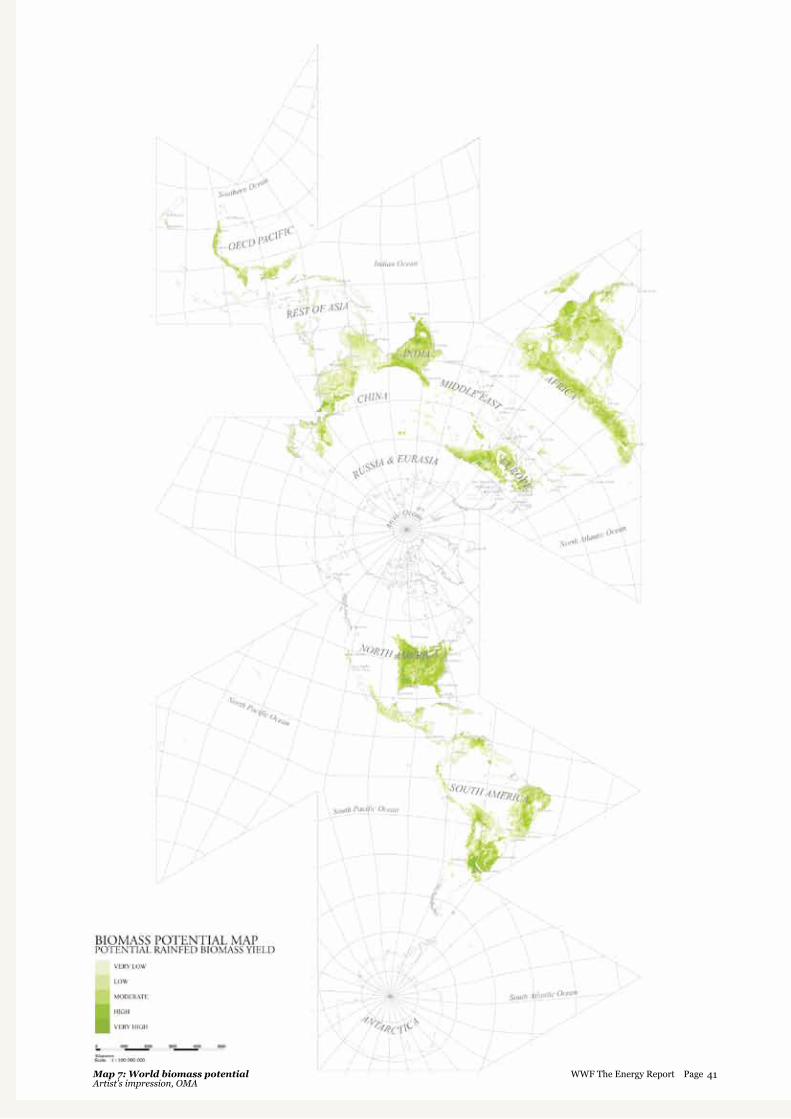
Map 7: World biomass potentialArtist’s impression, OMA
41WWF The Energy Report Page

THE CHAL-LENGES AHEAD
42WWF The Energy Report Page

CHALLENGES AHEADPART 1: THE ENERGY REPORT
THE CHALLENGES AHEADThe Ecofys analysis shows that the world can technically meet its energy needs from renewable sources by 2050. But it throws up some difficult challenges – and not just technical ones. The social, environmental, economic and political issues this report raises are equally pressing.
On the technical side, two key factors will enable the world to meet its energy needs from renewable sources: (i) We need to reduce demand by improving energy efficiency and reducing wasteful use of energy; and (ii) because electricity and heat are the forms of energy most easily generated by renewables, we need to maximize the use of electricity and direct heat, with improvements to electricity grids to support this.
A sustainable energy future must be an equitable one. Its impact on people and nature will greatly depend on the way we use our land, seas and water resources. Changes in lifestyle also have a critical role to play.
Moving to a renewable future will mean rethinking our current finance systems. It will also require innovation.
Local, national and regional governance will need to be greatly strengthened to secure an equitable energy future. We need international cooperation and collaboration on an unprecedented level to bridge the gap between the energy-rich and energy-poor, both within and between countries.
These challenges are outlined on the following pages.
THE CHAL-LENGES AHEAD
43WWF The Energy Report Page
© S
imon de TR
EY-W
HITE
/ WW
F-UK
ENERGY CONSERVATIONHow can we do more while using less energy?
Under the Ecofys scenario, global energy demand in 2050 is 15 per cent lower than in 2005. This is in striking contrast to “business-as-usual” projections, which predict energy demand will at least double. This difference is not based on any reduction in activity – industrial output, domestic energy use, passenger travel and freight transport continue to grow, particularly in developing countries. Instead, reductions come from using energy as efficiently as possible.
Energy conservation is one of the prerequisites of a future powered by renewables. We will not be able to meet the needs of our planet’s expected nine billion inhabitants if we continue to use it as wastefully as we do today. It is the single most important element in the Ecofys scenario.
In every sector, solutions already exist that can deliver the massive energy savings we need. The challenge will be in rolling them out on a global scale as soon as possible.
In manufacturing, using recycled materials greatly reduces energy consumption. For example, making new products from recovered aluminium instead of primary aluminium cuts total energy use by more than two-thirds. Stocks of materials that take a lot of energy to produce, such as steel and aluminium, have grown over the past decades, making recycling and reusing materials increasingly viable. Finding alternatives to materials that take the most energy to produce, such as cement and steel, will mean further energy savings.
Product design also has considerable implications for energy use. Making cars with lighter (although not weaker) frames and with new materials, for example, and producing smaller cars reduces both the need for energy-intensive steel in manufacturing and their fuel consumption. Despite some very innovative models on markets already, there is still huge potential to tap into much higher efficiency levels for all energy-hungry appliances.
In the developing world, more than 160 million households now use improved biomass cooking stoves. Simply using a ceramic lining instead of an all-metal design can improve efficiency by up to a half. The stoves cost little, reduce carbon emissions and deforestation from charcoal production, and have immense health benefits. Even more efficient are solar cookers, which simply use and concentrate the heat from the sun. Distributed widely enough, these small-scale solutions add up to a significant reduction in energy demand.
The world already has the architectural and construction expertise to create buildings that require almost no conventional energy for heating or cooling, through airtight construction, heat pumps and sunlight. The Ecofys scenario foresees all new buildings achieving these standards by 2030.
At the same time, we need to radically improve the energy efficiency of our existing buildings. We could reduce heating needs by 60 per cent by insulating walls, roofs and ground floors, replacing old windows and installing ventilation systems that recover heat. Local solar thermal systems and heat pumps would fulfil the remaining heating and hot water needs. For all buildings to meet these energy efficiency standards by 2050, we will need to retrofit 2-3 per cent of floor area every year. This is ambitious, but not impossible – Germany has already achieved annual retrofit rates in this range.
The world will also need to use less energy for transport. That means making more fuel-efficient models of all forms of transport, and operating them more effectively. Improved air traffic management could reduce congestion and allow planes to follow more efficient routes and landing approaches, making a small but significant reduction in aviation fuel demands. Similarly, better port, route and weather planning, along with reduced speeds, can significantly reduce fuel use in cargo ships.
But we will also need to move to more efficient modes of transport; making greater use of buses, bikes, trams and trains, sending more freight by rail and sea, and swapping short-haul flights for high-speed trains. Indeed, WWF would argue that we need to go further than this, by reducing the number and length of journeys we need to take – by improving urban planning, logistics and communication technology, and reassessing our priorities.
The more energy we save, the easier the task of moving to a renewable energy future will become. It is one area where everyone can play a part.
44WWF The Energy Report Page
ENERGY CONSERVATIONPART 1: THE ENERGY REPORT
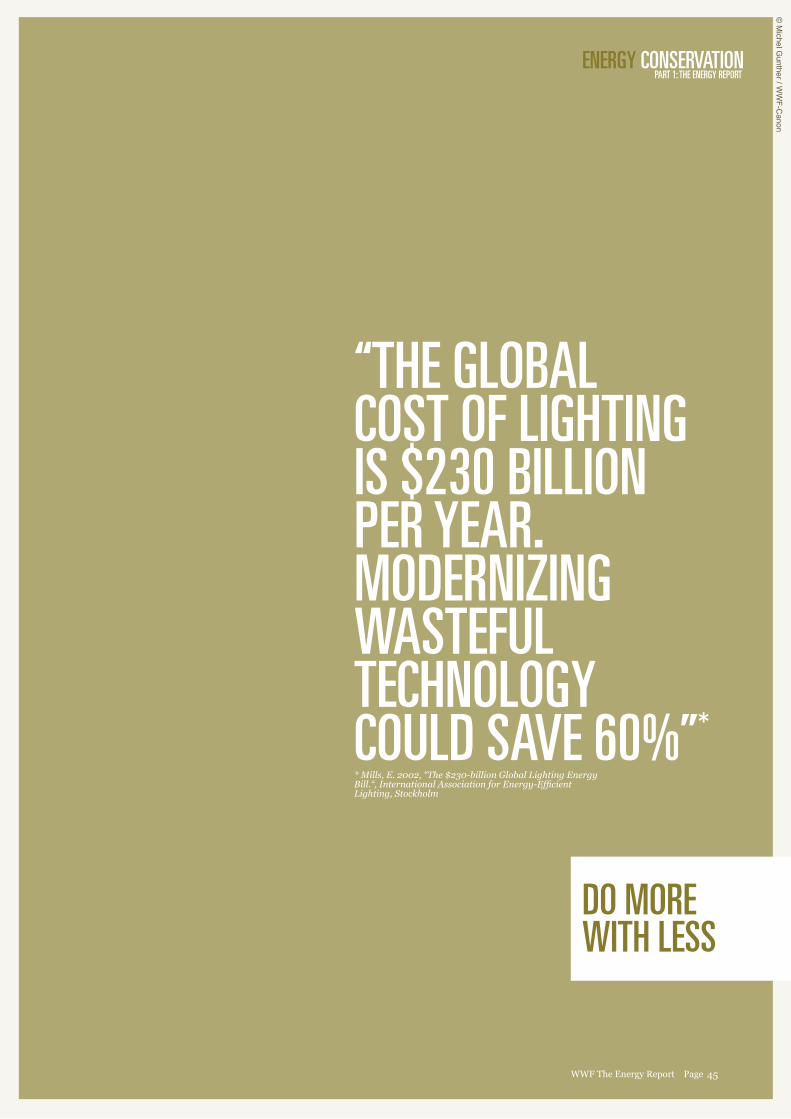
“THE GLOBAL COST OF LIGHTING IS $230 BILLION PER YEAR. MODERNIzING WASTEFUL TECHNOLOGY COULD SAVE 60%”** Mills, E. 2002, “The $230-billion Global Lighting Energy Bill.“, International Association for Energy-Efficient Lighting, Stockholm
45WWF The Energy Report Page
DO MORE WITH LESS
© M
ichel Gunther / W
WF-C
anon
“ENERGY EFFICIENCY AND RENEWABLE ENERGY CAN REDUCE OUR DEPENDENCE ON FOSSIL FUELS BY 70% BY 2040”** The Ecofys Energy Scenario, December 2010
46WWF The Energy Report Page
© N
ational Geographic S
tock/ Jim R
ichardson / WW
F
WHAT NOW?• We must introduce legally binding minimum efficiency standards worldwide for all products that consume energy, including buildings, along the lines of the Japanese “Top Runner” scheme and the European EcoDesign requirements. Governments, companies and experts will need to agree standards based on Best-Available-Technology (BAT) benchmarks, which should be monitored and strengthened regularly.
• Energy conservation should be built into every stage of product design. Wherever possible we should use energy-efficient, highly-durable and recyclable materials. Alternatives to materials like cement, steel and plastic that take a lot of energy to produce should be a focus for research and development. We should adopt a “cradle to cradle” design philosophy, where all of a product’s components can be reused or recycled once it reaches the end of its life.
• We need strict energy-efficiency criteria for all new buildings, aiming toward near-zero energy use, equivalent to “Passive House” standards. Retrofitting rates must increase quickly to improve the energy efficiency of existing buildings. Governments must provide legislation and incentives to enable this.
• Energy taxation is a realistic option, particularly in wealthier countries. Taxes on petrol, electricity and fuels are already commonplace. Shifting taxes to products and cars that use more energy will help to steer demand toward more efficient alternatives.
• Developing countries must phase-out the inefficient use of traditional biomass, and pursue alternatives such as improved biomass cooking stoves, solar cookers and small-scale biogas digesters. Industrialized countries should facilitate this by providing financial assistance, as part of international development commitments and global efforts to reduce greenhouse gas emissions.
• Substantial investment is needed into public transport to provide convenient and affordable energy-efficient alternatives to private cars. We particularly need to improve rail infrastructure: high-speed trains, powered by electricity from renewable sources, should
replace air travel as much as possible, and a maximum proportion of freight should be delivered by rail. Sustainable and public transport modes for all distances, particularly for rail-based transport, must be made cheaper than road- and air-borne traffic.
• Individuals, businesses, communities and nations all need to be more aware of the energy they use, and try to save energy wherever possible. Driving more slowly and smoothly, buying energy-efficient appliances and switching them off when not in use, turning down heating and air conditioning, and increased reusing and recycling are just some ways to make a contribution.
ENERGY CONSERVATIONPART 1: THE ENERGY REPORT
47WWF The Energy Report Page
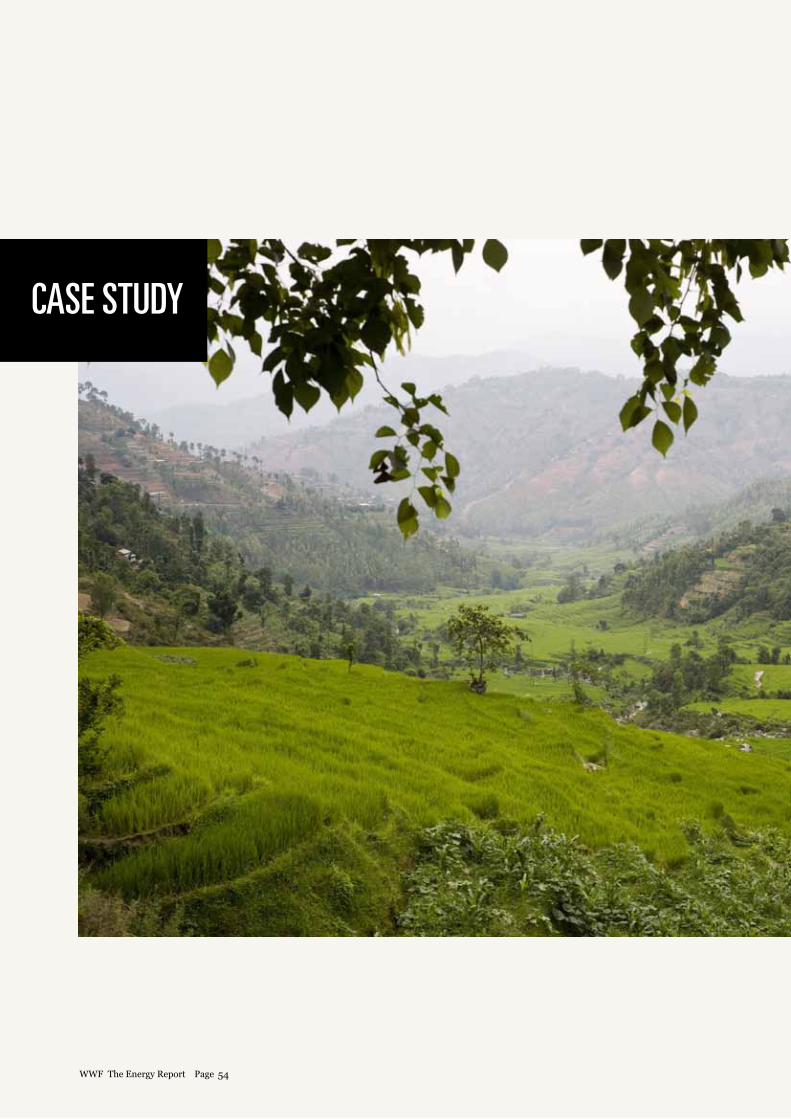
CASE STUDY
48WWF The Energy Report Page
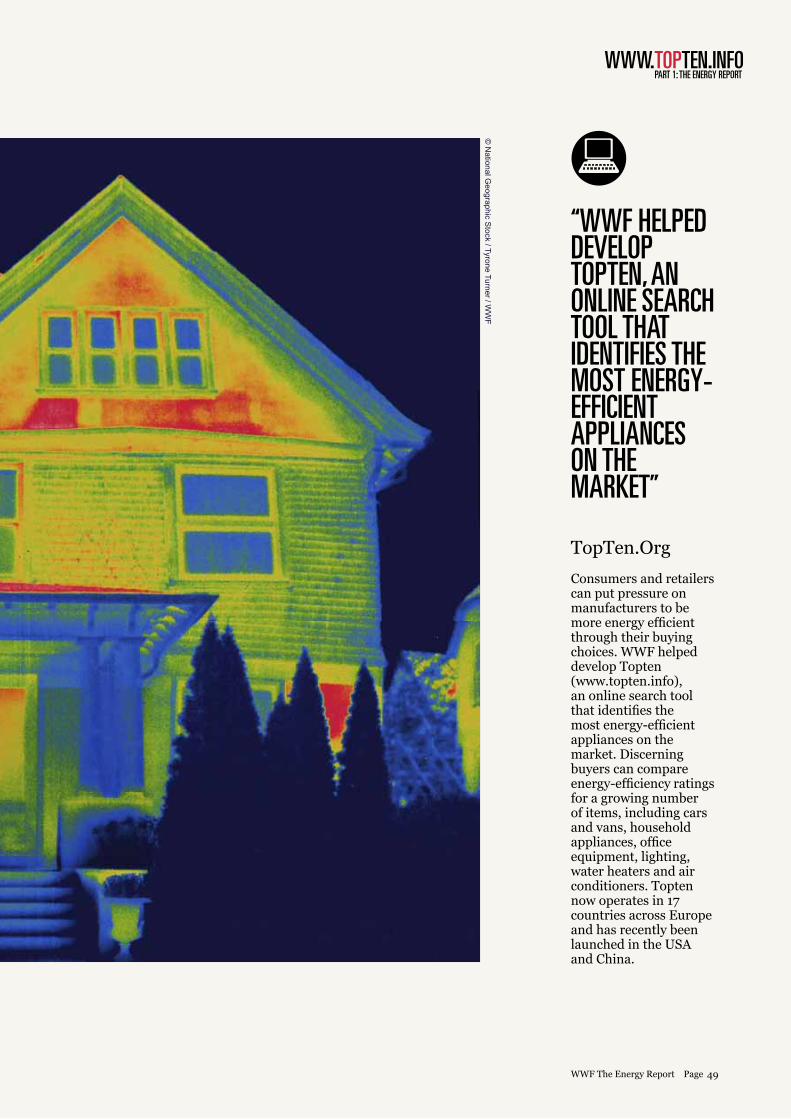
Figure XX.XX
WWW.TOPTEN.INFO
“WWF HELPED DEVELOP TOPTEN, AN ONLINE SEARCH TOOL THAT IDENTIFIES THE MOST ENERGY-EFFICIENT APPLIANCES ON THE MARkET”
PART 1: THE ENERGY REPORT
TopTen.Org
Consumers and retailers can put pressure on manufacturers to be more energy efficient through their buying choices. WWF helped develop Topten (www.topten.info), an online search tool that identifies the most energy-efficient appliances on the market. Discerning buyers can compare energy-efficiency ratings for a growing number of items, including cars and vans, household appliances, office equipment, lighting, water heaters and air conditioners. Topten now operates in 17 countries across Europe and has recently been launched in the USA and China.
49WWF The Energy Report Page
© N
ational Geographic S
tock / Tyrone Turner / WW
F
50WWF The Energy Report Page
© N
igel Dickinson / W
WF-C
anon
WWF suggests white borders and background
ELECTRIFICATIONPART 1: THE ENERGY REPORT
ELECTRIFICATIONRenewable sources could provide effectively unlimited power, but how do we switch onto them?
The Ecofys scenario for a renewable energy future depends upon using electrical power from clean, renewable sources in place of fossil fuels and nuclear wherever possible. Currently, electricity makes up less than one-fifth of our total final energy demand; by 2050, under the Ecofys scenario, it accounts for almost half. Cars and trains, for example, will become fully electrified, while other energy uses (such as fuel to heat buildings) will be minimized.
Using more renewable electricity presents several challenges. First, of course, we need to generate it. That will mean massively increasing our capacity to produce power from the renewable resources with the least environmental impact – through wind, solar and geothermal power technologies in particular. While we will need many more large-scale renewable power plants, we will also generate more power at a local level, using solar PV roof tiles, water wheels and individual wind turbines, for example.
We are going to need massive investment to extend and modernize our electricity grids to cope with increased loads and different energy sources. We need to transmit power efficiently from offshore wind turbines, desert solar parks or remote geothermal plants to urban centres – while minimizing the impact of new power lines or subterranean cables. Efficient international networks will also help balance variable renewable sources from different regions. Within Europe, for example, wind and ocean power from the North Sea area could complement Alpine hydropower and solar power from the Mediterranean and even North Africa.
While solar and wind have the potential to supply an effectively unlimited amount of power, this is constrained by the capacity
of electricity grids to deliver it. Our existing grid infrastructure can only manage a limited amount of these variable, supply-driven sources. Grids need to keep electrical voltage and frequency steady to avoid dangerous power surges, and need the capacity to meet peaks in demand. Today, we keep some power stations, notably coal and nuclear, working around the clock to provide a permanent supply of electricity (or “base load”). These power stations cannot simply be switched-off when renewable energy supplies are high, meaning some of this energy goes to waste.
The Ecofys analysis estimates that networks in industrialized countries could take about 20-30 per cent of total electricity from variable sources without further modernization. At a conservative estimate, this will rise to 60 per cent by 2050 through improvements in technology and grid management. The other 40 per cent would come from hydropower, biomass, geothermal electricity and CSP with storage.
The combination of large (“super”) and “smart” grids holds the key. Power companies and consumers will get information on energy supply, and price, to help manage demand. Put simply, it will be cheaper to run your washing machine when the wind is blowing or the sun is shining. Households, offices or factories would programme smart meters to operate certain appliances or processes automatically when power supplies are plentiful. Utility companies would
adjust electricity flow – for example, by tweaking thermostat temperatures – to cope with spikes in demand. We could also take advantage of times when supply outstrips demand to charge car batteries and to generate hydrogen fuel.
At the same time, we need to bring electricity to those who are not connected to the grid – particularly in rural areas in developing countries. We can do this by extending existing grids, or generating power at the household or community level through solar, micro-hydro, wind power or small-scale biomass plants. Providing the 1.4 billion who have no reliable electricity19 with a basic supply of 50-100 kWh per year would require investments of about €25 billion per year between now and 203020 , or 0.05 per cent of global GDP.
The electricity networks that power our world are one of the great engineering feats of the 20th century. The work we need to do to modernize them over the coming decades will be one of the great feats of the 21st.
19. IEA, World Energy Outlook (WEO), 2010, Paris .20. IEA, World Energy Outlook (WEO), 2009, Paris
51WWF The Energy Report Page
WHAT NOW?• We need to massively expand our capacity for generating electricity from renewable resources. Large-scale renewable power plants need to be built, before we divert investment into building a new generation of costly and unsustainable fossil fuel and nuclear power plants that could set us back decades. We also need to support local micro-generation, especially in areas where people have limited or no connection to electricity grids.
• Countries need to work together to extend electricity networks to bring power from centres of production to centres of consumption as efficiently as possible. International networks will help meet demand by balancing variable power sources (such as solar PV and wind), supported by constant sources (geothermal, stored CSP, hydro, biomass).
• We need urgent investment into smart grids to help manage energy demand and allow for a significantly higher proportion of electricity to come from variable and decentralized sources. This will help energy companies balance supply and demand more efficiently, and enable consumers to make more informed choices about their electricity use.
• More research is needed into efficient ways to store energy, including batteries, hydrogen and heat storage for solar power. We also need efficient grid management to release this energy when it is needed, and dispatch it over large distances.
• By 2050, all cars, vans and trains globally should run on electricity. We need legislation, investment and incentives to encourage manufacturers and consumers to switch to electric cars. Improvements in battery technology, and emergence of efficient fuel cells, could allow us to run electric trucks, and possibly even ships, reducing our dependence on biofuels. This is a long-term aim, but research and development is needed now.
52WWF The Energy Report Page
© A
dam O
swell / W
WF-C
anon
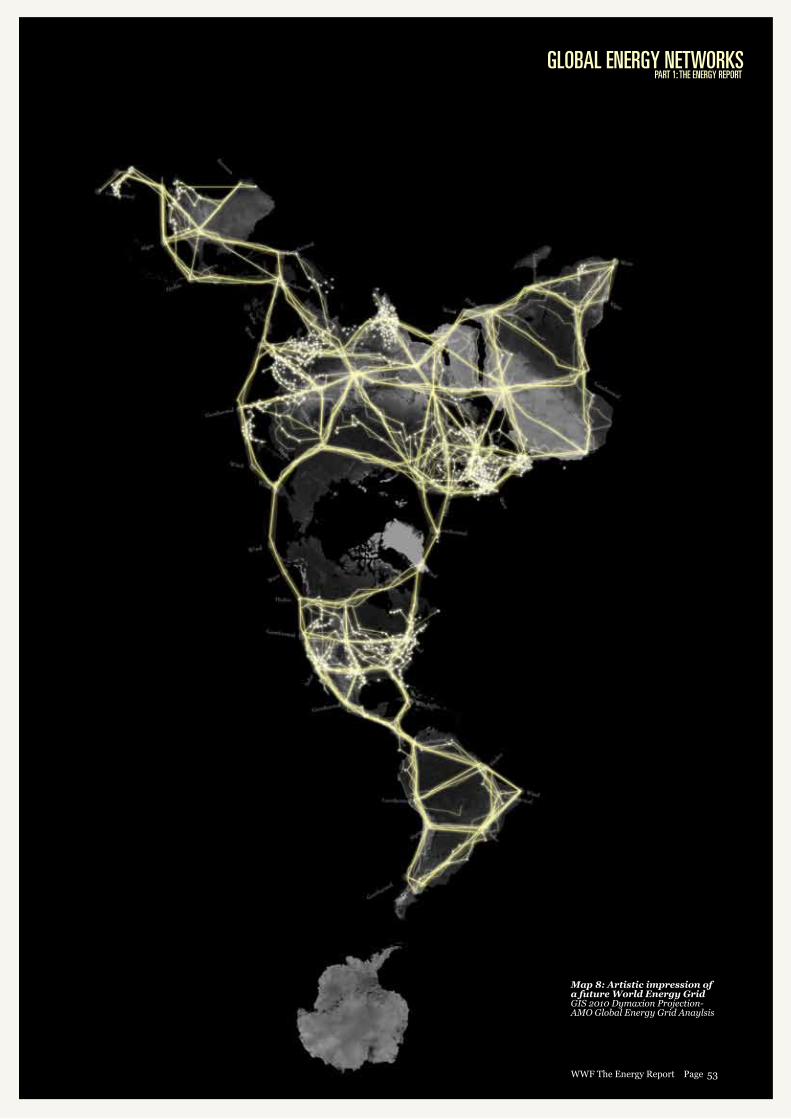
GLOBAL ENERGY NETWORkSPART 1: THE ENERGY REPORT
Map 8: Artistic impression of a future World Energy GridGIS 2010 Dymaxion Projection- AMO Global Energy Grid Anaylsis
53WWF The Energy Report Page
CASE STUDY
54WWF The Energy Report Page
MICRO-HYDROELECTRICITYPART 1: THE ENERGY REPORT
“WWF INSTALLED A MICRO-HYDROELECTRICITY SYSTEM AS THE DEMAND FOR WOOD FOR COOkING AND HEATING WAS LEADING TO DEFORESTATION IN THE AREA”
© S
imon de TR
EY-W
HITE
/ WW
F-UK
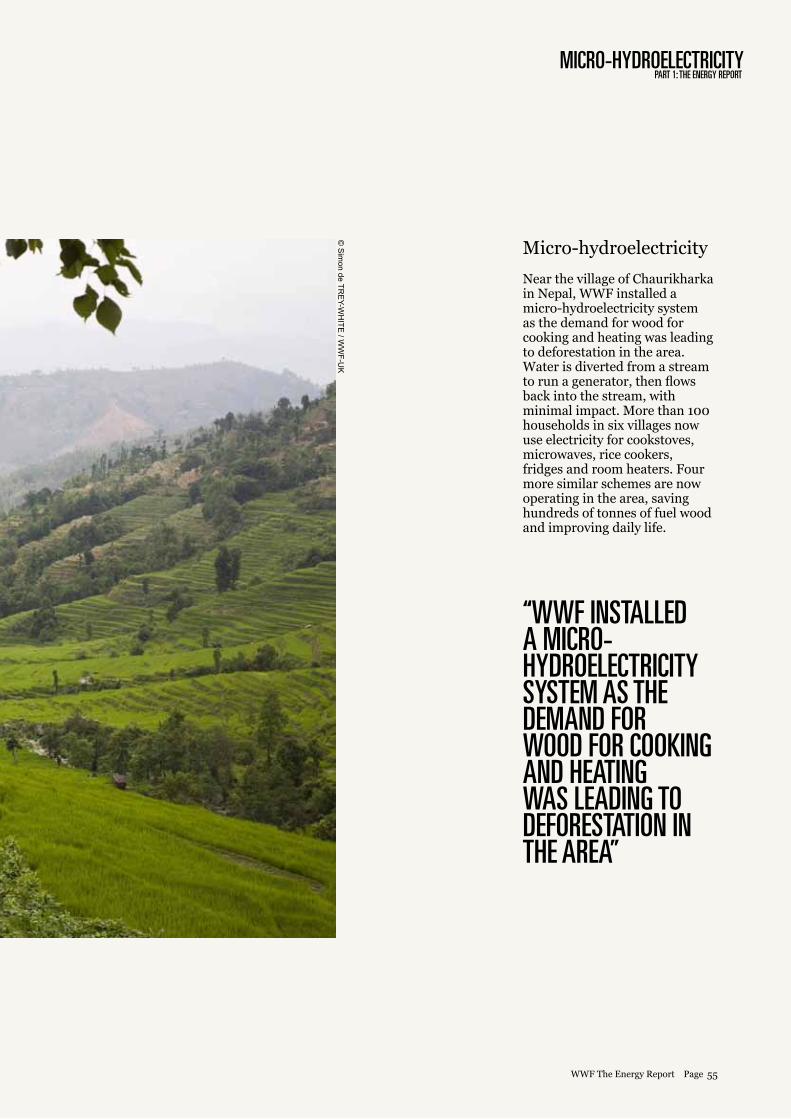
Micro-hydroelectricity
Near the village of Chaurikharka in Nepal, WWF installed a micro-hydroelectricity system as the demand for wood for cooking and heating was leading to deforestation in the area. Water is diverted from a stream to run a generator, then flows back into the stream, with minimal impact. More than 100 households in six villages now use electricity for cookstoves, microwaves, rice cookers, fridges and room heaters. Four more similar schemes are now operating in the area, saving hundreds of tonnes of fuel wood and improving daily life.
55WWF The Energy Report Page
EQUITYEveryone has the right to energy. So how are we going to provide it?
Historically, the world’s energy consumption has not been fairly balanced. Rich countries have built their economies on cheap, plentiful fossil fuels, and continue to consume the vast majority of global energy supplies. With fossil fuel supplies dwindling, the rest of the world will not have this resource to fuel its own development. Adding to this inequity, poorer countries will suffer most from climate change, which is largely driven by the fossil fuel use of wealthier countries.
A sustainable energy future must be a fair one, in which the equal right of every person to benefit from the world’s energy resources is recognized. The scale of the challenge is daunting. Around 1.4 billion people – a fifth of the world’s population – have no access to reliable electricity21. And the population of developing countries continues to rise rapidly. Investments required for universal access to clean cooking for those 2.7 billion in developing countries who have no access to these services will be around €43 billion in total, or around €2 billion annually between 2010 and 2030, less than 0.005 per cent of global GDP22.
In the absence of alternative sources of energy, hundreds of millions of people today use biomass as their primary source of fuel for cooking and heating. As a result, trees are cut down at unsustainable rates, leading to biodiversity loss, increasing carbon emissions, harming soil quality and leaving communities vulnerable to flooding. Biomass stoves are also a major health problem. Fumes from traditional cooking fires kill almost as many people in the developing world than malaria23 – about two million women and children die prematurely each year from indoor pollution.
To move to a fully renewable future, in which people live in harmony with nature, we must end unsustainable biomass use. But we cannot do this without providing people with better alternatives. Efficient cookstoves are one simple, cost-effective
way to significantly reduce the amount of biomass people use, and the carbon and “black soot” emissions and health impacts this causes. Planting fast-growing tree species for energy production also reduces the need to cut down or degrade primary forests – WWF’s New Generation Plantation Initiative outlines sustainable management practices for doing this. These are, though, only part of the solution.
From solar power across Africa, to geothermal power in Indonesia, developing countries have great potential to power economic growth with renewable energy. Large-scale wind, solar and geothermal plants are beginning to appear. Renewables also offer hope to the hundreds of millions of people trapped in energy poverty. WWF is just one of many organizations helping to develop renewable energy projects across the developing world – particularly in rural areas, where approximately 85 per cent of people who have no access to reliable electricity live. As a result of these initiatives, thousands of communities now benefit from electricity from solar power, wind turbines, micro-hydro, and biogas plants fuelled by farming residues and manure.
Access to reliable energy can make a phenomenal difference. Electric pumps provide clean water. Refrigerators store food and medicines. Farms run more productively. Women who used to spend many hours every day collecting firewood and water have more time to devote to education, childcare or advancing their own livelihoods. Children get a better education through access to learning resources like the Internet, or simply
by having electric lighting to read in the evenings. Historically, women’s emancipation, better education and secure livelihoods have coincided with increased family incomes and hence falling birth rates, so access to sustainable renewable energy can also contribute to curbing population growth.
Biofuels can offer opportunities for developing countries – but they also pose a threat. Grown sustainably and traded fairly, they can provide a valuable cash crop for farmers and jobs for local communities. Without proper safeguards, however, they may displace food crops and drive deforestation, as well as compete for increasingly scarce water. We cannot abide a situation where developing countries grow large amounts of biofuel crops to support the lifestyles of the rich, while their own people do not have enough food to eat.
Renewable energy has tremendous potential to end poverty and transform lives for hundreds of millions of people. Ending energy poverty is at the heart of our energy vision.
56WWF The Energy Report Page
EQUITYPART 1: THE ENERGY REPORT
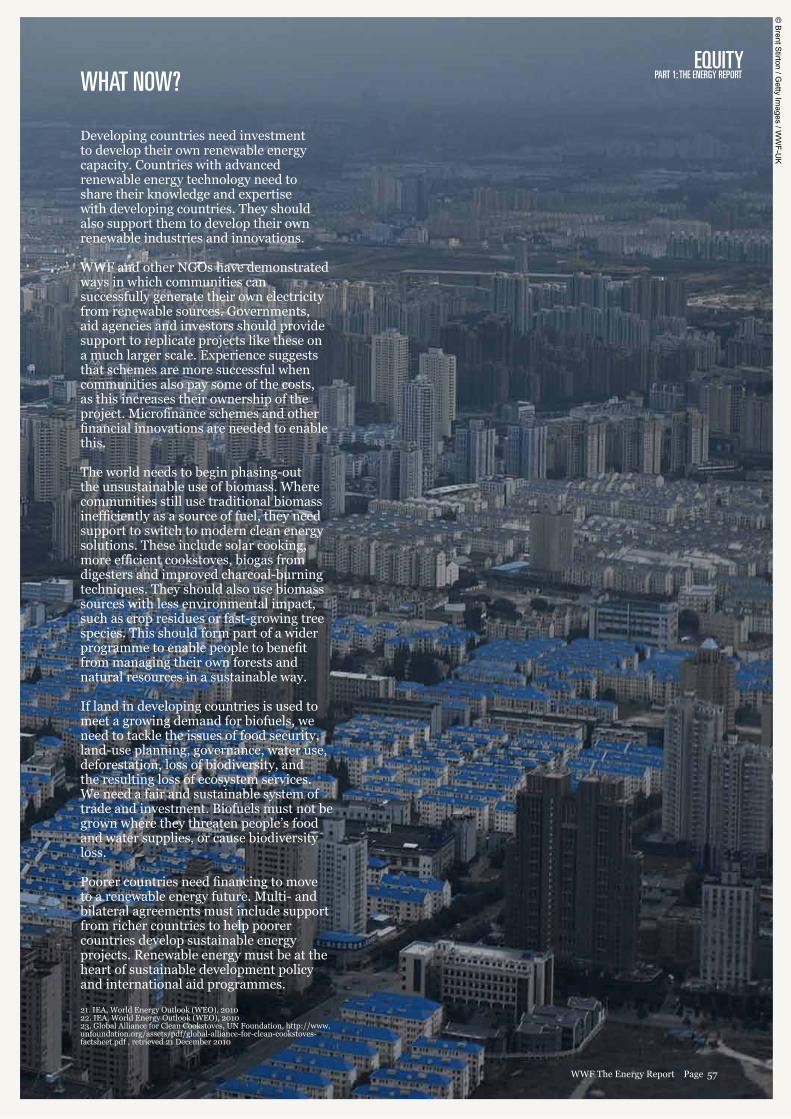
Developing countries need investment to develop their own renewable energy capacity. Countries with advanced renewable energy technology need to share their knowledge and expertise with developing countries. They should also support them to develop their own renewable industries and innovations.
WWF and other NGOs have demonstrated ways in which communities can successfully generate their own electricity from renewable sources. Governments, aid agencies and investors should provide support to replicate projects like these on a much larger scale. Experience suggests that schemes are more successful when communities also pay some of the costs, as this increases their ownership of the project. Microfinance schemes and other financial innovations are needed to enable this.
The world needs to begin phasing-out the unsustainable use of biomass. Where communities still use traditional biomass inefficiently as a source of fuel, they need support to switch to modern clean energy solutions. These include solar cooking, more efficient cookstoves, biogas from digesters and improved charcoal-burning techniques. They should also use biomass sources with less environmental impact, such as crop residues or fast-growing tree species. This should form part of a wider programme to enable people to benefit from managing their own forests and natural resources in a sustainable way.
If land in developing countries is used to meet a growing demand for biofuels, we need to tackle the issues of food security, land-use planning, governance, water use, deforestation, loss of biodiversity, and the resulting loss of ecosystem services. We need a fair and sustainable system of trade and investment. Biofuels must not be grown where they threaten people’s food and water supplies, or cause biodiversity loss.
Poorer countries need financing to move to a renewable energy future. Multi- and bilateral agreements must include support from richer countries to help poorer countries develop sustainable energy projects. Renewable energy must be at the heart of sustainable development policy and international aid programmes.
21. IEA, World Energy Outlook (WEO), 201022. IEA, World Energy Outlook (WEO), 201023. Global Alliance for Clean Cookstoves, UN Foundation, http://www.unfoundation.org/assets/pdf/global-alliance-for-clean-cookstoves-factsheet.pdf , retrieved 21 December 2010
WHAT NOW?
57WWF The Energy Report Page
© B
rent Stirton / G
etty Images / W
WF-U
K
58WWF The Energy Report Page
CASE STUDY
© C
aroline Sim
monds / W
WF
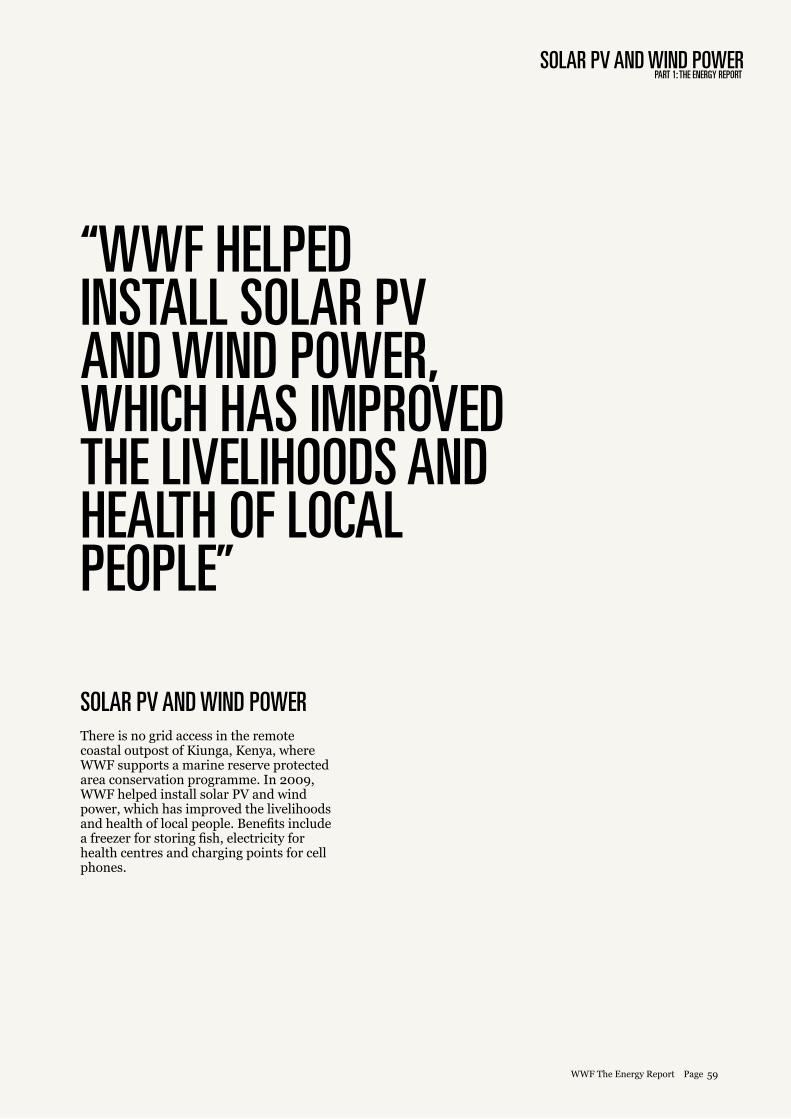
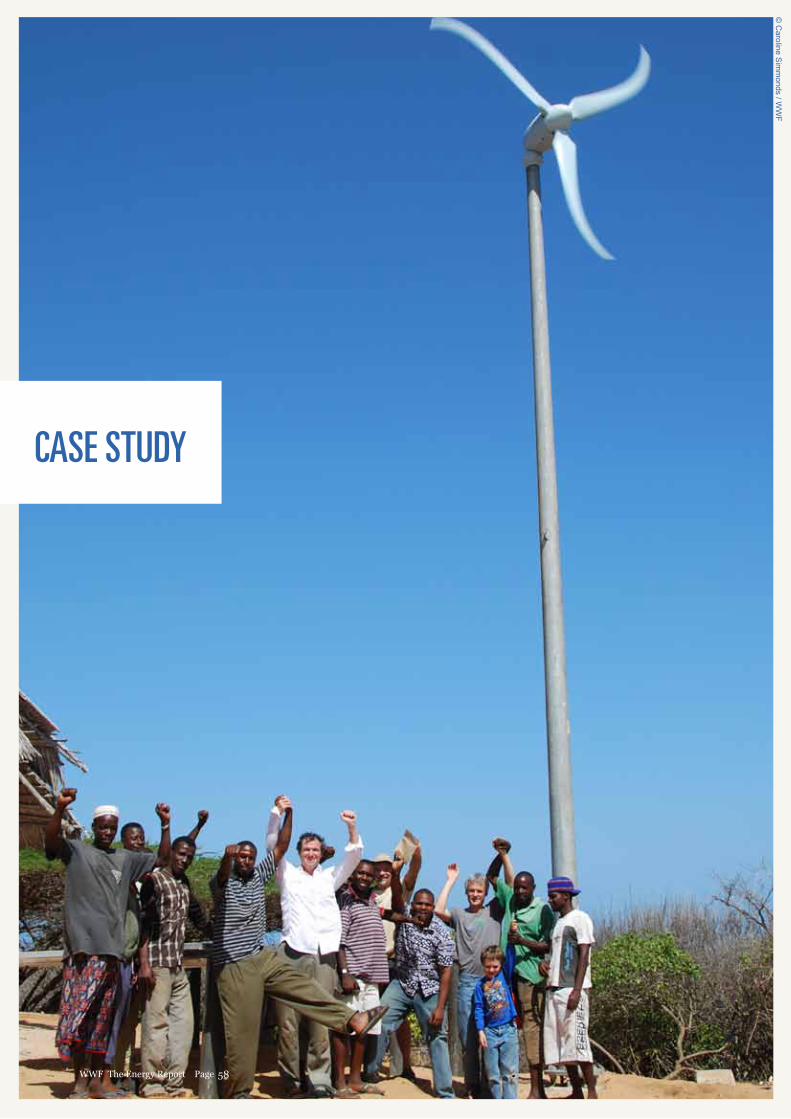
SOLAR PV AND WIND POWERPART 1: THE ENERGY REPORT
SOLAR PV AND WIND POWERThere is no grid access in the remote coastal outpost of Kiunga, Kenya, where WWF supports a marine reserve protected area conservation programme. In 2009, WWF helped install solar PV and wind power, which has improved the livelihoods and health of local people. Benefits include a freezer for storing fish, electricity for health centres and charging points for cell phones.
“WWF HELPED INSTALL SOLAR PV AND WIND POWER, WHICH HAS IMPROVED THE LIVELIHOODS AND HEALTH OF LOCAL PEOPLE”
59WWF The Energy Report Page
also need to carefully plan the routes of the long-distance, high-voltage power lines and undersea cables we will need to transmit electricity from new production centres.
The thorniest issue, however, is the role of bioenergy24. The Ecofys scenario for a near-complete phase-out of fossil fuels relies on a substantial increase in the amount of bioenergy. In the absence of alternative technologies, this is based on organic waste, biomass from existing forests and biofuel crops on agricultural land.
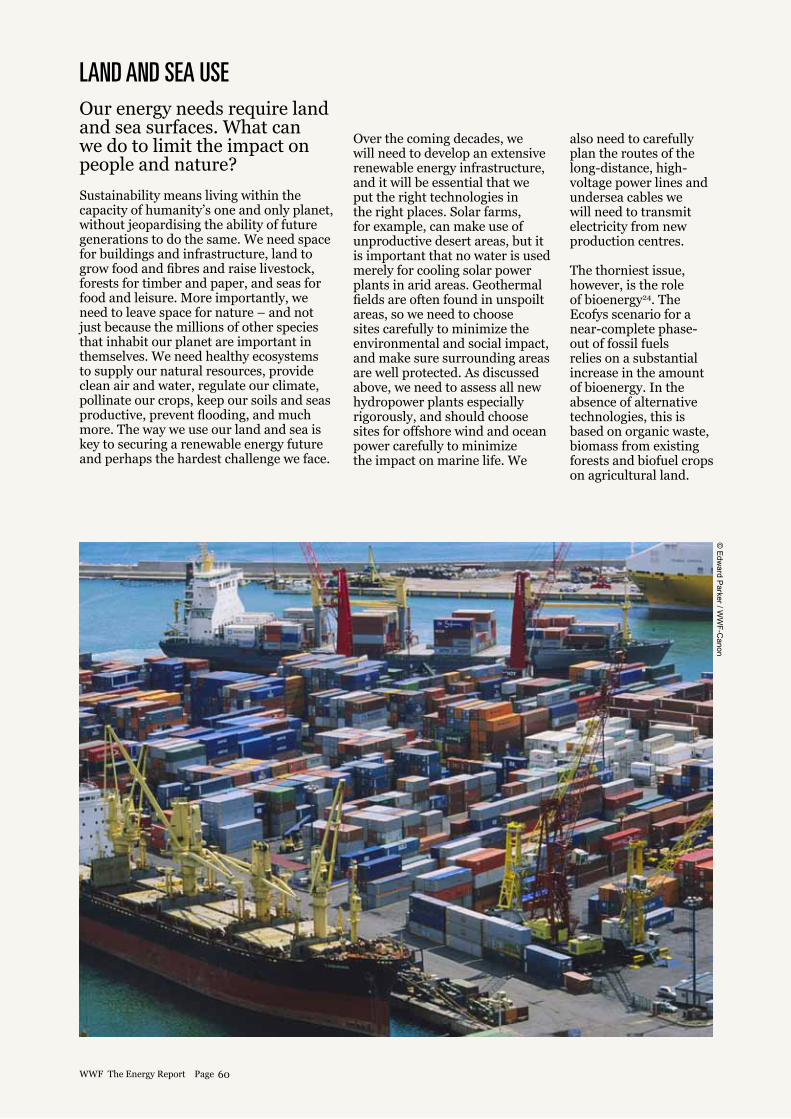
LAND AND SEA USEOur energy needs require land and sea surfaces. What can we do to limit the impact on people and nature?
Sustainability means living within the capacity of humanity’s one and only planet, without jeopardising the ability of future generations to do the same. We need space for buildings and infrastructure, land to grow food and fibres and raise livestock, forests for timber and paper, and seas for food and leisure. More importantly, we need to leave space for nature – and not just because the millions of other species that inhabit our planet are important in themselves. We need healthy ecosystems to supply our natural resources, provide clean air and water, regulate our climate, pollinate our crops, keep our soils and seas productive, prevent flooding, and much more. The way we use our land and sea is key to securing a renewable energy future and perhaps the hardest challenge we face.
Over the coming decades, we will need to develop an extensive renewable energy infrastructure, and it will be essential that we put the right technologies in the right places. Solar farms, for example, can make use of unproductive desert areas, but it is important that no water is used merely for cooling solar power plants in arid areas. Geothermal fields are often found in unspoilt areas, so we need to choose sites carefully to minimize the environmental and social impact, and make sure surrounding areas are well protected. As discussed above, we need to assess all new hydropower plants especially rigorously, and should choose sites for offshore wind and ocean power carefully to minimize the impact on marine life. We
60WWF The Energy Report Page
© E
dward P
arker / WW
F-Canon
The Ecofys analysis suggests that it is technically possible to do this in a sustainable way. According to the scenario, we can meet the increased need for solid biomass by taking more wood from forests than is already used commercially. If people in the developed world ate half as much meat as they do today, we would need less land for growing animal feed and grazing. That would free-up enough land to grow enough biofuel crops without threatening food security, clearing forests, increasing irrigation or losing biodiversity.
On a global level, there may be enough agriculture and forest land available to grow biofuels sustainably. Ecofys estimates that we would need around 250 million hectares of agriculture land, which is equivalent to about one-sixth of the total global cropland today, as well as 4.5 billion cubic metres of biomass from already disturbed forests. But what is possible on paper, even after the most rigorous analysis, is a different matter in practice. We have yet to identify where this land is, and how it is being used at the moment. We need to consider the rights of communities, including indigenous people, the movements of migratory species, the effect on water supplies, the type of infrastructure and governance systems in place, and a host of other constraints.In fact, the huge pressure we’re placing on our planet means we need to take these considerations into account with all agriculture and forestry, and not only with bioenergy.
The land availability in the Ecofys scenario also rests on the assumption of a constrained growth in meat consumption. To achieve this equitably, people in richer countries would need to cut their meat consumption in half, with the rest of the world eating no more than 25 percent more meat than they do now. A diet that is high in animal protein requires far more land than a largely vegetarian diet – it is more efficient to eat plant protein directly than to feed it to animals first. Today, nearly a third of global land area (excluding Antarctica) is used for feeding livestock, either through grazing or growing animal fodder.
Because of the concerns bioenergy raises, WWF believes we need to take urgent action to reduce the demand for liquid fuels that the Ecofys scenario predicts, and to pursue alternatives. Further reductions in meat consumption, aviation and long-distance freight transport would help to reduce demand. Bioenergy from algae and hydrogen produced with renewable electricity are potential sustainable fuel technologies. In the meantime, better land-use planning, from the local to the global level, will be vital in securing a sustainable energy supply.
24. For more information on WWF’s position on bioenergy, see www.panda.org/renewables
“THE WAY WE USE OUR LAND AND SEA IS kEY TO SECURING A RENEWABLE ENERGY FUTURE, AND PERHAPS THE HARDEST CHALLENGE WE FACE”
As the global population grows, the world is going to need to produce and consume food more efficiently and fairly: this will become even more urgent if our demand for biofuels grows too. Ecofys’ calculations are based on crop yields rising by 1 per cent per year. This is less than the 1.5 per cent growth that the UN Food and Agriculture Organization predicts; however, climate change will increase the likelihood of crop failures.
Extracting more wood from forests will have an impact on biodiversity. Many of the world’s commercial forests are already intensively used, so expansion will have to happen in areas with untapped sustainable potential. There is the potential to increase yields by using fertilizers and fast-growing species, although this too has implications on wildlife habitats, and water and soil quality. Some privately owned plots could sustainably provide more biomass, but there are economic and logistical hurdles. Any increase in forest biomass use must be coupled with efforts to reduce emissions from deforestation and degradation, and promote more forest growth. In other words, we must not release more forest carbon than we replace, even in the short term.
LAND AND SEA USEPART 1: THE ENERGY REPORT
61WWF The Energy Report Page
WHAT NOW? • All large-scale energy infrastructure developments must satisfy independent, in-depth, social and environmental impact assessments. They should also meet – or exceed – the best social and environmental management practices and performance standards. The Gold Standard for best practice in projects delivering carbon credits provides a good example. For hydropower, WWF has participated in the development of the International Hydropower Association Sustainability Guidelines.
• To safeguard habitats and food supplies, water supplies and ecosystem services, world governments must stop the scramble for land for biofuels,. “Land-grabbing” – where rich countries buy or lease large tracts of land, especially in Africa, to grow biofuels or food – should be outlawed. Instead, we need to carefully analyze, country by country, what land and water is available for bioenergy, taking into account social, environmental and economic issues.
• Forestry companies, governments and conservationists need to identify areas of idle land (forests that have been cleared already but are no longer in use) where it may be possible to increase yields of biomass with the least impact on biodiversity. South East Asia, Russia and the Americas hold the most potential. WWF is supporting the Responsible Cultivation Area concept, which aims to identify land where production could expand without unacceptable biodiversity, carbon or social impacts. WWF is also helping to identify areas that should be maintained as natural ecosytems and primarily managed for conservation purposes through schemes such as the High Conservation Value Framework.
• We need to offset increased forest carbon emissions by stopping unsustainable fellings and deforestation. Schemes such as REDD (Reducing Emissions from Deforestation and Degradation), which offer developing countries incentives to conserve their forest carbon, will play an important role in this. We also need to promote and adopt community forest management and other sustainable forestry practices.
• Bioenergy production has to be based on sustainability criteria with strong legal controls – binding legislation and strict enforcement – at national and international levels. Voluntary standards and certification schemes, along the lines of the Forest Stewardship Council, the Roundtable on Sustainable Biofuels and the Better Sugarcane Initiative, also have a role to play. Because much bioenergy will be produced in developing countries, they will need support to develop and implement these standards effectively.
• As individuals, we need to make more considered choices about the food we eat, the transport we use, and other lifestyle factors that influence global land use. Public policy should help to guide these choices.
• We should limit growth in areas that depend on liquid fuels – notably aviation, shipping and heavy goods vehicles – at least until we have established a secure and sustainable supply of bioenergy. That means finding smarter ways to transport goods and people. These include using modes of transport that don’t depend on liquid fuels, and reducing the length and number of journeys, for example by producing more goods locally or working remotely instead of commuting. We also urgently need to research and develop energy alternatives for sectors that rely on bioenergy as the only alternative to fossil fuels.
62WWF The Energy Report Page
WHAT NOW?PART 1: THE ENERGY REPORT
“ALL LARGE-SCALE ENERGY INFRASTRUCTURE DEVELOPMENTS MUST SATISFY INDEPENDENT, IN-DEPTH, SOCIAL AND ENVIRONMENTAL IMPACT ASSESSMENTS”
63WWF The Energy Report Page
© N
ational Geographic S
tock/ Jason Edw
ards / WW
F
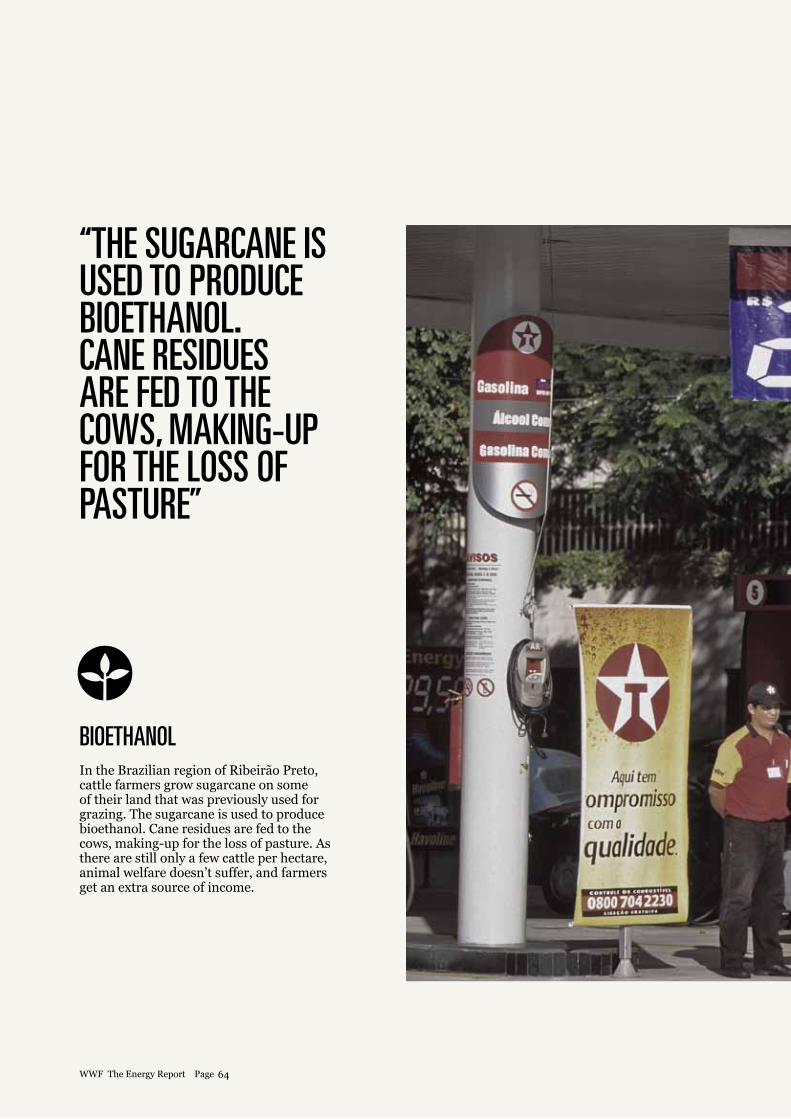
BIOETHANOLIn the Brazilian region of Ribeirão Preto, cattle farmers grow sugarcane on some of their land that was previously used for grazing. The sugarcane is used to produce bioethanol. Cane residues are fed to the cows, making-up for the loss of pasture. As there are still only a few cattle per hectare, animal welfare doesn’t suffer, and farmers get an extra source of income.
“THE SUGARCANE IS USED TO PRODUCE BIOETHANOL. CANE RESIDUES ARE FED TO THE COWS, MAkING-UP FOR THE LOSS OF PASTURE”
64WWF The Energy Report Page
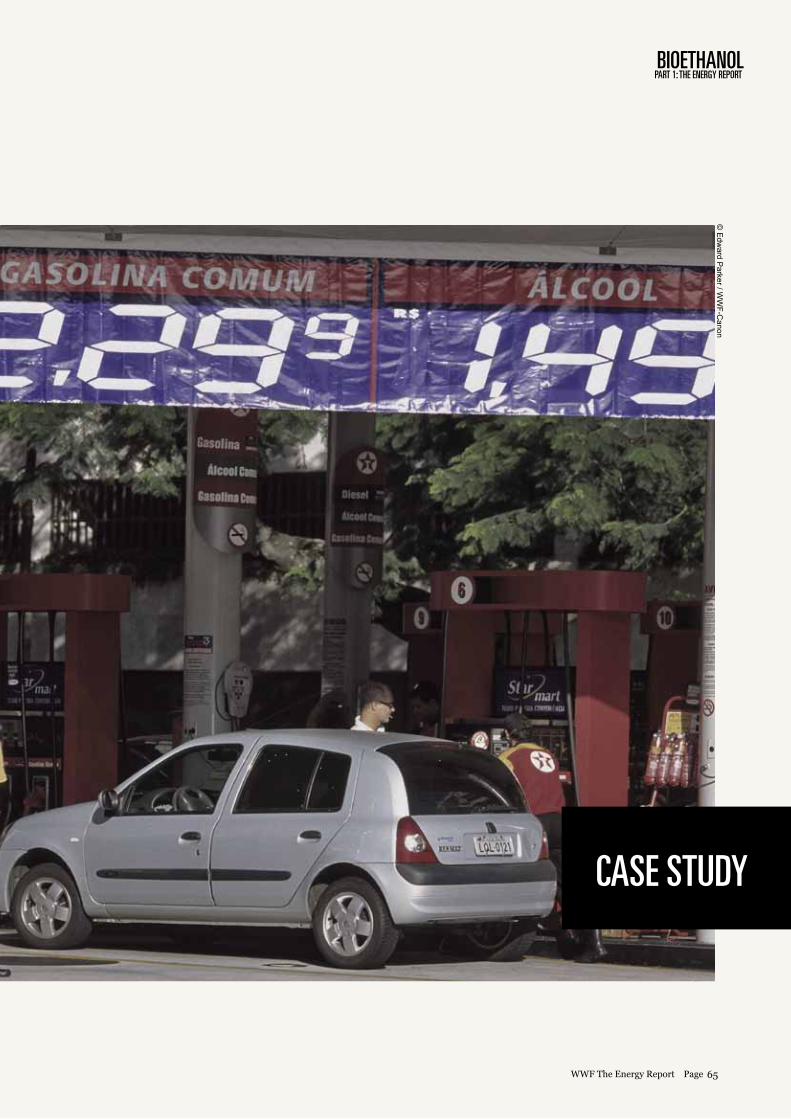
BIOETHANOLPART 1: THE ENERGY REPORT
65WWF The Energy Report Page
CASE STUDY
© E
dward P
arker / WW
F-Canon

LIFESTYLE
How do the choices we make in our own lives affect energy supplies?
Moving to a renewable energy future doesn’t
mean sacrificing our quality
of life.
The Ecofys scenario shows that we can supply almost all of our energy needs from renewable sources by 2050 while maintaining rates of economic growth and leading prosperous, healthy lifestyles. Indeed, quality of life for many will improve immeasurably with access to electricity and clean energy.
We will, though, need to make wiser choices about the way we use energy. Lifestyle changes will allow us to reach a renewable energy future while reducing our impact on the planet. Since the anticipated need for bioenergy may push our forests, agricultural land and freshwater ecosystems to the limit, we particularly need to look at what we can do to limit bioenergy demand and land-use while aiming at 100 per cent renewables and make more land and water available to sustain people and nature.
66WWF The Energy Report Page
CRITICAL LIFE-STYLE CHOICES

To grow enough food to nourish a growing global population, while also having enough land available to meet potential demand for biofuels, many of us will need to change our diets. As mentioned, the Ecofys scenario places limits on meat consumption growth. If future meat consumption is to be split more equitably, this would mean a halving of meat consumption per person by 2050 in OECD countries, and an increase by a quarter elsewhere. If we eat even less meat than this, then more land will be available to grow food or biofuel crops, or to return to nature.
Wasting less food will also save energy and free-up more land. According to Tristram Stuart25, around half of our
food is lost between field and fork… “Rich countries use up to four
times more food than the minimum requirements
of their populations (after adding/
subtracting
imports and exports); surplus is either fed inefficiently to livestock, causing a net loss in food calories, or it is wasted in the supply chain, or eaten in excess of dietary requirements. … Poor countries have much smaller food supplies: fewer arable crops are fed to livestock, and less is wasted in the home”.
Reducing the distance that we transport food and other goods will also reduce the need for biofuels. The Ecofys scenario is based on established “business-as-usual” projections that predict steep rises in freight transport by 2050 – more than doubling in OECD countries and increasing fivefold elsewhere. If we cut rises in long-haul freight transport by a third compared to these projections, it would reduce the land needed for growing
crops for transport by around 8 per cent, or 21 million hectares.
Personal mobility is also predicted to rise by 2050. Projections show the overall distance people travel will increase by half in OECD countries, and treble in the rest of the world. Ecofys suggests we can manage these increases if we move towards more efficient forms of transport – walking or cycling short distances, taking buses, and taking the train instead of flying. Improved communications technology will make work more flexible and home-working more viable in many jobs, reducing the need to commute. This would reduce congestion and improve the work-life balance for many. All the same, we will need massive investment in efficient public transport systems, along with fundamental changes in attitudes and behaviour.
Particularly sharp increases are expected
in aviation transport, in
rich and poor
countries alike, and the Ecofys scenario includes these. Flying less would reduce the need for biofuels in the future, and substantially reduce carbon emissions today. A cut in passenger air travel by a third compared to Ecofys projections would reduce the land needed for growing crops for transport by an additional
19 million hectares. Videoconferencing and emerging innovative technologies could reduce the need for business travel. People may also choose to travel more slowly, or holiday closer to home.
Making lifestyle changes will take time. Communities that have collected firewood from forests for centuries will not switch to biogas cookers overnight. The attachment to large and fast cars runs deep in Western society. But history shows that people will change their behaviour when they understand the benefits and when policies steer them in the right direction: recycling is now second nature in many countries, while smoking rates have fallen with growing knowledge of the health risks. A better understanding of the impact of our own choices will help us
move toward a fair and fully
renewable future
in which people live in harmony with nature.
CHANGES IN LIFESTYLEPART 1: THE ENERGY REPORT
25. Waste - Uncovering the Global Food Scandal. Tristram Stuart, 2009
67WWF The Energy Report Page
© C
hris Martin B
ahr / WW
F-Canon
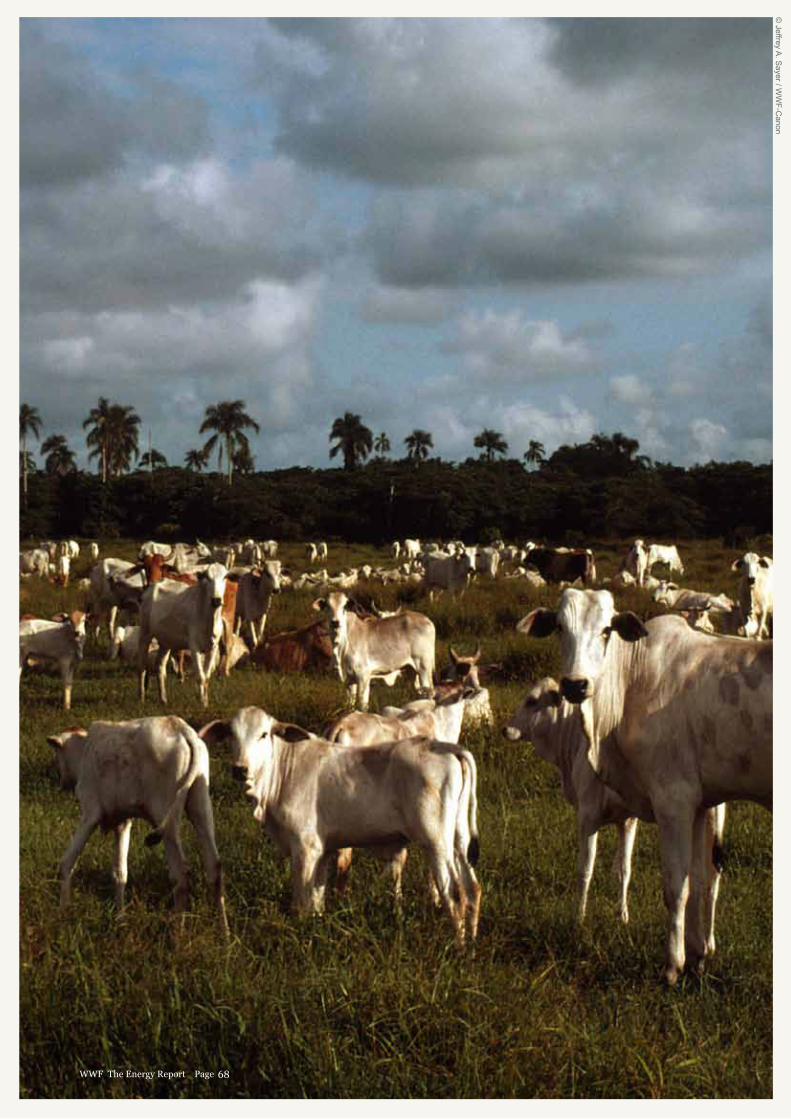
68WWF The Energy Report Page
© Jeffrey A
. Sayer / W
WF-C
anon

WHAT NOW?PART 1: THE ENERGY REPORT
WHAT NOW?• Every item we buy, all the food we eat, every journey we take uses energy. All people need to be more aware of the impact their lifestyle has, and what they can do about it. Public policy should help direct people to make wiser choices.
• Wealthier people everywhere should eat less meat, as part of a healthy, balanced diet. Governments, NGOs, individuals and the media need to raise awareness of the connection between our diets and energy needs, ecosystems and climate change. Regulations and pricing should reflect the true environmental and social costs of meat and animal products.
• Food waste by richer people needs to be minimized, and we need to raise awareness that about 50 per cent of all food is wasted and lost worldwide26. Consumers can help by only buying and cooking what they need, while food companies and retailers should reassess the way they package and promote perishable items. At a global level we need to re-examine the way we produce and distribute food to rebalance a system in which some regions have more food than they can use, while people in other places struggle.
• Big investments in public transport systems, particularly in emerging economies where personal mobility is growing fastest, are needed to provide an attractive alternative to private cars. Long-distance, high-speed trains powered by electricity from renewable sources need to be developed as an alternative to air travel.
• We need to explore other ways to optimize the distances that people and products travel to deliver the least GHG emissions over the life-cycle of a service or product. In part this means promoting regional economies and the use of local materials. Restaurants and retailers could equally source more regionally produced food that is in season - reducing the need for refrigerated storage. In many walks of life, Internet and mobile phone transactions can reduce the need for travel; employers
should support home-working. International businesses should invest in videoconferencing and emerging communication technologies.
• Not everything should be grown or manufactured regionally, and trade between nations is essential to ensure the most effective (and energy efficient) use of resources and goods. Production and consumption of certified sustainable products, e.g. Rainforest Alliance, UTZ Certified, Organic or Fair-Trade, particularly from developing countries, needs to be encouraged. The social and environmental benefits for communities producing these products, and associated environmental benefits, are frequently greater than the environmental impact of the long-distance transport.
26. Lundqvist, J., C. de Fraiture and D. Molden. Saving Water: From Field to Fork - Curbing Losses and Wastage in the Food Chain. SIWI Policy Brief. SIWI, 2008.
69WWF The Energy Report Page

70WWF The Energy Report Page

CASE STUDY
CUTTING AIR TRAVELPART 1: THE ENERGY REPORT
CUTTING AIR TRAVELCurbing the growth in air travel would mean less land is needed for growing biofuels. Under WWF-UK’s One in Five Challenge, businesses and organizations are committing to cut 20 per cent of their business flights within five years. A dozen large employers have signed up to the programme, including the Scottish government. Audio, video and web conferencing provide alternatives to face-to-face meetings. It is no coincidence that a telecom firm, BT, became the first company to successfully meet the challenge.
71WWF The Energy Report Page
© N
ational Geographic S
tock/ Tyrone Turner / WW
F
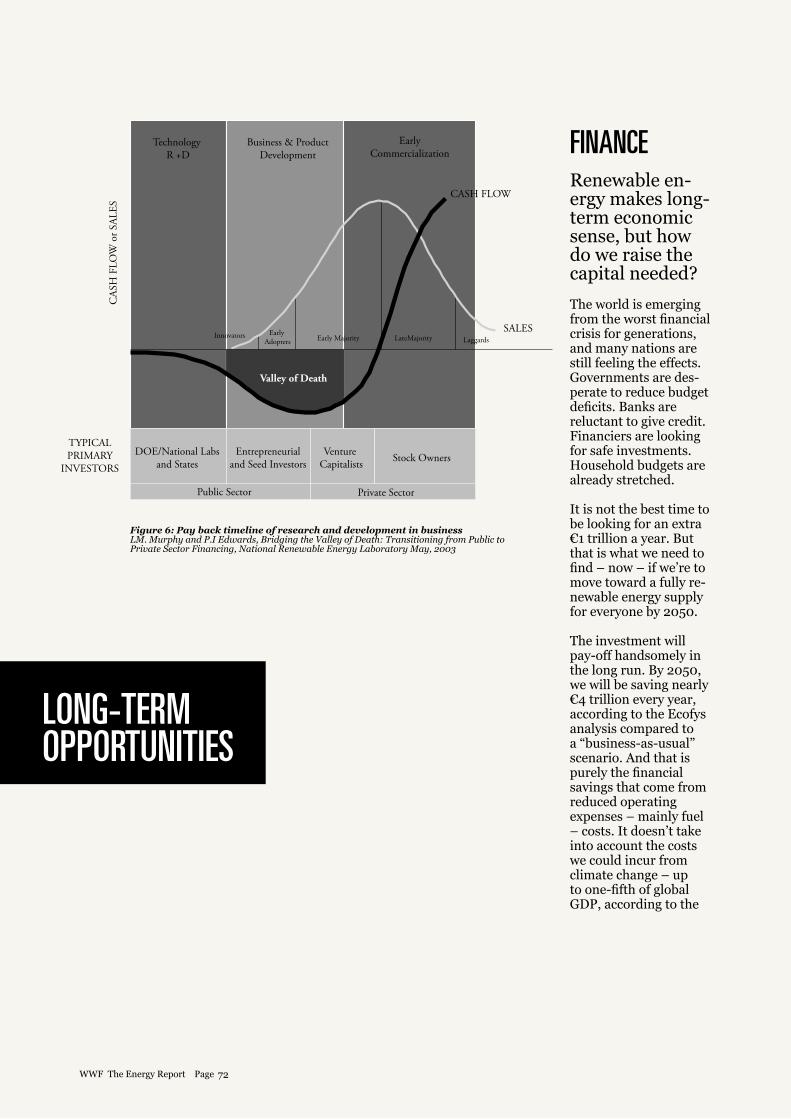
FINANCERenewable en-ergy makes long-term economic sense, but how do we raise the capital needed?
The world is emerging from the worst financial crisis for generations, and many nations are still feeling the effects. Governments are des-perate to reduce budget deficits. Banks are reluctant to give credit. Financiers are looking for safe investments. Household budgets are already stretched.
It is not the best time to be looking for an extra €1 trillion a year. But that is what we need to find – now – if we’re to move toward a fully re-newable energy supply for everyone by 2050.
The investment will pay-off handsomely in the long run. By 2050, we will be saving nearly €4 trillion every year, according to the Ecofys analysis compared to a “business-as-usual” scenario. And that is purely the financial savings that come from reduced operating expenses – mainly fuel – costs. It doesn’t take into account the costs we could incur from climate change – up to one-fifth of global GDP, according to the
LONG-TERMOPPORTUNITIES
Figure 6: Pay back timeline of research and development in businessLM. Murphy and P.I Edwards, Bridging the Valley of Death: Transitioning from Public to Private Sector Financing, National Renewable Energy Laboratory May, 2003
72WWF The Energy Report Page
Stern Review27– if we don’t radically reduce our greenhouse gas emissions by moving to a renewable energy supply. Nor does it include the added value of the millions of jobs created, or the health and social benefits – such as better air quality and well-being.
But we will need to invest significant capital before we start seeing these returns. Large sums will be needed to install renew-able energy-generating capacity on a mas-sive scale, to modernize electricity grids, transform public transport infrastructure and improve the energy efficiency of our existing buildings. Global capital expendi-ture will need to continue to grow for the next 25 years to around €3.5 trillion a year, but will not rise above 2 per cent of global GDP. At the same time, energy savings and reduced fuel costs mean operating expendi-ture will soon start to fall. The savings will begin to outweigh the costs by 2040.
Unfortunately, our current financial sys-tem is not suited to taking the long view. Investors expect a return within a couple of years. New power developments cannot be left entirely to the free market as long as it is often cheaper to build a coal or gas power station than a wind farm or solar array. We need new financing models, such as public-private partnerships with shared risks, to encourage long-term investment in renewables and energy efficiency. Leg-islation and stable political frameworks will also help to stimulate investment: in Europe, for example, investors remain wary of supporting offshore wind projects as long as countries continue to squabble over who is responsible for the necessary grid upgrades.
Feed-in tariffs are a key means of creating a more favourable cli-mate for renewable energy. Un-der these schemes, payments are guaranteed to households, busi-nesses, communities and other organizations that generate their own electricity from renewable sources, such as solar PV or wind power. By guaranteeing a return, feed-in tariffs have proved to be an effective way of encouraging people to invest in renewable energy, and are helping to bring down the price of generating elec-tricity from renewable sources. They now operate in more than 50 countries, plus about 25 U.S. states and parts of China and India28.
Growing support for renewable energy however, needs to be compared with the subsidies for conventional energy, which still dwarf clean power investment. A recent OECD report calculated the value of global fossil fuel subsidies at $US700 billion per year29, with around two-thirds of this in developing countries. The aim of these subsidies is often to provide affordable fuel and electricity for poorer people, so they should not be cut outright; instead, the money could be reinvested into providing renew-able energy and energy-efficiency measures.
While many governments are cutting public spending, invest-ing in renewable energy could help stimulate economic growth, creating many “green collar” jobs. China recently announced
plans to invest 5 trillion yuan (€580 billion) in a new 10-year alternative energy programme that will create 15 million jobs. Germany already employs about 300,000 people30 in the renew-able energy sector. En-ergy efficiency savings, especially in industry, can also help spur eco-nomic competitiveness and innovation.
The economic argu-ments in favour of moving toward a fully renewable energy sup-ply are persuasive. When we also take into account the environ-mental and social costs and benefits, the case is undeniable. The chal-lenge now is to over-come the clamour for short-term profits and recognize the long-term opportunities.
27. http://webarchive.nationalarchives.gov.uk/+/http://www.hm-treasury.gov.uk/stern_review_report.htm 28. Renewables 2010, Status Report; REN 21, Paris 201029. http://www.worldenergyoutlook.org/docs G20_Subsidy_Joint_Report.pdf30. http://www.erneuerbare-energien.
FINANCEPART 1: THE ENERGY REPORT
73WWF The Energy Report Page
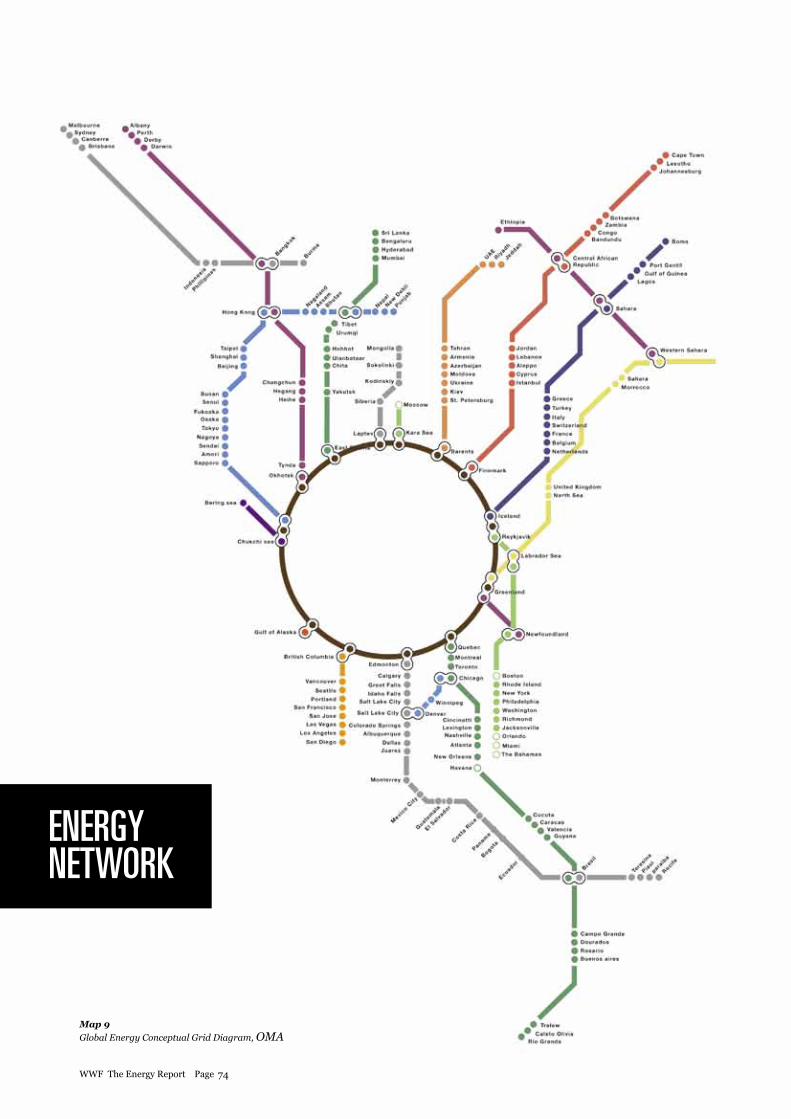
ENERGY NETWORk
Map 9
Global Energy Conceptual Grid Diagram, OMA
74WWF The Energy Report Page
WHAT NOW?PART 1: THE ENERGY REPORT
WHAT NOW?• We urgently need to create a level playing field for sustainable renewable energy. Or, even better, one that is tilted in its favour – to reflect the potential long-term benefits. Feed-in tariffs should be extended, with similar schemes introduced for renewable heating. We need to end direct and hidden subsidies to the fossil fuel and nuclear sectors, but without increasing energy prices for the poorest.
• Financial support for renewable energies can only be truly effective if it allows open access to the market, to consumers. Unfortunately, monopolists of existing power supply often prevent exactly that. Thus, proactive, “preferred grid access” for renewables must be a part of any legislation - as currently enacted in the European Union. In most countries and regions that showed an increase in clean power in recent years, this legal provision was critically important.
• We need ambitious cap-and-trade regimes, nationally and internationally, that cover all large polluters, such as coal-fired power stations and energy-intensive industries. Setting a high price on carbon will help to encourage investment in renewable energy and energy efficiency, as well as reducing emissions.
• Global climate negotiations need a strong focus on providing finance and technology to help developing countries build their capacity for generating renewable energy and improving energy efficiency.
• People everywhere should install any effective micro-generation and energy-efficiency measures they can afford – in their own homes, businesses or communities – assuming these make environmental and economic sense. Governments, energy companies and entrepreneurs can encourage this.
• Policy-makers and financial institutions globally need to develop financial instruments that encourage investment in renewable energy.
• Investors should divest from fossil fuel and nuclear energy firms, and buy shares in renewable energy and efficiency-related companies. Anyone with savings can help to tip the balance by choosing banks, pension providers or trust funds that favour renewables.
• Politicians need to clearly support renewable energy and energy efficiency, and create supportive legislation to build investor confidence. Political parties need to reassure investors that broad energy policies will survive a change of government. Throughout the world, national legislation needs to overcome the bias toward the energy status quo, through measures such as legally binding energy-efficiency standards.
• More market incentives could encourage energy efficiency – such as reduced VAT on the most energy-efficient appliances, or varying rates of tax for cars and properties according to their efficiency.
WHAT NOW?
75WWF The Energy Report Page
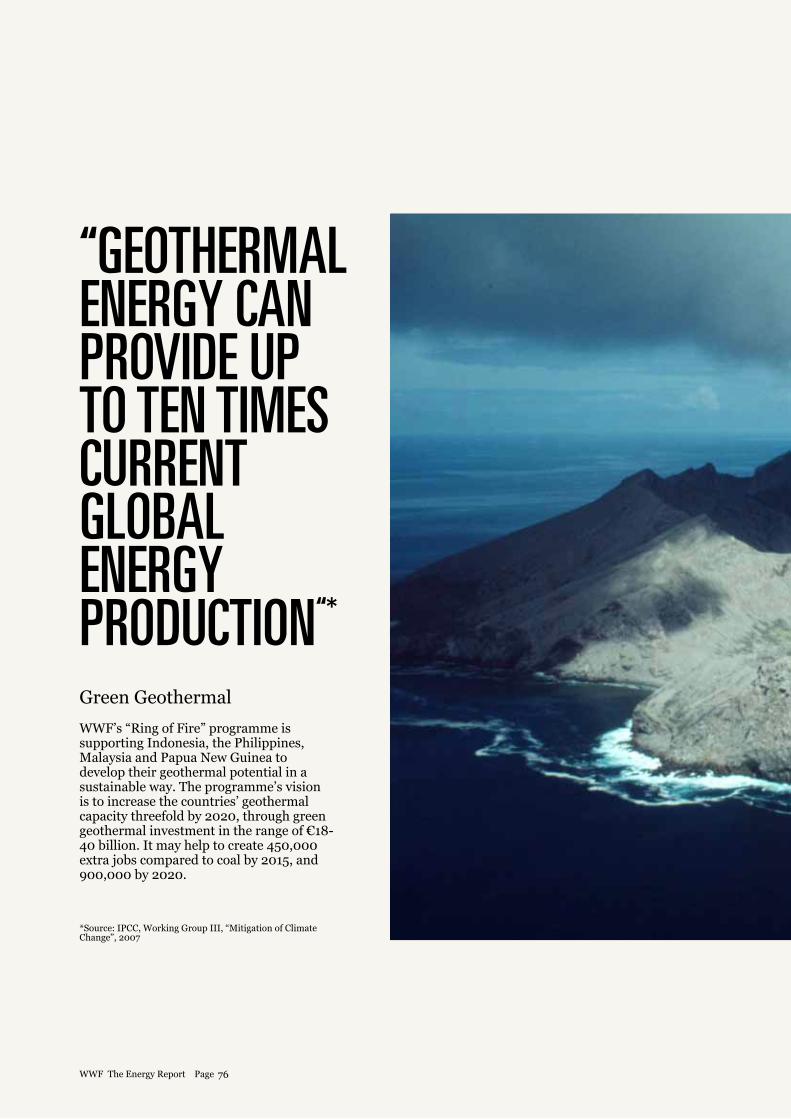
Green Geothermal
WWF’s “Ring of Fire” programme is supporting Indonesia, the Philippines, Malaysia and Papua New Guinea to develop their geothermal potential in a sustainable way. The programme’s vision is to increase the countries’ geothermal capacity threefold by 2020, through green geothermal investment in the range of €18-40 billion. It may help to create 450,000 extra jobs compared to coal by 2015, and 900,000 by 2020.
“GEOTHERMAL ENERGY CAN PROVIDE UP TO TEN TIMES CURRENT GLOBAL ENERGY PRODUCTION“*
*Source: IPCC, Working Group III, “Mitigation of Climate Change”, 2007
76WWF The Energy Report Page
GREEN GEOTHERMAL INVESTMENT
CASE STUDY
PART 1: THE ENERGY REPORT
77WWF The Energy Report Page
© Jam
es W. Thorsell / W
WF-C
anon
INNOVATIONWhat advances will make our renewable energy vision a reality?
The energy scenario mapped-out by Ecofys in the second part of this report is ambitious and radical – but it is grounded firmly in what exists today. Only technologies and processes that are already proven have been included. These are sure to be refined and improved in the years ahead, but the report is cautious in estimating their growth potential. This means we have an opportunity to further advance on the Ecofys scenario – to increase the proportion of renewable energy from 95 per cent to 100 per cent by 2050, and to reduce the need for biofuels and the pressure this puts on food and water supplies and the natural world.
But to get there, we will need to substantially step-up our research and development (R&D) into renewable energy production and energy efficiency. At the moment, we spend around €65 billion a year globally on R&D in these areas, out of a total global expenditure of around €900 billion on R&D in all sectors31. We’ll need to double this over the next decade. Under the Ecofys scenario, annual R&D expenditure rises to a high of €170 billion in 2040. Until 2025, the focus is on reducing energy demand – the most pressing requirement. This will come chiefly through developing more efficient materials, industrial processes and vehicle technology, particularly electric cars.
78WWF The Energy Report Page
R&DINVESTMENT
some industrial processes, such as steel manufacturing, depend on specific chemical properties, as well as the very high temperature heat that it can produce. Research is needed into alternative production processes or materials that will allow us to phase-out fossil fuels altogether.
Technology moves fast. Just 50 years after the Wright Brothers made their first flight, jet planes were carrying passengers from London to Johannesburg. Tim Berners-Lee wrote the first World Wide Web page in 1991, and there are now two billion web users and an immeasurable number of web pages. Given the right political and economic support, human ingenuity will allow us to realize our vision of a 100 per cent renewable energy supply by 2050.
31. Estimated global spending on R&D for 2009 was US$1,140 billion – see http://www.battelle.org/news/pdfs/2009RDFundingfinalreport.pdf
INNOVATION
source of bioenergy – we need to research ways to produce fuels from algae with the least environmental impact. As a precaution, though, we should avoid locking ourselves into needlessly high levels of demand for liquid fuels.
Hydrogen could also have a major role to play in industry, aviation and shipping, although it provides only a small fraction of energy in 2050 under the Ecofys scenario. Hydrogen is the ultimate renewable fuel: the raw material is water, and water vapour is the only emission. It produces energy either through direct combustion or in fuel cells, and is easily produced through electrolysis, which can be powered by renewable electricity at times of high supply or low demand. However, major challenges remain in storing and transporting it. Intensive R&D into hydrogen could have a major impact on the future energy balance. The British Royal Mail is using hydrogen to fuel postal vans on the Scottish island of Lewis in a pilot project that is being watched with interest.
According to the Ecofys scenario, the world will still need to burn a small amount of coal in 2050 (less than 5 per cent of total energy supply). This is because
The supply side – particularly renewable power and fuels – becomes increasingly important. As we have seen, smart energy grids that are capable of managing demand and accommodating a much larger proportion of variable electricity have a vital role to play, and will be an important area for R&D. Smart appliances that respond to varying electricity supplies will complement this.
We must also focus on improving storage of electricity generated by wind and solar. Several solutions are already in use. Solar power can be stored as heat. Wind power can be used to turn a flywheel, whose spinning motion then generates electricity when it is needed – a method of storing energy that goes back many centuries. Compressed air storage, which has been around since the 19th century, is another possibility: wind farms pump air underground, then release the compressed air to generate electricity on demand.
Electricity can also be stored in batteries, and battery technology will be a crucial area for development. We have yet to develop batteries that can store enough energy to power trucks over long distances.
Using renewable hydrogen, fuel cells, and electrifying trucking will slash the demand for biofuels – but this is a long way in the future. In the meantime, we need research into efficient biofuels, to find out which crops can produce the most energy for the least amount of land and water. Algae has the potential to provide a truly sustainable
PART 1: THE ENERGY REPORT
79WWF The Energy Report Page
© W
ild Wonders of E
urope /Diego Lopez / W
WF
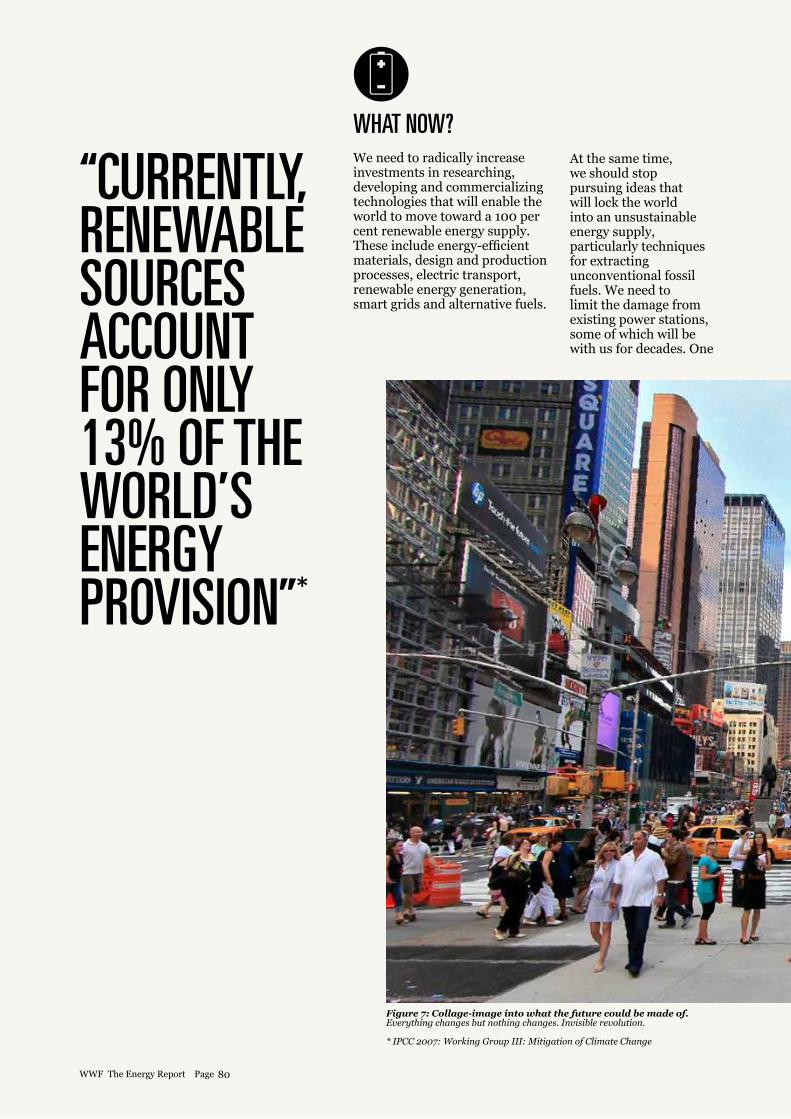
WHAT NOW?We need to radically increase investments in researching, developing and commercializing technologies that will enable the world to move toward a 100 per cent renewable energy supply. These include energy-efficient materials, design and production processes, electric transport, renewable energy generation, smart grids and alternative fuels.
At the same time, we should stop pursuing ideas that will lock the world into an unsustainable energy supply, particularly techniques for extracting unconventional fossil fuels. We need to limit the damage from existing power stations, some of which will be with us for decades. One
“CURRENTLY, RENEWABLE SOURCES ACCOUNT FOR ONLY 13% OF THE WORLD’S ENERGY PROVISION”*
80WWF The Energy Report Page
Figure 7: Collage-image into what the future could be made of.Everything changes but nothing changes. Invisible revolution.
* IPCC 2007: Working Group III: Mitigation of Climate Change
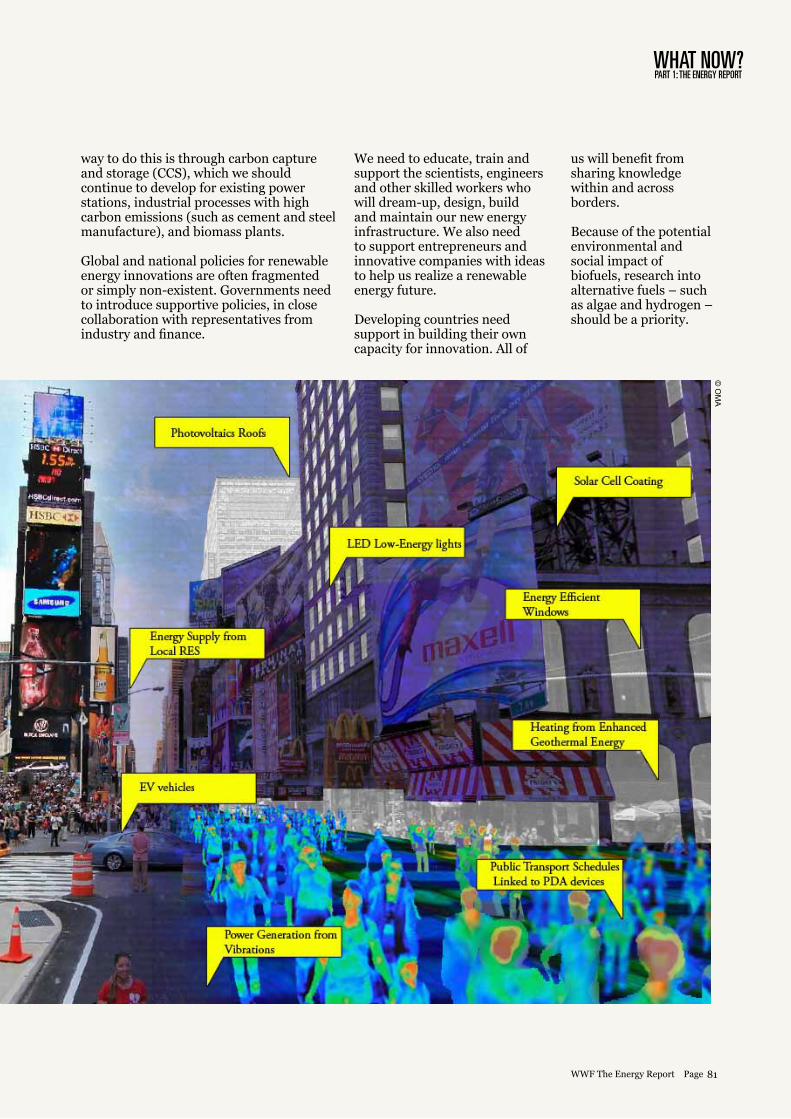
way to do this is through carbon capture and storage (CCS), which we should continue to develop for existing power stations, industrial processes with high carbon emissions (such as cement and steel manufacture), and biomass plants.
Global and national policies for renewable energy innovations are often fragmented or simply non-existent. Governments need to introduce supportive policies, in close collaboration with representatives from industry and finance.
WHAT NOW?PART 1: THE ENERGY REPORT
We need to educate, train and support the scientists, engineers and other skilled workers who will dream-up, design, build and maintain our new energy infrastructure. We also need to support entrepreneurs and innovative companies with ideas to help us realize a renewable energy future.
Developing countries need support in building their own capacity for innovation. All of
us will benefit from sharing knowledge within and across borders.
Because of the potential environmental and social impact of biofuels, research into alternative fuels – such as algae and hydrogen – should be a priority.
81WWF The Energy Report Page
© O
MA

82WWF The Energy Report Page
CASE STUDY
© M
ichel Gunther / W
WF-C
anon
BACk TO THE FUTUREPART 1: THE ENERGY REPORT
* IPCC 2007: Working Group III: Mitigation of Climate Change
“THE USE OF MODERN FUEL CELLS IN THE SHIPPING INDUSTRY CAN REDUCE TRANSPORT GHG EMISSION BY 20–40%”*
BACk TO THE FUTURESometimes, innovation can mean going back to the past. Ships have always harnessed the power of the wind – and a new generation of sailing ships could help reduce the amount of fuel needed in the shipping sector. Hybrid cargo ships like the Ecoliner, made by Netherlands-based Fairtransport Shipbrokers, combine sails with back-up engines. German company Beluga SkySails has completed trans-Atlantic cargo voyages partly powered by a giant kite, which it claims can reduce fuel use by 10-35 per cent.32
32. http://www.skysails.info/english/information-center/background-information/skysails-performance-calculation/
83WWF The Energy Report Page
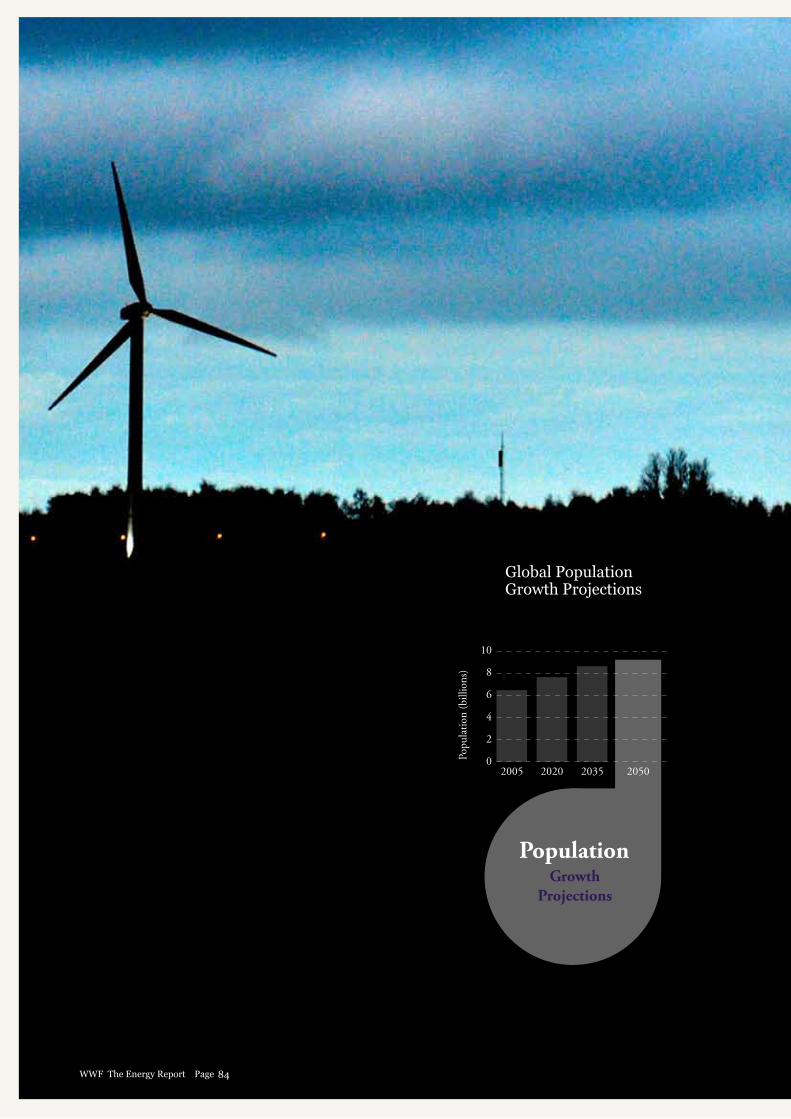
Global Population Growth Projections
84WWF The Energy Report Page
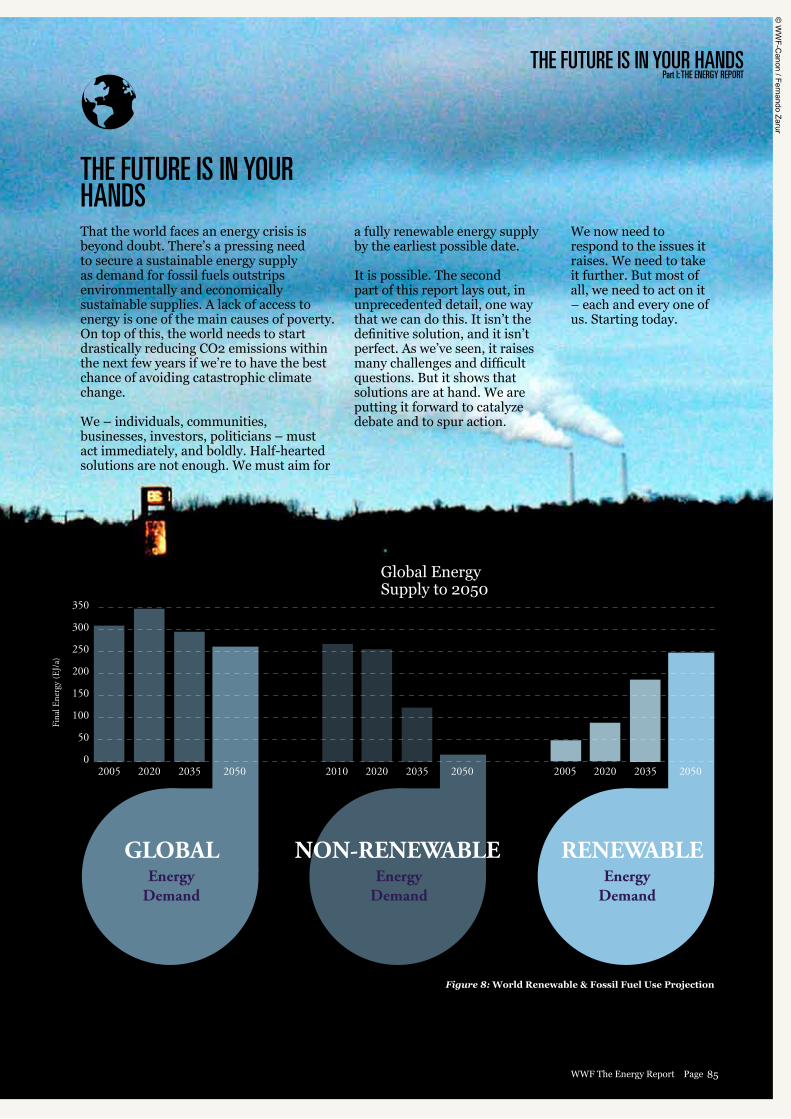
Part I: THE ENERGY REPORTTHE FUTURE IS IN YOUR HANDS
Global Energy Supply to 2050
THE FUTURE IS IN YOUR HANDSThat the world faces an energy crisis is beyond doubt. There’s a pressing need to secure a sustainable energy supply as demand for fossil fuels outstrips environmentally and economically sustainable supplies. A lack of access to energy is one of the main causes of poverty. On top of this, the world needs to start drastically reducing CO2 emissions within the next few years if we’re to have the best chance of avoiding catastrophic climate change.
We – individuals, communities, businesses, investors, politicians – must act immediately, and boldly. Half-hearted solutions are not enough. We must aim for
a fully renewable energy supply by the earliest possible date.
It is possible. The second part of this report lays out, in unprecedented detail, one way that we can do this. It isn’t the definitive solution, and it isn’t perfect. As we’ve seen, it raises many challenges and difficult questions. But it shows that solutions are at hand. We are putting it forward to catalyze debate and to spur action.
We now need to respond to the issues it raises. We need to take it further. But most of all, we need to act on it – each and every one of us. Starting today.
Figure 8: World Renewable & Fossil Fuel Use Projection
Fina
l Ene
rgy
(EJ/
a)
85WWF The Energy Report Page
© W
WF-C
anon / Fernando Zarur

86WWF The Energy Report Page
THE ECOFYSENERGY SCENARIO
PART 2
87WWF The Energy Report Page
© W
ild Wonders of E
urope /Inaki Relanzon / W
WF
© W
ild Wonders of E
urope /Inaki Relanzon / W
WF
ECOFYS NETHERLANDS BV, A PRIVATE LIMITED LIABILITY COMPANY INCORPORATED UNDER THE LAWS OF THE NETHERLANDS HAVING ITS OFFICIAL SEAT AT UTRECHTAND REGISTERED WITH THE TRADE REGISTER OF THE CHAMBER OF COMMERCE IN MIDDEN NEDERLAND UNDER FILE NUMBER 30161191
A S USTAI NABLE E NERGY S UPPLY F OR EVERY ONE
Ecofys Netherlands BVP.O. Box 8408 NL- 3503 RK Utrecht The Netherlands
T: +31 (0) 30 66 23 300 F: +31 (0) 30 66 23 301 E: [email protected] W: www.ecofys.com
By: Yvonne Deng, Stijn Cornelissen, Sebastian Klaus
The Ecofys Energy Scenario
© Ecofys 2011
89Part 2 - The Ecofys Energy Scenario

A S USTAI NABLE E NERGY S UPPLY F OR EVERY ONE
Preface
The Energy Scenario has been created by Ecofys, a leading consultancy in energy efficiency, renewable energy and climate change. It began as an internal research project in 2008 and subsequently became a collaborative venture with WWF, who were also keen to investigate a possible road towards 100% renewable energy by 2050.
The main contributors are listed below, but the authors are indebted to many other advisors not on this list, who have contributed since the beginning of the project.
Lead authors: Dr. Yvonne Deng (Project leader) Stijn Cornelissen Sebastian Klaus
Contributing authors / reviewers: Prof. Dr. Kornelis Blok (Project director) Kees van der Leun (Project director) Prof. Dr. Ernst Worrell Thomas Boermans Dr. Maarten Neelis Dr. Monique Hoogwijk Michèle Koper Dr. Bart Wesselink Erika de Visser David de Jager Willem Hettinga Saskia Hagedoorn Jasper Vis
Advising experts: Bart Dehue Dr. Chris Hendriks Dr. Christian Nabe Dr. Robert Harmsen Dr. Carlo Hamelinck Dr. Niklas Höhne Wina Graus Robert Winkel Dr. Ernst van Zuijlen Dr. Robert van den Hoed
91Part 2 - The Ecofys Energy Scenario
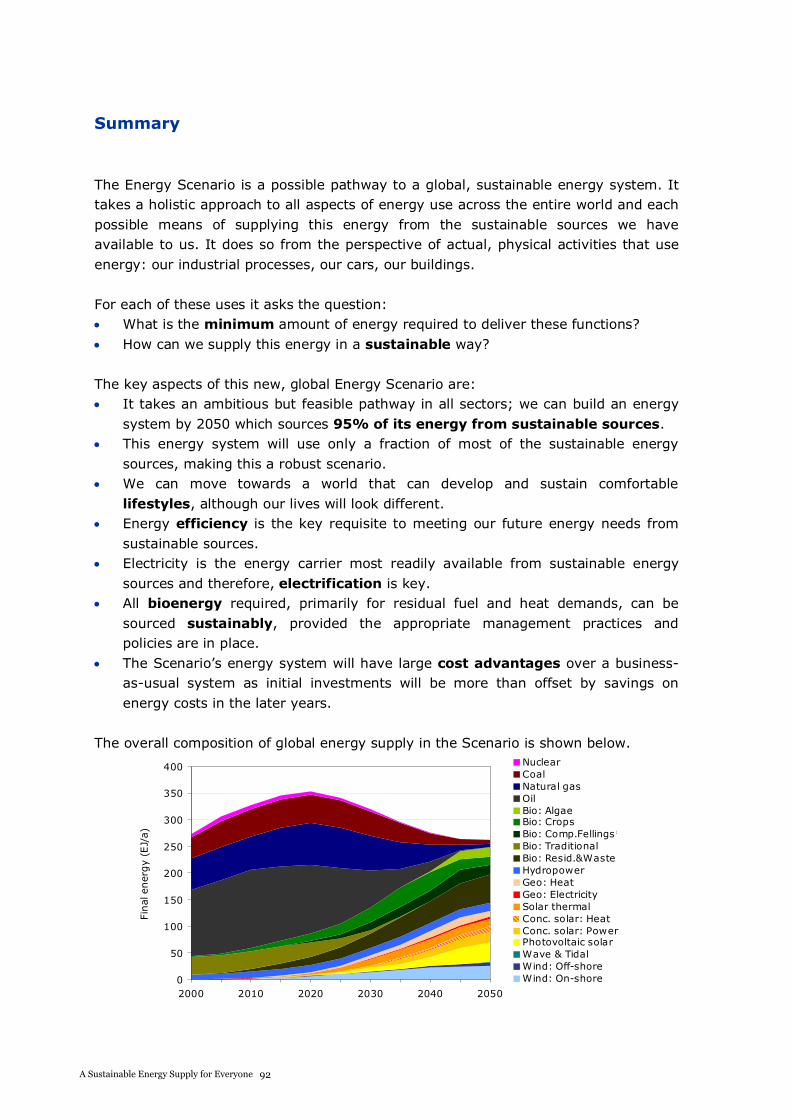
A S USTAI NABLE E NERGY S UPPLY F OR EVERY ONE
Summary
The Energy Scenario is a possible pathway to a global, sustainable energy system. It takes a holistic approach to all aspects of energy use across the entire world and each possible means of supplying this energy from the sustainable sources we have available to us. It does so from the perspective of actual, physical activities that use energy: our industrial processes, our cars, our buildings.
For each of these uses it asks the question: What is the minimum amount of energy required to deliver these functions? How can we supply this energy in a sustainable way?
The key aspects of this new, global Energy Scenario are: It takes an ambitious but feasible pathway in all sectors; we can build an energy system by 2050 which sources 95% of its energy from sustainable sources.This energy system will use only a fraction of most of the sustainable energy sources, making this a robust scenario. We can move towards a world that can develop and sustain comfortable lifestyles, although our lives will look different. Energy efficiency is the key requisite to meeting our future energy needs from sustainable sources. Electricity is the energy carrier most readily available from sustainable energy sources and therefore, electrification is key. All bioenergy required, primarily for residual fuel and heat demands, can be sourced sustainably, provided the appropriate management practices and policies are in place. The Scenario’s energy system will have large cost advantages over a business-as-usual system as initial investments will be more than offset by savings on energy costs in the later years.
The overall composition of global energy supply in the Scenario is shown below.
0
50
100
150
200
250
300
350
400
2000 2010 2020 2030 2040 2050
Final
ener
gy
(EJ/
a)
NuclearCoalNatural gasOilBio: AlgaeBio: CropsBio: Comp.Fellings*Bio: TraditionalBio: Resid.&WasteHydropowerGeo: HeatGeo: ElectricitySolar thermalConc. solar: HeatConc. solar: PowerPhotovoltaic solarWave & TidalWind: Off-shoreWind: On-shore
92A Sustainable Energy Supply for Everyone
A S USTAI NABLE E NERGY S UPPLY F OR EVERY ONE
Summary
The Energy Scenario is a possible pathway to a global, sustainable energy system. It takes a holistic approach to all aspects of energy use across the entire world and each possible means of supplying this energy from the sustainable sources we have available to us. It does so from the perspective of actual, physical activities that use energy: our industrial processes, our cars, our buildings.
For each of these uses it asks the question: What is the minimum amount of energy required to deliver these functions? How can we supply this energy in a sustainable way?
The key aspects of this new, global Energy Scenario are: It takes an ambitious but feasible pathway in all sectors; we can build an energy system by 2050 which sources 95% of its energy from sustainable sources.This energy system will use only a fraction of most of the sustainable energy sources, making this a robust scenario. We can move towards a world that can develop and sustain comfortable lifestyles, although our lives will look different. Energy efficiency is the key requisite to meeting our future energy needs from sustainable sources. Electricity is the energy carrier most readily available from sustainable energy sources and therefore, electrification is key. All bioenergy required, primarily for residual fuel and heat demands, can be sourced sustainably, provided the appropriate management practices and policies are in place. The Scenario’s energy system will have large cost advantages over a business-as-usual system as initial investments will be more than offset by savings on energy costs in the later years.
The overall composition of global energy supply in the Scenario is shown below.
0
50
100
150
200
250
300
350
400
2000 2010 2020 2030 2040 2050
Final
ener
gy
(EJ/
a)
NuclearCoalNatural gasOilBio: AlgaeBio: CropsBio: Comp.Fellings*Bio: TraditionalBio: Resid.&WasteHydropowerGeo: HeatGeo: ElectricitySolar thermalConc. solar: HeatConc. solar: PowerPhotovoltaic solarWave & TidalWind: Off-shoreWind: On-shore
A S USTAI NABLE E NERGY S UPPLY F OR EVERY ONE
Table of contents
1 Introduction ......................................................................................... 103
2 Approach ........................................................................................... 107
2.1 Bioenergy approach ............................................................................ 110
3 Demand ........................................................................................... 115
3.1 Overall results .................................................................................... 115
3.2 Industry ............................................................................................ 119
3.3 Buildings ........................................................................................... 125
3.4 Transport ........................................................................................... 131
4 Supply – Renewable energy (excl. bioenergy) ...................................... 139
4.1 Overall results .................................................................................... 139
4.2 Potentials for renewable power and heat (excl. bioenergy) ....................... 142
4.3 Results – Electricity ............................................................................. 146
4.4 Results – Heat and Fuels for Industry .................................................... 151
4.5 Results – Heat for Buildings ................................................................. 152
4.6 Results – Fuels for Transport ................................................................ 153
4.7 GHG Emissions ................................................................................... 153
5 Supply – Sustainable bioenergy ............................................................ 157
5.1 Summary: Meeting demand with sustainable bioenergy ........................... 157
5.2 Sustainability of bioenergy: Approach to ensure sustainability .................. 161
5.3 Sustainability of bioenergy: Land use and food security ........................... 164
5.4 Sustainability of bioenergy: Agricultural and processing inputs ................. 177
5.5 Sustainability of bioenergy: Complementary fellings ................................ 179
5.6 Sustainability of bioenergy: Use of residues and waste ............................ 183
5.7 Sustainable algae ............................................................................... 186
5.8 Comparison with other studies ............................................................. 189
5.9 Sustainability of bioenergy: Greenhouse gas emission savings ................. 190
6 Investments and Savings ..................................................................... 192
103
107
110
115
115
119
125
131
139
139
142
146
151
152
153
153
157
157
161
164
177
179
183
186
189
190
192
93Part 2 - The Ecofys Energy Scenario
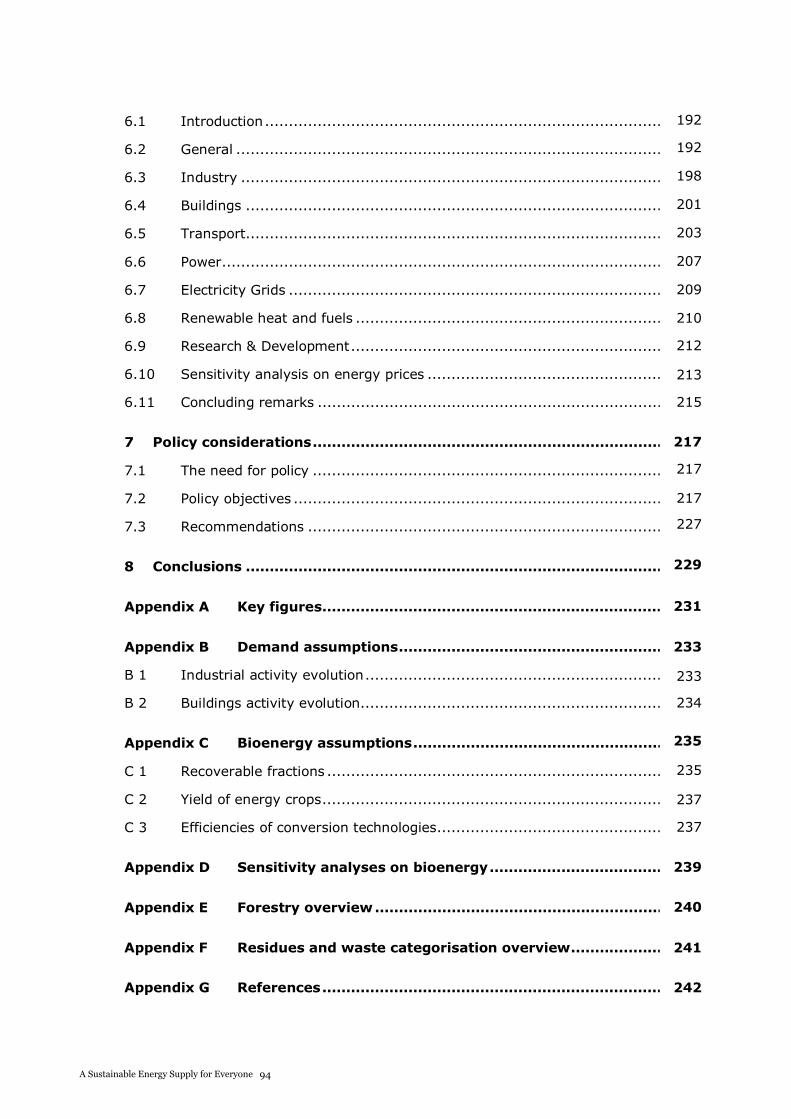
A S USTAI NABLE E NERGY S UPPLY F OR EVERY ONE
6.1 Introduction ....................................................................................... 192
6.2 General ............................................................................................. 192
6.3 Industry ............................................................................................ 198
6.4 Buildings ........................................................................................... 201
6.5 Transport ........................................................................................... 203
6.6 Power ................................................................................................ 207
6.7 Electricity Grids .................................................................................. 209
6.8 Renewable heat and fuels .................................................................... 210
6.9 Research & Development ..................................................................... 212
6.10 Sensitivity analysis on energy prices ..................................................... 213
6.11 Concluding remarks ............................................................................ 215
7 Policy considerations ............................................................................ 217
7.1 The need for policy ............................................................................. 217
7.2 Policy objectives ................................................................................. 217
7.3 Recommendations .............................................................................. 227
8 Conclusions .......................................................................................... 229
Appendix A Key figures .......................................................................... 231
Appendix B Demand assumptions .......................................................... 233
B 1 Industrial activity evolution .................................................................. 233
B 2 Buildings activity evolution ................................................................... 234
Appendix C Bioenergy assumptions ....................................................... 235
C 1 Recoverable fractions .......................................................................... 235
C 2 Yield of energy crops ........................................................................... 237
C 3 Efficiencies of conversion technologies ................................................... 237
Appendix D Sensitivity analyses on bioenergy ....................................... 239
Appendix E Forestry overview ............................................................... 240
Appendix F Residues and waste categorisation overview ...................... 241
Appendix G References .......................................................................... 242
A S USTAI NABLE E NERGY S UPPLY F OR EVERY ONE
G 1 References – Introduction / Approach.................................................... 242
G 2 References – Demand ......................................................................... 242
G 3 References – Supply (excl. bioenergy) ................................................... 243
G 4 References – Bioenergy: General .......................................................... 245
G 5 References – Bioenergy: Residues and waste ......................................... 247
G 6 References – Investments & Savings ..................................................... 250
Appendix H Glossary .............................................................................. 252
192
192
198
201
203
207
209
210
215
217
217
217
227
229
231
233
234
235
235
237
237
241
239
242
212
213
233
240
94A Sustainable Energy Supply for Everyone

A S USTAI NABLE E NERGY S UPPLY F OR EVERY ONE
6.1 Introduction ....................................................................................... 192
6.2 General ............................................................................................. 192
6.3 Industry ............................................................................................ 198
6.4 Buildings ........................................................................................... 201
6.5 Transport ........................................................................................... 203
6.6 Power ................................................................................................ 207
6.7 Electricity Grids .................................................................................. 209
6.8 Renewable heat and fuels .................................................................... 210
6.9 Research & Development ..................................................................... 212
6.10 Sensitivity analysis on energy prices ..................................................... 213
6.11 Concluding remarks ............................................................................ 215
7 Policy considerations ............................................................................ 217
7.1 The need for policy ............................................................................. 217
7.2 Policy objectives ................................................................................. 217
7.3 Recommendations .............................................................................. 227
8 Conclusions .......................................................................................... 229
Appendix A Key figures .......................................................................... 231
Appendix B Demand assumptions .......................................................... 233
B 1 Industrial activity evolution .................................................................. 233
B 2 Buildings activity evolution ................................................................... 234
Appendix C Bioenergy assumptions ....................................................... 235
C 1 Recoverable fractions .......................................................................... 235
C 2 Yield of energy crops ........................................................................... 237
C 3 Efficiencies of conversion technologies ................................................... 237
Appendix D Sensitivity analyses on bioenergy ....................................... 239
Appendix E Forestry overview ............................................................... 240
Appendix F Residues and waste categorisation overview ...................... 241
Appendix G References .......................................................................... 242
A S USTAI NABLE E NERGY S UPPLY F OR EVERY ONE
G 1 References – Introduction / Approach.................................................... 242
G 2 References – Demand ......................................................................... 242
G 3 References – Supply (excl. bioenergy) ................................................... 243
G 4 References – Bioenergy: General .......................................................... 245
G 5 References – Bioenergy: Residues and waste ......................................... 247
G 6 References – Investments & Savings ..................................................... 250
Appendix H Glossary .............................................................................. 252
242
242
243
245
247
250
252
95Part 2 - The Ecofys Energy Scenario
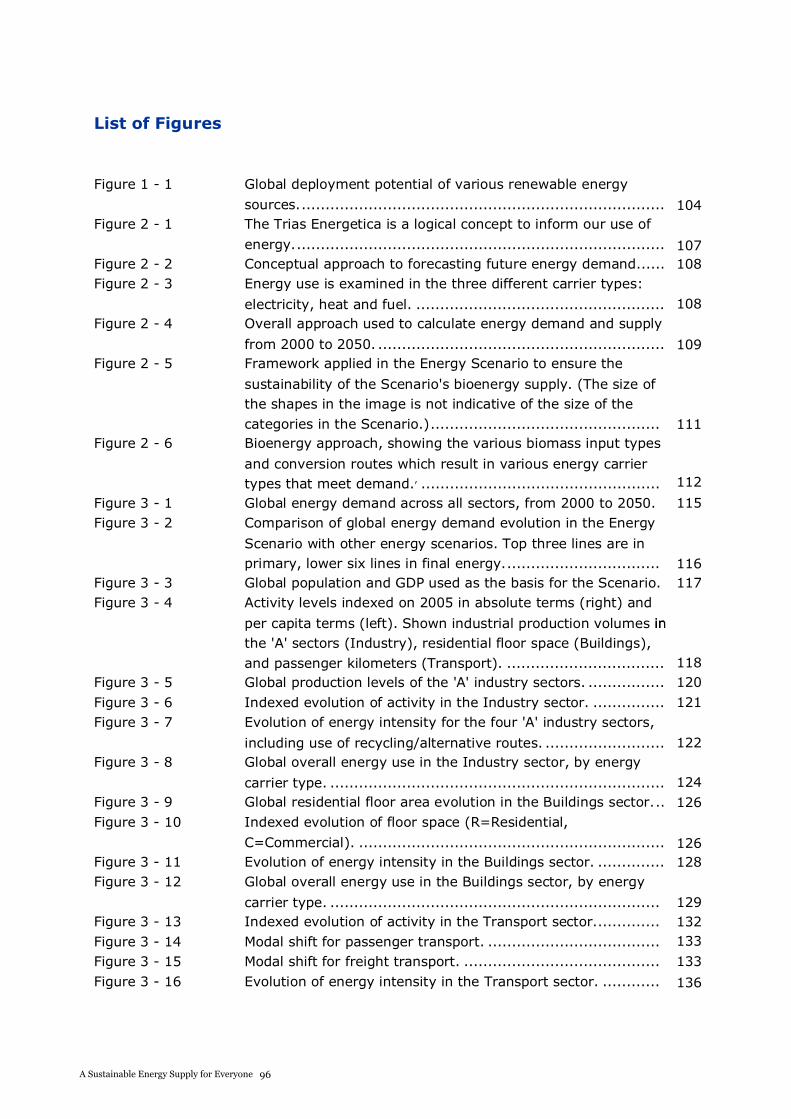
A S USTAI NABLE E NERGY S UPPLY F OR EVERY ONE
List of Figures
Figure 1 - 1 Global deployment potential of various renewable energy
sources. ............................................................................. 104Figure 2 - 1 The Trias Energetica is a logical concept to inform our use of
energy. .............................................................................. 107Figure 2 - 2 Conceptual approach to forecasting future energy demand. ...... 108Figure 2 - 3 Energy use is examined in the three different carrier types:
electricity, heat and fuel. ..................................................... 108Figure 2 - 4 Overall approach used to calculate energy demand and supply
from 2000 to 2050. ............................................................. 109Figure 2 - 5 Framework applied in the Energy Scenario to ensure the
sustainability of the Scenario's bioenergy supply. (The size of the shapes in the image is not indicative of the size of the categories in the Scenario.) .................................................. 111
Figure 2 - 6 Bioenergy approach, showing the various biomass input types
and conversion routes which result in various energy carrier types that meet demand., .................................................... 112
Figure 3 - 1 Global energy demand across all sectors, from 2000 to 2050. .. 115Figure 3 - 2 Comparison of global energy demand evolution in the Energy
Scenario with other energy scenarios. Top three lines are in primary, lower six lines in final energy. .................................. 116
Figure 3 - 3 Global population and GDP used as the basis for the Scenario. . 117Figure 3 - 4 Activity levels indexed on 2005 in absolute terms (right) and
per capita terms (left). Shown industrial production volumes in the 'A' sectors (Industry), residential floor space (Buildings), and passenger kilometers (Transport). .................................. 118
Figure 3 - 5 Global production levels of the 'A' industry sectors. ................. 120Figure 3 - 6 Indexed evolution of activity in the Industry sector. ................ 121Figure 3 - 7 Evolution of energy intensity for the four 'A' industry sectors,
including use of recycling/alternative routes. .......................... 122Figure 3 - 8 Global overall energy use in the Industry sector, by energy
carrier type. ....................................................................... 124Figure 3 - 9 Global residential floor area evolution in the Buildings sector. ... 126Figure 3 - 10 Indexed evolution of floor space (R=Residential,
C=Commercial). ................................................................. 126Figure 3 - 11 Evolution of energy intensity in the Buildings sector. ............... 128Figure 3 - 12 Global overall energy use in the Buildings sector, by energy
carrier type. ....................................................................... 129Figure 3 - 13 Indexed evolution of activity in the Transport sector. ............... 132Figure 3 - 14 Modal shift for passenger transport. ...................................... 133Figure 3 - 15 Modal shift for freight transport. ........................................... 133Figure 3 - 16 Evolution of energy intensity in the Transport sector. .............. 136
104
107108
108
109
120
121
115
118
124
122
126
126
132
133
136
111
112
116
129
128
133
A S USTAI NABLE E NERGY S UPPLY F OR EVERY ONE
List of Figures
Figure 1 - 1 Global deployment potential of various renewable energy
sources. ............................................................................. 104Figure 2 - 1 The Trias Energetica is a logical concept to inform our use of
energy. .............................................................................. 107Figure 2 - 2 Conceptual approach to forecasting future energy demand. ...... 108Figure 2 - 3 Energy use is examined in the three different carrier types:
electricity, heat and fuel. ..................................................... 108Figure 2 - 4 Overall approach used to calculate energy demand and supply
from 2000 to 2050. ............................................................. 109Figure 2 - 5 Framework applied in the Energy Scenario to ensure the
sustainability of the Scenario's bioenergy supply. (The size of the shapes in the image is not indicative of the size of the categories in the Scenario.) .................................................. 111
Figure 2 - 6 Bioenergy approach, showing the various biomass input types
and conversion routes which result in various energy carrier types that meet demand., .................................................... 112
Figure 3 - 1 Global energy demand across all sectors, from 2000 to 2050. .. 115Figure 3 - 2 Comparison of global energy demand evolution in the Energy
Scenario with other energy scenarios. Top three lines are in primary, lower six lines in final energy. .................................. 116
Figure 3 - 3 Global population and GDP used as the basis for the Scenario. . 117Figure 3 - 4 Activity levels indexed on 2005 in absolute terms (right) and
per capita terms (left). Shown industrial production volumes in the 'A' sectors (Industry), residential floor space (Buildings), and passenger kilometers (Transport). .................................. 118
Figure 3 - 5 Global production levels of the 'A' industry sectors. ................. 120Figure 3 - 6 Indexed evolution of activity in the Industry sector. ................ 121Figure 3 - 7 Evolution of energy intensity for the four 'A' industry sectors,
including use of recycling/alternative routes. .......................... 122Figure 3 - 8 Global overall energy use in the Industry sector, by energy
carrier type. ....................................................................... 124Figure 3 - 9 Global residential floor area evolution in the Buildings sector. ... 126Figure 3 - 10 Indexed evolution of floor space (R=Residential,
C=Commercial). ................................................................. 126Figure 3 - 11 Evolution of energy intensity in the Buildings sector. ............... 128Figure 3 - 12 Global overall energy use in the Buildings sector, by energy
carrier type. ....................................................................... 129Figure 3 - 13 Indexed evolution of activity in the Transport sector. ............... 132Figure 3 - 14 Modal shift for passenger transport. ...................................... 133Figure 3 - 15 Modal shift for freight transport. ........................................... 133Figure 3 - 16 Evolution of energy intensity in the Transport sector. .............. 136
117
96A Sustainable Energy Supply for Everyone
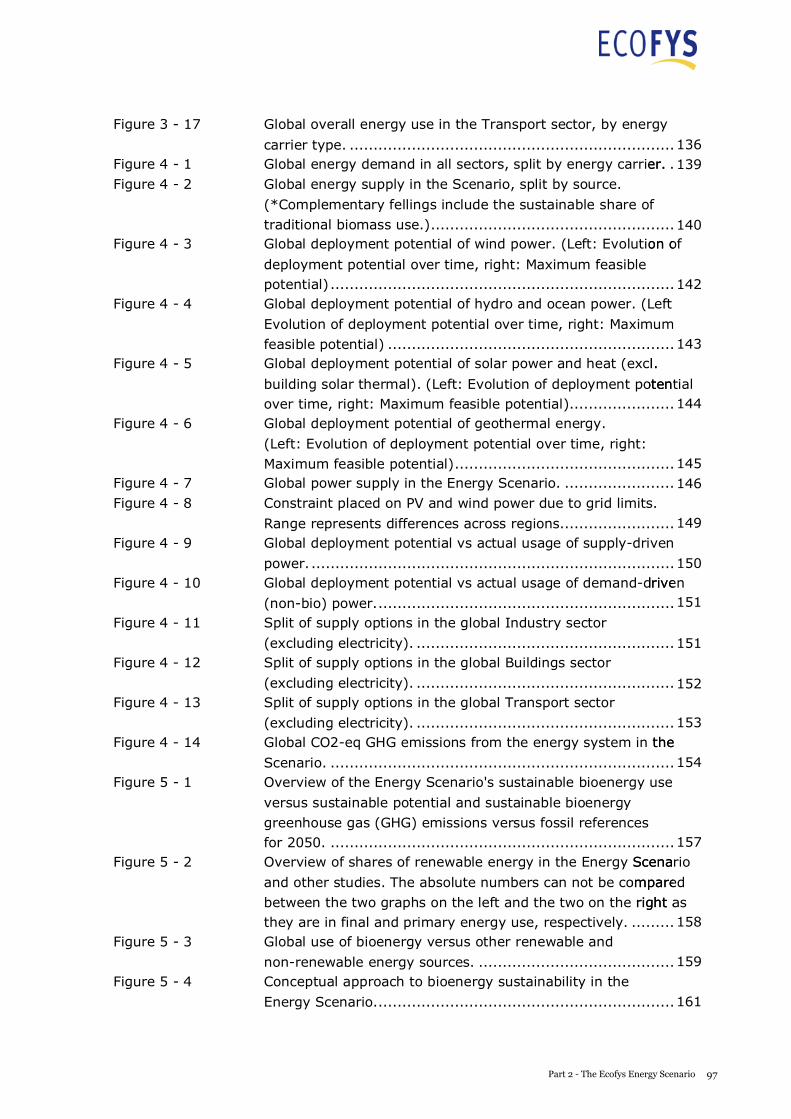
A S USTAI NABLE E NERGY S UPPLY F OR EVERY ONE
Figure 3 - 17 Global overall energy use in the Transport sector, by energy
carrier type. ....................................................................... 136Figure 4 - 1 Global energy demand in all sectors, split by energy carrier. .... 139Figure 4 - 2 Global energy supply in the Scenario, split by source.
(*Complementary fellings include the sustainable share of traditional biomass use.) ...................................................... 140
Figure 4 - 3 Global deployment potential of wind power. (Left: Evolution of
deployment potential over time, right: Maximum feasible potential) ........................................................................... 142
Figure 4 - 4 Global deployment potential of hydro and ocean power. (Left:
Evolution of deployment potential over time, right: Maximum feasible potential) ............................................................... 143
Figure 4 - 5 Global deployment potential of solar power and heat (excl.
building solar thermal). (Left: Evolution of deployment potential over time, right: Maximum feasible potential) ......................... 144
Figure 4 - 6 Global deployment potential of geothermal energy.
(Left: Evolution of deployment potential over time, right: Maximum feasible potential) ................................................. 145
Figure 4 - 7 Global power supply in the Energy Scenario. .......................... 146Figure 4 - 8 Constraint placed on PV and wind power due to grid limits.
Range represents differences across regions. .......................... 149Figure 4 - 9 Global deployment potential vs actual usage of supply-driven
power. ............................................................................... 150Figure 4 - 10 Global deployment potential vs actual usage of demand-driven
(non-bio) power. ................................................................. 151Figure 4 - 11 Split of supply options in the global Industry sector
(excluding electricity). ......................................................... 151Figure 4 - 12 Split of supply options in the global Buildings sector
(excluding electricity). ......................................................... 152Figure 4 - 13 Split of supply options in the global Transport sector
(excluding electricity). ......................................................... 153Figure 4 - 14 Global CO2-eq GHG emissions from the energy system in the
Scenario. ........................................................................... 154Figure 5 - 1 Overview of the Energy Scenario's sustainable bioenergy use
versus sustainable potential and sustainable bioenergy greenhouse gas (GHG) emissions versus fossil references for 2050. ........................................................................... 157
Figure 5 - 2 Overview of shares of renewable energy in the Energy Scenario
and other studies. The absolute numbers can not be compared between the two graphs on the left and the two on the right as they are in final and primary energy use, respectively. ............ 158
Figure 5 - 3 Global use of bioenergy versus other renewable and
non-renewable energy sources. ............................................ 159Figure 5 - 4 Conceptual approach to bioenergy sustainability in the
Energy Scenario. ................................................................. 161
140
142
144
145146
149
150
151
152
153
154
157
158
159
161
A S USTAI NABLE E NERGY S UPPLY F OR EVERY ONE
Figure 3 - 17 Global overall energy use in the Transport sector, by energy
carrier type. ....................................................................... 136Figure 4 - 1 Global energy demand in all sectors, split by energy carrier. .... 139Figure 4 - 2 Global energy supply in the Scenario, split by source.
(*Complementary fellings include the sustainable share of traditional biomass use.) ...................................................... 140
Figure 4 - 3 Global deployment potential of wind power. (Left: Evolution of
deployment potential over time, right: Maximum feasible potential) ........................................................................... 142
Figure 4 - 4 Global deployment potential of hydro and ocean power. (Left:
Evolution of deployment potential over time, right: Maximum feasible potential) ............................................................... 143
Figure 4 - 5 Global deployment potential of solar power and heat (excl.
building solar thermal). (Left: Evolution of deployment potential over time, right: Maximum feasible potential) ......................... 144
Figure 4 - 6 Global deployment potential of geothermal energy.
(Left: Evolution of deployment potential over time, right: Maximum feasible potential) ................................................. 145
Figure 4 - 7 Global power supply in the Energy Scenario. .......................... 146Figure 4 - 8 Constraint placed on PV and wind power due to grid limits.
Range represents differences across regions. .......................... 149Figure 4 - 9 Global deployment potential vs actual usage of supply-driven
power. ............................................................................... 150Figure 4 - 10 Global deployment potential vs actual usage of demand-driven
(non-bio) power. ................................................................. 151Figure 4 - 11 Split of supply options in the global Industry sector
(excluding electricity). ......................................................... 151Figure 4 - 12 Split of supply options in the global Buildings sector
(excluding electricity). ......................................................... 152Figure 4 - 13 Split of supply options in the global Transport sector
(excluding electricity). ......................................................... 153Figure 4 - 14 Global CO2-eq GHG emissions from the energy system in the
Scenario. ........................................................................... 154Figure 5 - 1 Overview of the Energy Scenario's sustainable bioenergy use
versus sustainable potential and sustainable bioenergy greenhouse gas (GHG) emissions versus fossil references for 2050. ........................................................................... 157
Figure 5 - 2 Overview of shares of renewable energy in the Energy Scenario
and other studies. The absolute numbers can not be compared between the two graphs on the left and the two on the right as they are in final and primary energy use, respectively. ............ 158
Figure 5 - 3 Global use of bioenergy versus other renewable and
non-renewable energy sources. ............................................ 159Figure 5 - 4 Conceptual approach to bioenergy sustainability in the
Energy Scenario. ................................................................. 161
136139
143
151
97Part 2 - The Ecofys Energy Scenario
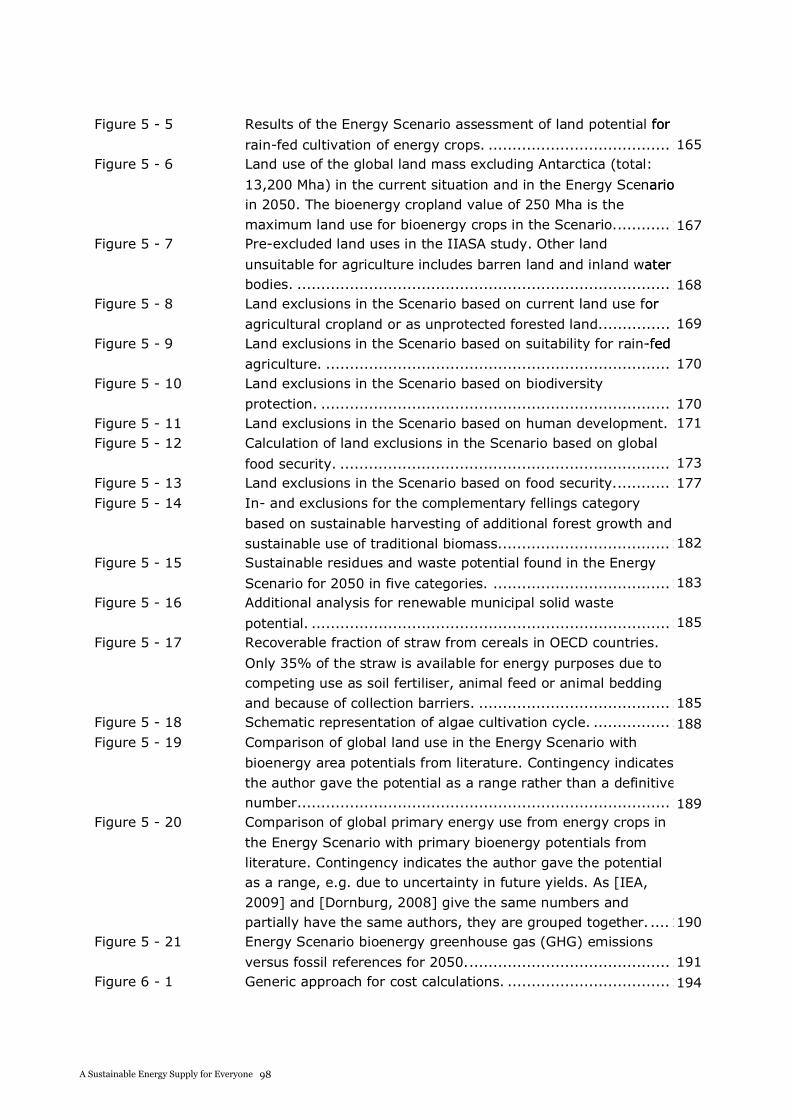
A S USTAI NABLE E NERGY S UPPLY F OR EVERY ONE
Figure 6 - 2 Indexed development of energy prices. A (weighted) average
(w.a.) is shown for the biomass index, which carries a large uncertainty......................................................................... 195
Figure 6 - 3 Total global annual cost results for Energy Scenario. ............... 196Figure 6 - 4 Net cost results per sector.................................................... 197Figure 6 - 5 Comparison of cost results with global GDP. ........................... 197Figure 6 - 6 Approach for industry. ......................................................... 198Figure 6 - 7 Results for industry (all sectors). .......................................... 200Figure 6 - 8 Approach for buildings. ........................................................ 201Figure 6 - 9 Unit costs development for buildings. .................................... 202Figure 6 - 10 Results for buildings. ........................................................... 202Figure 6 - 11 Approach for total transport. ................................................ 203Figure 6 - 12 Approach for transport - infrastructure. ................................. 204Figure 6 - 13 Approach for transport - vehicle technology............................ 204Figure 6 - 14 Results for transport - infrastructure. .................................... 205Figure 6 - 15 Results for transport - vehicle technology............................... 206Figure 6 - 16 Approach for power. ............................................................ 207Figure 6 - 17 Results for power. ............................................................... 208Figure 6 - 18 Approach for electricity grids. ............................................... 209Figure 6 - 19 Results for electricity grids. .................................................. 210Figure 6 - 20 Approach for bioenergy. ....................................................... 211Figure 6 - 21 Results for renewable heat & fuels. ....................................... 211Figure 6 - 22 Approach for R&D. .............................................................. 213Figure 6 - 23 Results for research & development. ..................................... 213Figure 6 - 24 Energy price ranges used for the sensitivity analysis. .............. 214Figure 6 - 25 Net results for different energy price scenarios. ...................... 215Figure 8 - 1 Evolution of energy supply in the Energy Scenario, showing the
key developments. .............................................................. 229Figure 8 - 2 Evolution of per capita renewable and non-renewable energy
demand. ............................................................................ 230Figure B - 1 Stylised intensity of use curves (from [Bernardini, 1993]). ....... 233Figure B - 2 Stylised relationship between floor area and GDP per capita.
[IEA, 2004] ........................................................................ 234Figure E - 1 Schematic to show overview of flow of forest products into
different bioenergy categories in the Scenario. (RF=recoverable fraction)............................................................................. 240
Figure F - 1 Schematic to show overview of residue and waste flows in the
Scenario, differentiating between primary, secondary and tertiary residues and waste. ................................................. 241
A S USTAI NABLE E NERGY S UPPLY F OR EVERY ONE
Figure 5 - 5 Results of the Energy Scenario assessment of land potential for
rain-fed cultivation of energy crops. ...................................... 165Figure 5 - 6 Land use of the global land mass excluding Antarctica (total:
13,200 Mha) in the current situation and in the Energy Scenario in 2050. The bioenergy cropland value of 250 Mha is the maximum land use for bioenergy crops in the Scenario. ........... 167
Figure 5 - 7 Pre-excluded land uses in the IIASA study. Other land
unsuitable for agriculture includes barren land and inland water bodies. .............................................................................. 168
Figure 5 - 8 Land exclusions in the Scenario based on current land use for
agricultural cropland or as unprotected forested land. .............. 169Figure 5 - 9 Land exclusions in the Scenario based on suitability for rain-fed
agriculture. ........................................................................ 170Figure 5 - 10 Land exclusions in the Scenario based on biodiversity
protection. ......................................................................... 170Figure 5 - 11 Land exclusions in the Scenario based on human development. 171Figure 5 - 12 Calculation of land exclusions in the Scenario based on global
food security. ..................................................................... 173Figure 5 - 13 Land exclusions in the Scenario based on food security. ........... 177Figure 5 - 14 In- and exclusions for the complementary fellings category
based on sustainable harvesting of additional forest growth and sustainable use of traditional biomass. ................................... 182
Figure 5 - 15 Sustainable residues and waste potential found in the Energy
Scenario for 2050 in five categories. ..................................... 183Figure 5 - 16 Additional analysis for renewable municipal solid waste
potential. ........................................................................... 185Figure 5 - 17 Recoverable fraction of straw from cereals in OECD countries.
Only 35% of the straw is available for energy purposes due to competing use as soil fertiliser, animal feed or animal bedding and because of collection barriers. ........................................ 185
Figure 5 - 18 Schematic representation of algae cultivation cycle. ................ 188Figure 5 - 19 Comparison of global land use in the Energy Scenario with
bioenergy area potentials from literature. Contingency indicates the author gave the potential as a range rather than a definitive number. ............................................................................. 189
Figure 5 - 20 Comparison of global primary energy use from energy crops in
the Energy Scenario with primary bioenergy potentials from literature. Contingency indicates the author gave the potential as a range, e.g. due to uncertainty in future yields. As [IEA, 2009] and [Dornburg, 2008] give the same numbers and partially have the same authors, they are grouped together. .... 190
Figure 5 - 21 Energy Scenario bioenergy greenhouse gas (GHG) emissions
versus fossil references for 2050. .......................................... 191Figure 6 - 1 Generic approach for cost calculations. .................................. 194
165
167
168
169
170171
177
182
183
185
188
189
191
194
170
185
A S USTAI NABLE E NERGY S UPPLY F OR EVERY ONE
Figure 5 - 5 Results of the Energy Scenario assessment of land potential for
rain-fed cultivation of energy crops. ...................................... 165Figure 5 - 6 Land use of the global land mass excluding Antarctica (total:
13,200 Mha) in the current situation and in the Energy Scenario in 2050. The bioenergy cropland value of 250 Mha is the maximum land use for bioenergy crops in the Scenario. ........... 167
Figure 5 - 7 Pre-excluded land uses in the IIASA study. Other land
unsuitable for agriculture includes barren land and inland water bodies. .............................................................................. 168
Figure 5 - 8 Land exclusions in the Scenario based on current land use for
agricultural cropland or as unprotected forested land. .............. 169Figure 5 - 9 Land exclusions in the Scenario based on suitability for rain-fed
agriculture. ........................................................................ 170Figure 5 - 10 Land exclusions in the Scenario based on biodiversity
protection. ......................................................................... 170Figure 5 - 11 Land exclusions in the Scenario based on human development. 171Figure 5 - 12 Calculation of land exclusions in the Scenario based on global
food security. ..................................................................... 173Figure 5 - 13 Land exclusions in the Scenario based on food security. ........... 177Figure 5 - 14 In- and exclusions for the complementary fellings category
based on sustainable harvesting of additional forest growth and sustainable use of traditional biomass. ................................... 182
Figure 5 - 15 Sustainable residues and waste potential found in the Energy
Scenario for 2050 in five categories. ..................................... 183Figure 5 - 16 Additional analysis for renewable municipal solid waste
potential. ........................................................................... 185Figure 5 - 17 Recoverable fraction of straw from cereals in OECD countries.
Only 35% of the straw is available for energy purposes due to competing use as soil fertiliser, animal feed or animal bedding and because of collection barriers. ........................................ 185
Figure 5 - 18 Schematic representation of algae cultivation cycle. ................ 188Figure 5 - 19 Comparison of global land use in the Energy Scenario with
bioenergy area potentials from literature. Contingency indicates the author gave the potential as a range rather than a definitive number. ............................................................................. 189
Figure 5 - 20 Comparison of global primary energy use from energy crops in
the Energy Scenario with primary bioenergy potentials from literature. Contingency indicates the author gave the potential as a range, e.g. due to uncertainty in future yields. As [IEA, 2009] and [Dornburg, 2008] give the same numbers and partially have the same authors, they are grouped together. .... 190
Figure 5 - 21 Energy Scenario bioenergy greenhouse gas (GHG) emissions
versus fossil references for 2050. .......................................... 191Figure 6 - 1 Generic approach for cost calculations. .................................. 194
190
173
98A Sustainable Energy Supply for Everyone
A S USTAI NABLE E NERGY S UPPLY F OR EVERY ONE
Figure 6 - 2 Indexed development of energy prices. A (weighted) average
(w.a.) is shown for the biomass index, which carries a large uncertainty......................................................................... 195
Figure 6 - 3 Total global annual cost results for Energy Scenario. ............... 196Figure 6 - 4 Net cost results per sector.................................................... 197Figure 6 - 5 Comparison of cost results with global GDP. ........................... 197Figure 6 - 6 Approach for industry. ......................................................... 198Figure 6 - 7 Results for industry (all sectors). .......................................... 200Figure 6 - 8 Approach for buildings. ........................................................ 201Figure 6 - 9 Unit costs development for buildings. .................................... 202Figure 6 - 10 Results for buildings. ........................................................... 202Figure 6 - 11 Approach for total transport. ................................................ 203Figure 6 - 12 Approach for transport - infrastructure. ................................. 204Figure 6 - 13 Approach for transport - vehicle technology............................ 204Figure 6 - 14 Results for transport - infrastructure. .................................... 205Figure 6 - 15 Results for transport - vehicle technology............................... 206Figure 6 - 16 Approach for power. ............................................................ 207Figure 6 - 17 Results for power. ............................................................... 208Figure 6 - 18 Approach for electricity grids. ............................................... 209Figure 6 - 19 Results for electricity grids. .................................................. 210Figure 6 - 20 Approach for bioenergy. ....................................................... 211Figure 6 - 21 Results for renewable heat & fuels. ....................................... 211Figure 6 - 22 Approach for R&D. .............................................................. 213Figure 6 - 23 Results for research & development. ..................................... 213Figure 6 - 24 Energy price ranges used for the sensitivity analysis. .............. 214Figure 6 - 25 Net results for different energy price scenarios. ...................... 215Figure 8 - 1 Evolution of energy supply in the Energy Scenario, showing the
key developments. .............................................................. 229Figure 8 - 2 Evolution of per capita renewable and non-renewable energy
demand. ............................................................................ 230Figure B - 1 Stylised intensity of use curves (from [Bernardini, 1993]). ....... 233Figure B - 2 Stylised relationship between floor area and GDP per capita.
[IEA, 2004] ........................................................................ 234Figure E - 1 Schematic to show overview of flow of forest products into
different bioenergy categories in the Scenario. (RF=recoverable fraction)............................................................................. 240
Figure F - 1 Schematic to show overview of residue and waste flows in the
Scenario, differentiating between primary, secondary and tertiary residues and waste. ................................................. 241
A S USTAI NABLE E NERGY S UPPLY F OR EVERY ONE
Figure 5 - 5 Results of the Energy Scenario assessment of land potential for
rain-fed cultivation of energy crops. ...................................... 165Figure 5 - 6 Land use of the global land mass excluding Antarctica (total:
13,200 Mha) in the current situation and in the Energy Scenario in 2050. The bioenergy cropland value of 250 Mha is the maximum land use for bioenergy crops in the Scenario. ........... 167
Figure 5 - 7 Pre-excluded land uses in the IIASA study. Other land
unsuitable for agriculture includes barren land and inland water bodies. .............................................................................. 168
Figure 5 - 8 Land exclusions in the Scenario based on current land use for
agricultural cropland or as unprotected forested land. .............. 169Figure 5 - 9 Land exclusions in the Scenario based on suitability for rain-fed
agriculture. ........................................................................ 170Figure 5 - 10 Land exclusions in the Scenario based on biodiversity
protection. ......................................................................... 170Figure 5 - 11 Land exclusions in the Scenario based on human development. 171Figure 5 - 12 Calculation of land exclusions in the Scenario based on global
food security. ..................................................................... 173Figure 5 - 13 Land exclusions in the Scenario based on food security. ........... 177Figure 5 - 14 In- and exclusions for the complementary fellings category
based on sustainable harvesting of additional forest growth and sustainable use of traditional biomass. ................................... 182
Figure 5 - 15 Sustainable residues and waste potential found in the Energy
Scenario for 2050 in five categories. ..................................... 183Figure 5 - 16 Additional analysis for renewable municipal solid waste
potential. ........................................................................... 185Figure 5 - 17 Recoverable fraction of straw from cereals in OECD countries.
Only 35% of the straw is available for energy purposes due to competing use as soil fertiliser, animal feed or animal bedding and because of collection barriers. ........................................ 185
Figure 5 - 18 Schematic representation of algae cultivation cycle. ................ 188Figure 5 - 19 Comparison of global land use in the Energy Scenario with
bioenergy area potentials from literature. Contingency indicates the author gave the potential as a range rather than a definitive number. ............................................................................. 189
Figure 5 - 20 Comparison of global primary energy use from energy crops in
the Energy Scenario with primary bioenergy potentials from literature. Contingency indicates the author gave the potential as a range, e.g. due to uncertainty in future yields. As [IEA, 2009] and [Dornburg, 2008] give the same numbers and partially have the same authors, they are grouped together. .... 190
Figure 5 - 21 Energy Scenario bioenergy greenhouse gas (GHG) emissions
versus fossil references for 2050. .......................................... 191Figure 6 - 1 Generic approach for cost calculations. .................................. 194
196197
200
202202
204
204
206207
209210
211
213
214
215
229
230233
234
240
195
A S USTAI NABLE E NERGY S UPPLY F OR EVERY ONE
Figure 6 - 2 Indexed development of energy prices. A (weighted) average
(w.a.) is shown for the biomass index, which carries a large uncertainty......................................................................... 195
Figure 6 - 3 Total global annual cost results for Energy Scenario. ............... 196Figure 6 - 4 Net cost results per sector.................................................... 197Figure 6 - 5 Comparison of cost results with global GDP. ........................... 197Figure 6 - 6 Approach for industry. ......................................................... 198Figure 6 - 7 Results for industry (all sectors). .......................................... 200Figure 6 - 8 Approach for buildings. ........................................................ 201Figure 6 - 9 Unit costs development for buildings. .................................... 202Figure 6 - 10 Results for buildings. ........................................................... 202Figure 6 - 11 Approach for total transport. ................................................ 203Figure 6 - 12 Approach for transport - infrastructure. ................................. 204Figure 6 - 13 Approach for transport - vehicle technology............................ 204Figure 6 - 14 Results for transport - infrastructure. .................................... 205Figure 6 - 15 Results for transport - vehicle technology............................... 206Figure 6 - 16 Approach for power. ............................................................ 207Figure 6 - 17 Results for power. ............................................................... 208Figure 6 - 18 Approach for electricity grids. ............................................... 209Figure 6 - 19 Results for electricity grids. .................................................. 210Figure 6 - 20 Approach for bioenergy. ....................................................... 211Figure 6 - 21 Results for renewable heat & fuels. ....................................... 211Figure 6 - 22 Approach for R&D. .............................................................. 213Figure 6 - 23 Results for research & development. ..................................... 213Figure 6 - 24 Energy price ranges used for the sensitivity analysis. .............. 214Figure 6 - 25 Net results for different energy price scenarios. ...................... 215Figure 8 - 1 Evolution of energy supply in the Energy Scenario, showing the
key developments. .............................................................. 229Figure 8 - 2 Evolution of per capita renewable and non-renewable energy
demand. ............................................................................ 230Figure B - 1 Stylised intensity of use curves (from [Bernardini, 1993]). ....... 233Figure B - 2 Stylised relationship between floor area and GDP per capita.
[IEA, 2004] ........................................................................ 234Figure E - 1 Schematic to show overview of flow of forest products into
different bioenergy categories in the Scenario. (RF=recoverable fraction)............................................................................. 240
Figure F - 1 Schematic to show overview of residue and waste flows in the
Scenario, differentiating between primary, secondary and tertiary residues and waste. ................................................. 241
A S USTAI NABLE E NERGY S UPPLY F OR EVERY ONE
Figure 6 - 2 Indexed development of energy prices. A (weighted) average
(w.a.) is shown for the biomass index, which carries a large uncertainty......................................................................... 195
Figure 6 - 3 Total global annual cost results for Energy Scenario. ............... 196Figure 6 - 4 Net cost results per sector.................................................... 197Figure 6 - 5 Comparison of cost results with global GDP. ........................... 197Figure 6 - 6 Approach for industry. ......................................................... 198Figure 6 - 7 Results for industry (all sectors). .......................................... 200Figure 6 - 8 Approach for buildings. ........................................................ 201Figure 6 - 9 Unit costs development for buildings. .................................... 202Figure 6 - 10 Results for buildings. ........................................................... 202Figure 6 - 11 Approach for total transport. ................................................ 203Figure 6 - 12 Approach for transport - infrastructure. ................................. 204Figure 6 - 13 Approach for transport - vehicle technology............................ 204Figure 6 - 14 Results for transport - infrastructure. .................................... 205Figure 6 - 15 Results for transport - vehicle technology............................... 206Figure 6 - 16 Approach for power. ............................................................ 207Figure 6 - 17 Results for power. ............................................................... 208Figure 6 - 18 Approach for electricity grids. ............................................... 209Figure 6 - 19 Results for electricity grids. .................................................. 210Figure 6 - 20 Approach for bioenergy. ....................................................... 211Figure 6 - 21 Results for renewable heat & fuels. ....................................... 211Figure 6 - 22 Approach for R&D. .............................................................. 213Figure 6 - 23 Results for research & development. ..................................... 213Figure 6 - 24 Energy price ranges used for the sensitivity analysis. .............. 214Figure 6 - 25 Net results for different energy price scenarios. ...................... 215Figure 8 - 1 Evolution of energy supply in the Energy Scenario, showing the
key developments. .............................................................. 229Figure 8 - 2 Evolution of per capita renewable and non-renewable energy
demand. ............................................................................ 230Figure B - 1 Stylised intensity of use curves (from [Bernardini, 1993]). ....... 233Figure B - 2 Stylised relationship between floor area and GDP per capita.
[IEA, 2004] ........................................................................ 234Figure E - 1 Schematic to show overview of flow of forest products into
different bioenergy categories in the Scenario. (RF=recoverable fraction)............................................................................. 240
Figure F - 1 Schematic to show overview of residue and waste flows in the
Scenario, differentiating between primary, secondary and tertiary residues and waste. ................................................. 241
197198
201
203
205
208
211
213
241
99Part 2 - The Ecofys Energy Scenario
A S USTAI NABLE E NERGY S UPPLY F OR EVERY ONE
Table C - 1 Recoverable fractions of residues used in the
Energy Scenario. ................................................................. 236Table C - 2 Yields of energy crops used in the Energy Scenario. ................ 237Table C - 3 Conversion efficiencies of bioenergy technologies. ................... 238Table D - 1 Basic sensitivity analysis on bioenergy from crops. .................. 239
List of Boxes
Box 2 - 1 Contingency: Technology choices on bioenergy conversion ....... 113Box 3 - 1 Case study: State-of-the-art plants save energy in the
cement industry. ................................................................. 123Box 3 - 2 Story: Retrofit rates in Buildings. .......................................... 129Box 3 - 3 Case study: Building cooling demand in mediterranean
countries. ........................................................................... 130Box 3 - 4 Story: Material needs for batteries. ....................................... 134Box 3 - 5 Contingency: Freight transport. ............................................ 137Box 4 - 1 Story: The role of hydrogen fuel in the Energy Scenario. .......... 141Box 4 - 2 Story: The sustainability of renewable energy. ........................ 146Box 4 - 3 Story: Supply- versus demand-driven electricity sources. ........ 147Box 5 - 1 Contingency: Materials from biomass. ................................... 160Box 5 - 2 Case study: Sustainable land use by sugar cane and cattle
integration. ........................................................................ 163Box 5 - 3 Story: Land use in the Energy Scenario. ................................ 167Box 5 - 4 Story: The role of livestock feeding in global land use .............. 174Box 5 - 5 Contingency: Modelling the future demand for, and supply of,
food. ................................................................................. 175Box 5 - 6 Story: Water use for bioenergy in the Energy Scenario. ........... 178Box 5 - 7 Story: Forests in the Energy Scenario. ................................... 180Box 5 - 8 Case study: Microalgae as an energy source ........................... 188
Appendices
Appendix A Key figures ......................................................................... 231Appendix B Demand assumptions .......................................................... 233Appendix C Bioenergy assumptions ........................................................ 235Appendix D Sensitivity analyses on bioenergy .......................................... 239Appendix E Forestry overview ............................................................... 240Appendix F Residues and waste categorisation overview ........................... 241Appendix G References ......................................................................... 242Appendix H Glossary ............................................................................ 252
A S USTAI NABLE E NERGY S UPPLY F OR EVERY ONE
List of Tables
Table 3 - 1 Industry sector definitions .................................................... 119Table 3 - 2 Building sector definitions. ................................................... 125Table 3 - 3 Transport sector definitions .................................................. 131Table 3 - 4 Efficiency and fuel shift assumptions for all transport modes. ... 135Table 4 - 1 Classification of RES power into supply-driven and demand-
driven (balancing) options. ................................................... 148Table 5 - 1 Sustainability criteria used for bioenergy. ............................... 162Table 5 - 2 Additional need for cropland for food: Effect of different
assumptions for food supply and demand and their balance. .... 176Table 6 - 1 Lifetime years and progress ratios used by sector. .................. 195Table 6 - 2 Payback years per industry sub-sector ................................... 199Table 6 - 3 Investments and progress ratios per measures and sector
(in EUR/m2 floor area). ....................................................... 201Table 6 - 4 Capacity costs of RES electricity (000s EUR/ MW). .................. 207Table 7 - 1 Overview of critical public policy needs. ................................. 218Table 7 - 2 Overview of critical private sector efforts and required support
policies. ............................................................................. 219Table 7 - 3 Demand-side policy suggestions for the Buildings sector:
retrofit. .............................................................................. 220Table 7 - 4 Demand-side policy suggestions for the Buildings sector: new
build. ................................................................................. 220Table 7 - 5 Demand-side policy suggestions for the Buildings sector:
appliances etc. .................................................................... 221Table 7 - 6 Demand-side policy suggestions for the Transport sector: modal
shift. ................................................................................. 221Table 7 - 7 Demand-side policy suggestions for the Transport sector:
electrification. ..................................................................... 222Table 7 - 8 Demand-side policy suggestions for the Industry sector. .......... 222Table 7 - 9 Supply-side policy suggestions: renewable heat and power. ..... 223Table 7 - 10 Supply-side policy suggestions: power grids. .......................... 223Table 7 - 11 Supply-side policy suggestions: energy transition for the rural
poor. ................................................................................. 223Table 7 - 12 Bioenergy policy suggestions and examples: land use.............. 225Table 7 - 13 Bioenergy policy suggestions and examples: agricultural and
processing inputs. ............................................................... 225Table 7 - 14 Bioenergy policy suggestions and examples: Residues and
waste. ............................................................................... 226Table 7 - 15 Bioenergy policy suggestions and examples: Complementary
fellings............................................................................... 227Table A - 1 Global energy provided by source and year (EJ/a). .................. 231Table A - 2 Global energy provided by source and year (EJ/a) -
Percentages. ...................................................................... 232
192
192
198
125
131135
148
195
199
201207
218
219
220
221
221
222
222
223223
225
223
226
162
176
225
A S USTAI NABLE E NERGY S UPPLY F OR EVERY ONE
List of Tables
Table 3 - 1 Industry sector definitions .................................................... 119Table 3 - 2 Building sector definitions. ................................................... 125Table 3 - 3 Transport sector definitions .................................................. 131Table 3 - 4 Efficiency and fuel shift assumptions for all transport modes. ... 135Table 4 - 1 Classification of RES power into supply-driven and demand-
driven (balancing) options. ................................................... 148Table 5 - 1 Sustainability criteria used for bioenergy. ............................... 162Table 5 - 2 Additional need for cropland for food: Effect of different
assumptions for food supply and demand and their balance. .... 176Table 6 - 1 Lifetime years and progress ratios used by sector. .................. 195Table 6 - 2 Payback years per industry sub-sector ................................... 199Table 6 - 3 Investments and progress ratios per measures and sector
(in EUR/m2 floor area). ....................................................... 201Table 6 - 4 Capacity costs of RES electricity (000s EUR/ MW). .................. 207Table 7 - 1 Overview of critical public policy needs. ................................. 218Table 7 - 2 Overview of critical private sector efforts and required support
policies. ............................................................................. 219Table 7 - 3 Demand-side policy suggestions for the Buildings sector:
retrofit. .............................................................................. 220Table 7 - 4 Demand-side policy suggestions for the Buildings sector: new
build. ................................................................................. 220Table 7 - 5 Demand-side policy suggestions for the Buildings sector:
appliances etc. .................................................................... 221Table 7 - 6 Demand-side policy suggestions for the Transport sector: modal
shift. ................................................................................. 221Table 7 - 7 Demand-side policy suggestions for the Transport sector:
electrification. ..................................................................... 222Table 7 - 8 Demand-side policy suggestions for the Industry sector. .......... 222Table 7 - 9 Supply-side policy suggestions: renewable heat and power. ..... 223Table 7 - 10 Supply-side policy suggestions: power grids. .......................... 223Table 7 - 11 Supply-side policy suggestions: energy transition for the rural
poor. ................................................................................. 223Table 7 - 12 Bioenergy policy suggestions and examples: land use.............. 225Table 7 - 13 Bioenergy policy suggestions and examples: agricultural and
processing inputs. ............................................................... 225Table 7 - 14 Bioenergy policy suggestions and examples: Residues and
waste. ............................................................................... 226Table 7 - 15 Bioenergy policy suggestions and examples: Complementary
fellings............................................................................... 227Table A - 1 Global energy provided by source and year (EJ/a). .................. 231Table A - 2 Global energy provided by source and year (EJ/a) -
Percentages. ...................................................................... 232
231
232
227
119
220
100A Sustainable Energy Supply for Everyone
A S USTAI NABLE E NERGY S UPPLY F OR EVERY ONE
Table C - 1 Recoverable fractions of residues used in the
Energy Scenario. ................................................................. 236Table C - 2 Yields of energy crops used in the Energy Scenario. ................ 237Table C - 3 Conversion efficiencies of bioenergy technologies. ................... 238Table D - 1 Basic sensitivity analysis on bioenergy from crops. .................. 239
List of Boxes
Box 2 - 1 Contingency: Technology choices on bioenergy conversion ....... 113Box 3 - 1 Case study: State-of-the-art plants save energy in the
cement industry. ................................................................. 123Box 3 - 2 Story: Retrofit rates in Buildings. .......................................... 129Box 3 - 3 Case study: Building cooling demand in mediterranean
countries. ........................................................................... 130Box 3 - 4 Story: Material needs for batteries. ....................................... 134Box 3 - 5 Contingency: Freight transport. ............................................ 137Box 4 - 1 Story: The role of hydrogen fuel in the Energy Scenario. .......... 141Box 4 - 2 Story: The sustainability of renewable energy. ........................ 146Box 4 - 3 Story: Supply- versus demand-driven electricity sources. ........ 147Box 5 - 1 Contingency: Materials from biomass. ................................... 160Box 5 - 2 Case study: Sustainable land use by sugar cane and cattle
integration. ........................................................................ 163Box 5 - 3 Story: Land use in the Energy Scenario. ................................ 167Box 5 - 4 Story: The role of livestock feeding in global land use .............. 174Box 5 - 5 Contingency: Modelling the future demand for, and supply of,
food. ................................................................................. 175Box 5 - 6 Story: Water use for bioenergy in the Energy Scenario. ........... 178Box 5 - 7 Story: Forests in the Energy Scenario. ................................... 180Box 5 - 8 Case study: Microalgae as an energy source ........................... 188
Appendices
Appendix A Key figures ......................................................................... 231Appendix B Demand assumptions .......................................................... 233Appendix C Bioenergy assumptions ........................................................ 235Appendix D Sensitivity analyses on bioenergy .......................................... 239Appendix E Forestry overview ............................................................... 240Appendix F Residues and waste categorisation overview ........................... 241Appendix G References ......................................................................... 242Appendix H Glossary ............................................................................ 252
236237
238239
147
160
163167
174
175178
180188
231233
235239
240241
242252
A S USTAI NABLE E NERGY S UPPLY F OR EVERY ONE
Table C - 1 Recoverable fractions of residues used in the
Energy Scenario. ................................................................. 236Table C - 2 Yields of energy crops used in the Energy Scenario. ................ 237Table C - 3 Conversion efficiencies of bioenergy technologies. ................... 238Table D - 1 Basic sensitivity analysis on bioenergy from crops. .................. 239
List of Boxes
Box 2 - 1 Contingency: Technology choices on bioenergy conversion ....... 113Box 3 - 1 Case study: State-of-the-art plants save energy in the
cement industry. ................................................................. 123Box 3 - 2 Story: Retrofit rates in Buildings. .......................................... 129Box 3 - 3 Case study: Building cooling demand in mediterranean
countries. ........................................................................... 130Box 3 - 4 Story: Material needs for batteries. ....................................... 134Box 3 - 5 Contingency: Freight transport. ............................................ 137Box 4 - 1 Story: The role of hydrogen fuel in the Energy Scenario. .......... 141Box 4 - 2 Story: The sustainability of renewable energy. ........................ 146Box 4 - 3 Story: Supply- versus demand-driven electricity sources. ........ 147Box 5 - 1 Contingency: Materials from biomass. ................................... 160Box 5 - 2 Case study: Sustainable land use by sugar cane and cattle
integration. ........................................................................ 163Box 5 - 3 Story: Land use in the Energy Scenario. ................................ 167Box 5 - 4 Story: The role of livestock feeding in global land use .............. 174Box 5 - 5 Contingency: Modelling the future demand for, and supply of,
food. ................................................................................. 175Box 5 - 6 Story: Water use for bioenergy in the Energy Scenario. ........... 178Box 5 - 7 Story: Forests in the Energy Scenario. ................................... 180Box 5 - 8 Case study: Microalgae as an energy source ........................... 188
Appendices
Appendix A Key figures ......................................................................... 231Appendix B Demand assumptions .......................................................... 233Appendix C Bioenergy assumptions ........................................................ 235Appendix D Sensitivity analyses on bioenergy .......................................... 239Appendix E Forestry overview ............................................................... 240Appendix F Residues and waste categorisation overview ........................... 241Appendix G References ......................................................................... 242Appendix H Glossary ............................................................................ 252
113
130
123129
134
137141
146
101Part 2 - The Ecofys Energy Scenario

102A Sustainable Energy Supply for Everyone
A S USTAI NABLE E NERGY S UPPLY F OR EVERY ONE
1 Introduction
The last 200 years have witnessed an incredible increase in energy use by human societies worldwide. In recent decades it has become clear that the way this energy is supplied is unsustainable and both, short- and long-term energy security, are now at the top of the political and societal agenda.
The current public debate on the evolution of our energy system can be characterised as limited; it is constrained by our trust in existing systems and our mistrust of alternatives. The mainstream consensus appears to be that the best we can hope for are incremental changes to the existing structure of our energy system. Typically, scenario studies show such incremental changes against a ‘business-as-usual’ reference.
This view of the future stands in stark contrast to the belief within the renewable energy world that, ‘anything is possible’. It is true that the pure, technical potential of many renewable energy sources far surpasses our current demand, and statements such as the following are often issued:
“The sun provides more energy to the earth in one hour than the entire world needs in one year”.
Even when we assess renewable energy potentials more realistically, i.e. allowing for feasible deployment rates and taking regional differentiation into account, evidence suggests that we should be able to meet our energy demand from renewable sources, given their abundance (see Figure 1 - 1)1,2: Worldwide energy use in final energy terms (after conversion from primary fuels) was ~310 EJ3 in 2007 (~500 EJ in primary energy terms). [IEA, 2009]
When we try to reconcile these figures, ~300 EJ/a of worldwide final energy demand, and 100s to 1000s of EJ/a of realisable, renewable energy potentials, we begin to understand that a more detailed view is needed. A view which considers energy, not
1 NB: When referring to renewable energy ‘potential’ in this document, we mean the potential which can be deployed at any given point in time, as shown in this figure. 2 Unless clearly labelled as primary energy, as done in Figure 1 - 1, all graphs showing energy in this document show final energy values. The reader is advised to bear in mind that in any chart showing final energy for both fuels and electricity, the share of electricity will look smaller than the actual share of energy functions delivered by that electricity. See also Section 3.4.4. 3 Excluding non-energy use.
103Part 2 - The Ecofys Energy Scenario
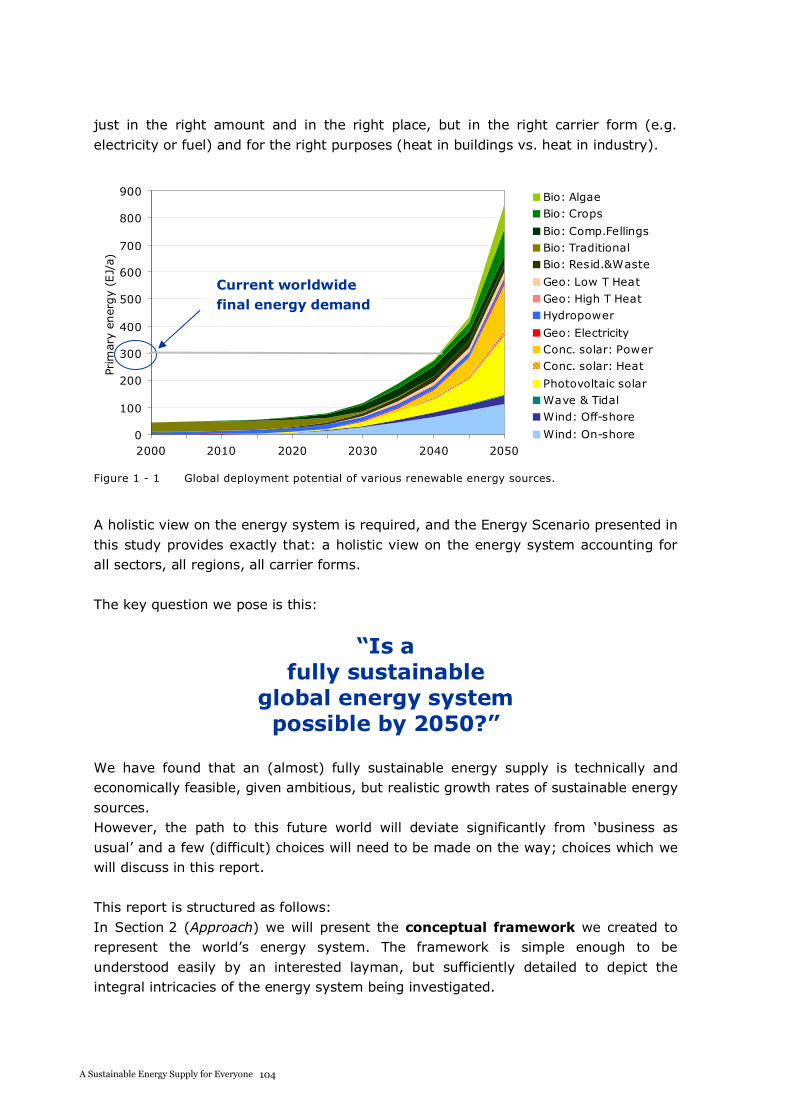
A S USTAI NABLE E NERGY S UPPLY F OR EVERY ONE
just in the right amount and in the right place, but in the right carrier form (e.g. electricity or fuel) and for the right purposes (heat in buildings vs. heat in industry).
0
100
200
300
400
500
600
700
800
900
2000 2010 2020 2030 2040 2050
Prim
ary
ener
gy
(EJ/
a)
Bio: AlgaeBio: Crops
Bio: Comp.FellingsBio: TraditionalBio: Resid.&Waste
Geo: Low T Heat
Geo: High T HeatHydropower
Geo: ElectricityConc. solar: PowerConc. solar: Heat
Photovoltaic solarWave & TidalWind: Off-shore
Wind: On-shore
Figure 1 - 1 Global deployment potential of various renewable energy sources.
A holistic view on the energy system is required, and the Energy Scenario presented in this study provides exactly that: a holistic view on the energy system accounting for all sectors, all regions, all carrier forms.
The key question we pose is this:
“Is a fully sustainable
global energy system possible by 2050?”
We have found that an (almost) fully sustainable energy supply is technically and economically feasible, given ambitious, but realistic growth rates of sustainable energy sources. However, the path to this future world will deviate significantly from ‘business as usual’ and a few (difficult) choices will need to be made on the way; choices which we will discuss in this report.
This report is structured as follows: In Section 2 (Approach) we will present the conceptual framework we created to represent the world’s energy system. The framework is simple enough to be understood easily by an interested layman, but sufficiently detailed to depict the integral intricacies of the energy system being investigated.
Current worldwide final energy demand
A S USTAI NABLE E NERGY S UPPLY F OR EVERY ONE
In accordance with the presented approach, we first discuss our assumptions and subsequent findings for the demand of energy in Section 3 (Demand). We then move on to the supply of energy which we have split into two sections, due to the level of attention we have devoted to the supply from biomass: Section 4 (Supply – Renewable energy (excl. bioenergy)) discusses all sustainable energy options other than biomass; we prioritise the use of these sources. Section 5 (Supply – Sustainable bioenergy) then describes the use of biomass in the Scenario.
Finally, we also address the economic implications of our Scenario in Section 6 (Investments and Savings), before presenting a brief discussion on policy elements required to bring this Scenario to fruition in Section 7 (Policy considerations). We end with Section 8 (Conclusions).
104A Sustainable Energy Supply for Everyone
A S USTAI NABLE E NERGY S UPPLY F OR EVERY ONE
In accordance with the presented approach, we first discuss our assumptions and subsequent findings for the demand of energy in Section 3 (Demand). We then move on to the supply of energy which we have split into two sections, due to the level of attention we have devoted to the supply from biomass: Section 4 (Supply – Renewable energy (excl. bioenergy)) discusses all sustainable energy options other than biomass; we prioritise the use of these sources. Section 5 (Supply – Sustainable bioenergy) then describes the use of biomass in the Scenario.
Finally, we also address the economic implications of our Scenario in Section 6 (Investments and Savings), before presenting a brief discussion on policy elements required to bring this Scenario to fruition in Section 7 (Policy considerations). We end with Section 8 (Conclusions).
105Part 2 - The Ecofys Energy Scenario

106A Sustainable Energy Supply for Everyone
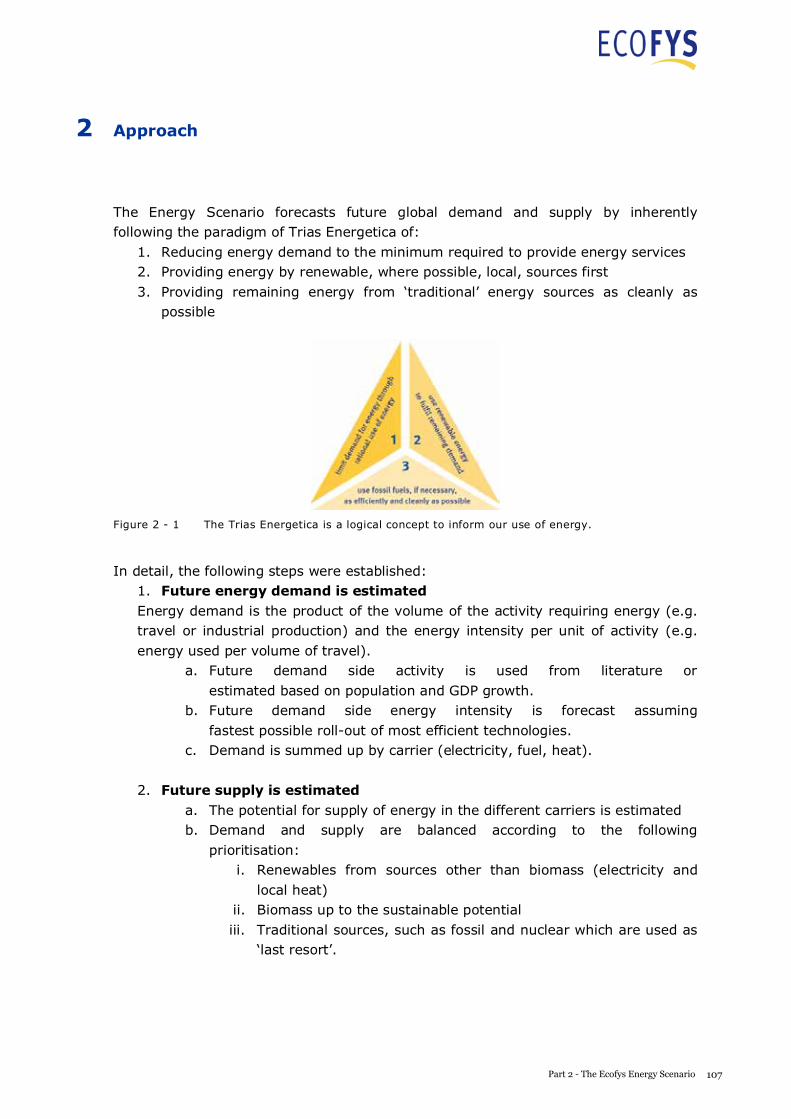
A S USTAI NABLE E NERGY S UPPLY F OR EVERY ONE
2 Approach
The Energy Scenario forecasts future global demand and supply by inherently following the paradigm of Trias Energetica of:
1. Reducing energy demand to the minimum required to provide energy services 2. Providing energy by renewable, where possible, local, sources first 3. Providing remaining energy from ‘traditional’ energy sources as cleanly as
possible
Figure 2 - 1 The Trias Energetica is a logical concept to inform our use of energy.
In detail, the following steps were established: 1. Future energy demand is estimatedEnergy demand is the product of the volume of the activity requiring energy (e.g. travel or industrial production) and the energy intensity per unit of activity (e.g. energy used per volume of travel).
a. Future demand side activity is used from literature or estimated based on population and GDP growth.
b. Future demand side energy intensity is forecast assuming fastest possible roll-out of most efficient technologies.
c. Demand is summed up by carrier (electricity, fuel, heat).
2. Future supply is estimateda. The potential for supply of energy in the different carriers is estimated b. Demand and supply are balanced according to the following
prioritisation: i. Renewables from sources other than biomass (electricity and
local heat) ii. Biomass up to the sustainable potential iii. Traditional sources, such as fossil and nuclear which are used as
‘last resort’.
107Part 2 - The Ecofys Energy Scenario
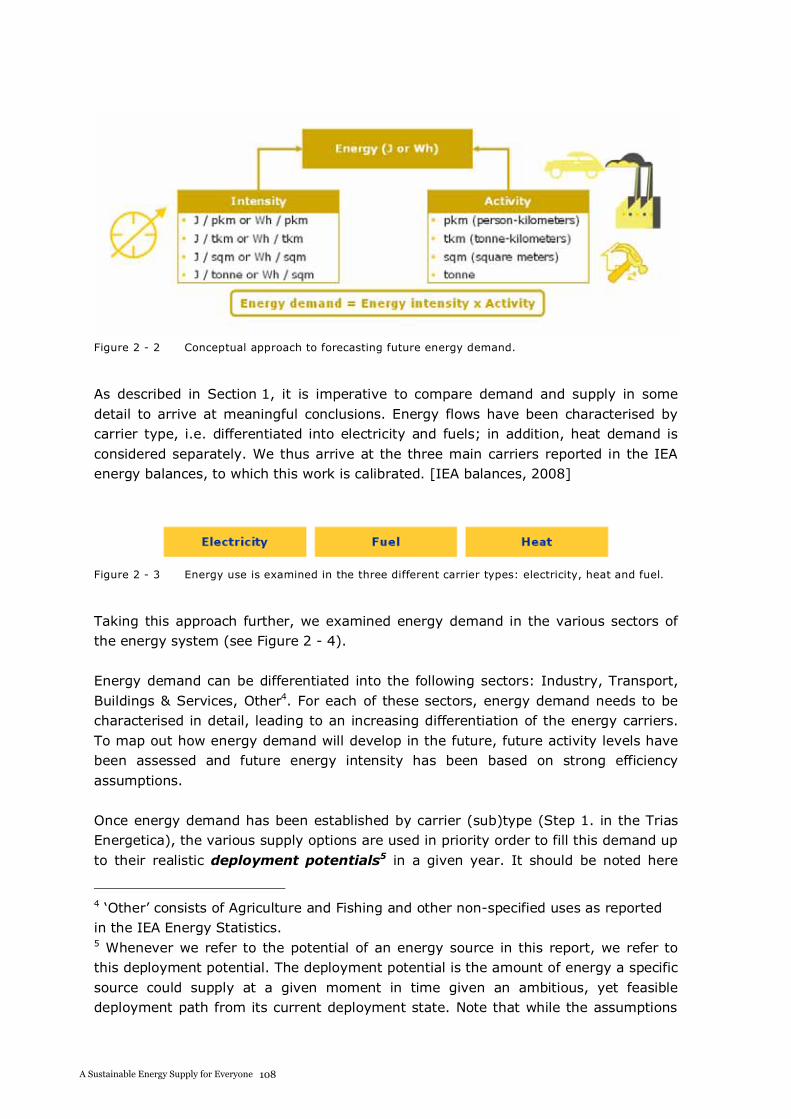
A S USTAI NABLE E NERGY S UPPLY F OR EVERY ONE
Figure 2 - 2 Conceptual approach to forecasting future energy demand.
As described in Section 1, it is imperative to compare demand and supply in some detail to arrive at meaningful conclusions. Energy flows have been characterised by carrier type, i.e. differentiated into electricity and fuels; in addition, heat demand is considered separately. We thus arrive at the three main carriers reported in the IEA energy balances, to which this work is calibrated. [IEA balances, 2008]
Figure 2 - 3 Energy use is examined in the three different carrier types: electricity, heat and fuel.
Taking this approach further, we examined energy demand in the various sectors of the energy system (see Figure 2 - 4).
Energy demand can be differentiated into the following sectors: Industry, Transport, Buildings & Services, Other4. For each of these sectors, energy demand needs to be characterised in detail, leading to an increasing differentiation of the energy carriers. To map out how energy demand will develop in the future, future activity levels have been assessed and future energy intensity has been based on strong efficiency assumptions.
Once energy demand has been established by carrier (sub)type (Step 1. in the Trias Energetica), the various supply options are used in priority order to fill this demand up to their realistic deployment potentials5 in a given year. It should be noted here
4 ‘Other’ consists of Agriculture and Fishing and other non-specified uses as reported in the IEA Energy Statistics. 5 Whenever we refer to the potential of an energy source in this report, we refer to this deployment potential. The deployment potential is the amount of energy a specific source could supply at a given moment in time given an ambitious, yet feasible deployment path from its current deployment state. Note that while the assumptions
108A Sustainable Energy Supply for Everyone
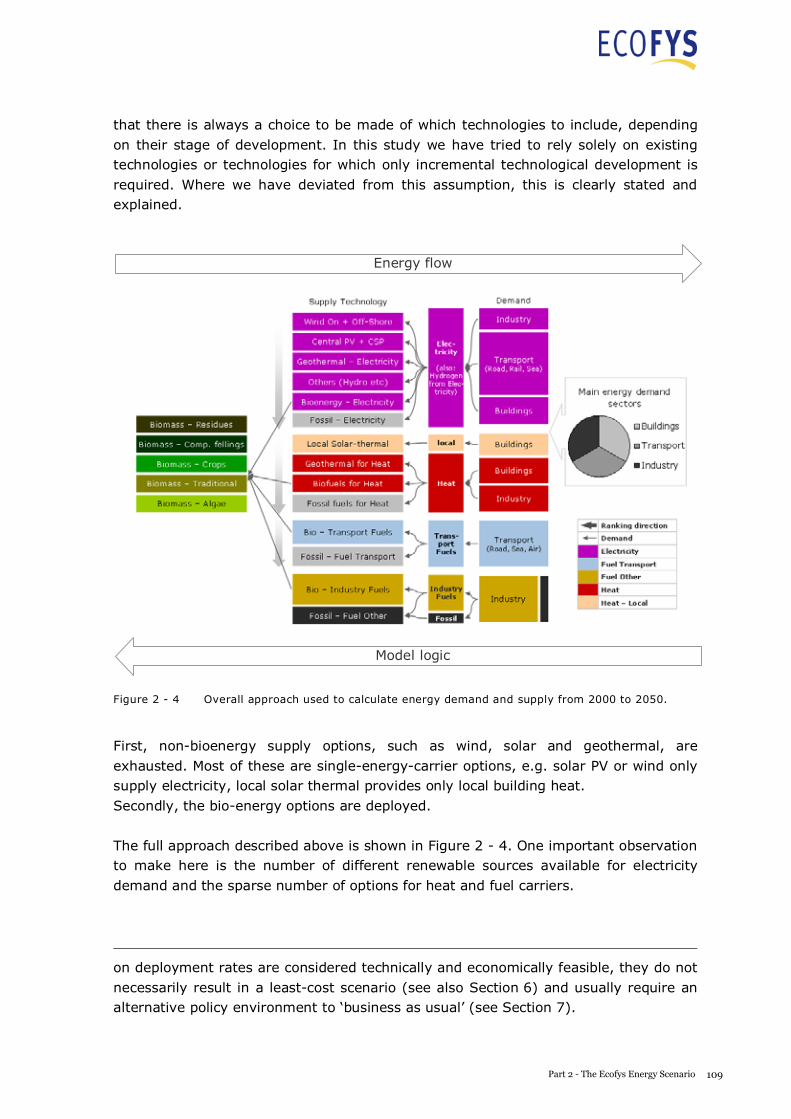
A S USTAI NABLE E NERGY S UPPLY F OR EVERY ONE
that there is always a choice to be made of which technologies to include, depending on their stage of development. In this study we have tried to rely solely on existing technologies or technologies for which only incremental technological development is required. Where we have deviated from this assumption, this is clearly stated and explained.
Figure 2 - 4 Overall approach used to calculate energy demand and supply from 2000 to 2050.
First, non-bioenergy supply options, such as wind, solar and geothermal, are exhausted. Most of these are single-energy-carrier options, e.g. solar PV or wind only supply electricity, local solar thermal provides only local building heat. Secondly, the bio-energy options are deployed.
The full approach described above is shown in Figure 2 - 4. One important observation to make here is the number of different renewable sources available for electricity demand and the sparse number of options for heat and fuel carriers.
on deployment rates are considered technically and economically feasible, they do not necessarily result in a least-cost scenario (see also Section 6) and usually require an alternative policy environment to ‘business as usual’ (see Section 7).
Energy flow
Model logic
109Part 2 - The Ecofys Energy Scenario
A S USTAI NABLE E NERGY S UPPLY F OR EVERY ONE
Although the Scenario is primarily global, it is fundamentally based on calculations at regional level within these 10 world regions, which differ greatly in their energy use and potential and their stages and speed of development:
EuropeNorth America Latin America Russia and other Eurasia Middle East OECD Pacific China India Rest of Asia Africa
2.1 Bioenergy approach
Bioenergy from biomass requires a more elaborate approach than most other renewable energy options for the following reasons:
Bioenergy requires a more thorough analytical framework to analyse sustainability, as cultivation and processing of biomass and use of bioenergy have a large range of associated sustainability issues. Bioenergy encompasses energy supply for a multitude of energy carrier types using a multitude of different energy sources. Therefore a detailed framework of different possible conversion routes is needed.
We describe both elements of the Scenario’s energy approach briefly in this section. More detail is given in Section 5.
Bioenergy sustainability
Bioenergy sustainability is a key aspect of the Energy Scenario. Firstly, the share of bioenergy in the overall renewable energy supply is reduced as much as possible by using other renewable energy options first. Secondly, the use of residues and waste is prioritised over the use of energy crops. For both of these categories, criteria are applied throughout the bioenergy chain to ensure sustainability. Figure 2 - 5 illustrates this approach. Section 5 describes the Scenario’s bioenergy supply and its sustainability criteria in detail.
Bioenergy conversion routes
Because biomass can provide energy supply in a multitude of different energy carrier types, often in the same conversion route, the biomass use was channelled through all possible bio-energy routes, taking into consideration residues resulting from some of these routes. This approach is illustrated in a simplified diagram in Figure 2 - 6.
A S USTAI NABLE E NERGY S UPPLY F OR EVERY ONE
Figure 2 - 5 Framework applied in the Energy Scenario to ensure the sustainability of the Scenario's
bioenergy supply. (The size of the shapes in the image is not indicative of the size of
the categories in the Scenario.)
In order to keep the projection robust, the key principle in selecting the supply and technology options, was to only use options that are currently available or for which only incremental technological development is needed. Two exceptions, where technological change of a more radical character is needed, are the inclusion of oil from algae as a supply option and fermentation of lignocellulose to ethanol fuel as a technology option. Both are not mature options in the current market, although both are approaching commercial viability. To allow for development still needed in algae growing and harvesting, we included the use of significant amounts of algae oil from 2030 onwards only.
Another important assumption is made on the traditional use of biomass. Currently, about 35 EJ of primary biomass is used in traditional applications. This consists primarily of woody biomass and agricultural residues harvested for home heating and cooking in developing countries. Toward 2050, the Scenario will supply energy for these demands through a route alternative to traditional biomass use. The traditional use of biomass is therefore phased out over time. A proportion of this phased out biomass is used within the Scenario in a sustainable manner, see also Section 5.6.
Within the Scenario, the different bioenergy routes displayed in Figure 2 - 6 are prioritised as follows:
1 Traditional biomass: As this biomass is currently in use, it is used first in the Scenario. Over time, the contribution of this category becomes less as it is phased out.
110A Sustainable Energy Supply for Everyone
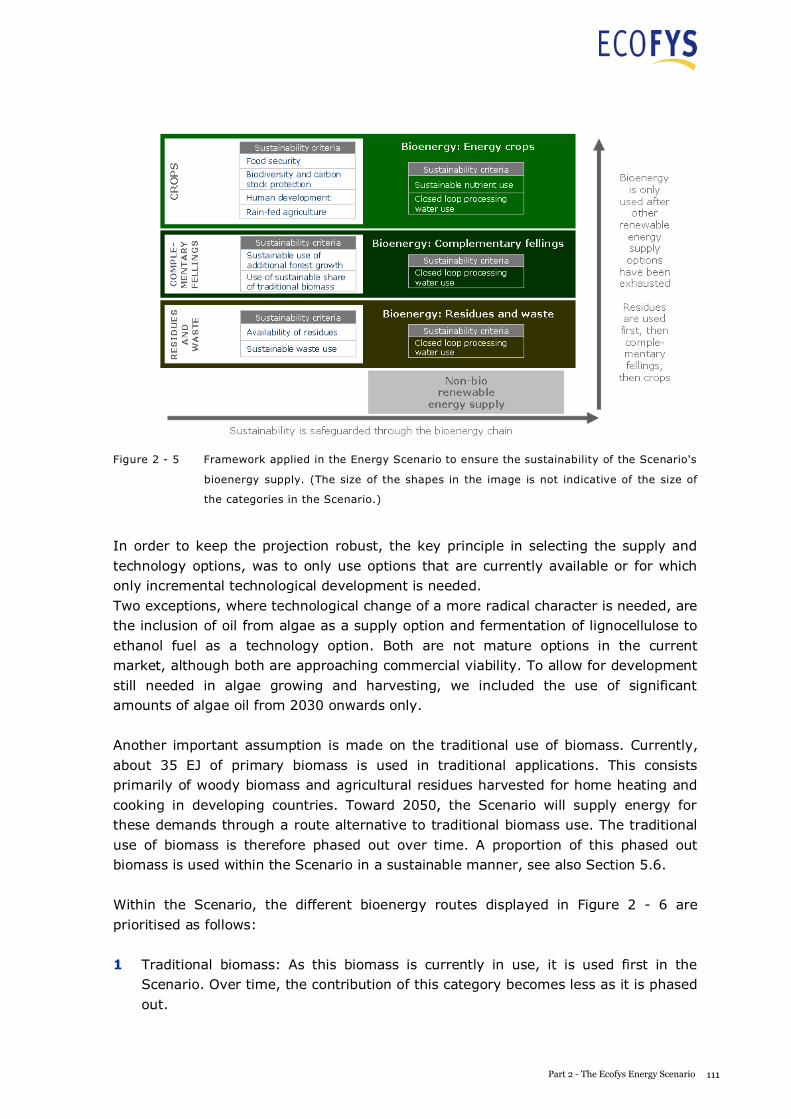
A S USTAI NABLE E NERGY S UPPLY F OR EVERY ONE
Figure 2 - 5 Framework applied in the Energy Scenario to ensure the sustainability of the Scenario's
bioenergy supply. (The size of the shapes in the image is not indicative of the size of
the categories in the Scenario.)
In order to keep the projection robust, the key principle in selecting the supply and technology options, was to only use options that are currently available or for which only incremental technological development is needed. Two exceptions, where technological change of a more radical character is needed, are the inclusion of oil from algae as a supply option and fermentation of lignocellulose to ethanol fuel as a technology option. Both are not mature options in the current market, although both are approaching commercial viability. To allow for development still needed in algae growing and harvesting, we included the use of significant amounts of algae oil from 2030 onwards only.
Another important assumption is made on the traditional use of biomass. Currently, about 35 EJ of primary biomass is used in traditional applications. This consists primarily of woody biomass and agricultural residues harvested for home heating and cooking in developing countries. Toward 2050, the Scenario will supply energy for these demands through a route alternative to traditional biomass use. The traditional use of biomass is therefore phased out over time. A proportion of this phased out biomass is used within the Scenario in a sustainable manner, see also Section 5.6.
Within the Scenario, the different bioenergy routes displayed in Figure 2 - 6 are prioritised as follows:
1 Traditional biomass: As this biomass is currently in use, it is used first in the Scenario. Over time, the contribution of this category becomes less as it is phased out.
111Part 2 - The Ecofys Energy Scenario
A S USTAI NABLE E NERGY S UPPLY F OR EVERY ONE
2 Sustainable residues and waste: Sustainable residues and waste, originating from agriculture, forestry and the food processing industry for example, are used to meet as much demand as possible6.
3 Sustainable complementary fellings: This category consists of woody biomass gained from sustainable harvesting of additional forest growth and of the sustainable share of traditional biomass use. It is used to fill remaining demand in lignocellulosic routes, as much as possible.
4 Sustainable energy crops: Energy crops are used to fill as much of the remaining energy demand as possible while staying within their sustainable potential7.Energy crops include oil crops, starch and sugar crops and (ligno)cellulosic crops.
5 Sustainable algae: Algae are used to yield oil to fill the remaining demand in the oil routes. Algae are used last because their growing and harvesting is currently not a proven technology on a commercial scale.
The assumed conversion efficiencies of the routes presented in Figure 2 - 6 are given in Appendix C 3.
Figure 2 - 6 Bioenergy approach, showing the various biomass input types and conversion routes
which result in various energy carrier types that meet demand.8,9
6 Competing uses are safeguarded, e.g. by keeping a suitable fraction of agricultural or forest residues on the field or in the forest, respectively. 7 See Section 5 for the discussion on sustainable biomass. 8 “Grid upgrade” refers to biogas being cleaned and compressed to allow it to be injected into gas grids. 9 The size of the shapes in the image is not indicative of the size of the categories in the Scenario.
A S USTAI NABLE E NERGY S UPPLY F OR EVERY ONE
Box 2 - 1 Contingency: Technology choices on bioenergy conversion
CONTINGENCY TECHNOLOGY CHOICES ON BIOENERGY CONVERSION
Section 2.1 describes the robust Scenario rationale for selecting technology options to include
in the bioenergy conversion routes. These choices of course resonate in the final energy supply
results and their contingencies.
The most notable effect occurs in the transport sector: the Scenario supplies the shipping and
aviation fuel sectors through routes using only oils and fats as feedstock. Other potential
future options such as thermochemical conversion of (lignocellulosic) biomass, for example
gasification followed by Fischer-Tropsch synthesis, to shipping and aviation fuels are not
included. This means that there is an increased need for oil supply from sustainable energy
crops and algae compared to a situation where this thermochemical option is included. The
large majority of this oil feedstock is used in the shipping and aviation sector.
In this Scenario we have chosen to exclude thermochemical conversion routes, because
currently the development and implementation of other routes, such as the fermentation of
lignocellulosic biomass, receive more attention than those of thermochemical conversion
routes. It is possible that the development of these thermochemical conversion routes, or
other fuel conversion routes, will progress faster than expected. In this case, additional routes
would become available making the future bioenergy supply even more flexible than it is in the
Scenario. Although we naturally welcome such renewable energy technology developments, we
have chosen not to account for them quantitatively to keep the Scenario less dependent on
unknown future developments.
112A Sustainable Energy Supply for Everyone
A S USTAI NABLE E NERGY S UPPLY F OR EVERY ONE
Box 2 - 1 Contingency: Technology choices on bioenergy conversion
CONTINGENCY TECHNOLOGY CHOICES ON BIOENERGY CONVERSION
Section 2.1 describes the robust Scenario rationale for selecting technology options to include
in the bioenergy conversion routes. These choices of course resonate in the final energy supply
results and their contingencies.
The most notable effect occurs in the transport sector: the Scenario supplies the shipping and
aviation fuel sectors through routes using only oils and fats as feedstock. Other potential
future options such as thermochemical conversion of (lignocellulosic) biomass, for example
gasification followed by Fischer-Tropsch synthesis, to shipping and aviation fuels are not
included. This means that there is an increased need for oil supply from sustainable energy
crops and algae compared to a situation where this thermochemical option is included. The
large majority of this oil feedstock is used in the shipping and aviation sector.
In this Scenario we have chosen to exclude thermochemical conversion routes, because
currently the development and implementation of other routes, such as the fermentation of
lignocellulosic biomass, receive more attention than those of thermochemical conversion
routes. It is possible that the development of these thermochemical conversion routes, or
other fuel conversion routes, will progress faster than expected. In this case, additional routes
would become available making the future bioenergy supply even more flexible than it is in the
Scenario. Although we naturally welcome such renewable energy technology developments, we
have chosen not to account for them quantitatively to keep the Scenario less dependent on
unknown future developments.
113Part 2 - The Ecofys Energy Scenario

A S USTAI NABLE E NERGY S UPPLY F OR EVERY ONE
3 Demand
3.1 Overall results
An understanding of our energy system begins with a detailed look at the demand of energy (see Section 2):
Where is energy used? In what form and with which efficiency? Which functions does this energy deliver? Can this function be delivered differently?
A typical example to illustrate this approach is our energy use in buildings. A large fraction of our total energy demand, especially in cooler climates, comes from the residential built environment. The energy is used in the form of heat and often with very poor conversion efficiencies and large losses. The desired function is a warm home, but does it need to be delivered in the current form? In fact, this function can be delivered with much less energy input if the building is insulated and heat loss is reduced.
0
50
100
150
200
250
300
350
400
2000 2010 2020 2030 2040 2050
Final
ener
gy
(EJ/
a)
Other
Industry
Buildings
Transport
Figure 3 - 1 Global energy demand across all sectors, from 2000 to 2050.
Asking these questions in all three demand sectors10, Industry, Buildings and Transport, leads to the Scenario for future energy demand as show in Figure 3 - 1.
10 There are many different ways of looking at energy demand. The sectors we have chosen, Industry, Buildings and Transport, are congruent with the sectors for which the International Energy Agency (IEA) reports energy statistics, which form the basis
114A Sustainable Energy Supply for Everyone
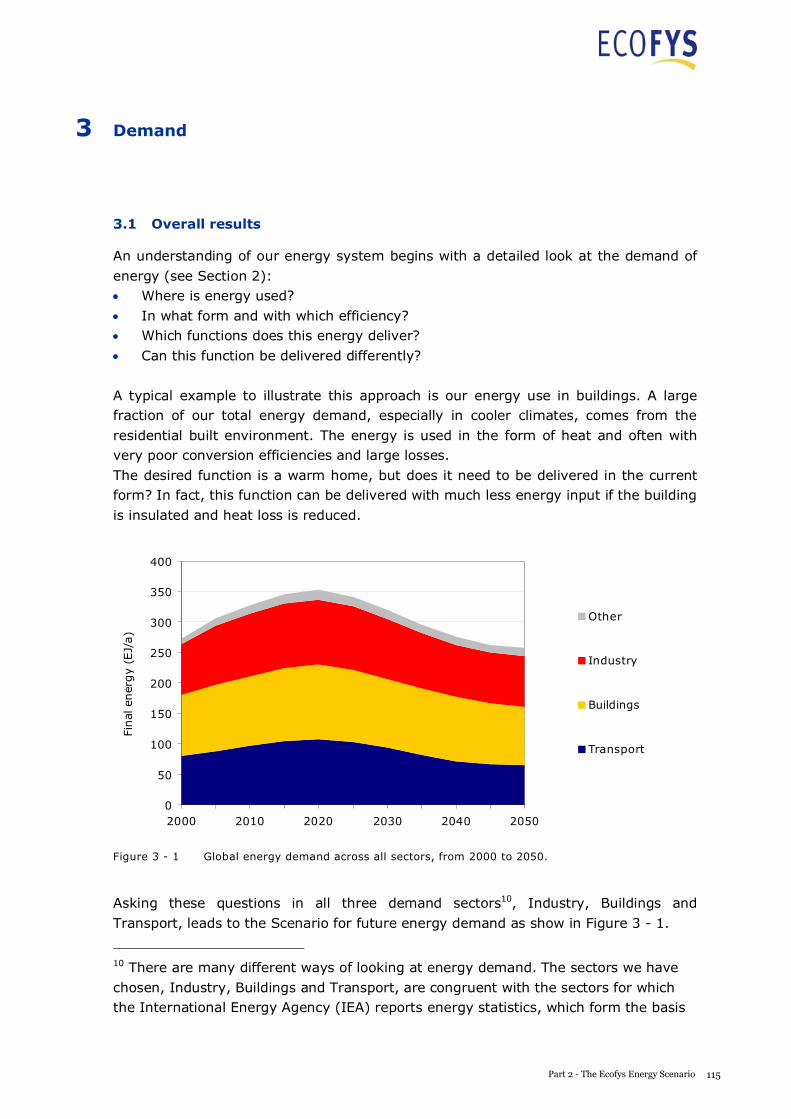
A S USTAI NABLE E NERGY S UPPLY F OR EVERY ONE
3 Demand
3.1 Overall results
An understanding of our energy system begins with a detailed look at the demand of energy (see Section 2):
Where is energy used? In what form and with which efficiency? Which functions does this energy deliver? Can this function be delivered differently?
A typical example to illustrate this approach is our energy use in buildings. A large fraction of our total energy demand, especially in cooler climates, comes from the residential built environment. The energy is used in the form of heat and often with very poor conversion efficiencies and large losses. The desired function is a warm home, but does it need to be delivered in the current form? In fact, this function can be delivered with much less energy input if the building is insulated and heat loss is reduced.
0
50
100
150
200
250
300
350
400
2000 2010 2020 2030 2040 2050
Final
ener
gy
(EJ/
a)
Other
Industry
Buildings
Transport
Figure 3 - 1 Global energy demand across all sectors, from 2000 to 2050.
Asking these questions in all three demand sectors10, Industry, Buildings and Transport, leads to the Scenario for future energy demand as show in Figure 3 - 1.
10 There are many different ways of looking at energy demand. The sectors we have chosen, Industry, Buildings and Transport, are congruent with the sectors for which the International Energy Agency (IEA) reports energy statistics, which form the basis
115Part 2 - The Ecofys Energy Scenario
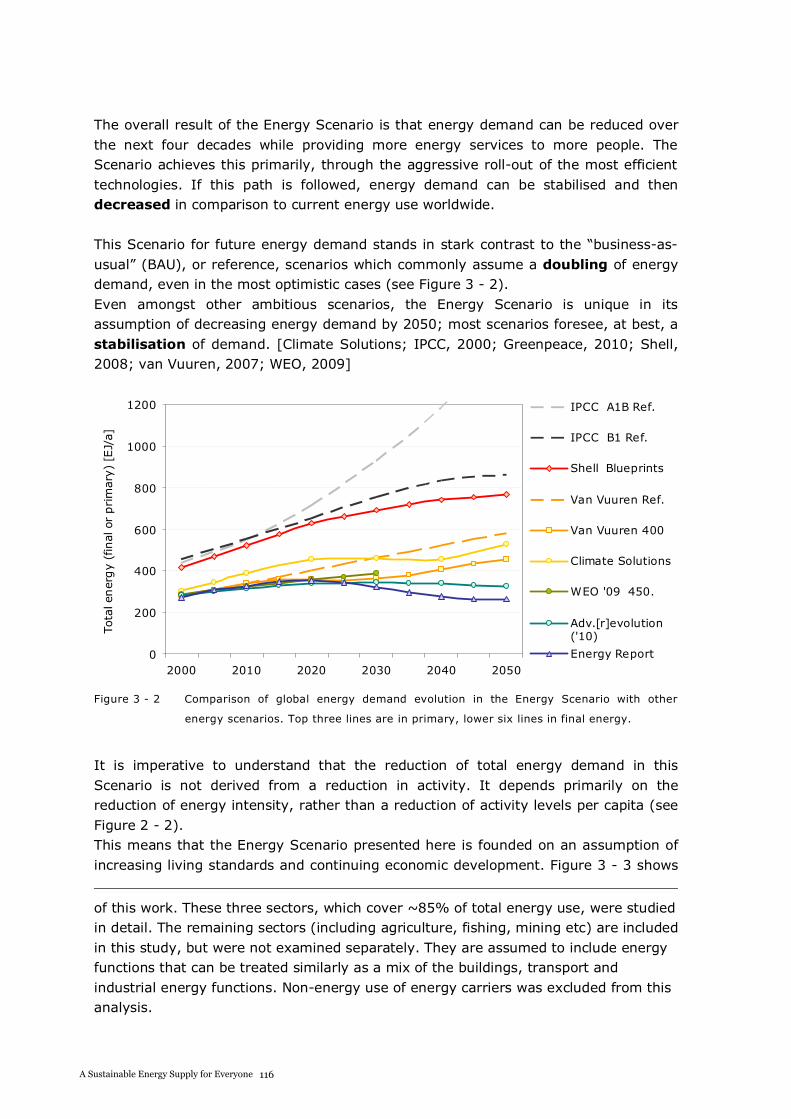
A S USTAI NABLE E NERGY S UPPLY F OR EVERY ONE
The overall result of the Energy Scenario is that energy demand can be reduced over the next four decades while providing more energy services to more people. The Scenario achieves this primarily, through the aggressive roll-out of the most efficient technologies. If this path is followed, energy demand can be stabilised and then decreased in comparison to current energy use worldwide.
This Scenario for future energy demand stands in stark contrast to the “business-as-usual” (BAU), or reference, scenarios which commonly assume a doubling of energy demand, even in the most optimistic cases (see Figure 3 - 2). Even amongst other ambitious scenarios, the Energy Scenario is unique in its assumption of decreasing energy demand by 2050; most scenarios foresee, at best, a stabilisation of demand. [Climate Solutions; IPCC, 2000; Greenpeace, 2010; Shell, 2008; van Vuuren, 2007; WEO, 2009]
0
200
400
600
800
1000
1200
2000 2010 2020 2030 2040 2050
Tota
lener
gy
(fin
alor
prim
ary)
[EJ/
a]
IPCC A1B Ref.
IPCC B1 Ref.
Shell Blueprints
Van Vuuren Ref.
Van Vuuren 400
Climate Solutions
WEO '09 450.
Adv.[r]evolution('10)
Energy Report
Figure 3 - 2 Comparison of global energy demand evolution in the Energy Scenario with other
energy scenarios. Top three lines are in primary, lower six lines in final energy.
It is imperative to understand that the reduction of total energy demand in this Scenario is not derived from a reduction in activity. It depends primarily on the reduction of energy intensity, rather than a reduction of activity levels per capita (see Figure 2 - 2). This means that the Energy Scenario presented here is founded on an assumption of increasing living standards and continuing economic development. Figure 3 - 3 shows
of this work. These three sectors, which cover ~85% of total energy use, were studied in detail. The remaining sectors (including agriculture, fishing, mining etc) are included in this study, but were not examined separately. They are assumed to include energy functions that can be treated similarly as a mix of the buildings, transport and industrial energy functions. Non-energy use of energy carriers was excluded from this analysis.
116A Sustainable Energy Supply for Everyone
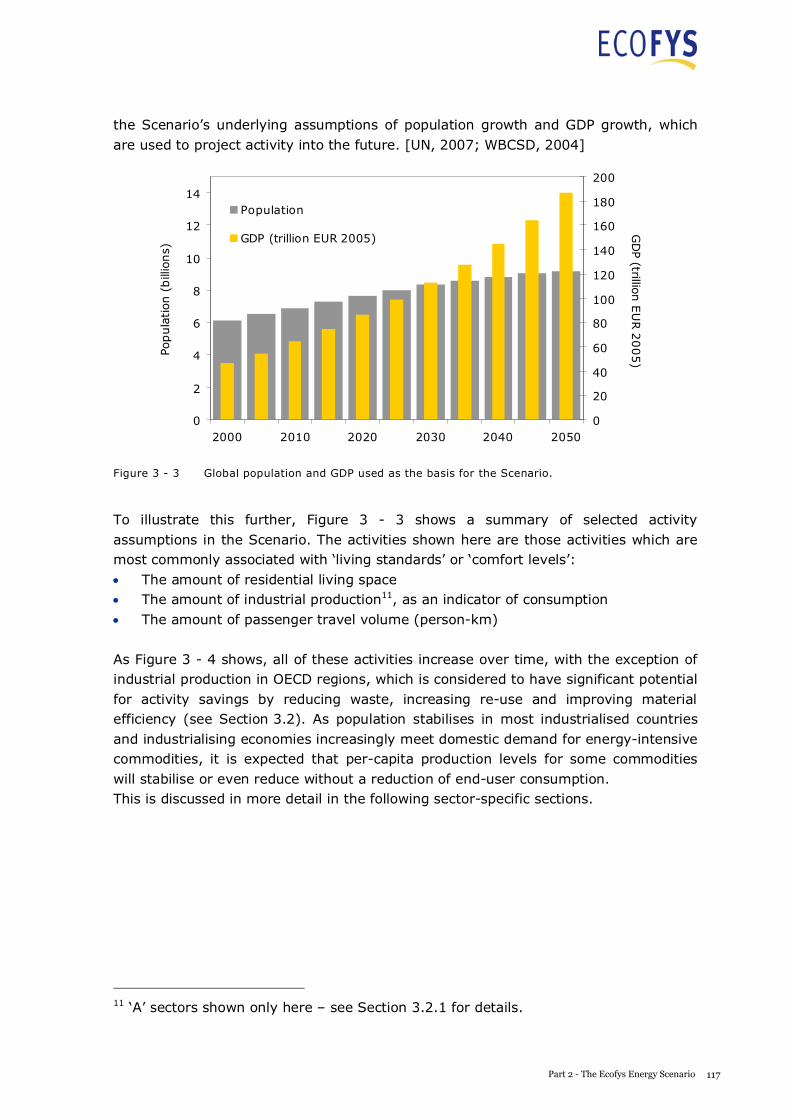
A S USTAI NABLE E NERGY S UPPLY F OR EVERY ONE
the Scenario’s underlying assumptions of population growth and GDP growth, which are used to project activity into the future. [UN, 2007; WBCSD, 2004]
0
2
4
6
8
10
12
14
2000 2010 2020 2030 2040 2050
Popula
tion
(bill
ions)
0
20
40
60
80
100
120
140
160
180
200
GD
P(trillion
EU
R2005)
Population
GDP (trillion EUR 2005)
Figure 3 - 3 Global population and GDP used as the basis for the Scenario.
To illustrate this further, Figure 3 - 3 shows a summary of selected activity assumptions in the Scenario. The activities shown here are those activities which are most commonly associated with ‘living standards’ or ‘comfort levels’:
The amount of residential living space The amount of industrial production11, as an indicator of consumption The amount of passenger travel volume (person-km)
As Figure 3 - 4 shows, all of these activities increase over time, with the exception of industrial production in OECD regions, which is considered to have significant potential for activity savings by reducing waste, increasing re-use and improving material efficiency (see Section 3.2). As population stabilises in most industrialised countries and industrialising economies increasingly meet domestic demand for energy-intensive commodities, it is expected that per-capita production levels for some commodities will stabilise or even reduce without a reduction of end-user consumption. This is discussed in more detail in the following sector-specific sections.
11 ‘A’ sectors shown only here – see Section 3.2.1 for details.
117Part 2 - The Ecofys Energy Scenario
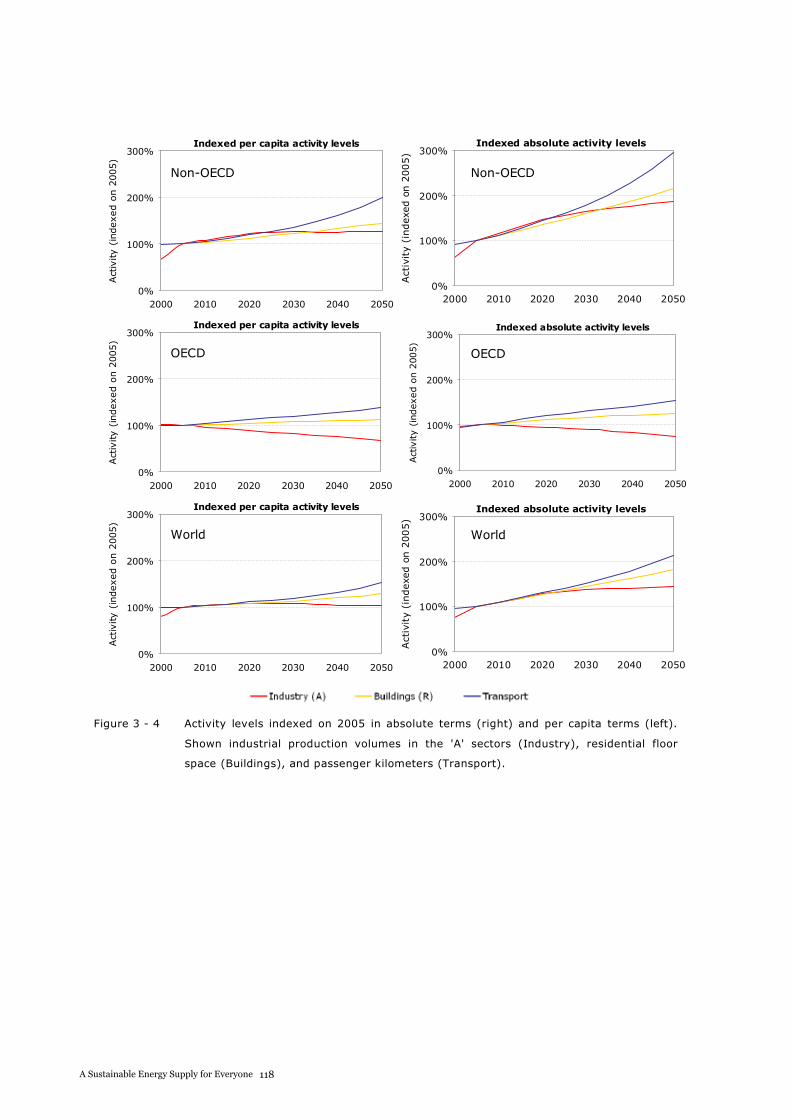
A S USTAI NABLE E NERGY S UPPLY F OR EVERY ONE
Indexed per capita activity levels
0%
100%
200%
300%
2000 2010 2020 2030 2040 2050
Act
ivity
(indexed
on
2005)
Indexed absolute activity levels
0%
100%
200%
300%
2000 2010 2020 2030 2040 2050
Act
ivit
y(i
ndexe
don
2005)
Indexed per capita activity levels
0%
100%
200%
300%
2000 2010 2020 2030 2040 2050
Act
ivity
(indexed
on
2005)
Indexed absolute activity levels
0%
100%
200%
300%
2000 2010 2020 2030 2040 2050
Act
ivity
(indexed
on
2005)
Indexed per capita activity levels
0%
100%
200%
300%
2000 2010 2020 2030 2040 2050
Act
ivity
(indexed
on
2005)
Indexed absolute activity levels
0%
100%
200%
300%
2000 2010 2020 2030 2040 2050
Act
ivit
y(i
ndexe
don
2005)
Figure 3 - 4 Activity levels indexed on 2005 in absolute terms (right) and per capita terms (left).
Shown industrial production volumes in the 'A' sectors (Industry), residential floor
space (Buildings), and passenger kilometers (Transport).
Non-OECD Non-OECD
Non-OECD Non-OECD OECD OECD
OECD OECD World World
A S USTAI NABLE E NERGY S UPPLY F OR EVERY ONE
3.2 Industry
3.2.1 Industry – Definitions
The industry sector uses energy of all three carrier types in the definition used here: electricity, fuel and heat.
Industry comprises the following sectors (i.e. it excludes the power sector which is treated on the supply side of the Scenario – see Section 4):
Table 3 - 1 Industry sector definitions
Scenario
Category
Industry sector
(IEA definition)
Industry sector
(Scenario marker sector)
“A” Iron & steel Steel
Non-ferrous metals Aluminium
Non-metallic minerals Cement
Paper, pulp and print Paper
“B” Chemical & petrochemical Chemicals
Food & tobacco Food
[All others] Other
The Scenario uses marker sectors to forecast evolution of activity and assess potential for efficiency improvements. This means, for example, that we assume efficiency improvements can be made in the entire non-ferrous metals sector which are analogous to the improvements we assume for the production of aluminium, etc.
For simplicity, we will refer to industry sectors by their Scenario names for the remainder of this report.
3.2.2 Industry – Future activity
Activity levels for the first four sectors (the ‘A’ sectors) are assessed in terms of tonnes produced, and linked to population growth. Activity levels for the last three sectors (‘B’ sectors) are assessed by GDP growth.
“A” sectors
For these sectors, an assumption is made on the future evolution of tonnes produced per capita, based on the logic of “intensity of use” curves (see Appendix B 1). This assumption is then multiplied by the future population to estimate total future production levels.
118A Sustainable Energy Supply for Everyone
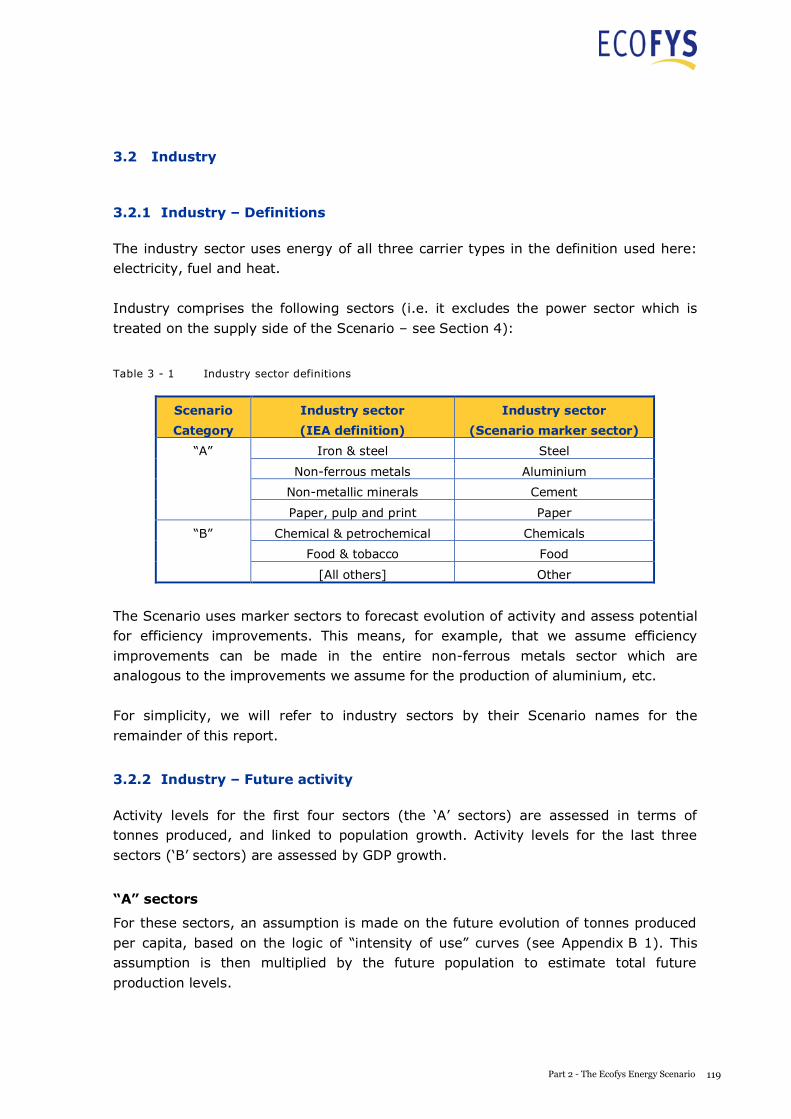
A S USTAI NABLE E NERGY S UPPLY F OR EVERY ONE
3.2 Industry
3.2.1 Industry – Definitions
The industry sector uses energy of all three carrier types in the definition used here: electricity, fuel and heat.
Industry comprises the following sectors (i.e. it excludes the power sector which is treated on the supply side of the Scenario – see Section 4):
Table 3 - 1 Industry sector definitions
Scenario
Category
Industry sector
(IEA definition)
Industry sector
(Scenario marker sector)
“A” Iron & steel Steel
Non-ferrous metals Aluminium
Non-metallic minerals Cement
Paper, pulp and print Paper
“B” Chemical & petrochemical Chemicals
Food & tobacco Food
[All others] Other
The Scenario uses marker sectors to forecast evolution of activity and assess potential for efficiency improvements. This means, for example, that we assume efficiency improvements can be made in the entire non-ferrous metals sector which are analogous to the improvements we assume for the production of aluminium, etc.
For simplicity, we will refer to industry sectors by their Scenario names for the remainder of this report.
3.2.2 Industry – Future activity
Activity levels for the first four sectors (the ‘A’ sectors) are assessed in terms of tonnes produced, and linked to population growth. Activity levels for the last three sectors (‘B’ sectors) are assessed by GDP growth.
“A” sectors
For these sectors, an assumption is made on the future evolution of tonnes produced per capita, based on the logic of “intensity of use” curves (see Appendix B 1). This assumption is then multiplied by the future population to estimate total future production levels.
119Part 2 - The Ecofys Energy Scenario
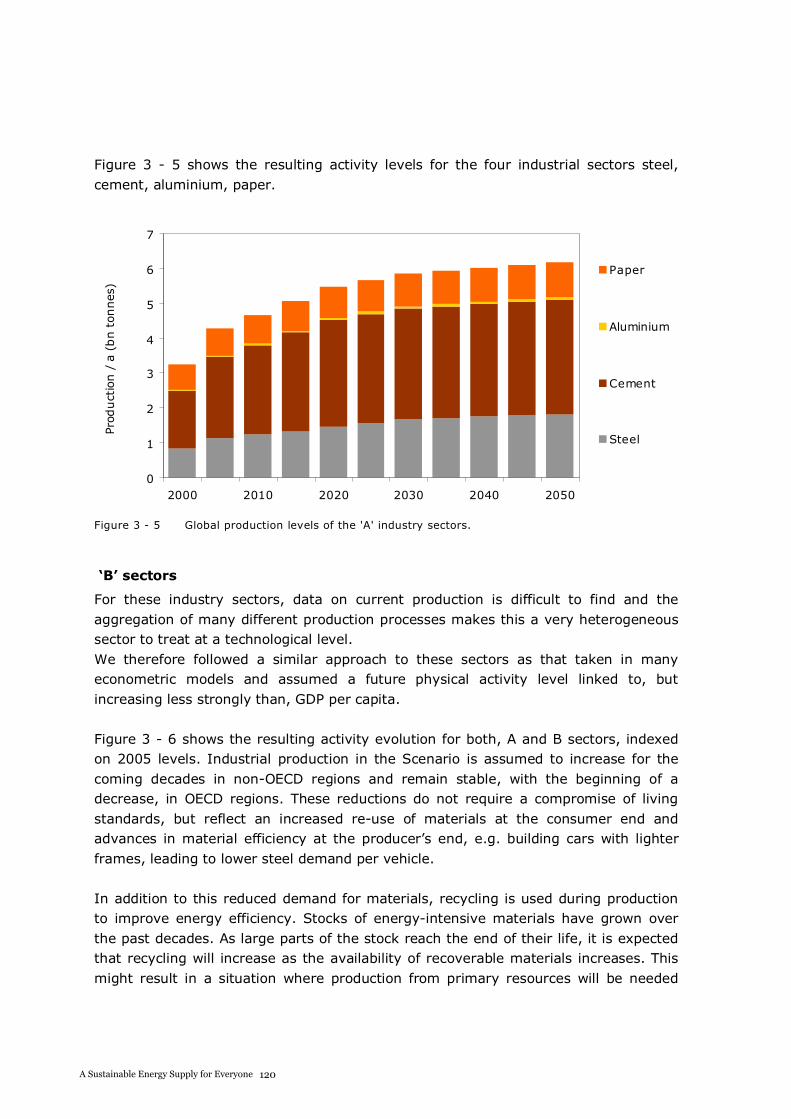
A S USTAI NABLE E NERGY S UPPLY F OR EVERY ONE
Figure 3 - 5 shows the resulting activity levels for the four industrial sectors steel, cement, aluminium, paper.
0
1
2
3
4
5
6
7
2000 2010 2020 2030 2040 2050
Prod
uct
ion
/a
(bn
tonnes
)
Paper
Aluminium
Cement
Steel
Figure 3 - 5 Global production levels of the 'A' industry sectors.
‘B’ sectors
For these industry sectors, data on current production is difficult to find and the aggregation of many different production processes makes this a very heterogeneous sector to treat at a technological level. We therefore followed a similar approach to these sectors as that taken in many econometric models and assumed a future physical activity level linked to, but increasing less strongly than, GDP per capita.
Figure 3 - 6 shows the resulting activity evolution for both, A and B sectors, indexed on 2005 levels. Industrial production in the Scenario is assumed to increase for the coming decades in non-OECD regions and remain stable, with the beginning of a decrease, in OECD regions. These reductions do not require a compromise of living standards, but reflect an increased re-use of materials at the consumer end and advances in material efficiency at the producer’s end, e.g. building cars with lighter frames, leading to lower steel demand per vehicle.
In addition to this reduced demand for materials, recycling is used during production to improve energy efficiency. Stocks of energy-intensive materials have grown over the past decades. As large parts of the stock reach the end of their life, it is expected that recycling will increase as the availability of recoverable materials increases. This might result in a situation where production from primary resources will be needed
120A Sustainable Energy Supply for Everyone
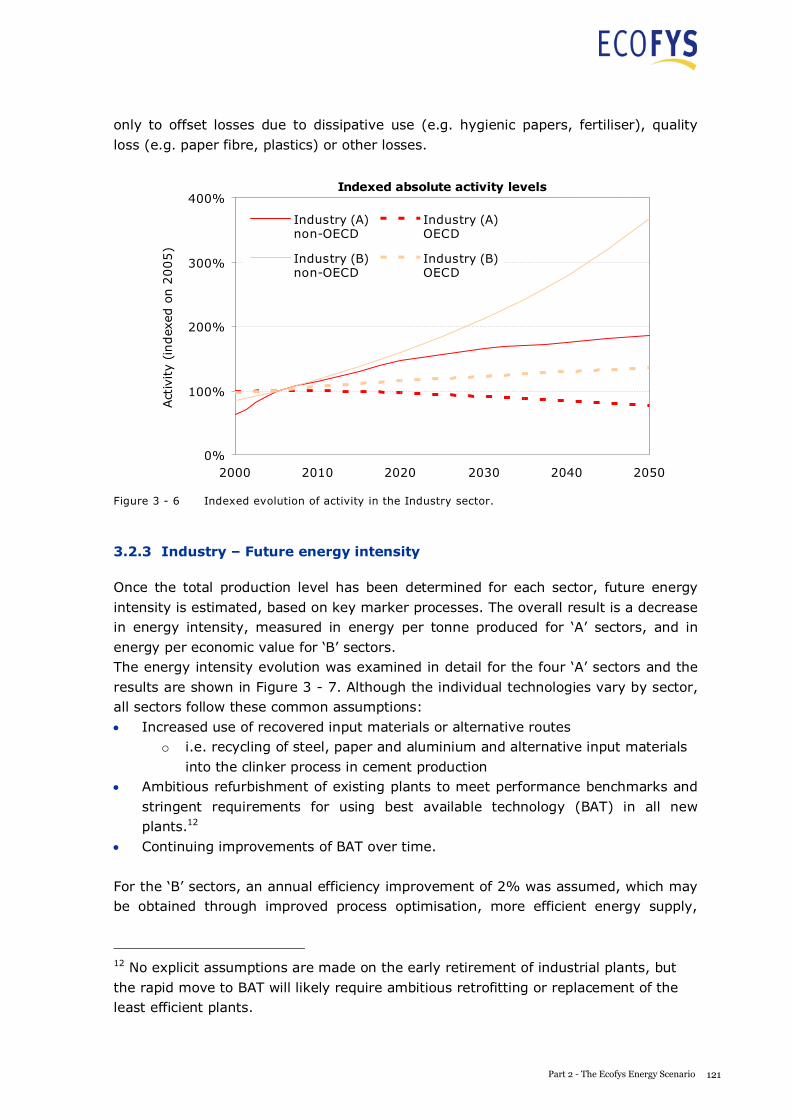
A S USTAI NABLE E NERGY S UPPLY F OR EVERY ONE
Figure 3 - 5 shows the resulting activity levels for the four industrial sectors steel, cement, aluminium, paper.
0
1
2
3
4
5
6
7
2000 2010 2020 2030 2040 2050
Prod
uct
ion
/a
(bn
tonnes
)
Paper
Aluminium
Cement
Steel
Figure 3 - 5 Global production levels of the 'A' industry sectors.
‘B’ sectors
For these industry sectors, data on current production is difficult to find and the aggregation of many different production processes makes this a very heterogeneous sector to treat at a technological level. We therefore followed a similar approach to these sectors as that taken in many econometric models and assumed a future physical activity level linked to, but increasing less strongly than, GDP per capita.
Figure 3 - 6 shows the resulting activity evolution for both, A and B sectors, indexed on 2005 levels. Industrial production in the Scenario is assumed to increase for the coming decades in non-OECD regions and remain stable, with the beginning of a decrease, in OECD regions. These reductions do not require a compromise of living standards, but reflect an increased re-use of materials at the consumer end and advances in material efficiency at the producer’s end, e.g. building cars with lighter frames, leading to lower steel demand per vehicle.
In addition to this reduced demand for materials, recycling is used during production to improve energy efficiency. Stocks of energy-intensive materials have grown over the past decades. As large parts of the stock reach the end of their life, it is expected that recycling will increase as the availability of recoverable materials increases. This might result in a situation where production from primary resources will be needed
A S USTAI NABLE E NERGY S UPPLY F OR EVERY ONE
only to offset losses due to dissipative use (e.g. hygienic papers, fertiliser), quality loss (e.g. paper fibre, plastics) or other losses.
Indexed absolute activity levels
0%
100%
200%
300%
400%
2000 2010 2020 2030 2040 2050
Act
ivity
(index
edon
2005)
Industry (A) non-OECD
Industry (A) OECD
Industry (B) non-OECD
Industry (B) OECD
Figure 3 - 6 Indexed evolution of activity in the Industry sector.
3.2.3 Industry – Future energy intensity
Once the total production level has been determined for each sector, future energy intensity is estimated, based on key marker processes. The overall result is a decrease in energy intensity, measured in energy per tonne produced for ‘A’ sectors, and in energy per economic value for ‘B’ sectors. The energy intensity evolution was examined in detail for the four ‘A’ sectors and the results are shown in Figure 3 - 7. Although the individual technologies vary by sector, all sectors follow these common assumptions:
Increased use of recovered input materials or alternative routes o i.e. recycling of steel, paper and aluminium and alternative input materials
into the clinker process in cement production Ambitious refurbishment of existing plants to meet performance benchmarks and stringent requirements for using best available technology (BAT) in all new plants.12
Continuing improvements of BAT over time.
For the ‘B’ sectors, an annual efficiency improvement of 2% was assumed, which may be obtained through improved process optimisation, more efficient energy supply,
12 No explicit assumptions are made on the early retirement of industrial plants, but the rapid move to BAT will likely require ambitious retrofitting or replacement of the least efficient plants.
121Part 2 - The Ecofys Energy Scenario
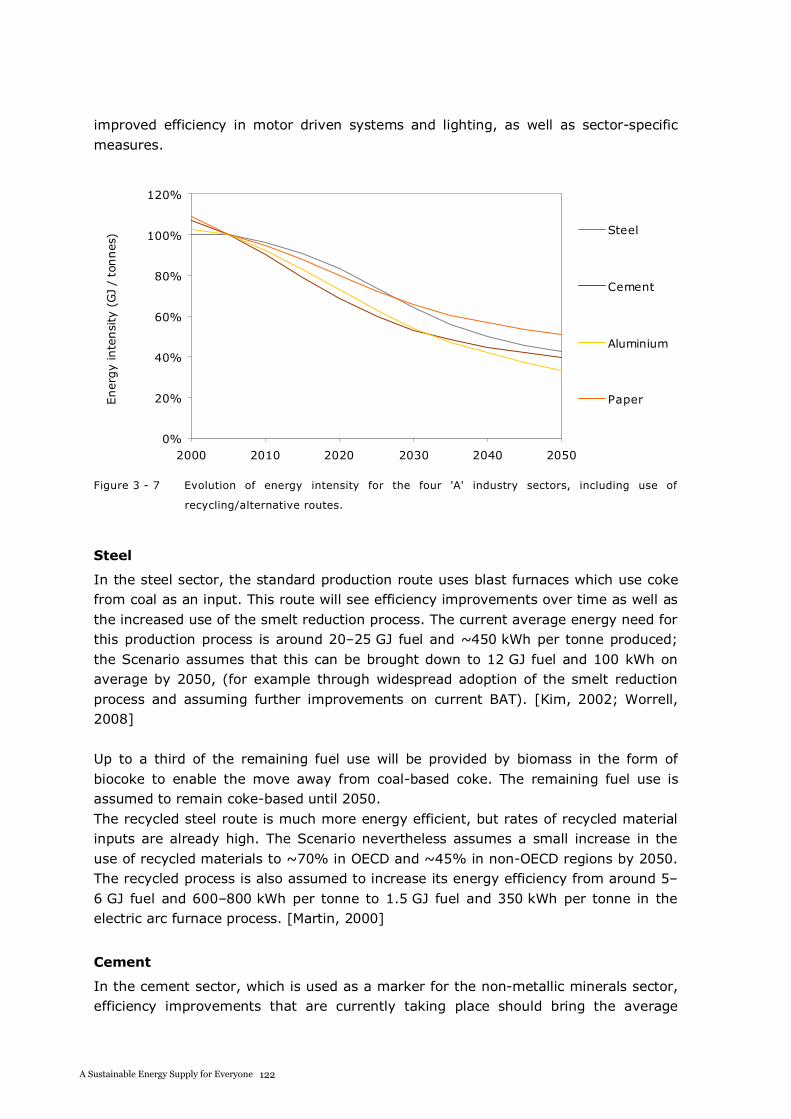
A S USTAI NABLE E NERGY S UPPLY F OR EVERY ONE
improved efficiency in motor driven systems and lighting, as well as sector-specific measures.
0%
20%
40%
60%
80%
100%
120%
2000 2010 2020 2030 2040 2050
Ener
gy
inte
nsi
ty(G
J/
tonnes
) Steel
Cement
Aluminium
Paper
Figure 3 - 7 Evolution of energy intensity for the four 'A' industry sectors, including use of
recycling/alternative routes.
Steel
In the steel sector, the standard production route uses blast furnaces which use coke from coal as an input. This route will see efficiency improvements over time as well as the increased use of the smelt reduction process. The current average energy need for this production process is around 20–25 GJ fuel and ~450 kWh per tonne produced; the Scenario assumes that this can be brought down to 12 GJ fuel and 100 kWh on average by 2050, (for example through widespread adoption of the smelt reduction process and assuming further improvements on current BAT). [Kim, 2002; Worrell, 2008]
Up to a third of the remaining fuel use will be provided by biomass in the form of biocoke to enable the move away from coal-based coke. The remaining fuel use is assumed to remain coke-based until 2050. The recycled steel route is much more energy efficient, but rates of recycled material inputs are already high. The Scenario nevertheless assumes a small increase in the use of recycled materials to ~70% in OECD and ~45% in non-OECD regions by 2050. The recycled process is also assumed to increase its energy efficiency from around 5–6 GJ fuel and 600–800 kWh per tonne to 1.5 GJ fuel and 350 kWh per tonne in the electric arc furnace process. [Martin, 2000]
Cement
In the cement sector, which is used as a marker for the non-metallic minerals sector, efficiency improvements that are currently taking place should bring the average
A S USTAI NABLE E NERGY S UPPLY F OR EVERY ONE
energy intensity down from 5–6 GJ fuel per tonne to 3 GJ fuel per tonne. Also, a ~30% reduction on the electricity demand (to ~80 kWh per tonne) was assumed. Because of the high temperatures required, only half of the fuel needs can be provided by biomass, but where biomass is used, any combustible biomass is suitable. The Scenario also assumes a reduction in energy- and carbon-intensive clinker production. Clinker is replaced by industrial by-products such as blast furnace slags, fly ash or natural pozzolanes in up to 40% of cement production by 2050. This would result in cement that would set more slowly, but also be of higher strength. [Kim, 2002]
Box 3 - 1 Case study: State-of-the-art plants save energy in the cement industry.
CASE STUDY STATE-OF-THE-ART PLANTS SAVE ENERGY IN THE CEMENT INDUSTRY
The cement industry is a large energy user and also an important
global contributor to greenhouse gas emissions. The U.S. is the
third largest cement producer in the world.
Salt River Materials Group operates a cement plant in Clarksdale,
Arizona, U.S.A. The plant was built in the 1950’s and over time,
received various upgrades to increase kiln capacity and other
operating systems.
In 1999, the company installed a set of new equipment that
substantially improved energy performance. The plant upgrades
included:
A vertical roller mill for raw materials, fuels and, finished
cement
A new 5-stage, low NOx preheater/calciner kiln with state-of-the-art clinker cooler
A modern kiln burner.
The new equipment improved energy performance substantially across the major energy
intensive processes in the plant, reducing electricity consumption by 50% and fuel
consumption by 37%. The upgrade made the Clarksdale plant one of the most efficient cement
plants in North-America. It received recognition for this achievement from the ENERGY STAR
program of the U.S. Environmental Protection Agency.
Aluminium
Aluminium, which is used as a marker for the non-ferrous metals sector, will include vastly increasing shares of secondary, recycled aluminium in the production process. Recycling of aluminium uses fuels which are not easily replaced by biofuels, but at 4–5 GJ per tonne, it is a much more efficient process than the production of primary aluminium which, in addition to 1–2 GJ per tonne for pre-baking of the anodes, uses 15–16 MWh (not kWh) of electricity per tonne of aluminium produced, equivalent to 55 GJ per tonne, i.e. it is an order of magnitude more energy intensive than recycling. The Scenario assumes that this can be reduced to around 12 MWh per tonne in the future, but prioritises the recycling of aluminium where possible. Shares of recycled
122A Sustainable Energy Supply for Everyone
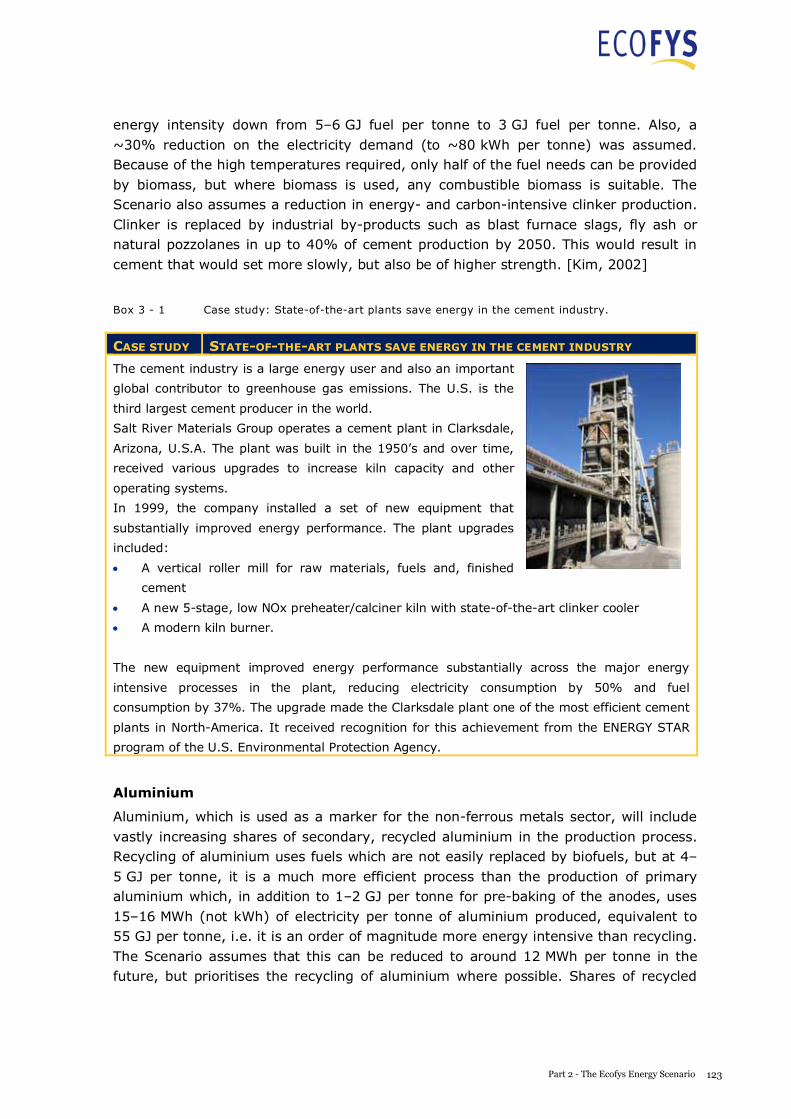
A S USTAI NABLE E NERGY S UPPLY F OR EVERY ONE
energy intensity down from 5–6 GJ fuel per tonne to 3 GJ fuel per tonne. Also, a ~30% reduction on the electricity demand (to ~80 kWh per tonne) was assumed. Because of the high temperatures required, only half of the fuel needs can be provided by biomass, but where biomass is used, any combustible biomass is suitable. The Scenario also assumes a reduction in energy- and carbon-intensive clinker production. Clinker is replaced by industrial by-products such as blast furnace slags, fly ash or natural pozzolanes in up to 40% of cement production by 2050. This would result in cement that would set more slowly, but also be of higher strength. [Kim, 2002]
Box 3 - 1 Case study: State-of-the-art plants save energy in the cement industry.
CASE STUDY STATE-OF-THE-ART PLANTS SAVE ENERGY IN THE CEMENT INDUSTRY
The cement industry is a large energy user and also an important
global contributor to greenhouse gas emissions. The U.S. is the
third largest cement producer in the world.
Salt River Materials Group operates a cement plant in Clarksdale,
Arizona, U.S.A. The plant was built in the 1950’s and over time,
received various upgrades to increase kiln capacity and other
operating systems.
In 1999, the company installed a set of new equipment that
substantially improved energy performance. The plant upgrades
included:
A vertical roller mill for raw materials, fuels and, finished
cement
A new 5-stage, low NOx preheater/calciner kiln with state-of-the-art clinker cooler
A modern kiln burner.
The new equipment improved energy performance substantially across the major energy
intensive processes in the plant, reducing electricity consumption by 50% and fuel
consumption by 37%. The upgrade made the Clarksdale plant one of the most efficient cement
plants in North-America. It received recognition for this achievement from the ENERGY STAR
program of the U.S. Environmental Protection Agency.
Aluminium
Aluminium, which is used as a marker for the non-ferrous metals sector, will include vastly increasing shares of secondary, recycled aluminium in the production process. Recycling of aluminium uses fuels which are not easily replaced by biofuels, but at 4–5 GJ per tonne, it is a much more efficient process than the production of primary aluminium which, in addition to 1–2 GJ per tonne for pre-baking of the anodes, uses 15–16 MWh (not kWh) of electricity per tonne of aluminium produced, equivalent to 55 GJ per tonne, i.e. it is an order of magnitude more energy intensive than recycling. The Scenario assumes that this can be reduced to around 12 MWh per tonne in the future, but prioritises the recycling of aluminium where possible. Shares of recycled
123Part 2 - The Ecofys Energy Scenario
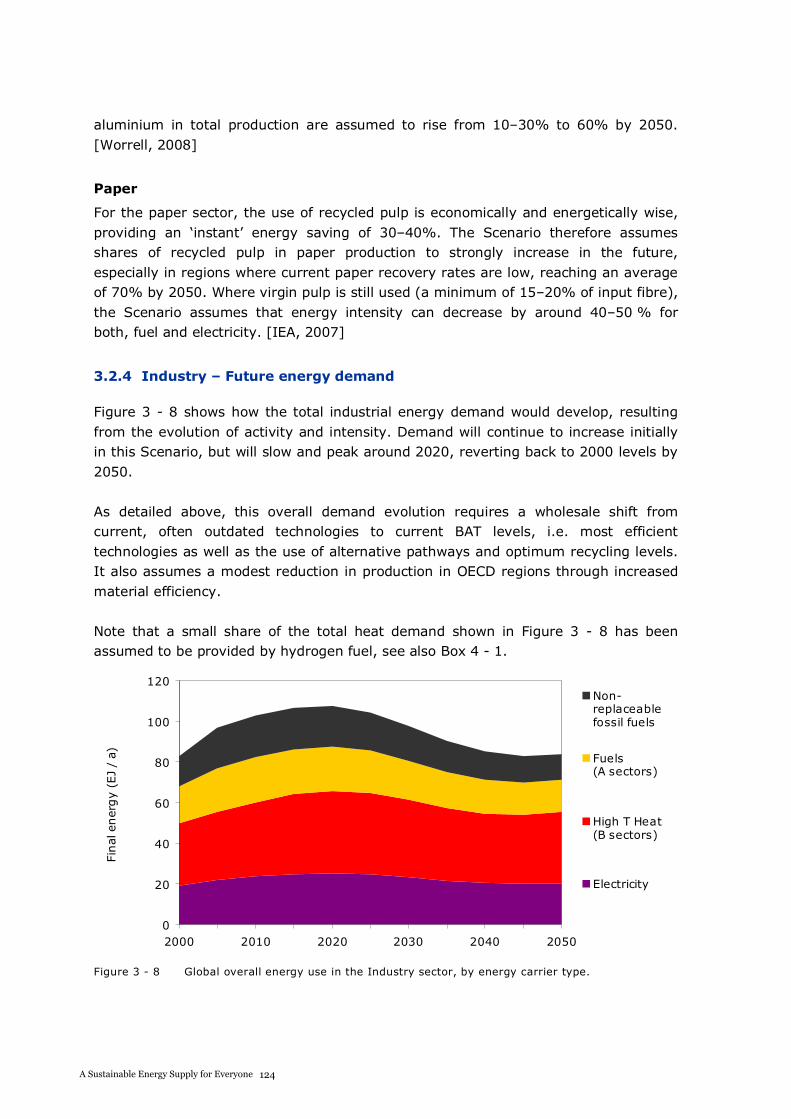
A S USTAI NABLE E NERGY S UPPLY F OR EVERY ONE
aluminium in total production are assumed to rise from 10–30% to 60% by 2050. [Worrell, 2008]
Paper
For the paper sector, the use of recycled pulp is economically and energetically wise, providing an ‘instant’ energy saving of 30–40%. The Scenario therefore assumes shares of recycled pulp in paper production to strongly increase in the future, especially in regions where current paper recovery rates are low, reaching an average of 70% by 2050. Where virgin pulp is still used (a minimum of 15–20% of input fibre), the Scenario assumes that energy intensity can decrease by around 40–50 % for both, fuel and electricity. [IEA, 2007]
3.2.4 Industry – Future energy demand
Figure 3 - 8 shows how the total industrial energy demand would develop, resulting from the evolution of activity and intensity. Demand will continue to increase initially in this Scenario, but will slow and peak around 2020, reverting back to 2000 levels by 2050.
As detailed above, this overall demand evolution requires a wholesale shift from current, often outdated technologies to current BAT levels, i.e. most efficient technologies as well as the use of alternative pathways and optimum recycling levels. It also assumes a modest reduction in production in OECD regions through increased material efficiency.
Note that a small share of the total heat demand shown in Figure 3 - 8 has been assumed to be provided by hydrogen fuel, see also Box 4 - 1.
0
20
40
60
80
100
120
2000 2010 2020 2030 2040 2050
Final
ener
gy
(EJ
/a)
Non-replaceablefossil fuels
Fuels(A sectors)
High T Heat(B sectors)
Electricity
Figure 3 - 8 Global overall energy use in the Industry sector, by energy carrier type.
A S USTAI NABLE E NERGY S UPPLY F OR EVERY ONE
3.3 Buildings
The building sector provides great potential for energy savings and electrification. The sector is also marked by longevity: decisions on building design today influence building energy use for many decades, often up to a century, given the lifetimes of our building stock.
3.3.1 Buildings – Definitions
The built environment sector, which we will refer to simply as the ‘Buildings’ sector in this document, covers energy use in the residential and services sector, according to the definitions in the IEA Energy balances (see Table 3 - 2).10
Table 3 - 2 Building sector definitions.
Building sector
(IEA definition)
Building sector
(Scenario definition)
Residential Residential
Commercial and public services Commercial
3.3.2 Buildings – Future activity
The following steps are followed in this Energy Scenario to establish the future activity levels in the Building sector: 1 Total future floor area, which is the activity marker in the Building sector, is
projected based on population growth and increased living space per capita13.Similarly to the industry sector, the future residential floor space per capita is informed by a relationship between living space and GDP per capita (see Appendix B 2).
2 Assumptions on typical, historical demolition rates are then used to split into floor area that exists today (pre-2005 stock) and floor area yet to be built (new stock). The results for the residential buildings sector are shown in Figure 3 - 9.
13 This increase is not necessarily the same in all regions as starting points vary.
124A Sustainable Energy Supply for Everyone
A S USTAI NABLE E NERGY S UPPLY F OR EVERY ONE
3.3 Buildings
The building sector provides great potential for energy savings and electrification. The sector is also marked by longevity: decisions on building design today influence building energy use for many decades, often up to a century, given the lifetimes of our building stock.
3.3.1 Buildings – Definitions
The built environment sector, which we will refer to simply as the ‘Buildings’ sector in this document, covers energy use in the residential and services sector, according to the definitions in the IEA Energy balances (see Table 3 - 2).10
Table 3 - 2 Building sector definitions.
Building sector
(IEA definition)
Building sector
(Scenario definition)
Residential Residential
Commercial and public services Commercial
3.3.2 Buildings – Future activity
The following steps are followed in this Energy Scenario to establish the future activity levels in the Building sector: 1 Total future floor area, which is the activity marker in the Building sector, is
projected based on population growth and increased living space per capita13.Similarly to the industry sector, the future residential floor space per capita is informed by a relationship between living space and GDP per capita (see Appendix B 2).
2 Assumptions on typical, historical demolition rates are then used to split into floor area that exists today (pre-2005 stock) and floor area yet to be built (new stock). The results for the residential buildings sector are shown in Figure 3 - 9.
13 This increase is not necessarily the same in all regions as starting points vary.
125Part 2 - The Ecofys Energy Scenario
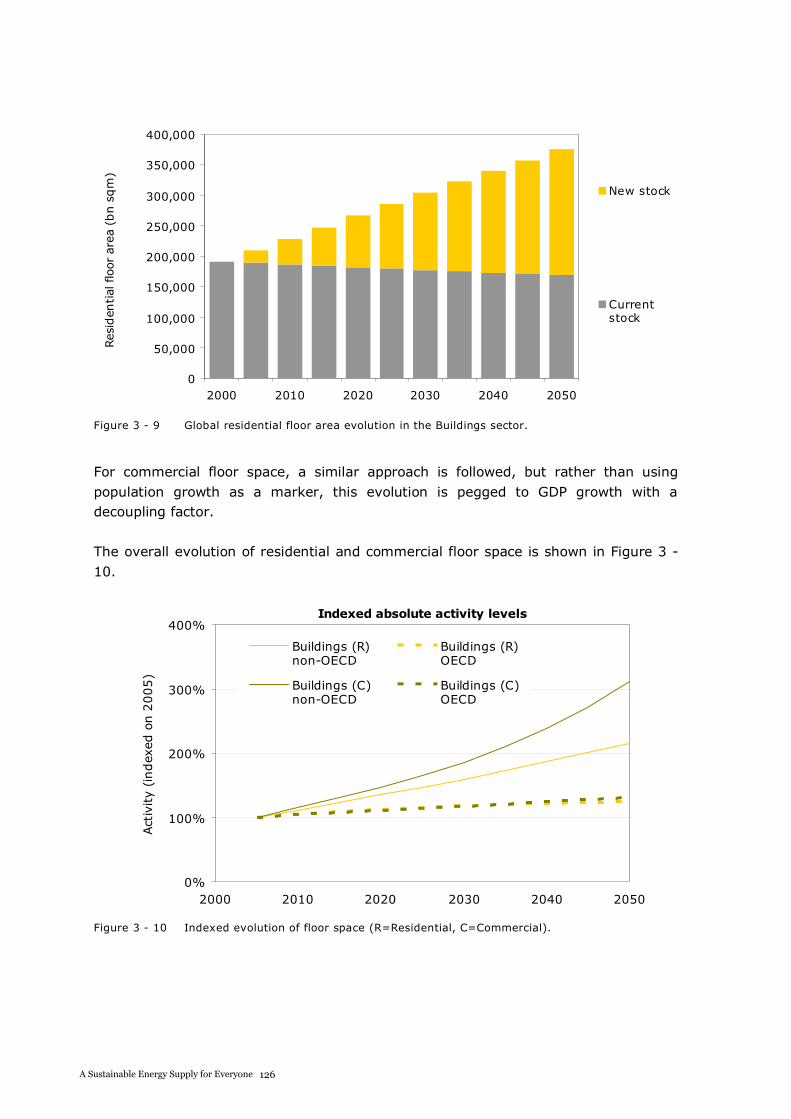
A S USTAI NABLE E NERGY S UPPLY F OR EVERY ONE
0
50,000
100,000
150,000
200,000
250,000
300,000
350,000
400,000
2000 2010 2020 2030 2040 2050
Res
iden
tial
floor
area
(bn
sqm
)
New stock
Currentstock
Figure 3 - 9 Global residential floor area evolution in the Buildings sector.
For commercial floor space, a similar approach is followed, but rather than using population growth as a marker, this evolution is pegged to GDP growth with a decoupling factor.
The overall evolution of residential and commercial floor space is shown in Figure 3 - 10.
Indexed absolute activity levels
0%
100%
200%
300%
400%
2000 2010 2020 2030 2040 2050
Act
ivity
(index
edon
2005)
Buildings (R) non-OECD
Buildings (R) OECD
Buildings (C) non-OECD
Buildings (C) OECD
Figure 3 - 10 Indexed evolution of floor space (R=Residential, C=Commercial).
A S USTAI NABLE E NERGY S UPPLY F OR EVERY ONE
3.3.3 Buildings – Future energy intensity
The following steps are followed to discover the possible evolution of energy intensity for the Scenario, i.e. the possible future heat and electricity demand per square meter of living or commercial floor area.
For each type of floor area, future energy intensity was projected based on the following assumptions:
Existing pre-2005 stock: 1 All existing buildings would be retrofitted by 2050 to ambitious energy efficiency
standards. This requires retrofit rates of up to 2.5% of floor area per year,which is high compared to current practice, yet feasible (see Figure 3 - 11.)
2 For a given retrofit, it is assumed that, on average, 60% of the heating needs could be abated by insulating walls, roofs and ground floors, replacing old windows with highly energy efficient windows and by installing ventilation systems with heat recovery mechanisms.
3 A quarter of the remaining heating and hot water need would be met by local solar thermal systems, the rest by heat pumps.14
4 Cooling will be provided by local, renewable solutions where possible (see Box 3 - 3).
5 Increased electricity needs per floor area due to increased cooling demand, increased appliances use (per area) and heat pump powering have also been estimated.
New stock: 1 The Scenario assumes that new buildings will increasingly be built to a near zero
energy use standard15, reaching a penetration of 100% of new buildings by 2030. These are highly energy efficient buildings due to very low losses through the building envelope (insulation and improved windows) and almost no losses from air exchange (use of heat recovery systems).
2 The residual heat demand is covered by passive solar, (irradiation through windows) and internal, (people, appliances) gains, renewable energy systems in the form of solar thermal installations and heat pumps.
3 In comparison to a new building of today, this building type requires no fuel supply of any kind, i.e. it is an all-electric building.
4 The near zero-energy concept will also be applied to warm/hot climates, often reviving traditional building approaches. These include external shading devices
14 Other technologies, such as wood pellet ovens, may have a role to play in niche markets or as a bridging technology, but have not been included in this Scenario which emphasises the use of heat pumps run on renewable electricity. 15By ‘near-zero energy use’ we mean buildings which have an energy use at levels comparable to the passive house standard developed in Germany.
126A Sustainable Energy Supply for Everyone
A S USTAI NABLE E NERGY S UPPLY F OR EVERY ONE
3.3.3 Buildings – Future energy intensity
The following steps are followed to discover the possible evolution of energy intensity for the Scenario, i.e. the possible future heat and electricity demand per square meter of living or commercial floor area.
For each type of floor area, future energy intensity was projected based on the following assumptions:
Existing pre-2005 stock: 1 All existing buildings would be retrofitted by 2050 to ambitious energy efficiency
standards. This requires retrofit rates of up to 2.5% of floor area per year,which is high compared to current practice, yet feasible (see Figure 3 - 11.)
2 For a given retrofit, it is assumed that, on average, 60% of the heating needs could be abated by insulating walls, roofs and ground floors, replacing old windows with highly energy efficient windows and by installing ventilation systems with heat recovery mechanisms.
3 A quarter of the remaining heating and hot water need would be met by local solar thermal systems, the rest by heat pumps.14
4 Cooling will be provided by local, renewable solutions where possible (see Box 3 - 3).
5 Increased electricity needs per floor area due to increased cooling demand, increased appliances use (per area) and heat pump powering have also been estimated.
New stock: 1 The Scenario assumes that new buildings will increasingly be built to a near zero
energy use standard15, reaching a penetration of 100% of new buildings by 2030. These are highly energy efficient buildings due to very low losses through the building envelope (insulation and improved windows) and almost no losses from air exchange (use of heat recovery systems).
2 The residual heat demand is covered by passive solar, (irradiation through windows) and internal, (people, appliances) gains, renewable energy systems in the form of solar thermal installations and heat pumps.
3 In comparison to a new building of today, this building type requires no fuel supply of any kind, i.e. it is an all-electric building.
4 The near zero-energy concept will also be applied to warm/hot climates, often reviving traditional building approaches. These include external shading devices
14 Other technologies, such as wood pellet ovens, may have a role to play in niche markets or as a bridging technology, but have not been included in this Scenario which emphasises the use of heat pumps run on renewable electricity. 15By ‘near-zero energy use’ we mean buildings which have an energy use at levels comparable to the passive house standard developed in Germany.
127Part 2 - The Ecofys Energy Scenario
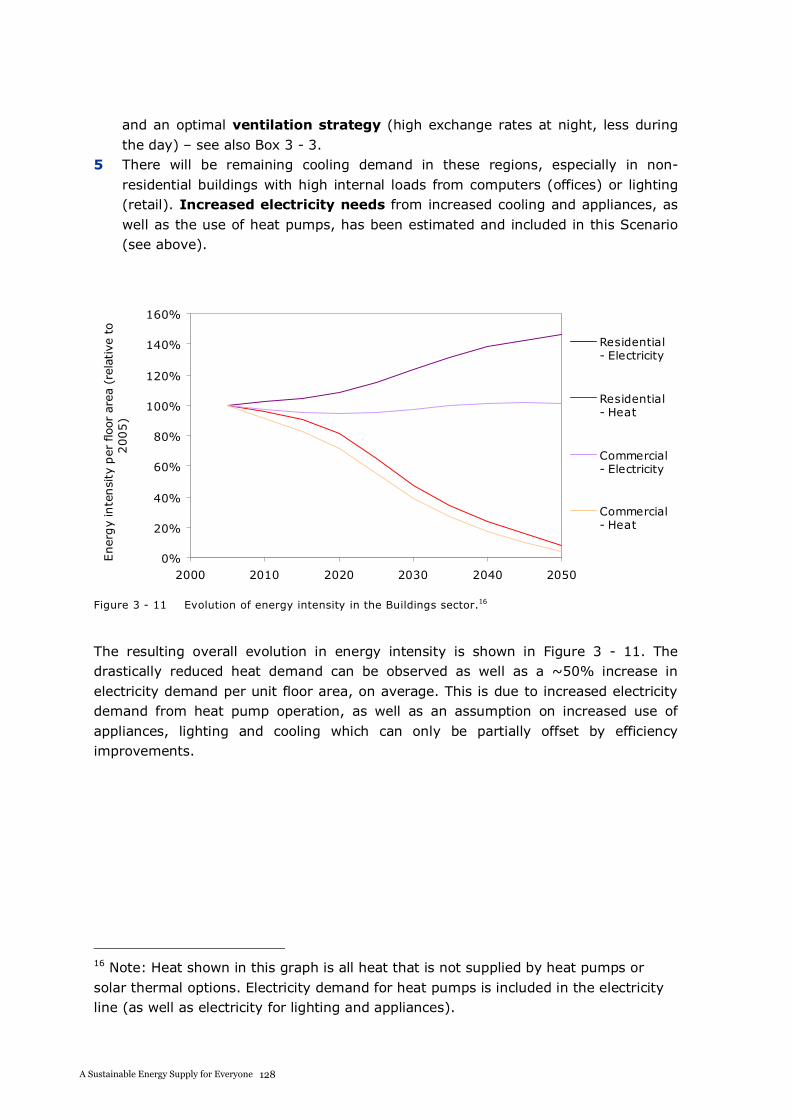
A S USTAI NABLE E NERGY S UPPLY F OR EVERY ONE
and an optimal ventilation strategy (high exchange rates at night, less during the day) – see also Box 3 - 3.
5 There will be remaining cooling demand in these regions, especially in non-residential buildings with high internal loads from computers (offices) or lighting (retail). Increased electricity needs from increased cooling and appliances, as well as the use of heat pumps, has been estimated and included in this Scenario (see above).
0%
20%
40%
60%
80%
100%
120%
140%
160%
2000 2010 2020 2030 2040 2050
Ener
gy
inte
nsi
typer
floor
area
(rel
ativ
eto
2005)
Residential- Electricity
Residential- Heat
Commercial- Electricity
Commercial- Heat
Figure 3 - 11 Evolution of energy intensity in the Buildings sector.16
The resulting overall evolution in energy intensity is shown in Figure 3 - 11. The drastically reduced heat demand can be observed as well as a ~50% increase in electricity demand per unit floor area, on average. This is due to increased electricity demand from heat pump operation, as well as an assumption on increased use of appliances, lighting and cooling which can only be partially offset by efficiency improvements.
16 Note: Heat shown in this graph is all heat that is not supplied by heat pumps or solar thermal options. Electricity demand for heat pumps is included in the electricity line (as well as electricity for lighting and appliances).
A S USTAI NABLE E NERGY S UPPLY F OR EVERY ONE
Box 3 - 2 Story: Retrofit rates in Buildings.
STORY BUILDING RETROFIT RATES
This Scenario assumes that retrofit rates will rise from
their current levels to reach 2–3% by ~2020, to allow
full retrofit of all existing building stock by or before
2050.
This may seem like a challenging ambition, given
current retrofit levels in many parts of the world.
However, this would not the first time such high retrofit
levels have been achieved. According to the German
CO2 buildings report [DE Gov, 2006], the refurbishment
rate in Germany in 2006 was approximately 2.2% and, according to the national energy
efficiency action plan [DE Gov, 2007], the German government set a refurbishment rate target
of 2.6% for 2016 in accordance with the current policy direction at European level.
3.3.4 Buildings – Future energy demand
Despite the strong increase in activity, i.e. floor space, the energy intensity reductions detailed above lead to a drastically reduced need for building heat in the form of fuels or heat delivered directly to buildings. At the same time, an increase in electricity use is expected. These results are shown in Figure 3 - 12.
0
20
40
60
80
100
120
140
2000 2010 2020 2030 2040 2050
Final
ener
gy
(EJ/
a) Heat - Low T
Electricity
Figure 3 - 12 Global overall energy use in the Buildings sector, by energy carrier type.
128A Sustainable Energy Supply for Everyone
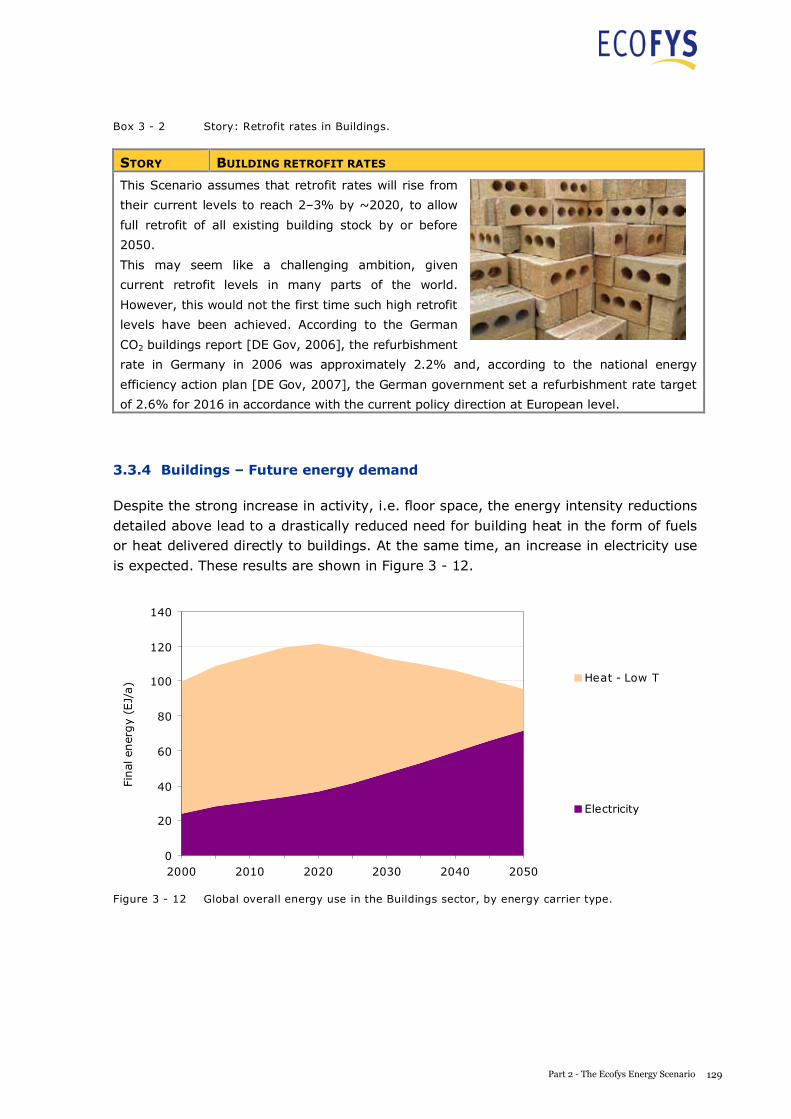
A S USTAI NABLE E NERGY S UPPLY F OR EVERY ONE
Box 3 - 2 Story: Retrofit rates in Buildings.
STORY BUILDING RETROFIT RATES
This Scenario assumes that retrofit rates will rise from
their current levels to reach 2–3% by ~2020, to allow
full retrofit of all existing building stock by or before
2050.
This may seem like a challenging ambition, given
current retrofit levels in many parts of the world.
However, this would not the first time such high retrofit
levels have been achieved. According to the German
CO2 buildings report [DE Gov, 2006], the refurbishment
rate in Germany in 2006 was approximately 2.2% and, according to the national energy
efficiency action plan [DE Gov, 2007], the German government set a refurbishment rate target
of 2.6% for 2016 in accordance with the current policy direction at European level.
3.3.4 Buildings – Future energy demand
Despite the strong increase in activity, i.e. floor space, the energy intensity reductions detailed above lead to a drastically reduced need for building heat in the form of fuels or heat delivered directly to buildings. At the same time, an increase in electricity use is expected. These results are shown in Figure 3 - 12.
0
20
40
60
80
100
120
140
2000 2010 2020 2030 2040 2050
Final
ener
gy
(EJ/
a) Heat - Low T
Electricity
Figure 3 - 12 Global overall energy use in the Buildings sector, by energy carrier type.
129Part 2 - The Ecofys Energy Scenario
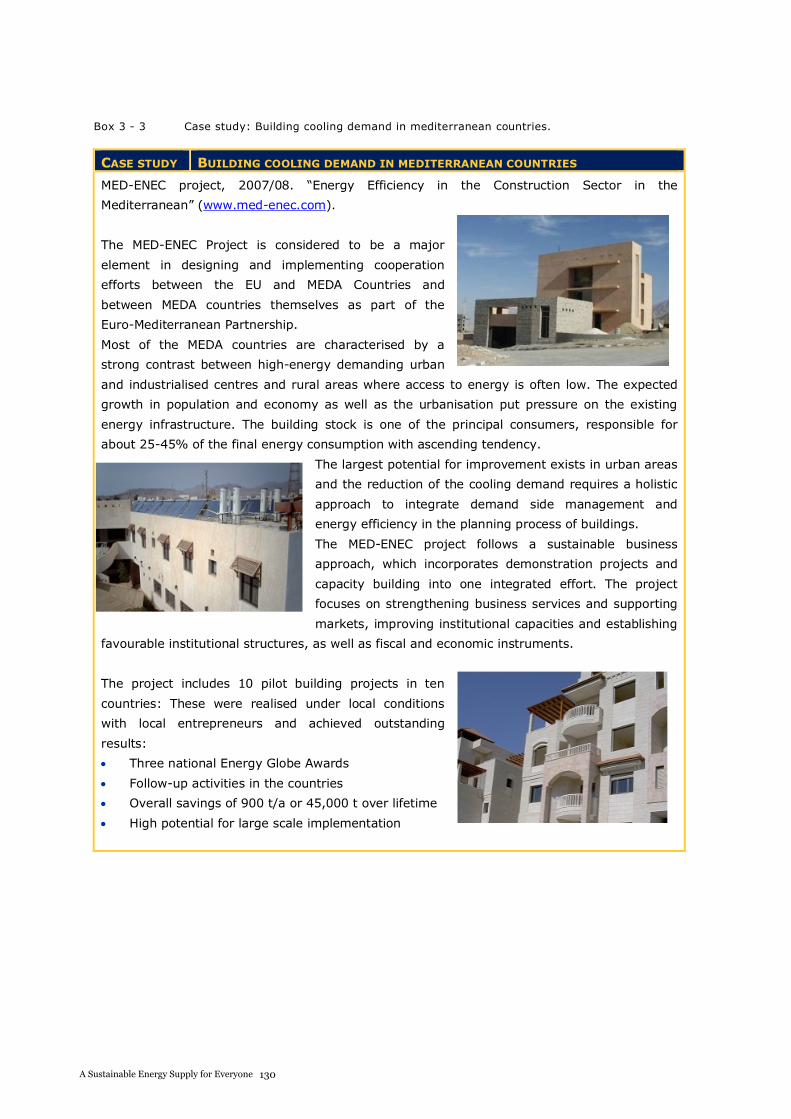
A S USTAI NABLE E NERGY S UPPLY F OR EVERY ONE
Box 3 - 3 Case study: Building cooling demand in mediterranean countries.
CASE STUDY BUILDING COOLING DEMAND IN MEDITERRANEAN COUNTRIES
MED-ENEC project, 2007/08. “Energy Efficiency in the Construction Sector in the
Mediterranean” (www.med-enec.com).
The MED-ENEC Project is considered to be a major
element in designing and implementing cooperation
efforts between the EU and MEDA Countries and
between MEDA countries themselves as part of the
Euro-Mediterranean Partnership.
Most of the MEDA countries are characterised by a
strong contrast between high-energy demanding urban
and industrialised centres and rural areas where access to energy is often low. The expected
growth in population and economy as well as the urbanisation put pressure on the existing
energy infrastructure. The building stock is one of the principal consumers, responsible for
about 25-45% of the final energy consumption with ascending tendency.
The largest potential for improvement exists in urban areas
and the reduction of the cooling demand requires a holistic
approach to integrate demand side management and
energy efficiency in the planning process of buildings.
The MED-ENEC project follows a sustainable business
approach, which incorporates demonstration projects and
capacity building into one integrated effort. The project
focuses on strengthening business services and supporting
markets, improving institutional capacities and establishing
favourable institutional structures, as well as fiscal and economic instruments.
The project includes 10 pilot building projects in ten
countries: These were realised under local conditions
with local entrepreneurs and achieved outstanding
results:
Three national Energy Globe Awards
Follow-up activities in the countries
Overall savings of 900 t/a or 45,000 t over lifetime
High potential for large scale implementation
A S USTAI NABLE E NERGY S UPPLY F OR EVERY ONE
3.4 Transport
3.4.1 Transport – Definitions
Activity in the transport sector is commonly given in person-km (pkm) for passenger transport and tonne-km (tkm) for freight transport. The transport sector is thus differentiated into passenger and freight modes in the Scenario. The detailed definitions are given in Table 3 - 3.
Table 3 - 3 Transport sector definitions
Transport mode
(IEA definition)
Transport mode
(Scenario definition)
Road PSNGR - PTWs17
Road PSNGR - Car, City
Road PSNGR - Car, non-City
Road PSNGR - Bus+Coach
Rail PSNGR - Rail
Aviation PSNGR - Plane
Road FRGHT - Truck
Rail FRGHT - Rail
Aviation FRGHT - Plane
Domestic navigation +
World Marine Bunkers FRGHT - Ship
3.4.2 Transport – Future activity
The Energy Scenario is using a detailed, established BAU transport activity forecast for future traffic volumes [WBCSD, 2004]. This BAU scenario foresees a marked increase in worldwide travel volumes, in accordance with GDP projections (see Figure 3 - 13).
Modal shifts are then applied to this BAU forecast to arrive at volumes by mode in the Energy Scenario. The results are shown in Figure 3 - 14 for passenger and in Figure 3 - 15 for freight transport.
In the BAU case, transport volumes are expected to increase substantially, especially in developing economies, with a clear emphasis on individual road transport. Although an overall increase in transport can be expected as GDP rises, it is clear that the modal split implied in the BAU case will not result in the most efficient transport system and would likely lead to considerable infrastructure challenges.
17 PTW = Personal two and three wheelers
130A Sustainable Energy Supply for Everyone
A S USTAI NABLE E NERGY S UPPLY F OR EVERY ONE
3.4 Transport
3.4.1 Transport – Definitions
Activity in the transport sector is commonly given in person-km (pkm) for passenger transport and tonne-km (tkm) for freight transport. The transport sector is thus differentiated into passenger and freight modes in the Scenario. The detailed definitions are given in Table 3 - 3.
Table 3 - 3 Transport sector definitions
Transport mode
(IEA definition)
Transport mode
(Scenario definition)
Road PSNGR - PTWs17
Road PSNGR - Car, City
Road PSNGR - Car, non-City
Road PSNGR - Bus+Coach
Rail PSNGR - Rail
Aviation PSNGR - Plane
Road FRGHT - Truck
Rail FRGHT - Rail
Aviation FRGHT - Plane
Domestic navigation +
World Marine Bunkers FRGHT - Ship
3.4.2 Transport – Future activity
The Energy Scenario is using a detailed, established BAU transport activity forecast for future traffic volumes [WBCSD, 2004]. This BAU scenario foresees a marked increase in worldwide travel volumes, in accordance with GDP projections (see Figure 3 - 13).
Modal shifts are then applied to this BAU forecast to arrive at volumes by mode in the Energy Scenario. The results are shown in Figure 3 - 14 for passenger and in Figure 3 - 15 for freight transport.
In the BAU case, transport volumes are expected to increase substantially, especially in developing economies, with a clear emphasis on individual road transport. Although an overall increase in transport can be expected as GDP rises, it is clear that the modal split implied in the BAU case will not result in the most efficient transport system and would likely lead to considerable infrastructure challenges.
17 PTW = Personal two and three wheelers
131Part 2 - The Ecofys Energy Scenario
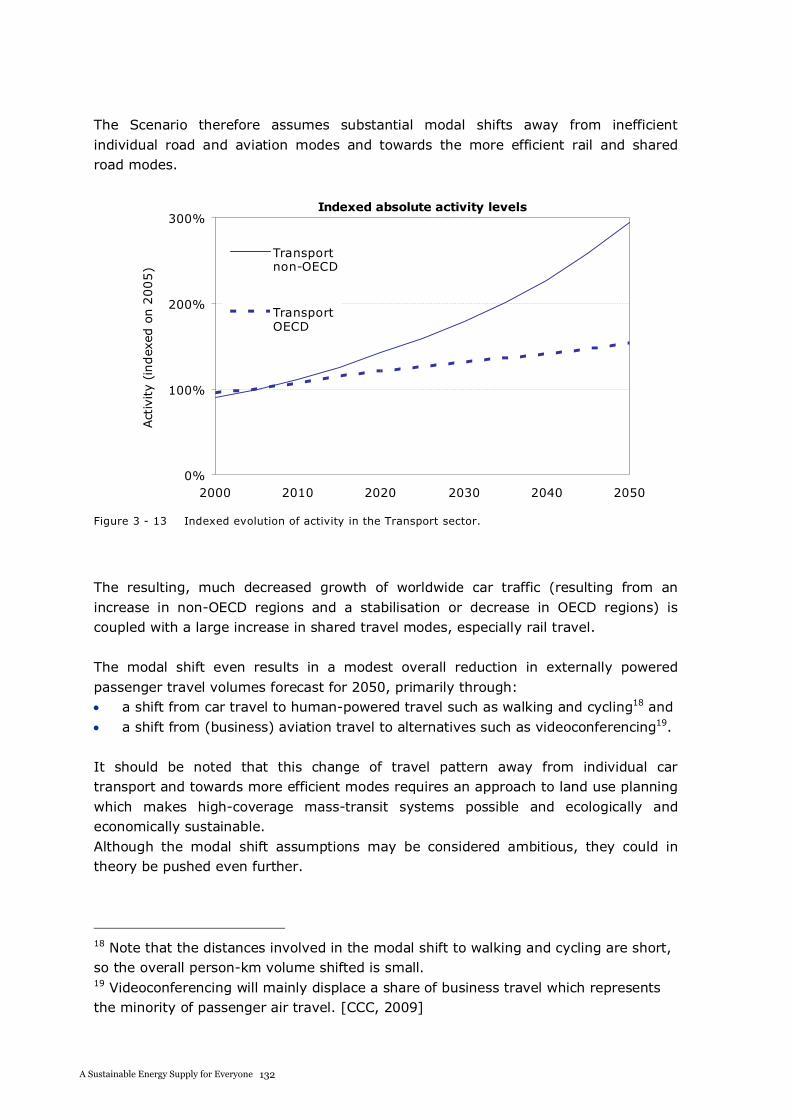
A S USTAI NABLE E NERGY S UPPLY F OR EVERY ONE
The Scenario therefore assumes substantial modal shifts away from inefficient individual road and aviation modes and towards the more efficient rail and shared road modes.
Indexed absolute activity levels
0%
100%
200%
300%
2000 2010 2020 2030 2040 2050
Act
ivity
(index
edon
2005)
Transport non-OECD
Transport OECD
Figure 3 - 13 Indexed evolution of activity in the Transport sector.
The resulting, much decreased growth of worldwide car traffic (resulting from an increase in non-OECD regions and a stabilisation or decrease in OECD regions) is coupled with a large increase in shared travel modes, especially rail travel.
The modal shift even results in a modest overall reduction in externally powered passenger travel volumes forecast for 2050, primarily through:
a shift from car travel to human-powered travel such as walking and cycling18 and a shift from (business) aviation travel to alternatives such as videoconferencing19.
It should be noted that this change of travel pattern away from individual car transport and towards more efficient modes requires an approach to land use planning which makes high-coverage mass-transit systems possible and ecologically and economically sustainable. Although the modal shift assumptions may be considered ambitious, they could in theory be pushed even further.
18 Note that the distances involved in the modal shift to walking and cycling are short, so the overall person-km volume shifted is small. 19 Videoconferencing will mainly displace a share of business travel which represents the minority of passenger air travel. [CCC, 2009]
A S USTAI NABLE E NERGY S UPPLY F OR EVERY ONE
0
510
1520
25
3035
4045
50
2000 2050 BAU 2050 Scenario
Tra
nsp
ort
(tn
pkm
ortk
m)
non-OECD
0
5
10
15
20
25
30
35
2000 2050 BAU 2050 Scenario
Tra
nsp
ort
(tn
pkm
ortk
m)
OECD
Figure 3 - 14 Modal shift for passenger transport.
For freight, volume was shifted from aviation and truck modes towards rail20. Although a reduction of overall freight volumes may be desirable in a more localised economy model, this option was not considered here for lack of a quantitative basis for such assumptions.
Note that the increase in rail capacity needed to sustain the increase in both passenger travel and freight traffic is very large. It can be argued that in the BAU, a similar increase in road traffic would have been required, but the challenge of assuring a high-capacity and well-managed rail network should not be underestimated.
0
5
10
15
20
25
30
2000 2050 BAU 2050 Scenario
Tra
nsp
ort
(tn
pkm
ortk
m)
non-OECD
0
24
68
10
1214
1618
20
2000 2050 BAU 2050 Scenario
Tra
nsp
ort
(tn
pkm
ortk
m)
OECD
Figure 3 - 15 Modal shift for freight transport.
20 Note that due to data availability, long-term energy use for freight by ship was not modelled based on activity but based on GDP forecasts, akin to the ‘A’ and ‘B’ sector approach in Industry.
132A Sustainable Energy Supply for Everyone
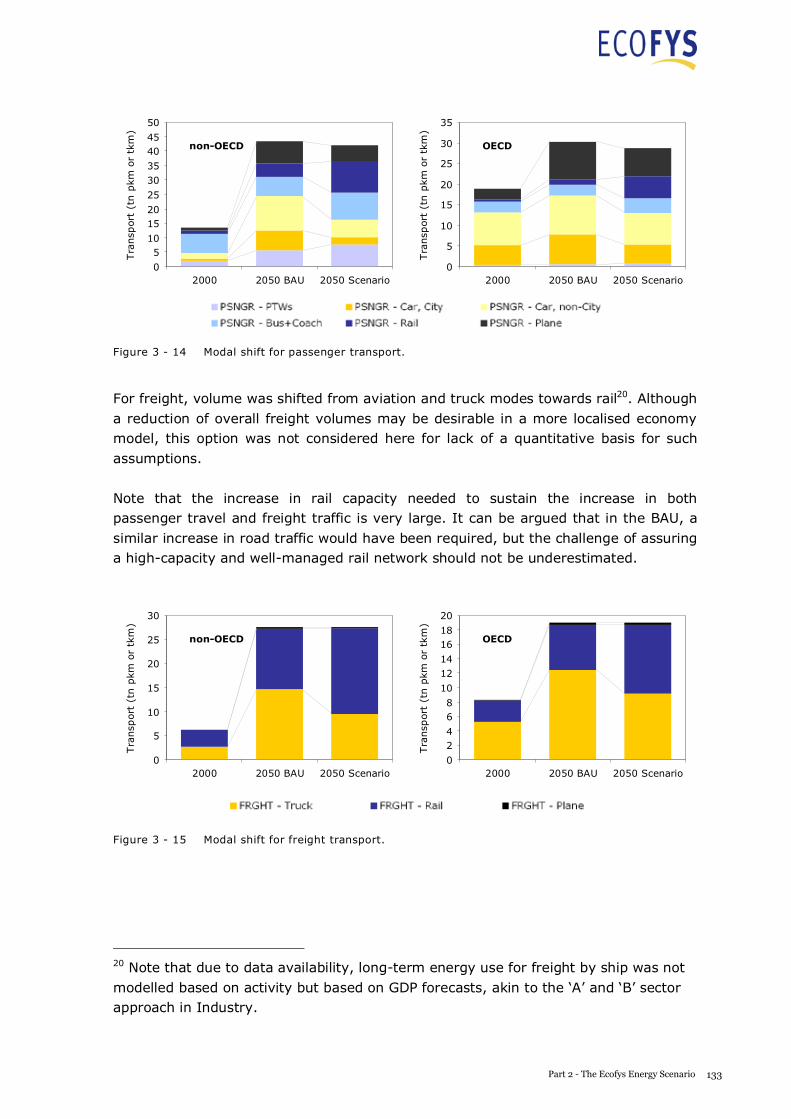
A S USTAI NABLE E NERGY S UPPLY F OR EVERY ONE
0
510
1520
25
3035
4045
50
2000 2050 BAU 2050 Scenario
Tra
nsp
ort
(tn
pkm
ortk
m)
non-OECD
0
5
10
15
20
25
30
35
2000 2050 BAU 2050 Scenario
Tra
nsp
ort
(tn
pkm
ortk
m)
OECD
Figure 3 - 14 Modal shift for passenger transport.
For freight, volume was shifted from aviation and truck modes towards rail20. Although a reduction of overall freight volumes may be desirable in a more localised economy model, this option was not considered here for lack of a quantitative basis for such assumptions.
Note that the increase in rail capacity needed to sustain the increase in both passenger travel and freight traffic is very large. It can be argued that in the BAU, a similar increase in road traffic would have been required, but the challenge of assuring a high-capacity and well-managed rail network should not be underestimated.
0
5
10
15
20
25
30
2000 2050 BAU 2050 Scenario
Tra
nsp
ort
(tn
pkm
ortk
m)
non-OECD
0
24
68
10
1214
1618
20
2000 2050 BAU 2050 Scenario
Tra
nsp
ort
(tn
pkm
ortk
m)
OECD
Figure 3 - 15 Modal shift for freight transport.
20 Note that due to data availability, long-term energy use for freight by ship was not modelled based on activity but based on GDP forecasts, akin to the ‘A’ and ‘B’ sector approach in Industry.
133Part 2 - The Ecofys Energy Scenario
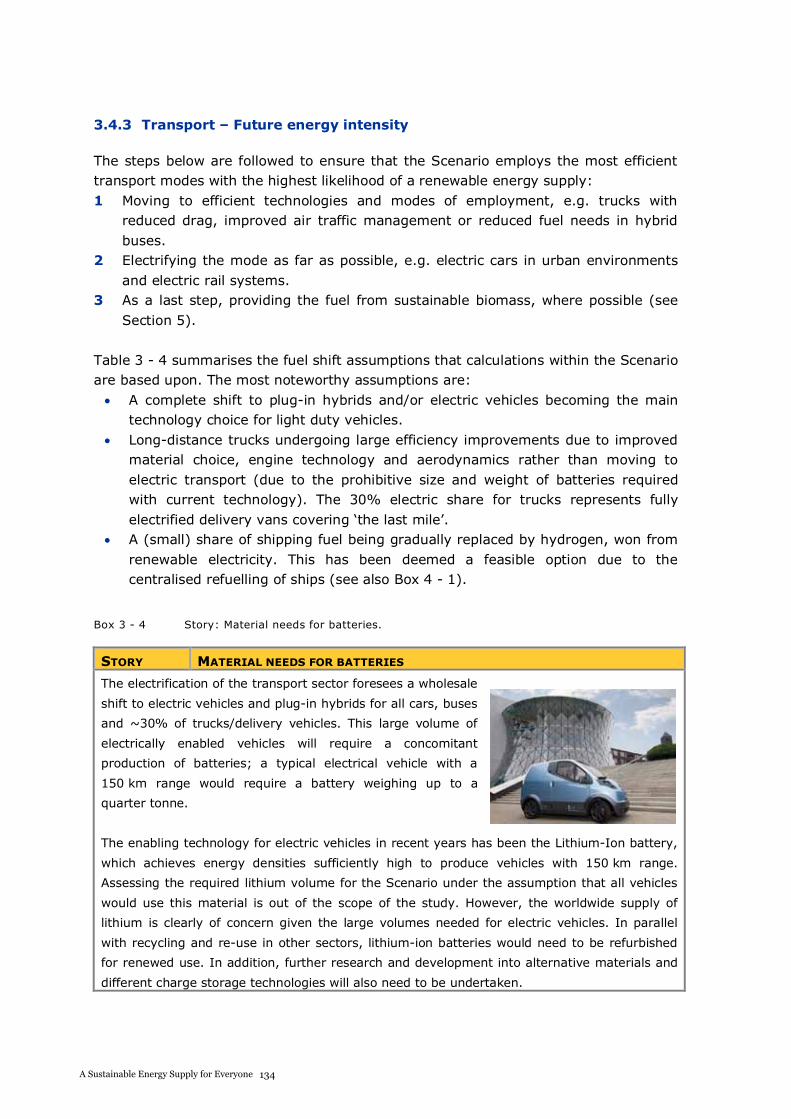
A S USTAI NABLE E NERGY S UPPLY F OR EVERY ONE
3.4.3 Transport – Future energy intensity
The steps below are followed to ensure that the Scenario employs the most efficient transport modes with the highest likelihood of a renewable energy supply: 1 Moving to efficient technologies and modes of employment, e.g. trucks with
reduced drag, improved air traffic management or reduced fuel needs in hybrid buses.
2 Electrifying the mode as far as possible, e.g. electric cars in urban environments and electric rail systems.
3 As a last step, providing the fuel from sustainable biomass, where possible (see Section 5).
Table 3 - 4 summarises the fuel shift assumptions that calculations within the Scenario are based upon. The most noteworthy assumptions are:
A complete shift to plug-in hybrids and/or electric vehicles becoming the main technology choice for light duty vehicles. Long-distance trucks undergoing large efficiency improvements due to improved material choice, engine technology and aerodynamics rather than moving to electric transport (due to the prohibitive size and weight of batteries required with current technology). The 30% electric share for trucks represents fully electrified delivery vans covering ‘the last mile’. A (small) share of shipping fuel being gradually replaced by hydrogen, won from renewable electricity. This has been deemed a feasible option due to the centralised refuelling of ships (see also Box 4 - 1).
Box 3 - 4 Story: Material needs for batteries.
STORY MATERIAL NEEDS FOR BATTERIES
The electrification of the transport sector foresees a wholesale
shift to electric vehicles and plug-in hybrids for all cars, buses
and ~30% of trucks/delivery vehicles. This large volume of
electrically enabled vehicles will require a concomitant
production of batteries; a typical electrical vehicle with a
150 km range would require a battery weighing up to a
quarter tonne.
The enabling technology for electric vehicles in recent years has been the Lithium-Ion battery,
which achieves energy densities sufficiently high to produce vehicles with 150 km range.
Assessing the required lithium volume for the Scenario under the assumption that all vehicles
would use this material is out of the scope of the study. However, the worldwide supply of
lithium is clearly of concern given the large volumes needed for electric vehicles. In parallel
with recycling and re-use in other sectors, lithium-ion batteries would need to be refurbished
for renewed use. In addition, further research and development into alternative materials and
different charge storage technologies will also need to be undertaken.
A S USTAI NABLE E NERGY S UPPLY F OR EVERY ONE
Table 3 - 4 Efficiency and fuel shift assumptions for all transport modes.
Mode Efficiency gains
2050 vs 2000
Electri-
fication21
Comments
PSNGR - PTWs 50%40% –
90%22 e.g. scooters
PSNGR - Car, City 75%
(2000: 8–11 l/100 km
2050: 2–3 l/100 km)
90% 90%, i.e. most transport done by
electric vehicles or on electric portion
of plug-in hybrid vehicles
PSNGR - Car,
non-City 70%
PSNGR -
Bus+Coach 50% – 65% 50% – 70% Hybrids / electric, especially in cities
PSNGR - Rail 30%95% –
100%
Shift to fully electrified rail, resistance
reduction, space optimisation
PSNGR - Plane ~50% n/a
Improvements in airframe and engine
design, gains from air traffic
management optimisation [CCC,
2009]
FRGHT - Truck 65% 30% ‘last-mile’ delivery vans electric
FRGHT - Rail 30%95% –
100%Shift to fully electrified rail
FRGHT - Plane ~50% n/a [see passenger plane travel above]
FRGHT - Ship ~50%
None
[but ~5%
(H2) from
electricity]
Propeller and hull maintenance and
upgrades, retrofits including towing
kite, operational improvements
including speed reduction; small
share of hydrogen fuel in ships [IMO,
2009]
The resulting overall evolution of energy intensity in the transport sector, differentiated by fuel and electricity use, is shown in Figure 3 - 16. Note that the share of electricity looks relatively small in comparison to the fuels, because these still need to undergo conversion at a comparatively lower efficiency to generate mechanical energy for the wheels.
21 Where a shift takes place from fuel to electricity it is assumed that the electrically powered vehicle will need 1.5–2.5 times less final energy on average, since the energy is delivered to the vehicle in an already converted form. 22 Lower end of range used for OECD regions, where motorcycles are the norm, higher end of range for non-OECD where PTW are assumed to include a much higher fraction of electric scooters.
134A Sustainable Energy Supply for Everyone
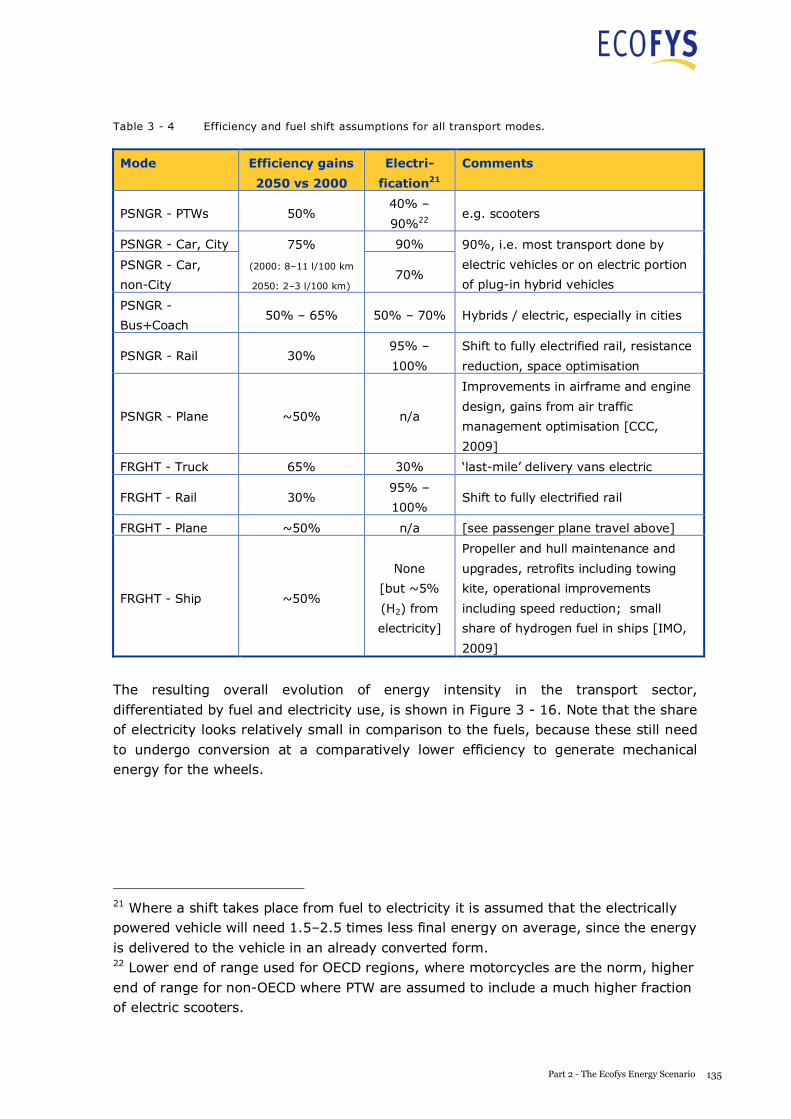
A S USTAI NABLE E NERGY S UPPLY F OR EVERY ONE
Table 3 - 4 Efficiency and fuel shift assumptions for all transport modes.
Mode Efficiency gains
2050 vs 2000
Electri-
fication21
Comments
PSNGR - PTWs 50%40% –
90%22 e.g. scooters
PSNGR - Car, City 75%
(2000: 8–11 l/100 km
2050: 2–3 l/100 km)
90% 90%, i.e. most transport done by
electric vehicles or on electric portion
of plug-in hybrid vehicles
PSNGR - Car,
non-City 70%
PSNGR -
Bus+Coach 50% – 65% 50% – 70% Hybrids / electric, especially in cities
PSNGR - Rail 30%95% –
100%
Shift to fully electrified rail, resistance
reduction, space optimisation
PSNGR - Plane ~50% n/a
Improvements in airframe and engine
design, gains from air traffic
management optimisation [CCC,
2009]
FRGHT - Truck 65% 30% ‘last-mile’ delivery vans electric
FRGHT - Rail 30%95% –
100%Shift to fully electrified rail
FRGHT - Plane ~50% n/a [see passenger plane travel above]
FRGHT - Ship ~50%
None
[but ~5%
(H2) from
electricity]
Propeller and hull maintenance and
upgrades, retrofits including towing
kite, operational improvements
including speed reduction; small
share of hydrogen fuel in ships [IMO,
2009]
The resulting overall evolution of energy intensity in the transport sector, differentiated by fuel and electricity use, is shown in Figure 3 - 16. Note that the share of electricity looks relatively small in comparison to the fuels, because these still need to undergo conversion at a comparatively lower efficiency to generate mechanical energy for the wheels.
21 Where a shift takes place from fuel to electricity it is assumed that the electrically powered vehicle will need 1.5–2.5 times less final energy on average, since the energy is delivered to the vehicle in an already converted form. 22 Lower end of range used for OECD regions, where motorcycles are the norm, higher end of range for non-OECD where PTW are assumed to include a much higher fraction of electric scooters.
135Part 2 - The Ecofys Energy Scenario
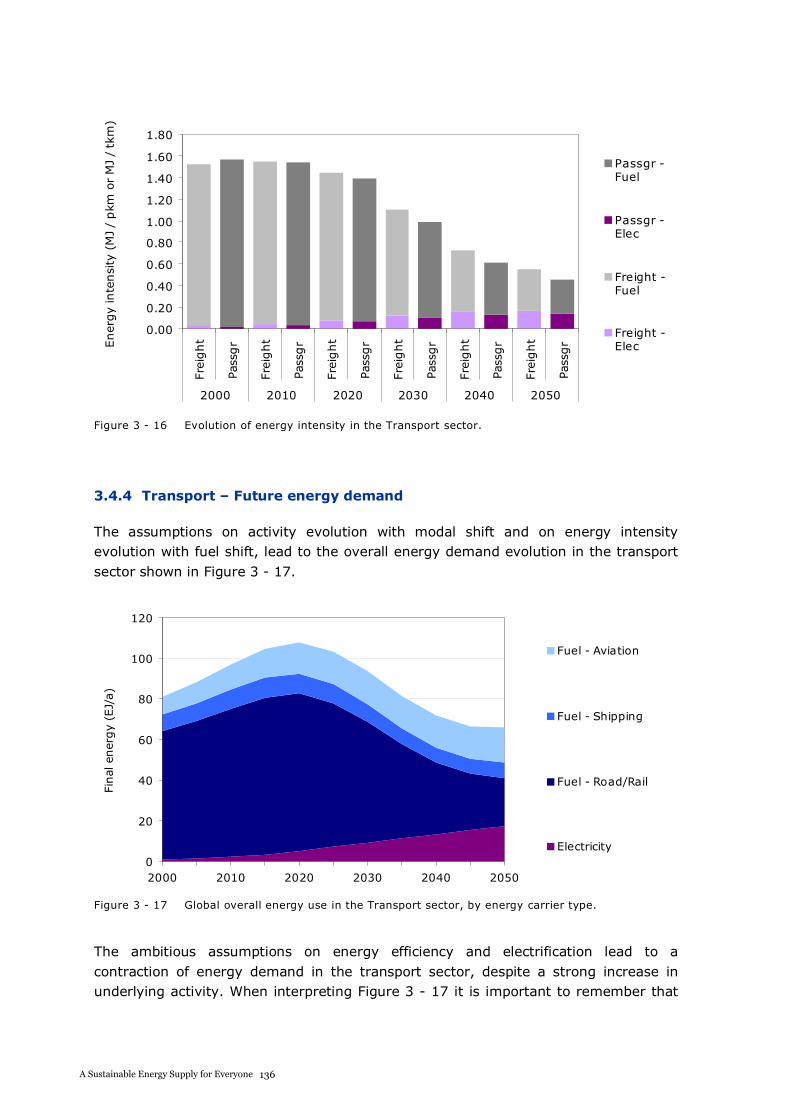
A S USTAI NABLE E NERGY S UPPLY F OR EVERY ONE
0.00
0.20
0.40
0.60
0.80
1.00
1.20
1.40
1.60
1.80
Frei
ght
Pass
gr
Frei
ght
Pass
gr
Frei
ght
Pass
gr
Frei
ght
Pass
gr
Frei
ght
Pass
gr
Frei
ght
Pass
gr
2000 2010 2020 2030 2040 2050
Ener
gy
inte
nsi
ty(M
J/
pkm
orM
J/
tkm
)
Passgr -Fuel
Passgr -Elec
Freight -Fuel
Freight -Elec
Figure 3 - 16 Evolution of energy intensity in the Transport sector.
3.4.4 Transport – Future energy demand
The assumptions on activity evolution with modal shift and on energy intensity evolution with fuel shift, lead to the overall energy demand evolution in the transport sector shown in Figure 3 - 17.
0
20
40
60
80
100
120
2000 2010 2020 2030 2040 2050
Final
ener
gy
(EJ/
a)
Fuel - Aviation
Fuel - Shipping
Fuel - Road/Rail
Electricity
Figure 3 - 17 Global overall energy use in the Transport sector, by energy carrier type.
The ambitious assumptions on energy efficiency and electrification lead to a contraction of energy demand in the transport sector, despite a strong increase in underlying activity. When interpreting Figure 3 - 17 it is important to remember that
136A Sustainable Energy Supply for Everyone
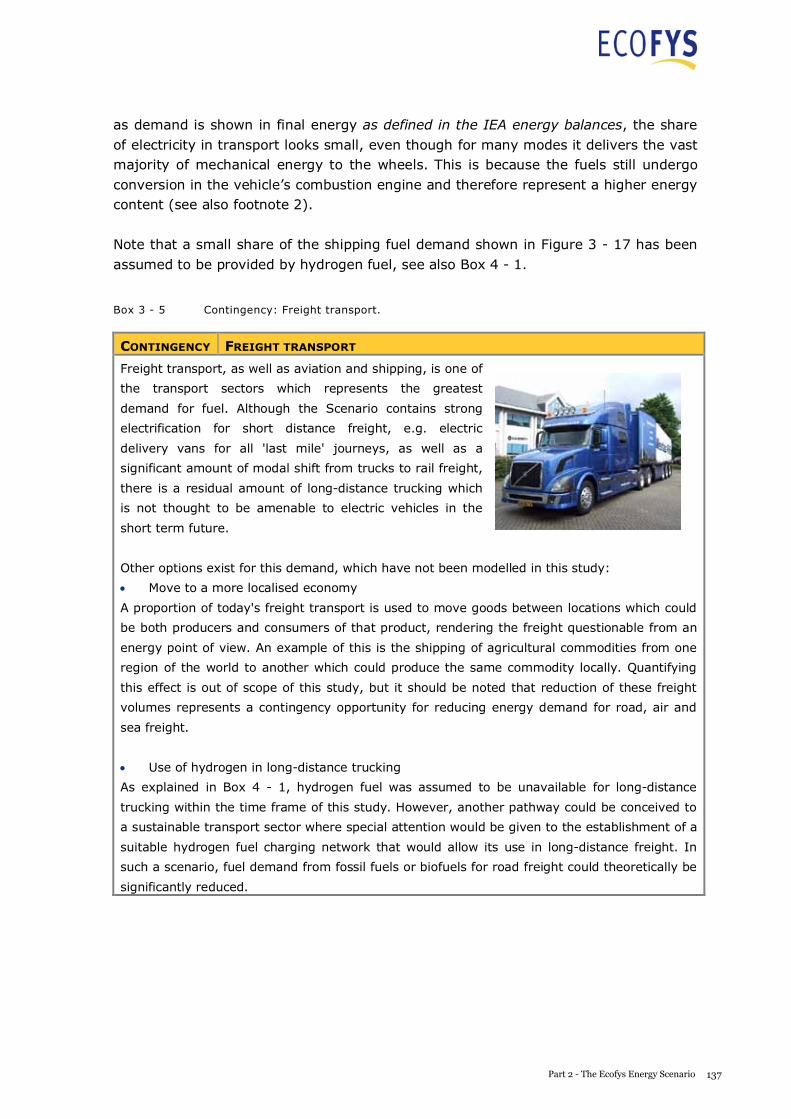
A S USTAI NABLE E NERGY S UPPLY F OR EVERY ONE
as demand is shown in final energy as defined in the IEA energy balances, the share of electricity in transport looks small, even though for many modes it delivers the vast majority of mechanical energy to the wheels. This is because the fuels still undergo conversion in the vehicle’s combustion engine and therefore represent a higher energy content (see also footnote 2).
Note that a small share of the shipping fuel demand shown in Figure 3 - 17 has been assumed to be provided by hydrogen fuel, see also Box 4 - 1.
Box 3 - 5 Contingency: Freight transport.
CONTINGENCY FREIGHT TRANSPORT
Freight transport, as well as aviation and shipping, is one of
the transport sectors which represents the greatest
demand for fuel. Although the Scenario contains strong
electrification for short distance freight, e.g. electric
delivery vans for all 'last mile' journeys, as well as a
significant amount of modal shift from trucks to rail freight,
there is a residual amount of long-distance trucking which
is not thought to be amenable to electric vehicles in the
short term future.
Other options exist for this demand, which have not been modelled in this study:
Move to a more localised economy
A proportion of today's freight transport is used to move goods between locations which could
be both producers and consumers of that product, rendering the freight questionable from an
energy point of view. An example of this is the shipping of agricultural commodities from one
region of the world to another which could produce the same commodity locally. Quantifying
this effect is out of scope of this study, but it should be noted that reduction of these freight
volumes represents a contingency opportunity for reducing energy demand for road, air and
sea freight.
Use of hydrogen in long-distance trucking
As explained in Box 4 - 1, hydrogen fuel was assumed to be unavailable for long-distance
trucking within the time frame of this study. However, another pathway could be conceived to
a sustainable transport sector where special attention would be given to the establishment of a
suitable hydrogen fuel charging network that would allow its use in long-distance freight. In
such a scenario, fuel demand from fossil fuels or biofuels for road freight could theoretically be
significantly reduced.
137Part 2 - The Ecofys Energy Scenario

A S USTAI NABLE E NERGY S UPPLY F OR EVERY ONE
4 Supply – Renewable energy (excl. bioenergy)
4.1 Overall results
The assumptions detailed in Section 3 for the demand side lead to: A much reduced demand overall compared to ‘business-as-usual’ (BAU) A higher electrification rate
The resulting overall demand split is presented in Figure 4 - 1. Note in particular that the demand for power rises steadily from just below 60 EJ/a to over 120 EJ/a. In contrast, heat and fuel demand grow at first, before reducing drastically in later years23.
In the next step, this demand must be matched with energy supply. In accordance with the approach (see Section 2), this is done in the following order: 1 Where available, non-bioenergy renewable options are used first 2 If demand cannot be fully satisfied, bioenergy is used up to the sustainably
available potential in that year (see Section 5) 3 All residual demand is supplied by conventional source, such as fossil and nuclear
energy.
0
50
100
150
200
250
300
350
400
2000 2010 2020 2030 2040 2050
Final
ener
gy
(EJ/
a)
Fuel - NonReplac.Foss.
Fuel - Industry
Fuel - Aviation
Fuel - Shipping
Fuel - Road/Rail
Heat - Low T
Heat - High T
Electricity
Figure 4 - 1 Global energy demand in all sectors, split by energy carrier.
23 Note that the share of electricity looks small in comparison to, e.g. transport fuels, since these still have to undergo conversion at a comparatively lower efficiency to generate mechanical energy for the wheels.
138A Sustainable Energy Supply for Everyone
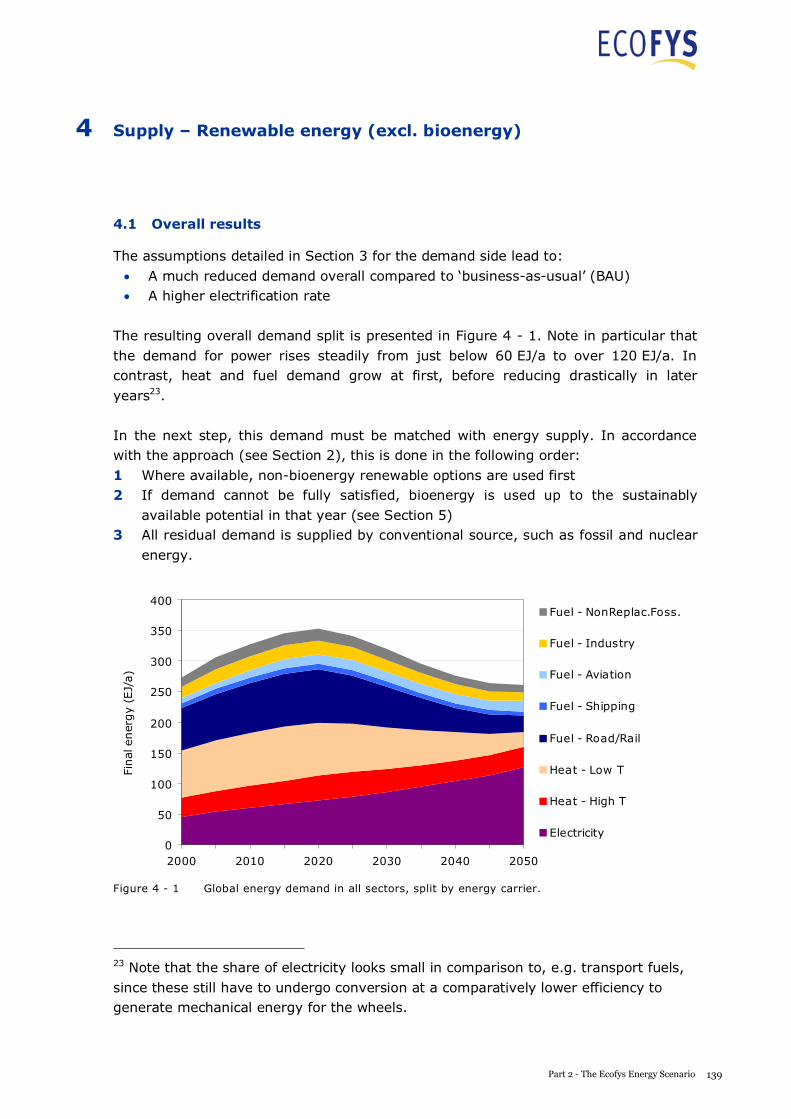
A S USTAI NABLE E NERGY S UPPLY F OR EVERY ONE
4 Supply – Renewable energy (excl. bioenergy)
4.1 Overall results
The assumptions detailed in Section 3 for the demand side lead to: A much reduced demand overall compared to ‘business-as-usual’ (BAU) A higher electrification rate
The resulting overall demand split is presented in Figure 4 - 1. Note in particular that the demand for power rises steadily from just below 60 EJ/a to over 120 EJ/a. In contrast, heat and fuel demand grow at first, before reducing drastically in later years23.
In the next step, this demand must be matched with energy supply. In accordance with the approach (see Section 2), this is done in the following order: 1 Where available, non-bioenergy renewable options are used first 2 If demand cannot be fully satisfied, bioenergy is used up to the sustainably
available potential in that year (see Section 5) 3 All residual demand is supplied by conventional source, such as fossil and nuclear
energy.
0
50
100
150
200
250
300
350
400
2000 2010 2020 2030 2040 2050
Final
ener
gy
(EJ/
a)
Fuel - NonReplac.Foss.
Fuel - Industry
Fuel - Aviation
Fuel - Shipping
Fuel - Road/Rail
Heat - Low T
Heat - High T
Electricity
Figure 4 - 1 Global energy demand in all sectors, split by energy carrier.
23 Note that the share of electricity looks small in comparison to, e.g. transport fuels, since these still have to undergo conversion at a comparatively lower efficiency to generate mechanical energy for the wheels.
139Part 2 - The Ecofys Energy Scenario
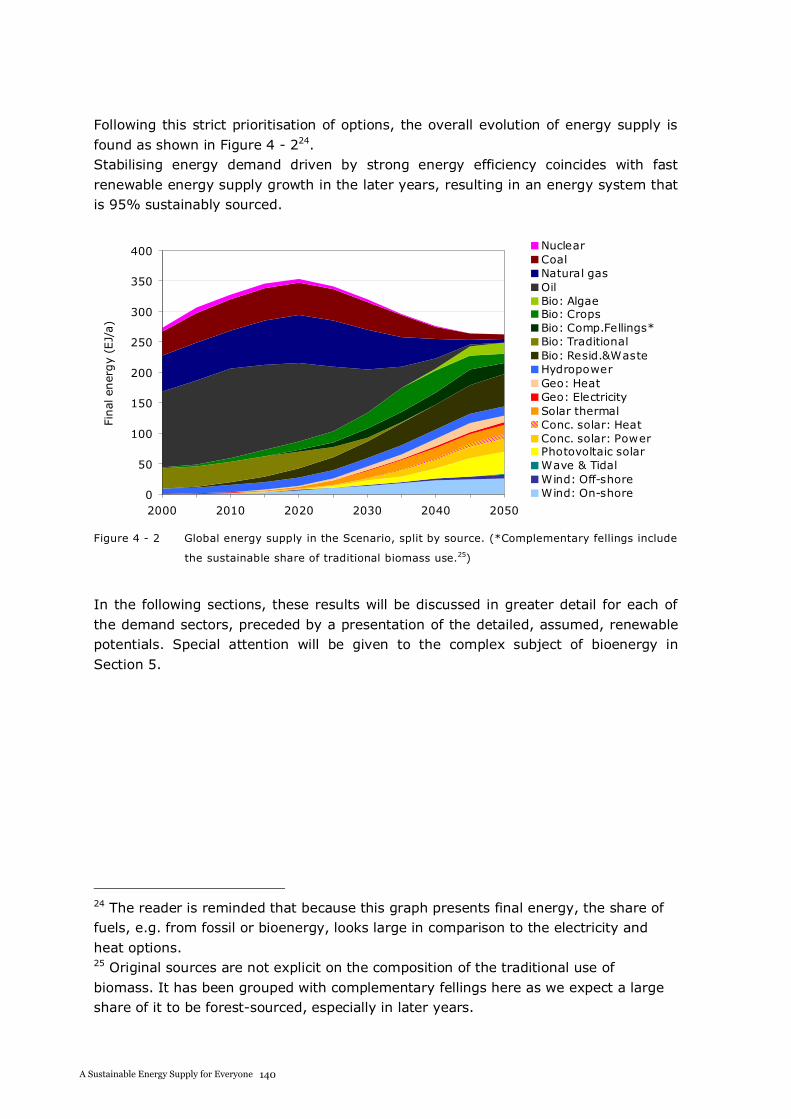
A S USTAI NABLE E NERGY S UPPLY F OR EVERY ONE
Following this strict prioritisation of options, the overall evolution of energy supply is found as shown in Figure 4 - 224.Stabilising energy demand driven by strong energy efficiency coincides with fast renewable energy supply growth in the later years, resulting in an energy system that is 95% sustainably sourced.
0
50
100
150
200
250
300
350
400
2000 2010 2020 2030 2040 2050
Final
ener
gy
(EJ/
a)
NuclearCoalNatural gasOilBio: AlgaeBio: CropsBio: Comp.Fellings*Bio: TraditionalBio: Resid.&WasteHydropowerGeo: HeatGeo: ElectricitySolar thermalConc. solar: HeatConc. solar: PowerPhotovoltaic solarWave & TidalWind: Off-shoreWind: On-shore
Figure 4 - 2 Global energy supply in the Scenario, split by source. (*Complementary fellings include
the sustainable share of traditional biomass use.25)
In the following sections, these results will be discussed in greater detail for each of the demand sectors, preceded by a presentation of the detailed, assumed, renewable potentials. Special attention will be given to the complex subject of bioenergy in Section 5.
24 The reader is reminded that because this graph presents final energy, the share of fuels, e.g. from fossil or bioenergy, looks large in comparison to the electricity and heat options. 25 Original sources are not explicit on the composition of the traditional use of biomass. It has been grouped with complementary fellings here as we expect a large share of it to be forest-sourced, especially in later years.
A S USTAI NABLE E NERGY S UPPLY F OR EVERY ONE
Box 4 - 1 Story: The role of hydrogen fuel in the Energy Scenario.
STORY THE ROLE OF HYDROGEN FUEL IN THE ENERGY SCENARIO
Hydrogen fuel presents a number of benefits which allow it to play
a bridging role in this Scenario:
It is a fuel, and could therefore lighten the demand for
renewable fuels and/or high temperature heat for which only
very few sustainable options exist.
It can be fully sustainable, e.g. if generated via electrolysis
from renewable power sources.
If generated from renewable sources in this way, it can also
function as a storage medium for renewable power, i.e. storing
electricity generated by the supply-driven power sources in
times of overproduction.
In addition to these benefits however, a few challenges do exist:
There is no existing transport network for hydrogen fuel. This would mean that wholesale
installation of a new type of charging infrastructure would be required to make hydrogen
fuel available to distributed transport users, such as passenger cars
Hydrogen has a lower energy density than conventional fuels, and a lower mass density
even at high pressures, making it bulky to store and transport
Converting electricity to hydrogen and then back to electricity is considerably less efficient
than using the original electricity directly.
For the reasons above, the Scenario uses hydrogen primarily in applications where:
Journeys are between load centres or use is directly near production sites so that the
demand could easily be integrated with a new renewable power network (i.e. not used in
passenger transport, but suitable for central industrial installations)
The time / distance between charging stations is small (e.g. only used in a fraction of
short distance shipping and not assumed to be suitable for road transport)
In addition to displacing fuel and heat demand, some hydrogen is required in the production of
N fertiliser to obtain sustainable nutrients for the production of biomass for sustainable
bioenergy.
In total, 9 EJ of additional electricity demand is used in 2050 to
Displace ~5 EJ of industrial fuels and heat, primarily in chemical, aluminium and
cement production
Displace ~0.5 EJ of shipping fuel
Supply 3.5 EJ of electricity to produce fertiliser through hydrogen
140A Sustainable Energy Supply for Everyone
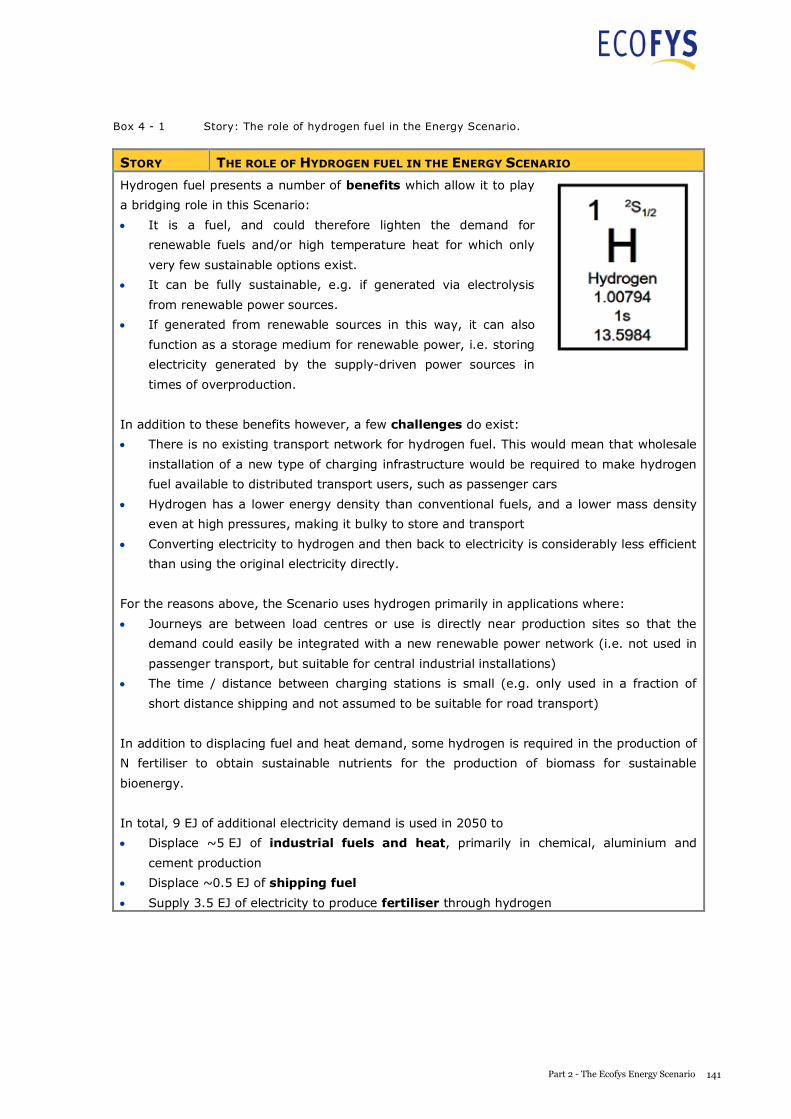
A S USTAI NABLE E NERGY S UPPLY F OR EVERY ONE
Box 4 - 1 Story: The role of hydrogen fuel in the Energy Scenario.
STORY THE ROLE OF HYDROGEN FUEL IN THE ENERGY SCENARIO
Hydrogen fuel presents a number of benefits which allow it to play
a bridging role in this Scenario:
It is a fuel, and could therefore lighten the demand for
renewable fuels and/or high temperature heat for which only
very few sustainable options exist.
It can be fully sustainable, e.g. if generated via electrolysis
from renewable power sources.
If generated from renewable sources in this way, it can also
function as a storage medium for renewable power, i.e. storing
electricity generated by the supply-driven power sources in
times of overproduction.
In addition to these benefits however, a few challenges do exist:
There is no existing transport network for hydrogen fuel. This would mean that wholesale
installation of a new type of charging infrastructure would be required to make hydrogen
fuel available to distributed transport users, such as passenger cars
Hydrogen has a lower energy density than conventional fuels, and a lower mass density
even at high pressures, making it bulky to store and transport
Converting electricity to hydrogen and then back to electricity is considerably less efficient
than using the original electricity directly.
For the reasons above, the Scenario uses hydrogen primarily in applications where:
Journeys are between load centres or use is directly near production sites so that the
demand could easily be integrated with a new renewable power network (i.e. not used in
passenger transport, but suitable for central industrial installations)
The time / distance between charging stations is small (e.g. only used in a fraction of
short distance shipping and not assumed to be suitable for road transport)
In addition to displacing fuel and heat demand, some hydrogen is required in the production of
N fertiliser to obtain sustainable nutrients for the production of biomass for sustainable
bioenergy.
In total, 9 EJ of additional electricity demand is used in 2050 to
Displace ~5 EJ of industrial fuels and heat, primarily in chemical, aluminium and
cement production
Displace ~0.5 EJ of shipping fuel
Supply 3.5 EJ of electricity to produce fertiliser through hydrogen
141Part 2 - The Ecofys Energy Scenario
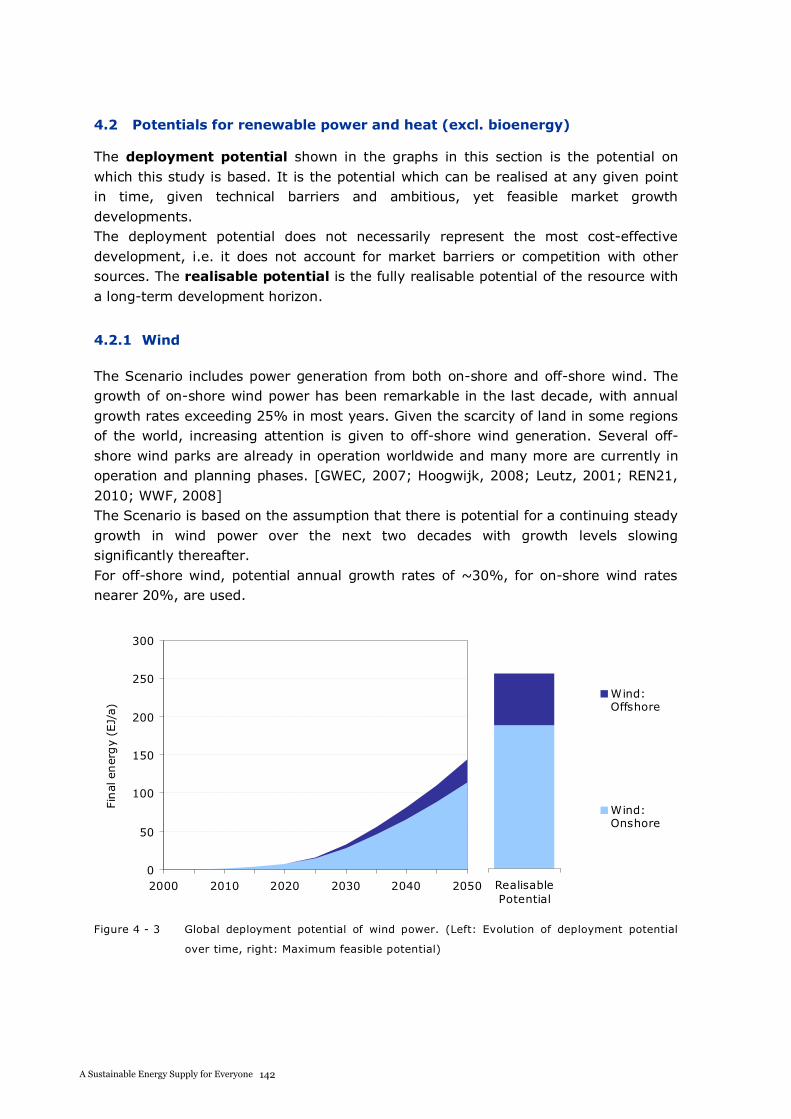
A S USTAI NABLE E NERGY S UPPLY F OR EVERY ONE
4.2 Potentials for renewable power and heat (excl. bioenergy)
The deployment potential shown in the graphs in this section is the potential on which this study is based. It is the potential which can be realised at any given point in time, given technical barriers and ambitious, yet feasible market growth developments. The deployment potential does not necessarily represent the most cost-effective development, i.e. it does not account for market barriers or competition with other sources. The realisable potential is the fully realisable potential of the resource with a long-term development horizon.
4.2.1 Wind
The Scenario includes power generation from both on-shore and off-shore wind. The growth of on-shore wind power has been remarkable in the last decade, with annual growth rates exceeding 25% in most years. Given the scarcity of land in some regions of the world, increasing attention is given to off-shore wind generation. Several off-shore wind parks are already in operation worldwide and many more are currently in operation and planning phases. [GWEC, 2007; Hoogwijk, 2008; Leutz, 2001; REN21, 2010; WWF, 2008] The Scenario is based on the assumption that there is potential for a continuing steady growth in wind power over the next two decades with growth levels slowing significantly thereafter. For off-shore wind, potential annual growth rates of ~30%, for on-shore wind rates nearer 20%, are used.
0
50
100
150
200
250
300
2000 2010 2020 2030 2040 2050
Fin
alen
ergy
(EJ/
a)
Wind:Offshore
Wind:Onshore
RealisablePotential
Figure 4 - 3 Global deployment potential of wind power. (Left: Evolution of deployment potential
over time, right: Maximum feasible potential)
142A Sustainable Energy Supply for Everyone
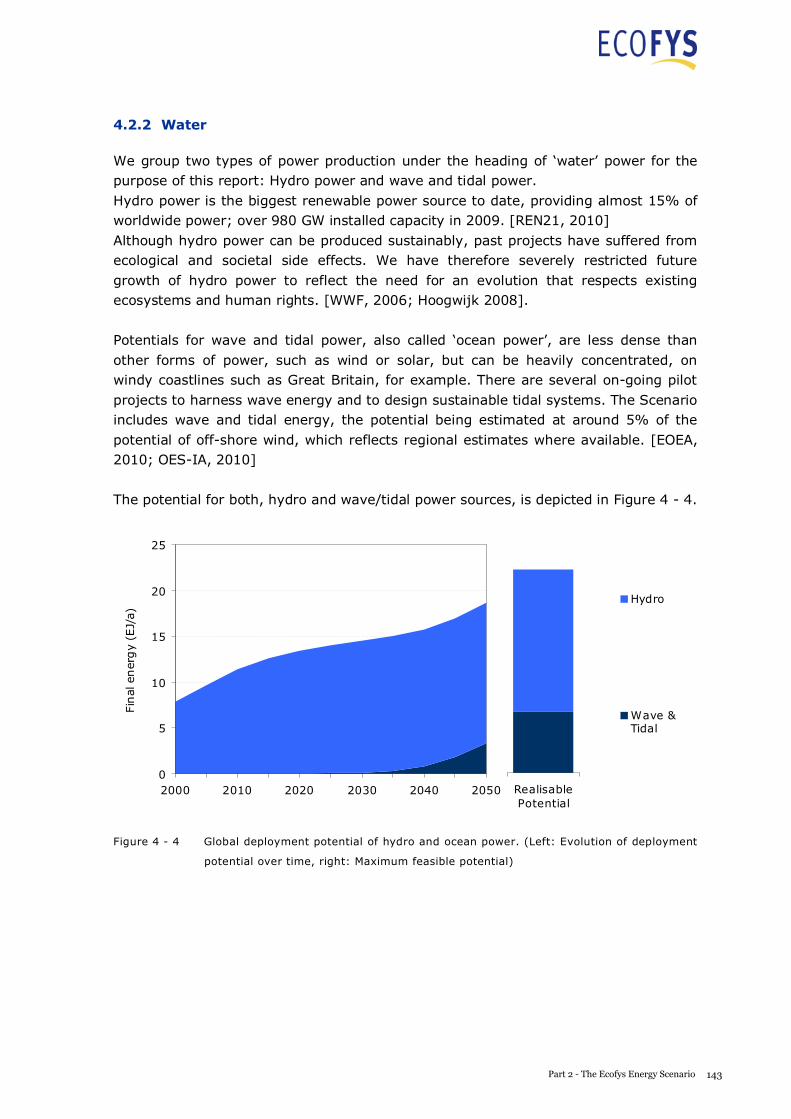
A S USTAI NABLE E NERGY S UPPLY F OR EVERY ONE
4.2.2 Water
We group two types of power production under the heading of ‘water’ power for the purpose of this report: Hydro power and wave and tidal power. Hydro power is the biggest renewable power source to date, providing almost 15% of worldwide power; over 980 GW installed capacity in 2009. [REN21, 2010] Although hydro power can be produced sustainably, past projects have suffered from ecological and societal side effects. We have therefore severely restricted future growth of hydro power to reflect the need for an evolution that respects existing ecosystems and human rights. [WWF, 2006; Hoogwijk 2008].
Potentials for wave and tidal power, also called ‘ocean power’, are less dense than other forms of power, such as wind or solar, but can be heavily concentrated, on windy coastlines such as Great Britain, for example. There are several on-going pilot projects to harness wave energy and to design sustainable tidal systems. The Scenario includes wave and tidal energy, the potential being estimated at around 5% of the potential of off-shore wind, which reflects regional estimates where available. [EOEA, 2010; OES-IA, 2010]
The potential for both, hydro and wave/tidal power sources, is depicted in Figure 4 - 4.
0
5
10
15
20
25
2000 2010 2020 2030 2040 2050
Fin
alen
ergy
(EJ/
a)
Hydro
Wave &Tidal
RealisablePotential
Figure 4 - 4 Global deployment potential of hydro and ocean power. (Left: Evolution of deployment
potential over time, right: Maximum feasible potential)
143Part 2 - The Ecofys Energy Scenario
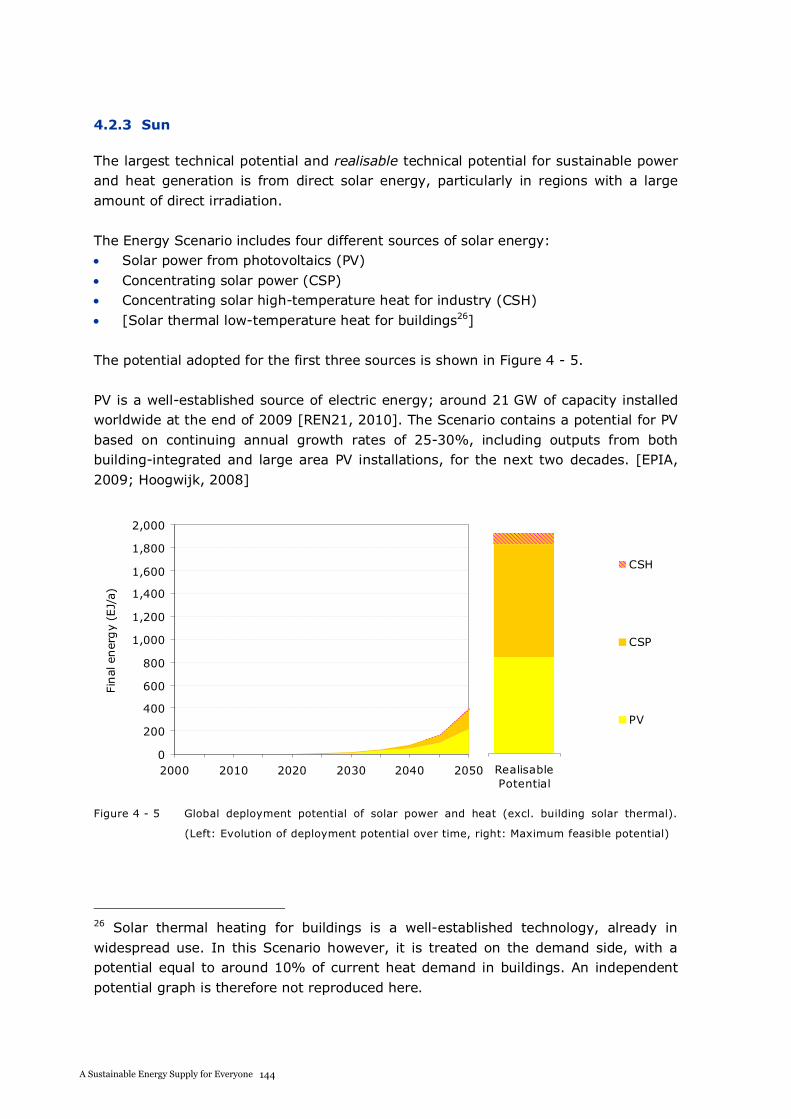
A S USTAI NABLE E NERGY S UPPLY F OR EVERY ONE
4.2.3 Sun
The largest technical potential and realisable technical potential for sustainable power and heat generation is from direct solar energy, particularly in regions with a large amount of direct irradiation.
The Energy Scenario includes four different sources of solar energy: Solar power from photovoltaics (PV) Concentrating solar power (CSP) Concentrating solar high-temperature heat for industry (CSH) [Solar thermal low-temperature heat for buildings26]
The potential adopted for the first three sources is shown in Figure 4 - 5.
PV is a well-established source of electric energy; around 21 GW of capacity installed worldwide at the end of 2009 [REN21, 2010]. The Scenario contains a potential for PV based on continuing annual growth rates of 25-30%, including outputs from both building-integrated and large area PV installations, for the next two decades. [EPIA, 2009; Hoogwijk, 2008]
RealisablePotential
0
200
400
600
800
1,000
1,200
1,400
1,600
1,800
2,000
2000 2010 2020 2030 2040 2050
Fin
alen
ergy
(EJ/
a)
CSH
CSP
PV
Figure 4 - 5 Global deployment potential of solar power and heat (excl. building solar thermal).
(Left: Evolution of deployment potential over time, right: Maximum feasible potential)
26 Solar thermal heating for buildings is a well-established technology, already in widespread use. In this Scenario however, it is treated on the demand side, with a potential equal to around 10% of current heat demand in buildings. An independent potential graph is therefore not reproduced here.
A S USTAI NABLE E NERGY S UPPLY F OR EVERY ONE
With increasing storage times, CSP is attracting attention for its potential to provide power on demand, even after dark. Systems with up to 15 hours of storage are now at the design stage. Although still in infancy, the expectations for CSP are large and the Scenario is therefore based upon the assumption that the coming decades will witness a strong penetration of this technology into the market, with possible growth rates of approximately 20%.
CSH, concentrating solar heat, would enable industrial installations to directly utilise the high temperatures generated by concentrated solar farms. This technology is not yet on the market and is therefore only included at a very small potential in this study, at around a tenth of the potential of CSP27.
4.2.4 Earth
Geothermal energy from the high temperatures found below the earth’s surface can be used directly (‘direct use’) to produce building heat. At sufficiently high temperatures, it can also be used for power generation and/or process heat. Geothermal energy has been exploited for many years, with around 10GW of power production capacity installed worldwide at the end of 2007. Given the lack of attention given to this option in the past and its enormous potential to supply demand-driven renewable power, the Scenario is based on the premise that the current 5% annual growth rate could potentially be doubled to reach the levels of other renewable power options. The potential for geothermal energy in the Scenario is shown in Figure 4 - 6.
0
10
20
30
40
50
60
2000 2010 2020 2030 2040 2050
Fin
alen
ergy
(EJ/
a)
Geo: Low T
Geo: High T
Geo:Electricity
RealisablePotential
Figure 4 - 6 Global deployment potential of geothermal energy. (Left: Evolution of deployment
potential over time, right: Maximum feasible potential)
27This is a conservative assumption. Further study on the distribution of the industrial heat demand and the availability of near-by CSH sources is recommended.
144A Sustainable Energy Supply for Everyone
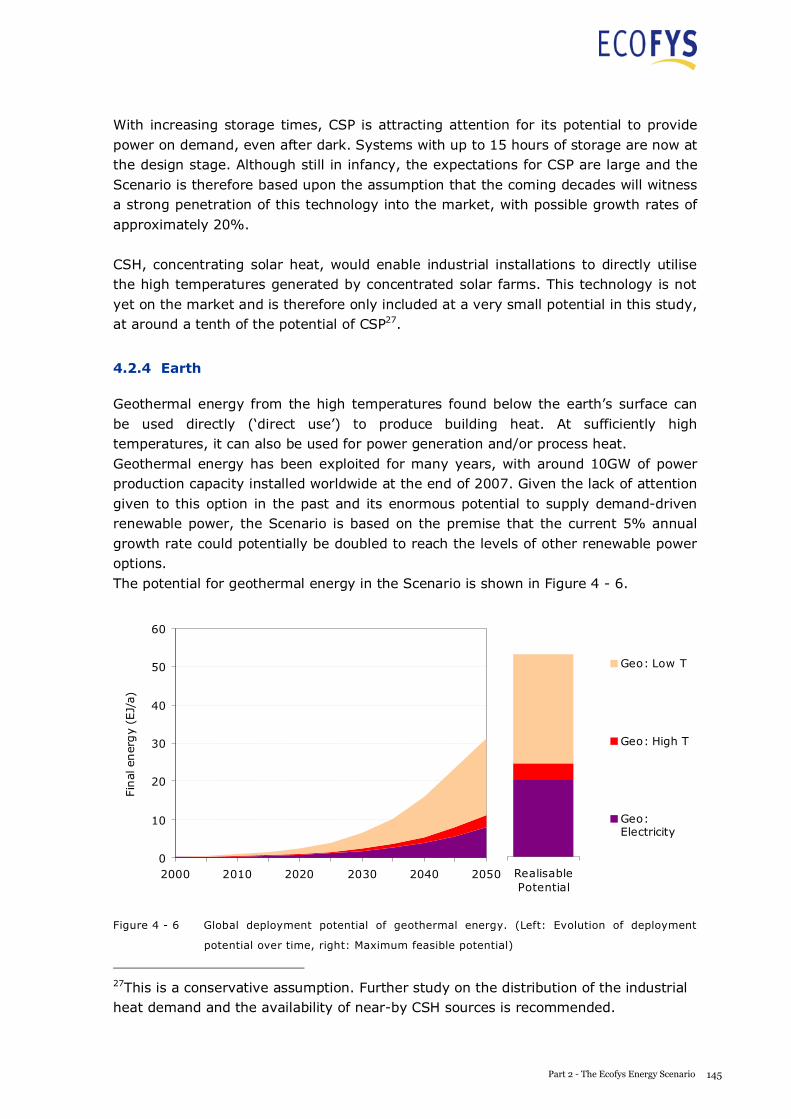
A S USTAI NABLE E NERGY S UPPLY F OR EVERY ONE
With increasing storage times, CSP is attracting attention for its potential to provide power on demand, even after dark. Systems with up to 15 hours of storage are now at the design stage. Although still in infancy, the expectations for CSP are large and the Scenario is therefore based upon the assumption that the coming decades will witness a strong penetration of this technology into the market, with possible growth rates of approximately 20%.
CSH, concentrating solar heat, would enable industrial installations to directly utilise the high temperatures generated by concentrated solar farms. This technology is not yet on the market and is therefore only included at a very small potential in this study, at around a tenth of the potential of CSP27.
4.2.4 Earth
Geothermal energy from the high temperatures found below the earth’s surface can be used directly (‘direct use’) to produce building heat. At sufficiently high temperatures, it can also be used for power generation and/or process heat. Geothermal energy has been exploited for many years, with around 10GW of power production capacity installed worldwide at the end of 2007. Given the lack of attention given to this option in the past and its enormous potential to supply demand-driven renewable power, the Scenario is based on the premise that the current 5% annual growth rate could potentially be doubled to reach the levels of other renewable power options. The potential for geothermal energy in the Scenario is shown in Figure 4 - 6.
0
10
20
30
40
50
60
2000 2010 2020 2030 2040 2050
Fin
alen
ergy
(EJ/
a)
Geo: Low T
Geo: High T
Geo:Electricity
RealisablePotential
Figure 4 - 6 Global deployment potential of geothermal energy. (Left: Evolution of deployment
potential over time, right: Maximum feasible potential)
27This is a conservative assumption. Further study on the distribution of the industrial heat demand and the availability of near-by CSH sources is recommended.
145Part 2 - The Ecofys Energy Scenario
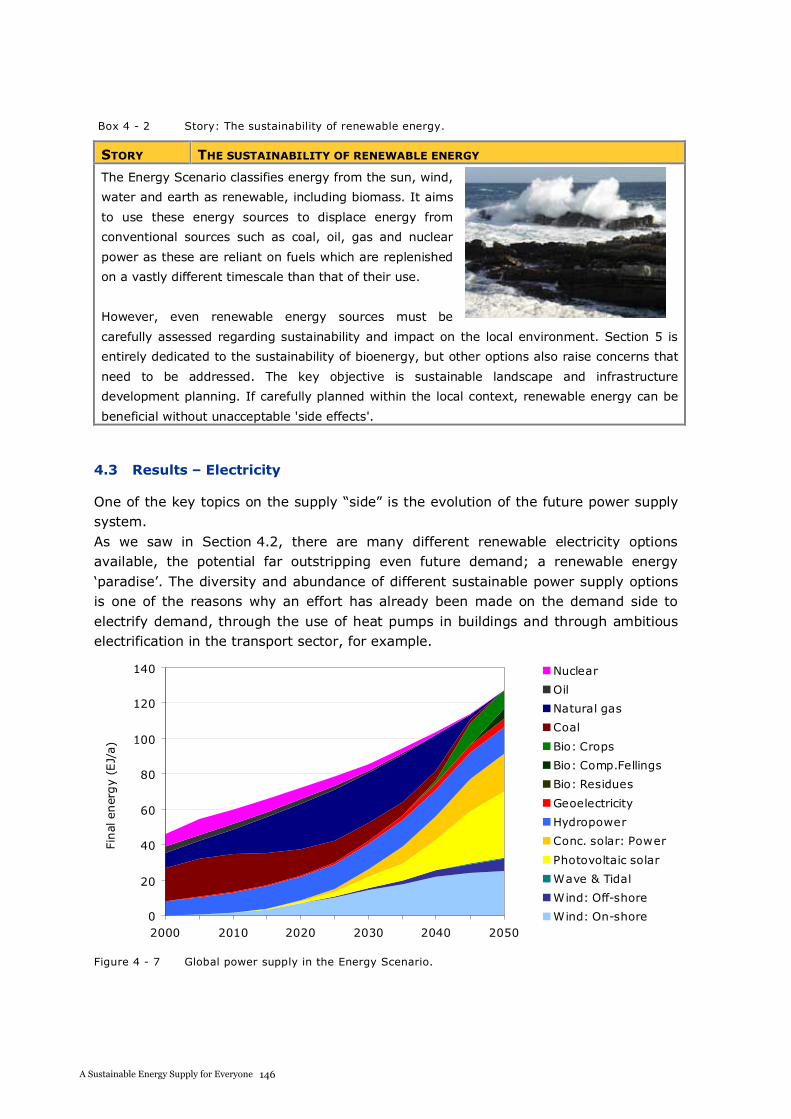
A S USTAI NABLE E NERGY S UPPLY F OR EVERY ONE
Box 4 - 2 Story: The sustainability of renewable energy.
STORY THE SUSTAINABILITY OF RENEWABLE ENERGY
The Energy Scenario classifies energy from the sun, wind,
water and earth as renewable, including biomass. It aims
to use these energy sources to displace energy from
conventional sources such as coal, oil, gas and nuclear
power as these are reliant on fuels which are replenished
on a vastly different timescale than that of their use.
However, even renewable energy sources must be
carefully assessed regarding sustainability and impact on the local environment. Section 5 is
entirely dedicated to the sustainability of bioenergy, but other options also raise concerns that
need to be addressed. The key objective is sustainable landscape and infrastructure
development planning. If carefully planned within the local context, renewable energy can be
beneficial without unacceptable 'side effects'.
4.3 Results – Electricity
One of the key topics on the supply “side” is the evolution of the future power supply system. As we saw in Section 4.2, there are many different renewable electricity options available, the potential far outstripping even future demand; a renewable energy ‘paradise’. The diversity and abundance of different sustainable power supply options is one of the reasons why an effort has already been made on the demand side to electrify demand, through the use of heat pumps in buildings and through ambitious electrification in the transport sector, for example.
0
20
40
60
80
100
120
140
2000 2010 2020 2030 2040 2050
Final
ener
gy
(EJ/
a)
Nuclear
Oil
Natural gas
Coal
Bio: Crops
Bio: Comp.Fellings
Bio: Residues
Geoelectricity
Hydropower
Conc. solar: Power
Photovoltaic solar
Wave & Tidal
Wind: Off-shore
Wind: On-shore
Figure 4 - 7 Global power supply in the Energy Scenario.
146A Sustainable Energy Supply for Everyone
A S USTAI NABLE E NERGY S UPPLY F OR EVERY ONE
Figure 4 - 7 shows how much of the available renewable power is actually used in the Scenario, given the evolution of power demand.
Box 4 - 3 Story: Supply- versus demand-driven electricity sources.
STORY SUPPLY- VERSUS DEMAND-DRIVEN ELECTRICITY SOURCES
The electricity supply system is rapidly changing. Only a few decades ago, it consisted of large,
centrally dispatched fossil or nuclear power plants. Capital-intensive nuclear or coal-fired
power plants with low operational costs were employed to cover the ‘base load’, the level of
power always required, even at night. This guaranteed long operating hours, enabling the high
investments for these plants to be recovered. Natural gas-fired “peak load” plants, with lower
capital investments but higher running costs, were employed to cover the additional load
during daytime.
The electricity supply system is becoming an increasingly
dynamic marketplace to which many different suppliers can
supply varying amounts of energy, and where parts of the
demand can even be controlled to arrive at an optimal
balance of supply and demand. Most power plants will have a
variable output; there is no longer a ‘base load’. For
instance, a growing amount of wind power is available at
practically zero marginal cost during hours of high wind speed, which may sometimes coincide
with (night-time) hours of low demand. Even if a former, “base load” power plant finds a
customer for its power during such periods, it will not earn back its investment during those
hours, due to low power prices (close to marginal cost).
For the Scenario, we discern between ‘supply-driven’ sources, which deliver power at zero
marginal cost when the natural resource (sun, wind, water) is present and ‘demand-driven’
sources, which can be operated independently at variable levels. With the correct combination
of sources, and adequate grid coupling over large geographical areas, it will be possible to
reliably provide the required amount of electricity at all times. Increasing the fraction of
supply-driven sources, and the electrical ‘balancing’ provided by the demand-driven sources,
create substantial technical challenges and will require a strong R&D effort.
In addition to the careful balancing of demand and supply, there is a further constraint on the power system in this Scenario: The amount of supply-driven28 power sources is constrained to a ceiling, given in a percentage of total electricity demand, to reflect the fact that a certain amount of balancing, or demand-driven sources are required to ensure continuous supply. See Table 4 - 1 for the classification of sources.
28 Supply-driven power options are those sources whose generation at any given hour depends on the availability of the energy source, e.g. wind power, photovoltaic power or ocean power. Demand-driven power options are those options which can be more easily tailored to demand, such as geothermal electricity, hydro power, CSP with storage and electricity from biomass.
147Part 2 - The Ecofys Energy Scenario
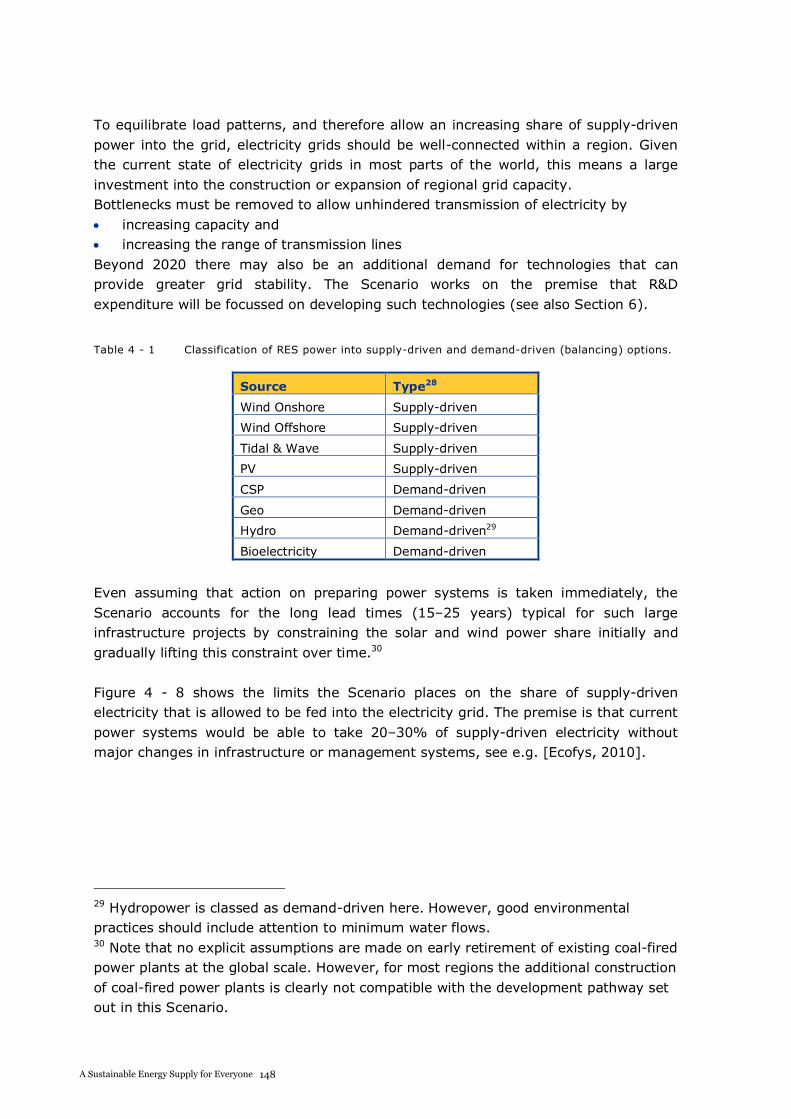
A S USTAI NABLE E NERGY S UPPLY F OR EVERY ONE
To equilibrate load patterns, and therefore allow an increasing share of supply-driven power into the grid, electricity grids should be well-connected within a region. Given the current state of electricity grids in most parts of the world, this means a large investment into the construction or expansion of regional grid capacity. Bottlenecks must be removed to allow unhindered transmission of electricity by
increasing capacity and increasing the range of transmission lines
Beyond 2020 there may also be an additional demand for technologies that can provide greater grid stability. The Scenario works on the premise that R&D expenditure will be focussed on developing such technologies (see also Section 6).
Table 4 - 1 Classification of RES power into supply-driven and demand-driven (balancing) options.
Source Type28
Wind Onshore Supply-driven
Wind Offshore Supply-driven
Tidal & Wave Supply-driven
PV Supply-driven
CSP Demand-driven
Geo Demand-driven
Hydro Demand-driven29
Bioelectricity Demand-driven
Even assuming that action on preparing power systems is taken immediately, the Scenario accounts for the long lead times (15–25 years) typical for such large infrastructure projects by constraining the solar and wind power share initially and gradually lifting this constraint over time.30
Figure 4 - 8 shows the limits the Scenario places on the share of supply-driven electricity that is allowed to be fed into the electricity grid. The premise is that current power systems would be able to take 20–30% of supply-driven electricity without major changes in infrastructure or management systems, see e.g. [Ecofys, 2010].
29 Hydropower is classed as demand-driven here. However, good environmental practices should include attention to minimum water flows. 30 Note that no explicit assumptions are made on early retirement of existing coal-fired power plants at the global scale. However, for most regions the additional construction of coal-fired power plants is clearly not compatible with the development pathway set out in this Scenario.
A S USTAI NABLE E NERGY S UPPLY F OR EVERY ONE
0%
10%
20%
30%
40%
50%
60%
70%
80%
90%
100%
2000 2010 2020 2030 2040 2050Max
imum
shar
eof
pow
erfr
omsu
pply
-drive
nso
urc
es
Figure 4 - 8 Constraint placed on PV and wind power due to grid limits. Range represents
differences across regions.
For greater penetrations of renewable energy, only limited analysis is available. Based on a number of studies [Blok, 1984; Sørensen, 2004; ECF Roadmap, 2010] we expect that the limiting share could rise to 60% by 2050 for all regions, provided that electricity systems are re-designed to offer much more flexibility than they do today. This requires that full use is being made of all the following levers:
Grid capacity improvements to remove bottlenecks and increase transmission capacities. Demand side management, particularly for wholesale customers, but also at individual consumer level Storage, in the form of pumped hydro31, centralised hydrogen storage, and heat storage Remaining excesses of renewable electricity can be converted to hydrogen for use as a fuel in specific applications (see Box 4 - 1).
It must be noted here that the Scenario merely places the limits mentioned above, on the energy system, in essence postulating that power systems will be able to evolve in such a way as to allow these assumptions to be valid. To assess exactly how this could
31 Energy may be stored in hydropower reservoirs, either through balancing of natural inflows with generation-determined outflows, or through pumps that use electricity in off-peak hours to refill the reservoir. All hydropower infrastructure has potentially significant environmental and social impacts. Attention must be paid to downstream flows, as peaking operations can impact on natural habitats and human use of rivers. Through smart choices for locations, designs and operating regimes, such impacts can be avoided, minimised, mitigated or compensated, in accordance with existing internationally agreed sustainability criteria.
148A Sustainable Energy Supply for Everyone
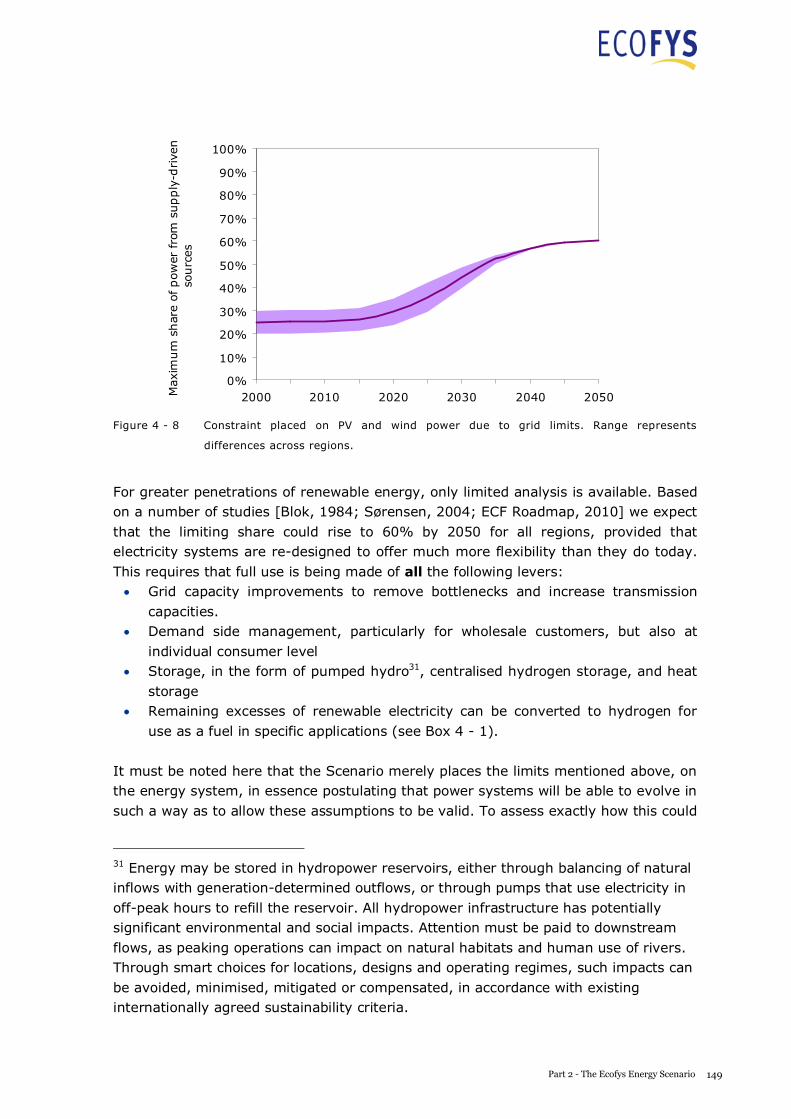
A S USTAI NABLE E NERGY S UPPLY F OR EVERY ONE
0%
10%
20%
30%
40%
50%
60%
70%
80%
90%
100%
2000 2010 2020 2030 2040 2050Max
imum
shar
eof
pow
erfr
omsu
pply
-drive
nso
urc
es
Figure 4 - 8 Constraint placed on PV and wind power due to grid limits. Range represents
differences across regions.
For greater penetrations of renewable energy, only limited analysis is available. Based on a number of studies [Blok, 1984; Sørensen, 2004; ECF Roadmap, 2010] we expect that the limiting share could rise to 60% by 2050 for all regions, provided that electricity systems are re-designed to offer much more flexibility than they do today. This requires that full use is being made of all the following levers:
Grid capacity improvements to remove bottlenecks and increase transmission capacities. Demand side management, particularly for wholesale customers, but also at individual consumer level Storage, in the form of pumped hydro31, centralised hydrogen storage, and heat storage Remaining excesses of renewable electricity can be converted to hydrogen for use as a fuel in specific applications (see Box 4 - 1).
It must be noted here that the Scenario merely places the limits mentioned above, on the energy system, in essence postulating that power systems will be able to evolve in such a way as to allow these assumptions to be valid. To assess exactly how this could
31 Energy may be stored in hydropower reservoirs, either through balancing of natural inflows with generation-determined outflows, or through pumps that use electricity in off-peak hours to refill the reservoir. All hydropower infrastructure has potentially significant environmental and social impacts. Attention must be paid to downstream flows, as peaking operations can impact on natural habitats and human use of rivers. Through smart choices for locations, designs and operating regimes, such impacts can be avoided, minimised, mitigated or compensated, in accordance with existing internationally agreed sustainability criteria.
149Part 2 - The Ecofys Energy Scenario
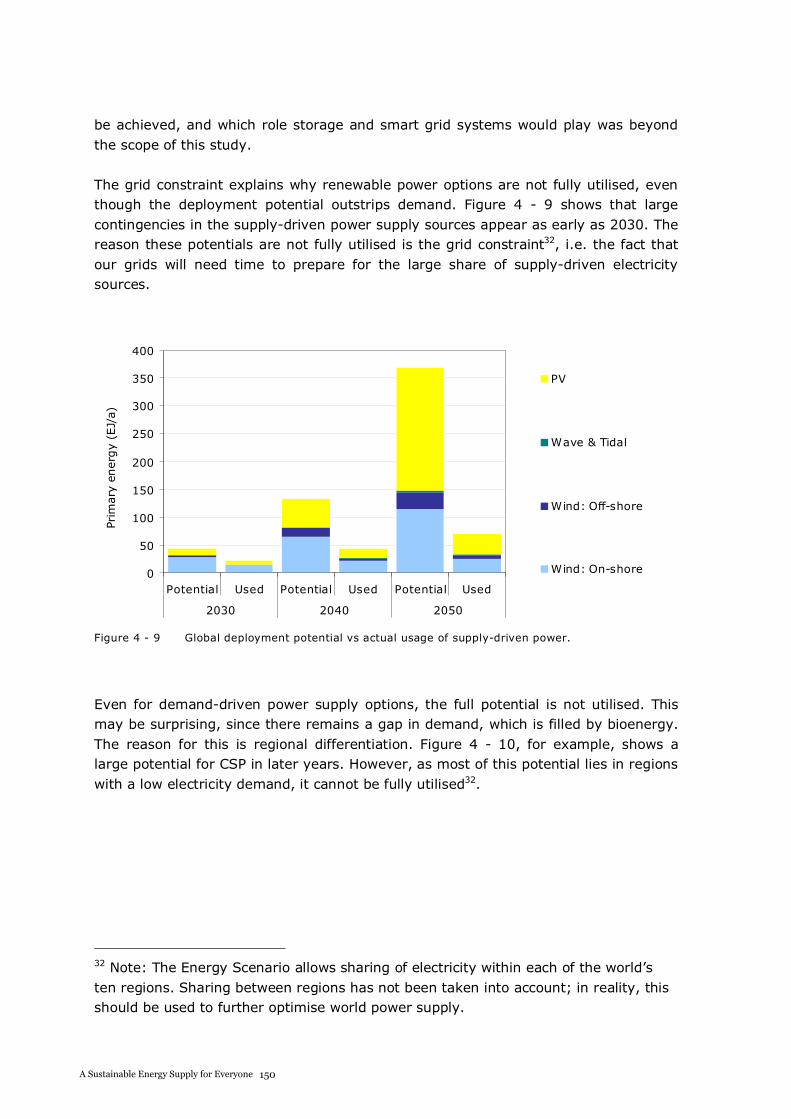
A S USTAI NABLE E NERGY S UPPLY F OR EVERY ONE
be achieved, and which role storage and smart grid systems would play was beyond the scope of this study.
The grid constraint explains why renewable power options are not fully utilised, even though the deployment potential outstrips demand. Figure 4 - 9 shows that large contingencies in the supply-driven power supply sources appear as early as 2030. The reason these potentials are not fully utilised is the grid constraint32, i.e. the fact that our grids will need time to prepare for the large share of supply-driven electricity sources.
0
50
100
150
200
250
300
350
400
Potential Used Potential Used Potential Used
2030 2040 2050
Prim
ary
energ
y(E
J/a)
PV
Wave & Tidal
Wind: Off-shore
Wind: On-shore
Figure 4 - 9 Global deployment potential vs actual usage of supply-driven power.
Even for demand-driven power supply options, the full potential is not utilised. This may be surprising, since there remains a gap in demand, which is filled by bioenergy. The reason for this is regional differentiation. Figure 4 - 10, for example, shows a large potential for CSP in later years. However, as most of this potential lies in regions with a low electricity demand, it cannot be fully utilised32.
32 Note: The Energy Scenario allows sharing of electricity within each of the world’s ten regions. Sharing between regions has not been taken into account; in reality, this should be used to further optimise world power supply.
150A Sustainable Energy Supply for Everyone
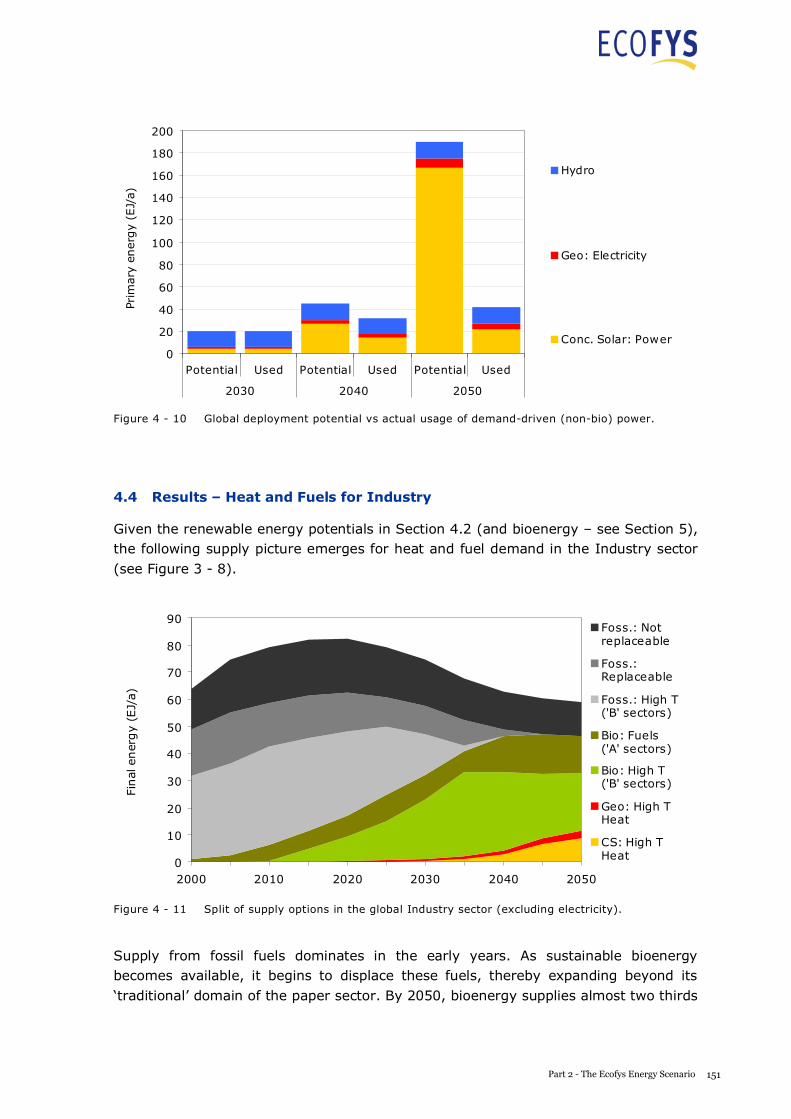
A S USTAI NABLE E NERGY S UPPLY F OR EVERY ONE
be achieved, and which role storage and smart grid systems would play was beyond the scope of this study.
The grid constraint explains why renewable power options are not fully utilised, even though the deployment potential outstrips demand. Figure 4 - 9 shows that large contingencies in the supply-driven power supply sources appear as early as 2030. The reason these potentials are not fully utilised is the grid constraint32, i.e. the fact that our grids will need time to prepare for the large share of supply-driven electricity sources.
0
50
100
150
200
250
300
350
400
Potential Used Potential Used Potential Used
2030 2040 2050
Prim
ary
energ
y(E
J/a)
PV
Wave & Tidal
Wind: Off-shore
Wind: On-shore
Figure 4 - 9 Global deployment potential vs actual usage of supply-driven power.
Even for demand-driven power supply options, the full potential is not utilised. This may be surprising, since there remains a gap in demand, which is filled by bioenergy. The reason for this is regional differentiation. Figure 4 - 10, for example, shows a large potential for CSP in later years. However, as most of this potential lies in regions with a low electricity demand, it cannot be fully utilised32.
32 Note: The Energy Scenario allows sharing of electricity within each of the world’s ten regions. Sharing between regions has not been taken into account; in reality, this should be used to further optimise world power supply.
A S USTAI NABLE E NERGY S UPPLY F OR EVERY ONE
0
20
40
60
80
100
120
140
160
180
200
Potential Used Potential Used Potential Used
2030 2040 2050
Prim
ary
energ
y(E
J/a)
Hydro
Geo: Electricity
Conc. Solar: Power
Figure 4 - 10 Global deployment potential vs actual usage of demand-driven (non-bio) power.
4.4 Results – Heat and Fuels for Industry
Given the renewable energy potentials in Section 4.2 (and bioenergy – see Section 5), the following supply picture emerges for heat and fuel demand in the Industry sector (see Figure 3 - 8).
0
10
20
30
40
50
60
70
80
90
2000 2010 2020 2030 2040 2050
Final
ener
gy
(EJ/
a)
Foss.: Notreplaceable
Foss.:Replaceable
Foss.: High T ('B' sectors)
Bio: Fuels ('A' sectors)
Bio: High T ('B' sectors)
Geo: High THeat
CS: High THeat
Figure 4 - 11 Split of supply options in the global Industry sector (excluding electricity).
Supply from fossil fuels dominates in the early years. As sustainable bioenergy becomes available, it begins to displace these fuels, thereby expanding beyond its ‘traditional’ domain of the paper sector. By 2050, bioenergy supplies almost two thirds
151Part 2 - The Ecofys Energy Scenario
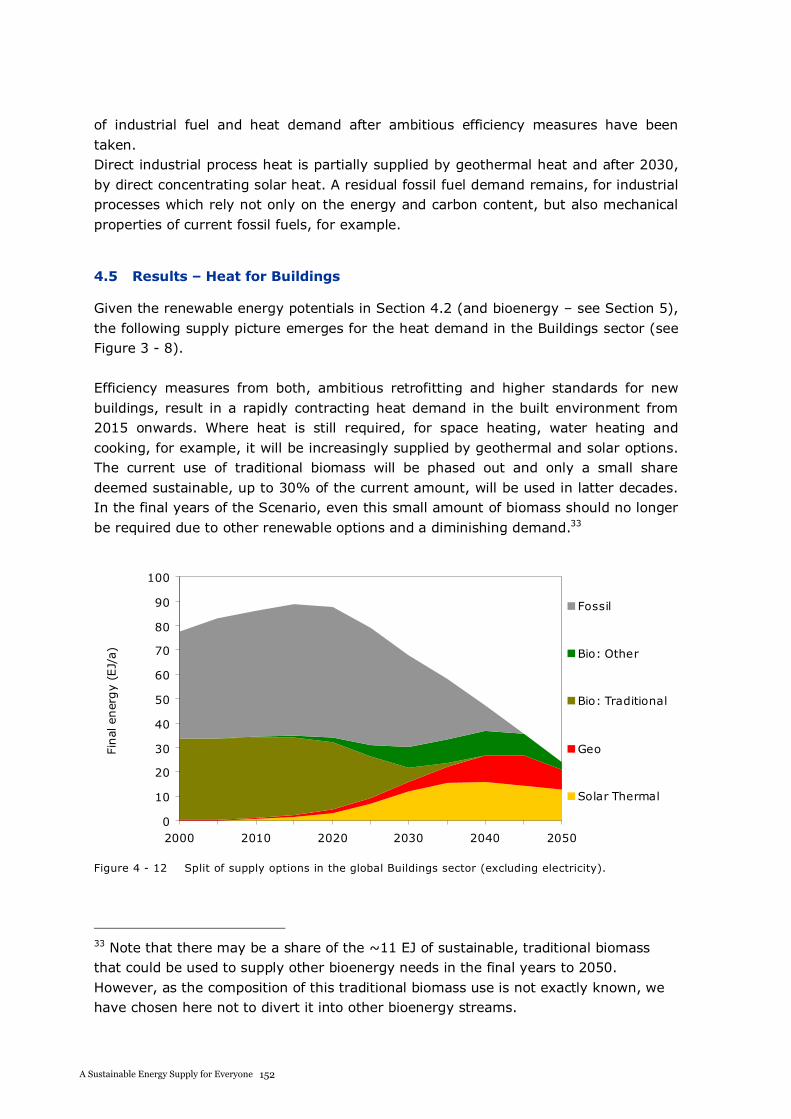
A S USTAI NABLE E NERGY S UPPLY F OR EVERY ONE
of industrial fuel and heat demand after ambitious efficiency measures have been taken. Direct industrial process heat is partially supplied by geothermal heat and after 2030, by direct concentrating solar heat. A residual fossil fuel demand remains, for industrial processes which rely not only on the energy and carbon content, but also mechanical properties of current fossil fuels, for example.
4.5 Results – Heat for Buildings
Given the renewable energy potentials in Section 4.2 (and bioenergy – see Section 5), the following supply picture emerges for the heat demand in the Buildings sector (see Figure 3 - 8).
Efficiency measures from both, ambitious retrofitting and higher standards for new buildings, result in a rapidly contracting heat demand in the built environment from 2015 onwards. Where heat is still required, for space heating, water heating and cooking, for example, it will be increasingly supplied by geothermal and solar options. The current use of traditional biomass will be phased out and only a small share deemed sustainable, up to 30% of the current amount, will be used in latter decades. In the final years of the Scenario, even this small amount of biomass should no longer be required due to other renewable options and a diminishing demand.33
0
10
20
30
40
50
60
70
80
90
100
2000 2010 2020 2030 2040 2050
Final
ener
gy
(EJ/
a)
Fossil
Bio: Other
Bio: Traditional
Geo
Solar Thermal
Figure 4 - 12 Split of supply options in the global Buildings sector (excluding electricity).
33 Note that there may be a share of the ~11 EJ of sustainable, traditional biomass that could be used to supply other bioenergy needs in the final years to 2050. However, as the composition of this traditional biomass use is not exactly known, we have chosen here not to divert it into other bioenergy streams.
152A Sustainable Energy Supply for Everyone
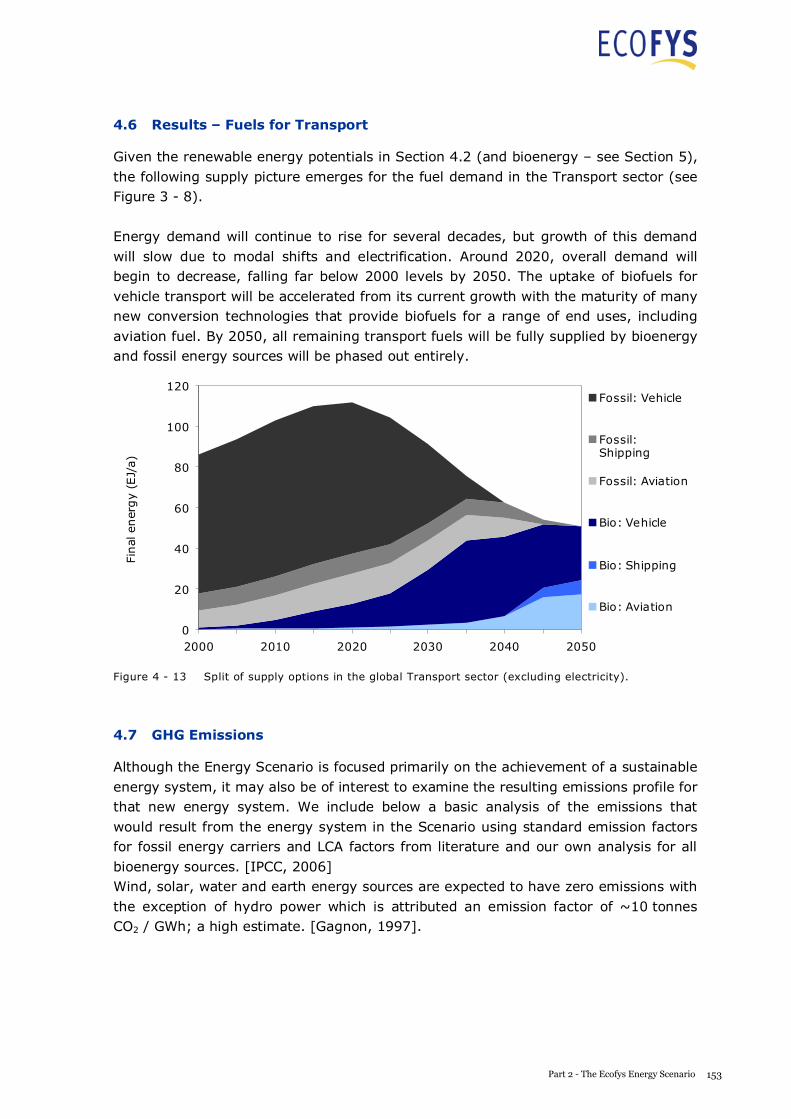
A S USTAI NABLE E NERGY S UPPLY F OR EVERY ONE
4.6 Results – Fuels for Transport
Given the renewable energy potentials in Section 4.2 (and bioenergy – see Section 5), the following supply picture emerges for the fuel demand in the Transport sector (see Figure 3 - 8).
Energy demand will continue to rise for several decades, but growth of this demand will slow due to modal shifts and electrification. Around 2020, overall demand will begin to decrease, falling far below 2000 levels by 2050. The uptake of biofuels for vehicle transport will be accelerated from its current growth with the maturity of many new conversion technologies that provide biofuels for a range of end uses, including aviation fuel. By 2050, all remaining transport fuels will be fully supplied by bioenergy and fossil energy sources will be phased out entirely.
0
20
40
60
80
100
120
2000 2010 2020 2030 2040 2050
Final
ener
gy
(EJ/
a)
Fossil: Vehicle
Fossil:Shipping
Fossil: Aviation
Bio: Vehicle
Bio: Shipping
Bio: Aviation
Figure 4 - 13 Split of supply options in the global Transport sector (excluding electricity).
4.7 GHG Emissions
Although the Energy Scenario is focused primarily on the achievement of a sustainable energy system, it may also be of interest to examine the resulting emissions profile for that new energy system. We include below a basic analysis of the emissions that would result from the energy system in the Scenario using standard emission factors for fossil energy carriers and LCA factors from literature and our own analysis for all bioenergy sources. [IPCC, 2006] Wind, solar, water and earth energy sources are expected to have zero emissions with the exception of hydro power which is attributed an emission factor of ~10 tonnes CO2 / GWh; a high estimate. [Gagnon, 1997].
153Part 2 - The Ecofys Energy Scenario
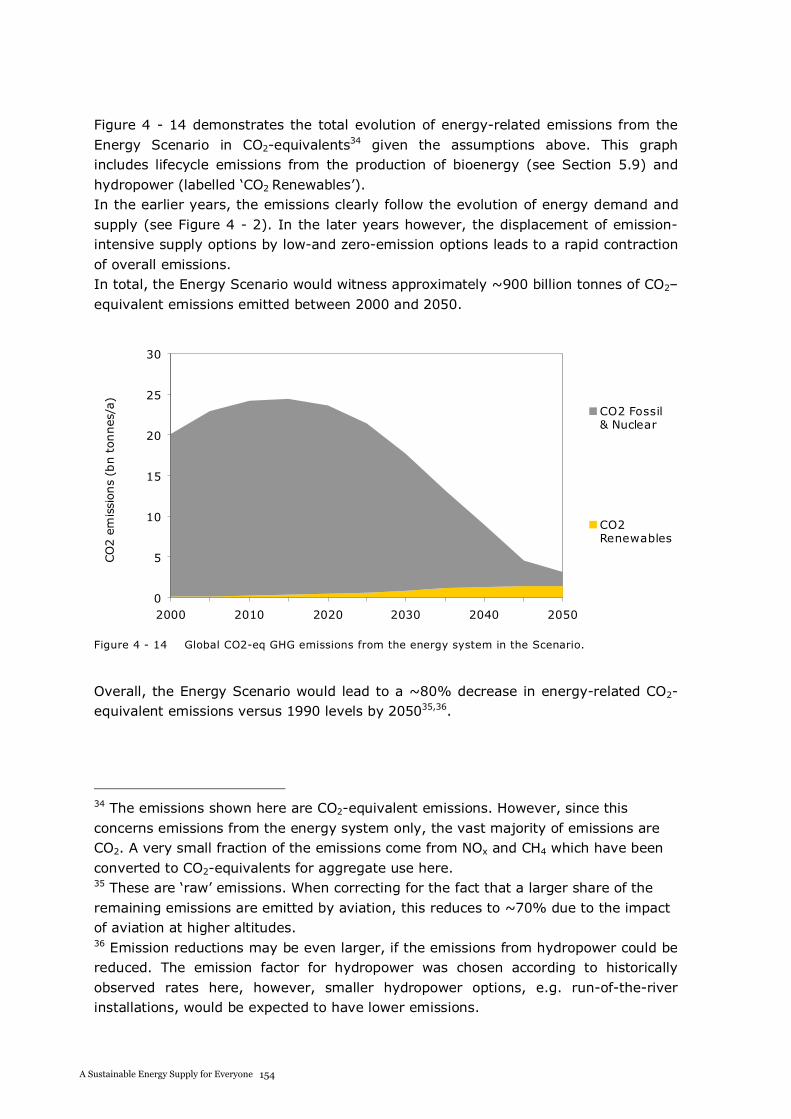
A S USTAI NABLE E NERGY S UPPLY F OR EVERY ONE
Figure 4 - 14 demonstrates the total evolution of energy-related emissions from the Energy Scenario in CO2-equivalents34 given the assumptions above. This graph includes lifecycle emissions from the production of bioenergy (see Section 5.9) and hydropower (labelled ‘CO2 Renewables’). In the earlier years, the emissions clearly follow the evolution of energy demand and supply (see Figure 4 - 2). In the later years however, the displacement of emission-intensive supply options by low-and zero-emission options leads to a rapid contraction of overall emissions. In total, the Energy Scenario would witness approximately ~900 billion tonnes of CO2–equivalent emissions emitted between 2000 and 2050.
0
5
10
15
20
25
30
2000 2010 2020 2030 2040 2050
CO
2em
issi
ons
(bn
tonnes
/a)
CO2 Fossil& Nuclear
CO2Renewables
Figure 4 - 14 Global CO2-eq GHG emissions from the energy system in the Scenario.
Overall, the Energy Scenario would lead to a ~80% decrease in energy-related CO2-equivalent emissions versus 1990 levels by 205035,36.
34 The emissions shown here are CO2-equivalent emissions. However, since this concerns emissions from the energy system only, the vast majority of emissions are CO2. A very small fraction of the emissions come from NOx and CH4 which have been converted to CO2-equivalents for aggregate use here. 35 These are ‘raw’ emissions. When correcting for the fact that a larger share of the remaining emissions are emitted by aviation, this reduces to ~70% due to the impact of aviation at higher altitudes. 36 Emission reductions may be even larger, if the emissions from hydropower could be reduced. The emission factor for hydropower was chosen according to historically observed rates here, however, smaller hydropower options, e.g. run-of-the-river installations, would be expected to have lower emissions.
154A Sustainable Energy Supply for Everyone
A S USTAI NABLE E NERGY S UPPLY F OR EVERY ONE
Carbon capture and storage
The application of carbon capture and storage (CCS) may lead to a further decrease of emissions from industrial and electricity-generating use of fossil fuels and biomass in later years. However, applying CCS to the majority of emissions in this Scenario is not very attractive, primarily because it is expected to mature too late, by 2025–2030. By the time CCS could then be deployed on a large scale, the use of fossil fuels will have declined so heavily that investments would not be likely to yield the required returns.
In the context of the Scenario, it would therefore be more logical to focus on: options to reduce or replace the 5% fossil energy use that remains until and after 2050 options to reduce the CO2 emissions from the combustion of biomass options to reduce the CO2 emissions from the industrial use of biomass options to reduce the lifecycle CO2 emissions from the production of biofuels CCS systems that start on fossil fuels, but that are suitable for later conversion into BECCS (Bioenergy with CCS).
155Part 2 - The Ecofys Energy Scenario

A S USTAI NABLE E NERGY S UPPLY F OR EVERY ONE
5 Supply – Sustainable bioenergy
5.1 Summary: Meeting demand with sustainable bioenergy
The Scenario incorporates a significant share of sustainable bioenergy supply to meet the remaining demand after using other renewable energy options. The Scenario only includes bioenergy supply that is sustainable and leads to high greenhouse gas emission savings when compared to fossil references.37
Figure 5 - 1 shows that the Scenario is capable of meeting demand with bioenergy within the sustainable potential and simultaneously accomplishing high greenhouse gas emission savings.
0
50
100
150
200
250
300
350
400
Potential Used GHG fossilreferences
GHGScenario
bioenergy
Prim
ary
bio
ener
gy
(EJ/
a)
0
10
20
30
40
50
60
70
80
90
GH
Gem
issi
ons
(gCO
2eq
/MJ
final
ener
gy
use
)
Bio: Algae
Bio: Crops
Bio: Comp.Fellings
Bio: Resid.&Waste
GHG emissions
75-85% savings
Figure 5 - 1 Overview of the Energy Scenario's sustainable bioenergy use versus sustainable
potential and sustainable bioenergy greenhouse gas (GHG) emissions versus fossil
references for 2050.
It is important to understand that, compared to other studies [Greenpeace, 2010; Shell, 2008; OECD/IEA, 2009] the Energy Scenario uses a relatively large amount of bioenergy, shown in Figure 5 - 2.
37 The Scenario’s approach to bioenergy sustainability is described in Section 5.2 and detailed further in Sections 5.3 through 5.7. The resulting greenhouse gas emission savings are presented in Section 5.9.
156A Sustainable Energy Supply for Everyone
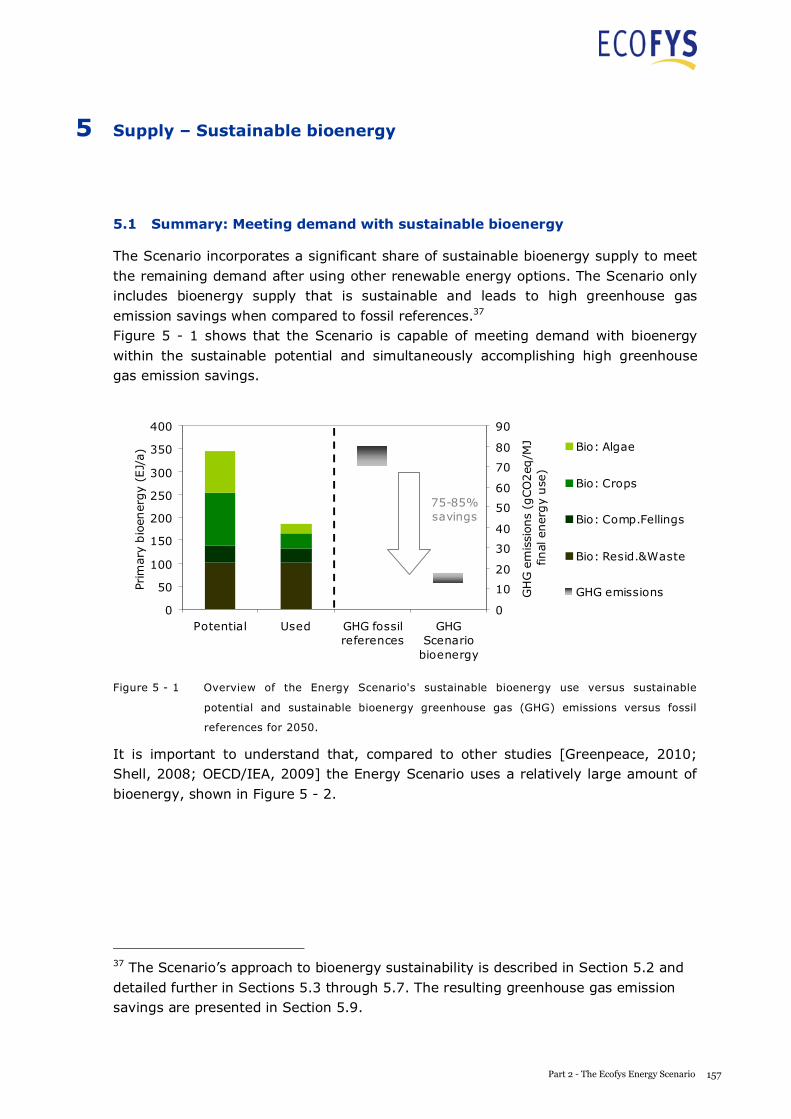
A S USTAI NABLE E NERGY S UPPLY F OR EVERY ONE
5 Supply – Sustainable bioenergy
5.1 Summary: Meeting demand with sustainable bioenergy
The Scenario incorporates a significant share of sustainable bioenergy supply to meet the remaining demand after using other renewable energy options. The Scenario only includes bioenergy supply that is sustainable and leads to high greenhouse gas emission savings when compared to fossil references.37
Figure 5 - 1 shows that the Scenario is capable of meeting demand with bioenergy within the sustainable potential and simultaneously accomplishing high greenhouse gas emission savings.
0
50
100
150
200
250
300
350
400
Potential Used GHG fossilreferences
GHGScenario
bioenergy
Prim
ary
bio
ener
gy
(EJ/
a)
0
10
20
30
40
50
60
70
80
90
GH
Gem
issi
ons
(gCO
2eq
/MJ
final
ener
gy
use
)
Bio: Algae
Bio: Crops
Bio: Comp.Fellings
Bio: Resid.&Waste
GHG emissions
75-85% savings
Figure 5 - 1 Overview of the Energy Scenario's sustainable bioenergy use versus sustainable
potential and sustainable bioenergy greenhouse gas (GHG) emissions versus fossil
references for 2050.
It is important to understand that, compared to other studies [Greenpeace, 2010; Shell, 2008; OECD/IEA, 2009] the Energy Scenario uses a relatively large amount of bioenergy, shown in Figure 5 - 2.
37 The Scenario’s approach to bioenergy sustainability is described in Section 5.2 and detailed further in Sections 5.3 through 5.7. The resulting greenhouse gas emission savings are presented in Section 5.9.
157Part 2 - The Ecofys Energy Scenario
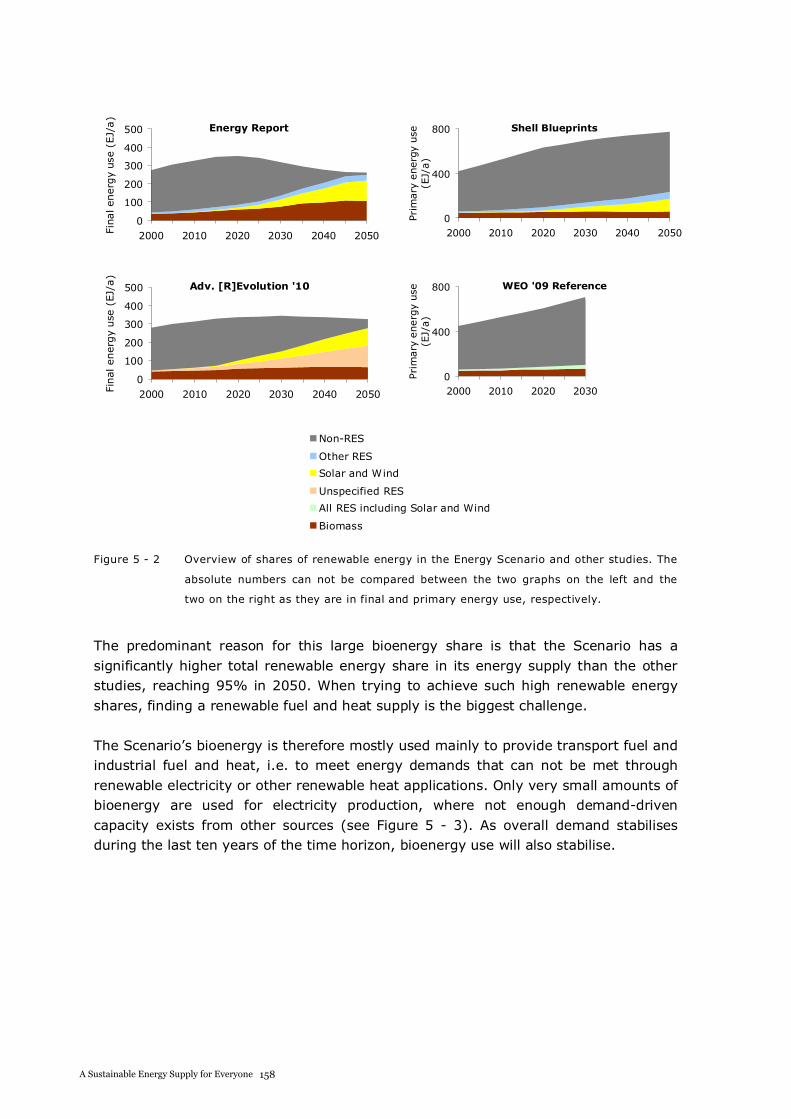
A S USTAI NABLE E NERGY S UPPLY F OR EVERY ONE
Energy Report
0
100
200
300
400
500
2000 2010 2020 2030 2040 2050Finalenerg
yuse
(EJ/
a)
Shell Blueprints
0
400
800
2000 2010 2020 2030 2040 2050
Prim
ary
energ
yuse
(EJ/
a)
Adv. [R]Evolution '10
0
100
200
300
400
500
2000 2010 2020 2030 2040 2050Finalenerg
yuse
(EJ/
a)
WEO '09 Reference
0
400
800
2000 2010 2020 2030 2040 2050
Pri
mary
energ
yuse
(EJ/
a)
Non-RES
Other RES
Solar and Wind
Unspecified RES
All RES including Solar and Wind
Biomass
Figure 5 - 2 Overview of shares of renewable energy in the Energy Scenario and other studies. The
absolute numbers can not be compared between the two graphs on the left and the
two on the right as they are in final and primary energy use, respectively.
The predominant reason for this large bioenergy share is that the Scenario has a significantly higher total renewable energy share in its energy supply than the other studies, reaching 95% in 2050. When trying to achieve such high renewable energy shares, finding a renewable fuel and heat supply is the biggest challenge.
The Scenario’s bioenergy is therefore mostly used mainly to provide transport fuel and industrial fuel and heat, i.e. to meet energy demands that can not be met through renewable electricity or other renewable heat applications. Only very small amounts of bioenergy are used for electricity production, where not enough demand-driven capacity exists from other sources (see Figure 5 - 3). As overall demand stabilises during the last ten years of the time horizon, bioenergy use will also stabilise.
A S USTAI NABLE E NERGY S UPPLY F OR EVERY ONE
0
50
100
150
200
250
300
350
400
2000 2010 2020 2030 2040 2050
Fin
alene
rgy
use
(EJ/
a)
Fossil & Nuclear
Bio: Transport fuels
Bio: Industry heat &fuels
Bio: Building heat
Bio: Electricity
Other renewables
Figure 5 - 3 Global use of bioenergy versus other renewable and non-renewable energy sources.
The main energy demand types covered by bioenergy include: Transport fuels where energy storage density is often a crucial factor; especially:
o Long distance road transport o Aviation o Shipping
Industrial fuels where electric or solar heating is insufficient; especially:o Applications that require very high temperature o Applications that require a specific energy carrier, e.g. a gaseous fuel or
solid fuel. One example would be the steel industry where the structural strength of a solid fuel is required.
As these demands can typically only be met through a bioenergy supply option, the amount of bioenergy supply needed in the Scenario is large. This means that in the earlier years of the Scenario’s time horizon the full sustainable bioenergy potential is used. However, towards 2050, as with the other renewable energy options in the Scenario, this full bioenergy potential is no longer required and contingency supplies become available, shown in Figure 5 - 1. The contingencies in the crop category mean that not all hectares of the identified sustainable land potential need to be used for energy cropping.
158A Sustainable Energy Supply for Everyone
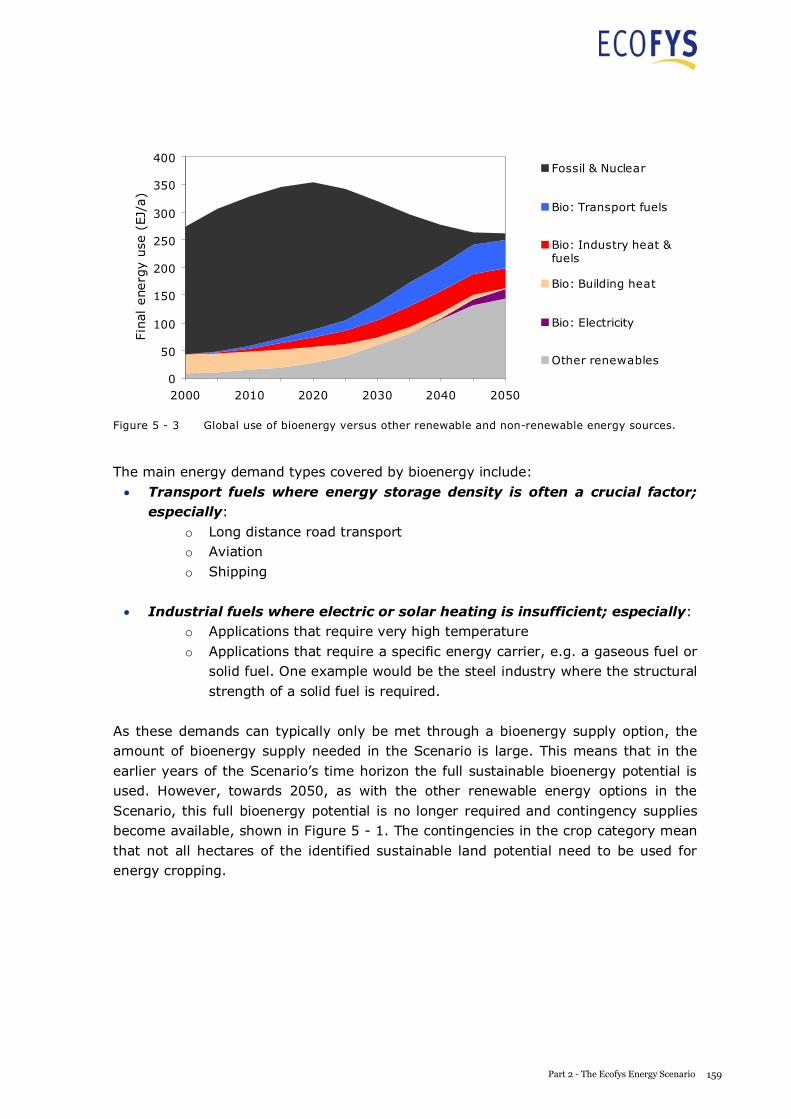
A S USTAI NABLE E NERGY S UPPLY F OR EVERY ONE
0
50
100
150
200
250
300
350
400
2000 2010 2020 2030 2040 2050
Fin
alene
rgy
use
(EJ/
a)
Fossil & Nuclear
Bio: Transport fuels
Bio: Industry heat &fuels
Bio: Building heat
Bio: Electricity
Other renewables
Figure 5 - 3 Global use of bioenergy versus other renewable and non-renewable energy sources.
The main energy demand types covered by bioenergy include: Transport fuels where energy storage density is often a crucial factor; especially:
o Long distance road transport o Aviation o Shipping
Industrial fuels where electric or solar heating is insufficient; especially:o Applications that require very high temperature o Applications that require a specific energy carrier, e.g. a gaseous fuel or
solid fuel. One example would be the steel industry where the structural strength of a solid fuel is required.
As these demands can typically only be met through a bioenergy supply option, the amount of bioenergy supply needed in the Scenario is large. This means that in the earlier years of the Scenario’s time horizon the full sustainable bioenergy potential is used. However, towards 2050, as with the other renewable energy options in the Scenario, this full bioenergy potential is no longer required and contingency supplies become available, shown in Figure 5 - 1. The contingencies in the crop category mean that not all hectares of the identified sustainable land potential need to be used for energy cropping.
159Part 2 - The Ecofys Energy Scenario
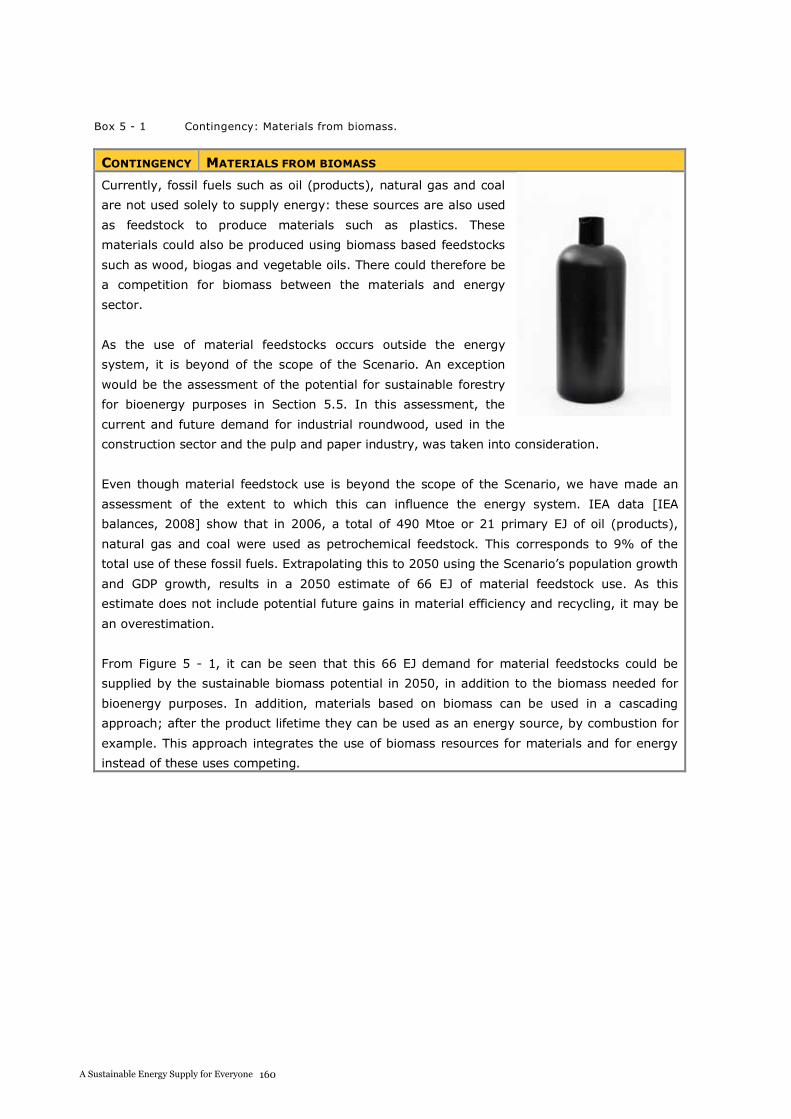
A S USTAI NABLE E NERGY S UPPLY F OR EVERY ONE
Box 5 - 1 Contingency: Materials from biomass.
CONTINGENCY MATERIALS FROM BIOMASS
Currently, fossil fuels such as oil (products), natural gas and coal
are not used solely to supply energy: these sources are also used
as feedstock to produce materials such as plastics. These
materials could also be produced using biomass based feedstocks
such as wood, biogas and vegetable oils. There could therefore be
a competition for biomass between the materials and energy
sector.
As the use of material feedstocks occurs outside the energy
system, it is beyond of the scope of the Scenario. An exception
would be the assessment of the potential for sustainable forestry
for bioenergy purposes in Section 5.5. In this assessment, the
current and future demand for industrial roundwood, used in the
construction sector and the pulp and paper industry, was taken into consideration.
Even though material feedstock use is beyond the scope of the Scenario, we have made an
assessment of the extent to which this can influence the energy system. IEA data [IEA
balances, 2008] show that in 2006, a total of 490 Mtoe or 21 primary EJ of oil (products),
natural gas and coal were used as petrochemical feedstock. This corresponds to 9% of the
total use of these fossil fuels. Extrapolating this to 2050 using the Scenario’s population growth
and GDP growth, results in a 2050 estimate of 66 EJ of material feedstock use. As this
estimate does not include potential future gains in material efficiency and recycling, it may be
an overestimation.
From Figure 5 - 1, it can be seen that this 66 EJ demand for material feedstocks could be
supplied by the sustainable biomass potential in 2050, in addition to the biomass needed for
bioenergy purposes. In addition, materials based on biomass can be used in a cascading
approach; after the product lifetime they can be used as an energy source, by combustion for
example. This approach integrates the use of biomass resources for materials and for energy
instead of these uses competing.
160A Sustainable Energy Supply for Everyone
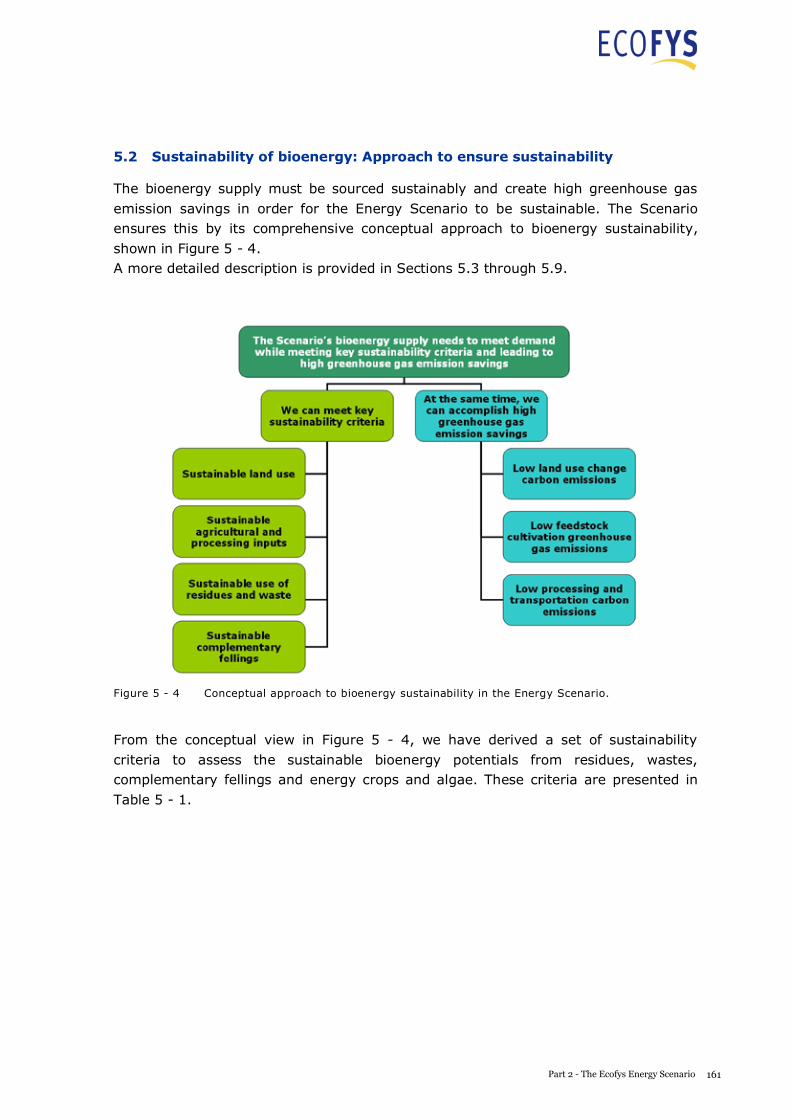
A S USTAI NABLE E NERGY S UPPLY F OR EVERY ONE
Box 5 - 1 Contingency: Materials from biomass.
CONTINGENCY MATERIALS FROM BIOMASS
Currently, fossil fuels such as oil (products), natural gas and coal
are not used solely to supply energy: these sources are also used
as feedstock to produce materials such as plastics. These
materials could also be produced using biomass based feedstocks
such as wood, biogas and vegetable oils. There could therefore be
a competition for biomass between the materials and energy
sector.
As the use of material feedstocks occurs outside the energy
system, it is beyond of the scope of the Scenario. An exception
would be the assessment of the potential for sustainable forestry
for bioenergy purposes in Section 5.5. In this assessment, the
current and future demand for industrial roundwood, used in the
construction sector and the pulp and paper industry, was taken into consideration.
Even though material feedstock use is beyond the scope of the Scenario, we have made an
assessment of the extent to which this can influence the energy system. IEA data [IEA
balances, 2008] show that in 2006, a total of 490 Mtoe or 21 primary EJ of oil (products),
natural gas and coal were used as petrochemical feedstock. This corresponds to 9% of the
total use of these fossil fuels. Extrapolating this to 2050 using the Scenario’s population growth
and GDP growth, results in a 2050 estimate of 66 EJ of material feedstock use. As this
estimate does not include potential future gains in material efficiency and recycling, it may be
an overestimation.
From Figure 5 - 1, it can be seen that this 66 EJ demand for material feedstocks could be
supplied by the sustainable biomass potential in 2050, in addition to the biomass needed for
bioenergy purposes. In addition, materials based on biomass can be used in a cascading
approach; after the product lifetime they can be used as an energy source, by combustion for
example. This approach integrates the use of biomass resources for materials and for energy
instead of these uses competing.
A S USTAI NABLE E NERGY S UPPLY F OR EVERY ONE
5.2 Sustainability of bioenergy: Approach to ensure sustainability
The bioenergy supply must be sourced sustainably and create high greenhouse gas emission savings in order for the Energy Scenario to be sustainable. The Scenario ensures this by its comprehensive conceptual approach to bioenergy sustainability, shown in Figure 5 - 4. A more detailed description is provided in Sections 5.3 through 5.9.
Figure 5 - 4 Conceptual approach to bioenergy sustainability in the Energy Scenario.
From the conceptual view in Figure 5 - 4, we have derived a set of sustainability criteria to assess the sustainable bioenergy potentials from residues, wastes, complementary fellings and energy crops and algae. These criteria are presented in Table 5 - 1.
161Part 2 - The Ecofys Energy Scenario
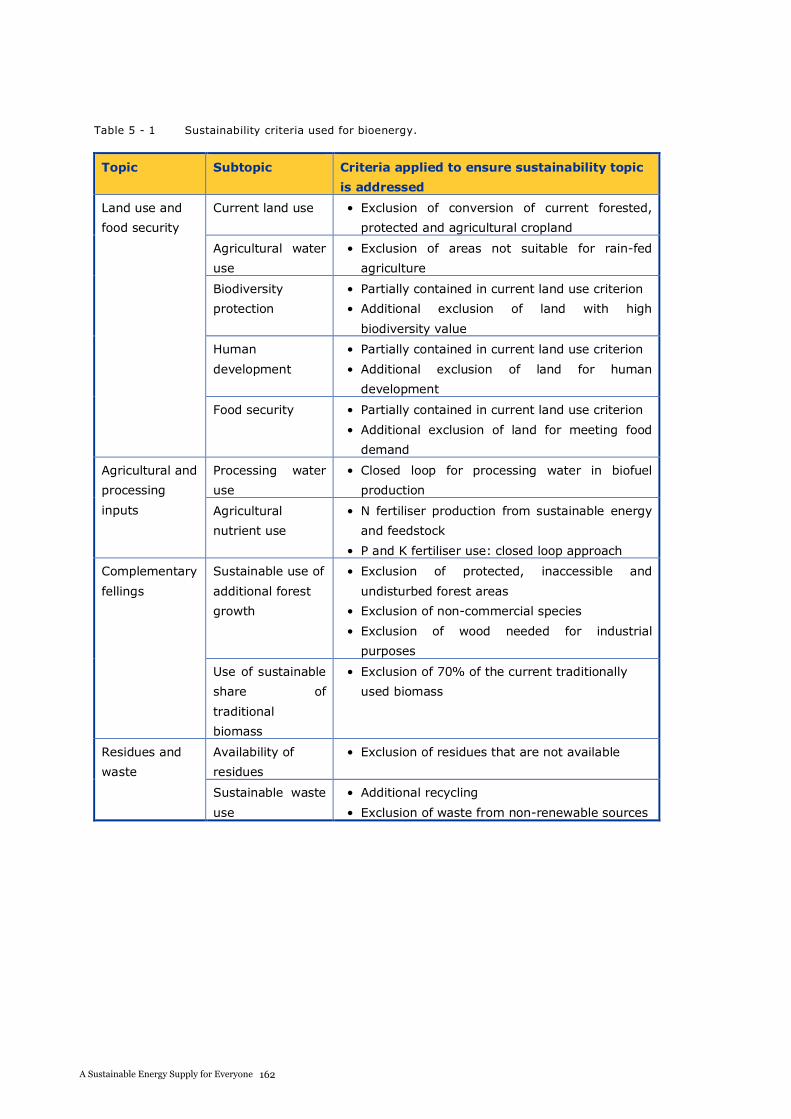
A S USTAI NABLE E NERGY S UPPLY F OR EVERY ONE
Table 5 - 1 Sustainability criteria used for bioenergy.
Topic Subtopic Criteria applied to ensure sustainability topic
is addressed
Land use and
food security
Current land use • Exclusion of conversion of current forested,
protected and agricultural cropland
Agricultural water
use
• Exclusion of areas not suitable for rain-fed
agriculture
Biodiversity
protection
• Partially contained in current land use criterion
• Additional exclusion of land with high
biodiversity value
Human
development
• Partially contained in current land use criterion
• Additional exclusion of land for human
development
Food security • Partially contained in current land use criterion
• Additional exclusion of land for meeting food
demand
Agricultural and
processing
inputs
Processing water
use
• Closed loop for processing water in biofuel
production
Agricultural
nutrient use
• N fertiliser production from sustainable energy
and feedstock
• P and K fertiliser use: closed loop approach
Complementary
fellings
Sustainable use of
additional forest
growth
• Exclusion of protected, inaccessible and
undisturbed forest areas
• Exclusion of non-commercial species
• Exclusion of wood needed for industrial
purposes
Use of sustainable
share of
traditional
biomass
• Exclusion of 70% of the current traditionally
used biomass
Residues and
waste
Availability of
residues
• Exclusion of residues that are not available
Sustainable waste
use
• Additional recycling
• Exclusion of waste from non-renewable sources
162A Sustainable Energy Supply for Everyone
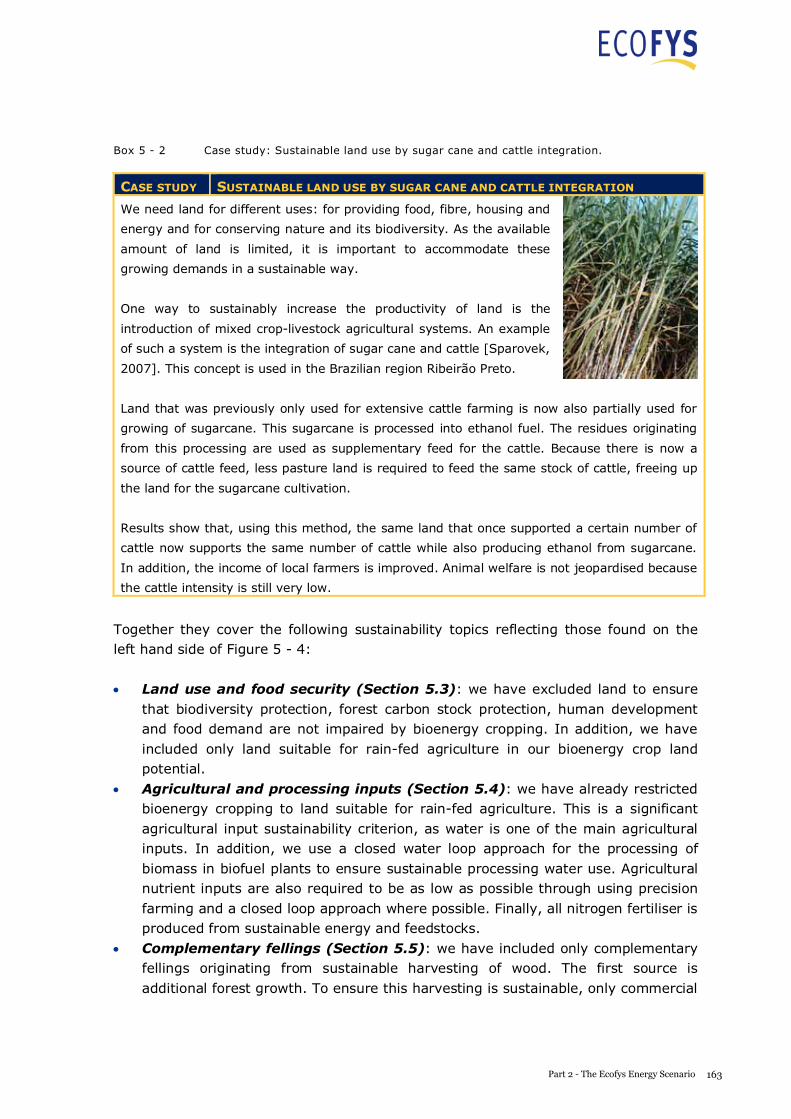
A S USTAI NABLE E NERGY S UPPLY F OR EVERY ONE
Table 5 - 1 Sustainability criteria used for bioenergy.
Topic Subtopic Criteria applied to ensure sustainability topic
is addressed
Land use and
food security
Current land use • Exclusion of conversion of current forested,
protected and agricultural cropland
Agricultural water
use
• Exclusion of areas not suitable for rain-fed
agriculture
Biodiversity
protection
• Partially contained in current land use criterion
• Additional exclusion of land with high
biodiversity value
Human
development
• Partially contained in current land use criterion
• Additional exclusion of land for human
development
Food security • Partially contained in current land use criterion
• Additional exclusion of land for meeting food
demand
Agricultural and
processing
inputs
Processing water
use
• Closed loop for processing water in biofuel
production
Agricultural
nutrient use
• N fertiliser production from sustainable energy
and feedstock
• P and K fertiliser use: closed loop approach
Complementary
fellings
Sustainable use of
additional forest
growth
• Exclusion of protected, inaccessible and
undisturbed forest areas
• Exclusion of non-commercial species
• Exclusion of wood needed for industrial
purposes
Use of sustainable
share of
traditional
biomass
• Exclusion of 70% of the current traditionally
used biomass
Residues and
waste
Availability of
residues
• Exclusion of residues that are not available
Sustainable waste
use
• Additional recycling
• Exclusion of waste from non-renewable sources
A S USTAI NABLE E NERGY S UPPLY F OR EVERY ONE
Box 5 - 2 Case study: Sustainable land use by sugar cane and cattle integration.
CASE STUDY SUSTAINABLE LAND USE BY SUGAR CANE AND CATTLE INTEGRATION
We need land for different uses: for providing food, fibre, housing and
energy and for conserving nature and its biodiversity. As the available
amount of land is limited, it is important to accommodate these
growing demands in a sustainable way.
One way to sustainably increase the productivity of land is the
introduction of mixed crop-livestock agricultural systems. An example
of such a system is the integration of sugar cane and cattle [Sparovek,
2007]. This concept is used in the Brazilian region Ribeirão Preto.
Land that was previously only used for extensive cattle farming is now also partially used for
growing of sugarcane. This sugarcane is processed into ethanol fuel. The residues originating
from this processing are used as supplementary feed for the cattle. Because there is now a
source of cattle feed, less pasture land is required to feed the same stock of cattle, freeing up
the land for the sugarcane cultivation.
Results show that, using this method, the same land that once supported a certain number of
cattle now supports the same number of cattle while also producing ethanol from sugarcane.
In addition, the income of local farmers is improved. Animal welfare is not jeopardised because
the cattle intensity is still very low.
Together they cover the following sustainability topics reflecting those found on the left hand side of Figure 5 - 4:
Land use and food security (Section 5.3): we have excluded land to ensure that biodiversity protection, forest carbon stock protection, human development and food demand are not impaired by bioenergy cropping. In addition, we have included only land suitable for rain-fed agriculture in our bioenergy crop land potential. Agricultural and processing inputs (Section 5.4): we have already restricted bioenergy cropping to land suitable for rain-fed agriculture. This is a significant agricultural input sustainability criterion, as water is one of the main agricultural inputs. In addition, we use a closed water loop approach for the processing of biomass in biofuel plants to ensure sustainable processing water use. Agricultural nutrient inputs are also required to be as low as possible through using precision farming and a closed loop approach where possible. Finally, all nitrogen fertiliser is produced from sustainable energy and feedstocks. Complementary fellings (Section 5.5): we have included only complementary fellings originating from sustainable harvesting of wood. The first source is additional forest growth. To ensure this harvesting is sustainable, only commercial
163Part 2 - The Ecofys Energy Scenario
A S USTAI NABLE E NERGY S UPPLY F OR EVERY ONE
species in forests that are accessible, unprotected and already disturbed are included. The second source is a share of the current traditional biomass use. To ensure its sustainability, the majority of this traditional biomass is phased out and is not used in the Scenario. Residues and waste (Section 5.6): we have included only residues and wastes that originate from a renewable source. Any residues that are not available, due to competing uses for example, are also not taken into consideration.
All these criteria and their applications in the Scenario are discussed in further detail in Sections 5.3 through 5.6. Section 5.9 discusses how this affects the greenhouse gas emission savings achieved by using bioenergy in the Scenario.
5.3 Sustainability of bioenergy: Land use and food security
The Scenario explicitly prioritises a number of land uses over land use for bioenergy cropping. In addition, the Scenario restricts bioenergy cropping to land suitable for rain-fed cultivation of energy crops in order not to require irrigation38 as an agricultural input.
Therefore the following land is not used for bioenergy cropping in the Energy Scenario:
Land used for supplying food, feed and fibre; taking into account future population growth and a diet change scenario Land used for protection of biodiversity and high carbon stock forest ecosystems Land used for human development by expanding the built environment Land not or marginally suitable for rain-fed cultivation of energy crops
We performed an assessment of land potential for rain-fed cultivation of energy crops based on this land use prioritisation. Figure 5 - 5 shows the results of this assessment. We acknowledge that substantial land use planning (policy) is required to direct land use in the correct manner. This is discussed further in Section 7.2.3.
The assessment was based on data from a recent IIASA study [Fischer, 2009]. Section 2.7 in that that report provides an assessment of production potential for different bioenergy crops. We used the source data of this study and additional Ecofys
38 We recognise that agricultural water use is a complex issue. On the one hand intensive use of irrigation can lead to (local and regional) fresh water shortage. On the other hand, irrigation is a means to reach the full production potential of the land thereby reducing the need for additional agricultural land. Therefore we have chosen to plan energy cropping on land suitable for rain-fed agriculture. This leads to a satisfactory yield without requiring additional water use. Related practices that increase production, such as temporarily storing rain water to apply it to the land later, can be used in cases where they do not lead to detrimental effects on the (local and regional) ecosystem and water supply.
164A Sustainable Energy Supply for Everyone
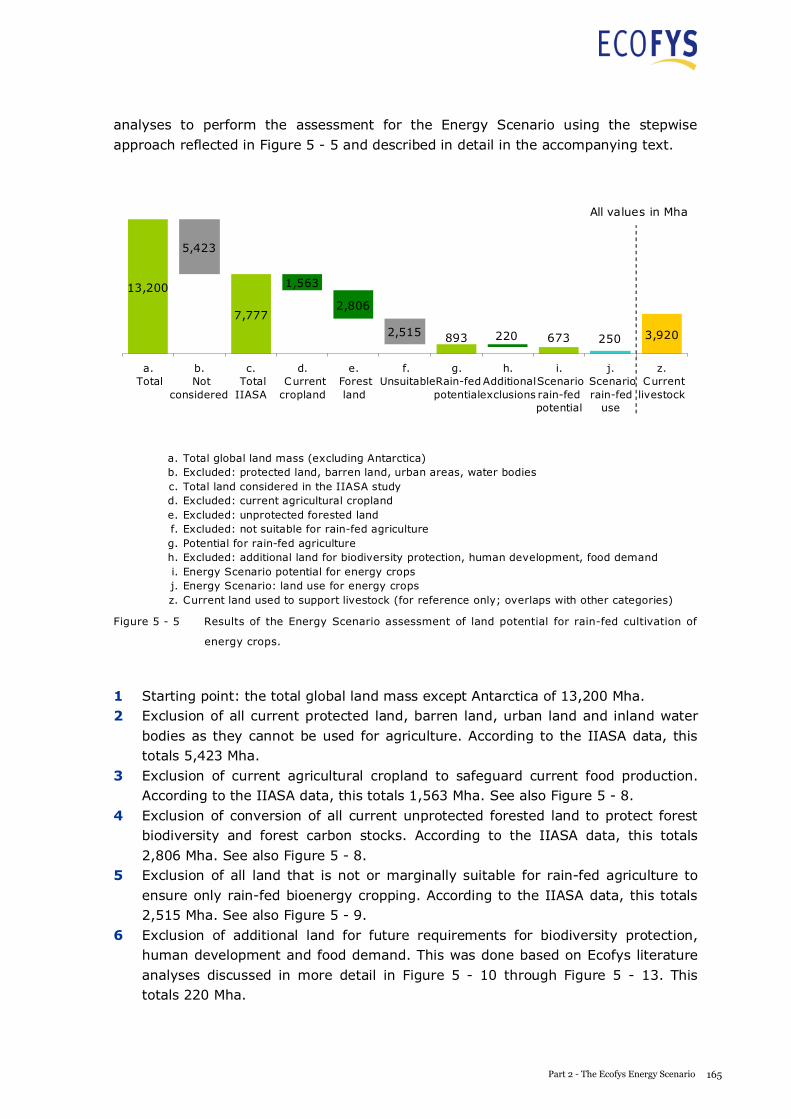
A S USTAI NABLE E NERGY S UPPLY F OR EVERY ONE
species in forests that are accessible, unprotected and already disturbed are included. The second source is a share of the current traditional biomass use. To ensure its sustainability, the majority of this traditional biomass is phased out and is not used in the Scenario. Residues and waste (Section 5.6): we have included only residues and wastes that originate from a renewable source. Any residues that are not available, due to competing uses for example, are also not taken into consideration.
All these criteria and their applications in the Scenario are discussed in further detail in Sections 5.3 through 5.6. Section 5.9 discusses how this affects the greenhouse gas emission savings achieved by using bioenergy in the Scenario.
5.3 Sustainability of bioenergy: Land use and food security
The Scenario explicitly prioritises a number of land uses over land use for bioenergy cropping. In addition, the Scenario restricts bioenergy cropping to land suitable for rain-fed cultivation of energy crops in order not to require irrigation38 as an agricultural input.
Therefore the following land is not used for bioenergy cropping in the Energy Scenario:
Land used for supplying food, feed and fibre; taking into account future population growth and a diet change scenario Land used for protection of biodiversity and high carbon stock forest ecosystems Land used for human development by expanding the built environment Land not or marginally suitable for rain-fed cultivation of energy crops
We performed an assessment of land potential for rain-fed cultivation of energy crops based on this land use prioritisation. Figure 5 - 5 shows the results of this assessment. We acknowledge that substantial land use planning (policy) is required to direct land use in the correct manner. This is discussed further in Section 7.2.3.
The assessment was based on data from a recent IIASA study [Fischer, 2009]. Section 2.7 in that that report provides an assessment of production potential for different bioenergy crops. We used the source data of this study and additional Ecofys
38 We recognise that agricultural water use is a complex issue. On the one hand intensive use of irrigation can lead to (local and regional) fresh water shortage. On the other hand, irrigation is a means to reach the full production potential of the land thereby reducing the need for additional agricultural land. Therefore we have chosen to plan energy cropping on land suitable for rain-fed agriculture. This leads to a satisfactory yield without requiring additional water use. Related practices that increase production, such as temporarily storing rain water to apply it to the land later, can be used in cases where they do not lead to detrimental effects on the (local and regional) ecosystem and water supply.
A S USTAI NABLE E NERGY S UPPLY F OR EVERY ONE
analyses to perform the assessment for the Energy Scenario using the stepwise approach reflected in Figure 5 - 5 and described in detail in the accompanying text.
a. Total global land mass (excluding Antarctica)b. Excluded: protected land, barren land, urban areas, water bodiesc. Total land considered in the IIASA studyd. Excluded: current agricultural croplande. Excluded: unprotected forested landf. Excluded: not suitable for rain-fed agricultureg. Potential for rain-fed agricultureh. Excluded: additional land for biodiversity protection, human development, food demandi. Energy Scenario potential for energy cropsj. Energy Scenario: land use for energy cropsz. Current land used to support livestock (for reference only; overlaps with other categories)
13,200
5,423
7,777
1,563
2,806
2,515 3,920673220 250893
a. Total
b. Not
considered
c. TotalIIASA
d. Currentcropland
e. Forest
land
f. Unsuitable
g. Rain-fedpotential
h. Additionalexclusions
i. Scenariorain-fedpotential
j. Scenariorain-fed
use
z. Currentlivestock
All values in Mha
Figure 5 - 5 Results of the Energy Scenario assessment of land potential for rain-fed cultivation of
energy crops.
1 Starting point: the total global land mass except Antarctica of 13,200 Mha. 2 Exclusion of all current protected land, barren land, urban land and inland water
bodies as they cannot be used for agriculture. According to the IIASA data, this totals 5,423 Mha.
3 Exclusion of current agricultural cropland to safeguard current food production. According to the IIASA data, this totals 1,563 Mha. See also Figure 5 - 8.
4 Exclusion of conversion of all current unprotected forested land to protect forest biodiversity and forest carbon stocks. According to the IIASA data, this totals 2,806 Mha. See also Figure 5 - 8.
5 Exclusion of all land that is not or marginally suitable for rain-fed agriculture to ensure only rain-fed bioenergy cropping. According to the IIASA data, this totals 2,515 Mha. See also Figure 5 - 9.
6 Exclusion of additional land for future requirements for biodiversity protection, human development and food demand. This was done based on Ecofys literature analyses discussed in more detail in Figure 5 - 10 through Figure 5 - 13. This totals 220 Mha.
165Part 2 - The Ecofys Energy Scenario
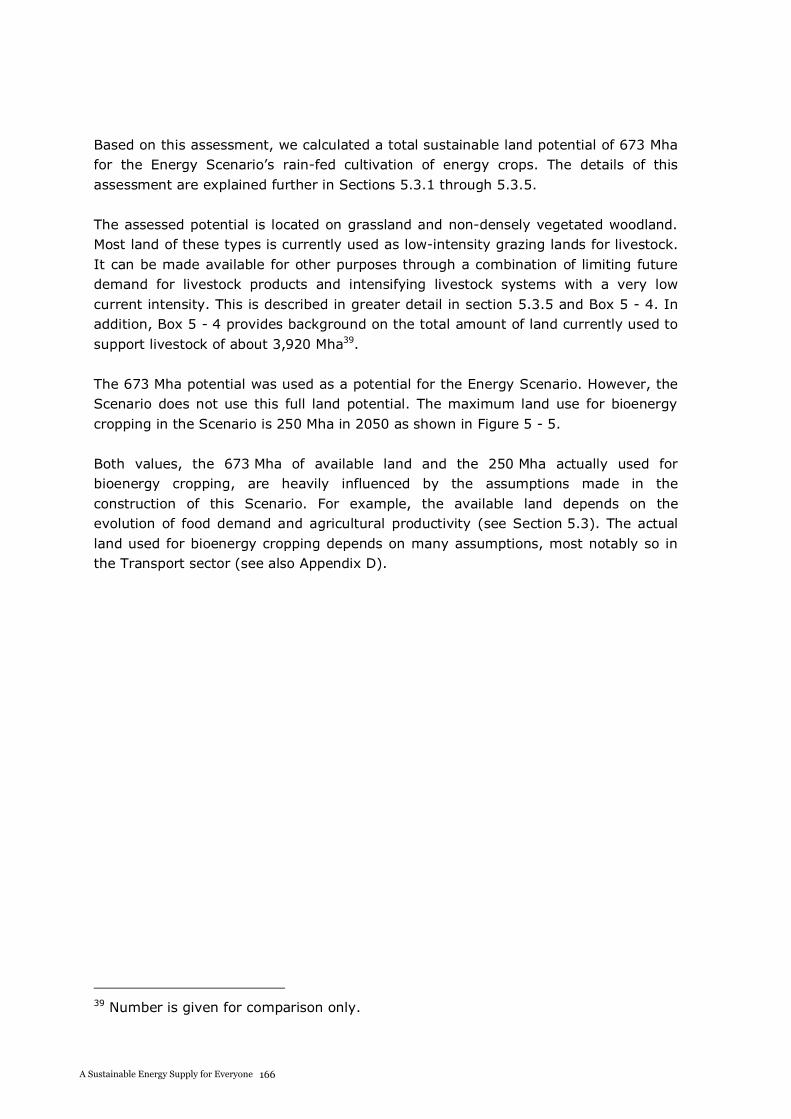
A S USTAI NABLE E NERGY S UPPLY F OR EVERY ONE
Based on this assessment, we calculated a total sustainable land potential of 673 Mha for the Energy Scenario’s rain-fed cultivation of energy crops. The details of this assessment are explained further in Sections 5.3.1 through 5.3.5.
The assessed potential is located on grassland and non-densely vegetated woodland. Most land of these types is currently used as low-intensity grazing lands for livestock. It can be made available for other purposes through a combination of limiting future demand for livestock products and intensifying livestock systems with a very low current intensity. This is described in greater detail in section 5.3.5 and Box 5 - 4. In addition, Box 5 - 4 provides background on the total amount of land currently used to support livestock of about 3,920 Mha39.
The 673 Mha potential was used as a potential for the Energy Scenario. However, the Scenario does not use this full land potential. The maximum land use for bioenergy cropping in the Scenario is 250 Mha in 2050 as shown in Figure 5 - 5.
Both values, the 673 Mha of available land and the 250 Mha actually used for bioenergy cropping, are heavily influenced by the assumptions made in the construction of this Scenario. For example, the available land depends on the evolution of food demand and agricultural productivity (see Section 5.3). The actual land used for bioenergy cropping depends on many assumptions, most notably so in the Transport sector (see also Appendix D).
39 Number is given for comparison only.
A S USTAI NABLE E NERGY S UPPLY F OR EVERY ONE
Box 5 - 3 Story: Land use in the Energy Scenario.
STORY LAND USE IN THE ENERGY SCENARIO
Full land mass worldwide, excluding Antarctica, encompasses about 13,200 Mha (132 million
km2). The status or function of this land is commonly referred to as the “land use”. There are
many types of land use. Some of them describe active land use by humans, such as land used
for agriculture, and land used for human development such as urban areas and transport
infrastructure. Other land uses reflect the natural state of the land, such as forested area or
grass- and woodland.
The Scenario incorporates a land use analysis based on seven different land uses. In this
analysis, presented in this Section 5.3 and its subsections, we calculate the effects of population
growth, diet changes, bioenergy use and biodiversity protection on global land use, among
others. Figure 5 - 6 shows the land use in the current situation and the Scenario in 2050.
0
2,000
4,000
6,000
8,000
10,000
12,000
14,000
Current Scenario
Land
use
(Mha
)
Unprotected grass- andwoodland
Unprotected forested areas
Protected areas
Bioenergy cropland
Agricultural cropland
Areas for humandevelopment
Other land unsuitable foragriculture
Figure 5 - 6 Land use of the global land mass excluding Antarctica (total: 13,200 Mha) in the
current situation and in the Energy Scenario in 2050. The bioenergy cropland value of
250 Mha is the maximum land use for bioenergy crops in the Scenario.
From Figure 5 - 6, it is apparent that there is an increase in bioenergy cropland that is relatively
large compared to the current situation but small in comparison to the total land use. A
significant amount of currently unprotected area, both forest and grass- and woodland, is also
placed under protection. More details on all land use types are provided in this section and
subsections. We acknowledge that substantial land use planning (policy) is required to direct
land use in the correct manner. This is discussed further in Section 7.2.3.
166A Sustainable Energy Supply for Everyone
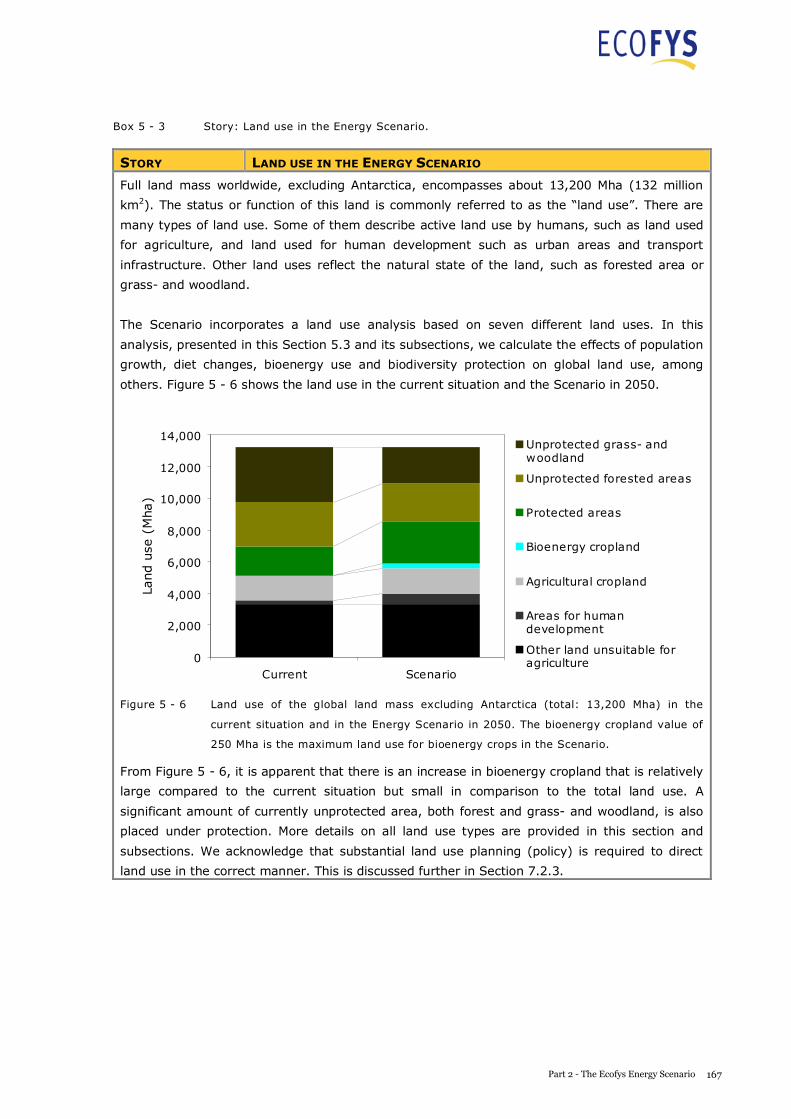
A S USTAI NABLE E NERGY S UPPLY F OR EVERY ONE
Box 5 - 3 Story: Land use in the Energy Scenario.
STORY LAND USE IN THE ENERGY SCENARIO
Full land mass worldwide, excluding Antarctica, encompasses about 13,200 Mha (132 million
km2). The status or function of this land is commonly referred to as the “land use”. There are
many types of land use. Some of them describe active land use by humans, such as land used
for agriculture, and land used for human development such as urban areas and transport
infrastructure. Other land uses reflect the natural state of the land, such as forested area or
grass- and woodland.
The Scenario incorporates a land use analysis based on seven different land uses. In this
analysis, presented in this Section 5.3 and its subsections, we calculate the effects of population
growth, diet changes, bioenergy use and biodiversity protection on global land use, among
others. Figure 5 - 6 shows the land use in the current situation and the Scenario in 2050.
0
2,000
4,000
6,000
8,000
10,000
12,000
14,000
Current Scenario
Land
use
(Mha
)
Unprotected grass- andwoodland
Unprotected forested areas
Protected areas
Bioenergy cropland
Agricultural cropland
Areas for humandevelopment
Other land unsuitable foragriculture
Figure 5 - 6 Land use of the global land mass excluding Antarctica (total: 13,200 Mha) in the
current situation and in the Energy Scenario in 2050. The bioenergy cropland value of
250 Mha is the maximum land use for bioenergy crops in the Scenario.
From Figure 5 - 6, it is apparent that there is an increase in bioenergy cropland that is relatively
large compared to the current situation but small in comparison to the total land use. A
significant amount of currently unprotected area, both forest and grass- and woodland, is also
placed under protection. More details on all land use types are provided in this section and
subsections. We acknowledge that substantial land use planning (policy) is required to direct
land use in the correct manner. This is discussed further in Section 7.2.3.
167Part 2 - The Ecofys Energy Scenario
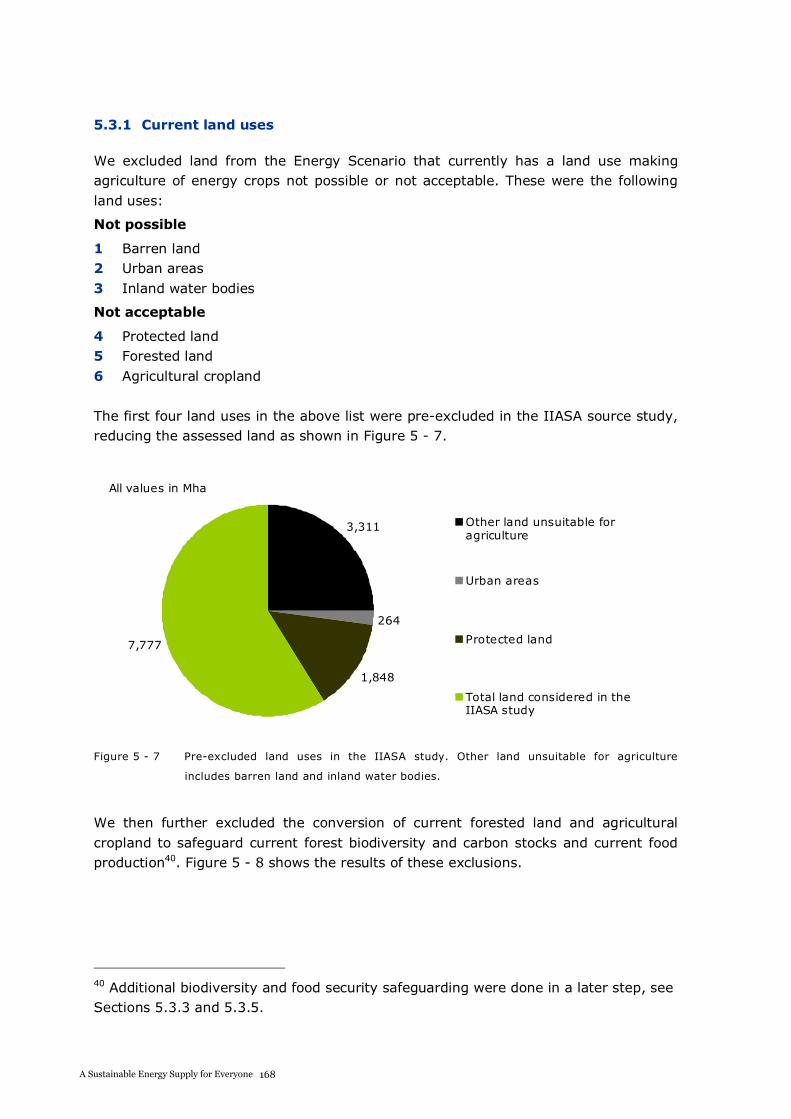
A S USTAI NABLE E NERGY S UPPLY F OR EVERY ONE
5.3.1 Current land uses
We excluded land from the Energy Scenario that currently has a land use making agriculture of energy crops not possible or not acceptable. These were the following land uses:
Not possible
1 Barren land 2 Urban areas 3 Inland water bodies
Not acceptable
4 Protected land 5 Forested land 6 Agricultural cropland
The first four land uses in the above list were pre-excluded in the IIASA source study, reducing the assessed land as shown in Figure 5 - 7.
3,311
264
1,848
7,777
Other land unsuitable foragriculture
Urban areas
Protected land
Total land considered in theIIASA study
All values in Mha
Figure 5 - 7 Pre-excluded land uses in the IIASA study. Other land unsuitable for agriculture
includes barren land and inland water bodies.
We then further excluded the conversion of current forested land and agricultural cropland to safeguard current forest biodiversity and carbon stocks and current food production40. Figure 5 - 8 shows the results of these exclusions.
40 Additional biodiversity and food security safeguarding were done in a later step, see Sections 5.3.3 and 5.3.5.
A S USTAI NABLE E NERGY S UPPLY F OR EVERY ONE
1,563
2,806
3,408
Current agricultural cropland
Unprotected forested land
Total land considered inScenario assesment
All values in Mha
Figure 5 - 8 Land exclusions in the Scenario based on current land use for agricultural cropland or
as unprotected forested land.
In total, 3,408 Mha of the initial 13,200 Mha remained after these exclusions of current land uses.
5.3.2 Suitability of land for rain-fed agriculture
We also ensured that no unsustainable water input would be necessary for energy crop cultivation. Therefore, we excluded all land that was found to be either not suitable or only marginally suitable for rain-fed agriculture in the IIASA study. Figure 5 - 9 shows the results of this step.
In total, 893 Mha of the initial 3,408 Mha remained after these exclusions.
5.3.3 Biodiversity protection
The German Advisory Council on Global Change (WBGU) performed a study on the conservation of the biosphere [WBGU, 1999]. One of the conclusions of this work was that between 10–20% of the world land mass should be protected to preserve the different functions of the biosphere, such as climate regulation, and its biodiversity.
The most recent statistics provided by the World Database on Protected Areas state that 14% of the land mass is currently protected. [WDPA, 2009]
168A Sustainable Energy Supply for Everyone
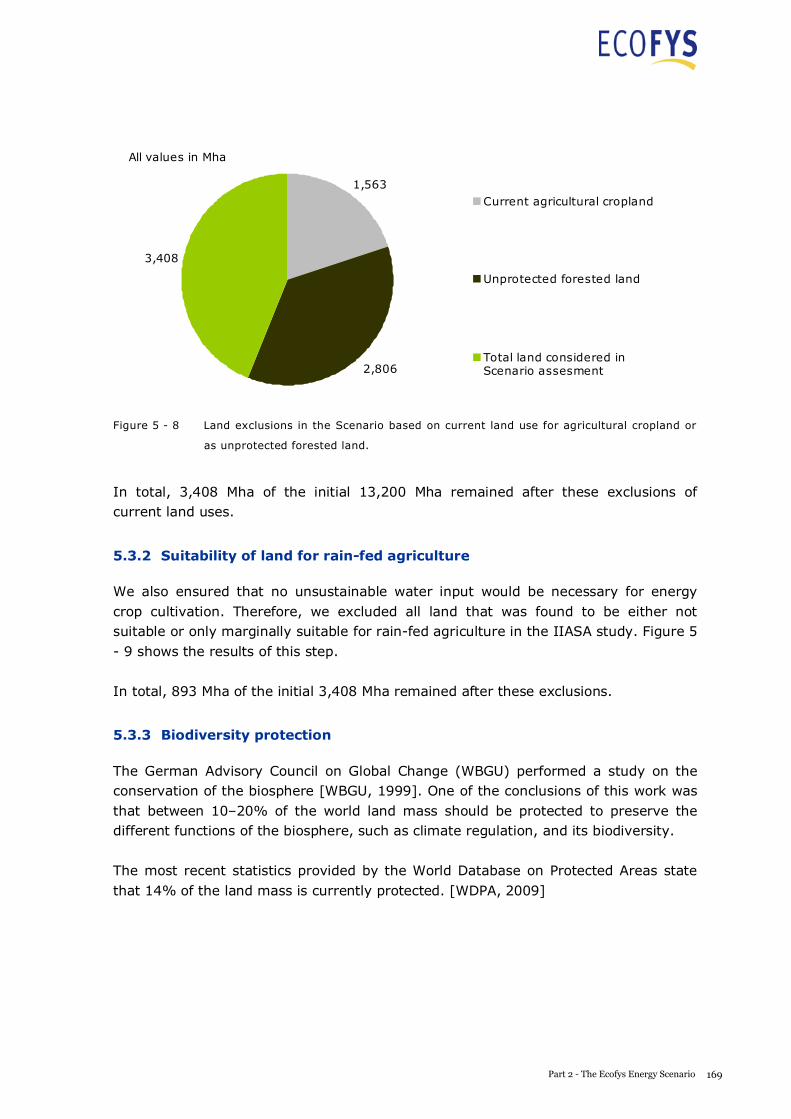
A S USTAI NABLE E NERGY S UPPLY F OR EVERY ONE
1,563
2,806
3,408
Current agricultural cropland
Unprotected forested land
Total land considered inScenario assesment
All values in Mha
Figure 5 - 8 Land exclusions in the Scenario based on current land use for agricultural cropland or
as unprotected forested land.
In total, 3,408 Mha of the initial 13,200 Mha remained after these exclusions of current land uses.
5.3.2 Suitability of land for rain-fed agriculture
We also ensured that no unsustainable water input would be necessary for energy crop cultivation. Therefore, we excluded all land that was found to be either not suitable or only marginally suitable for rain-fed agriculture in the IIASA study. Figure 5 - 9 shows the results of this step.
In total, 893 Mha of the initial 3,408 Mha remained after these exclusions.
5.3.3 Biodiversity protection
The German Advisory Council on Global Change (WBGU) performed a study on the conservation of the biosphere [WBGU, 1999]. One of the conclusions of this work was that between 10–20% of the world land mass should be protected to preserve the different functions of the biosphere, such as climate regulation, and its biodiversity.
The most recent statistics provided by the World Database on Protected Areas state that 14% of the land mass is currently protected. [WDPA, 2009]
169Part 2 - The Ecofys Energy Scenario
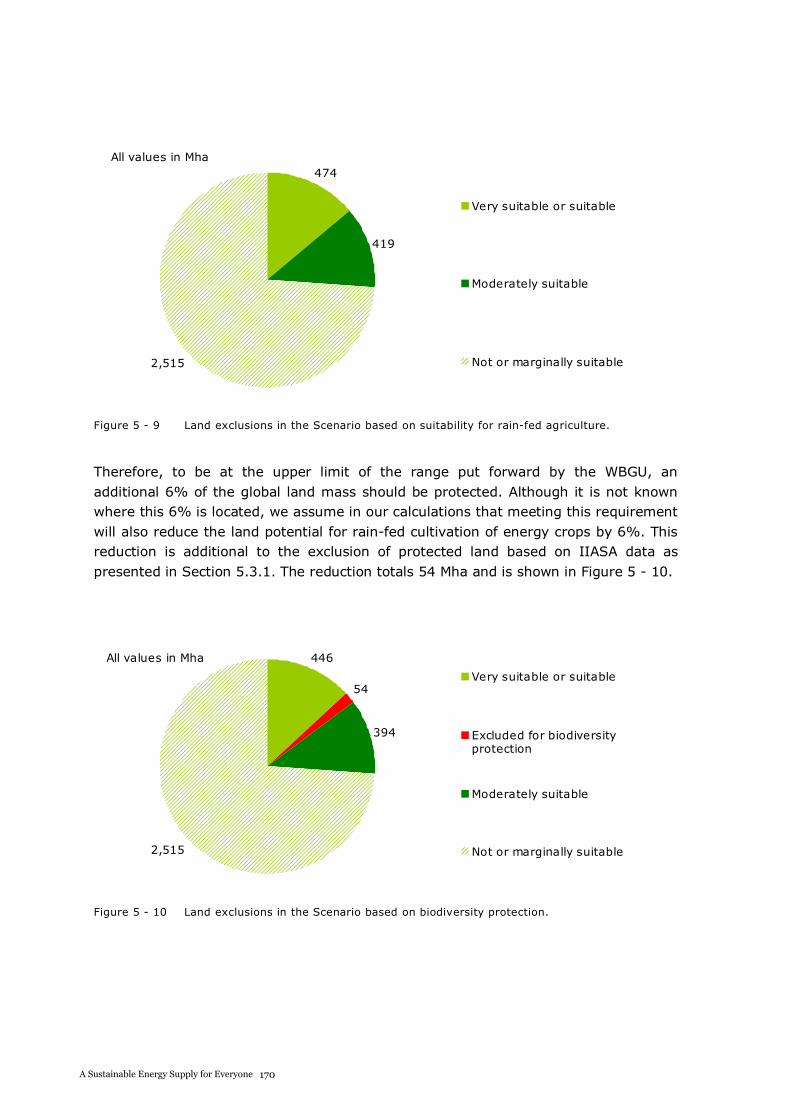
170A Sustainable Energy Supply for Everyone
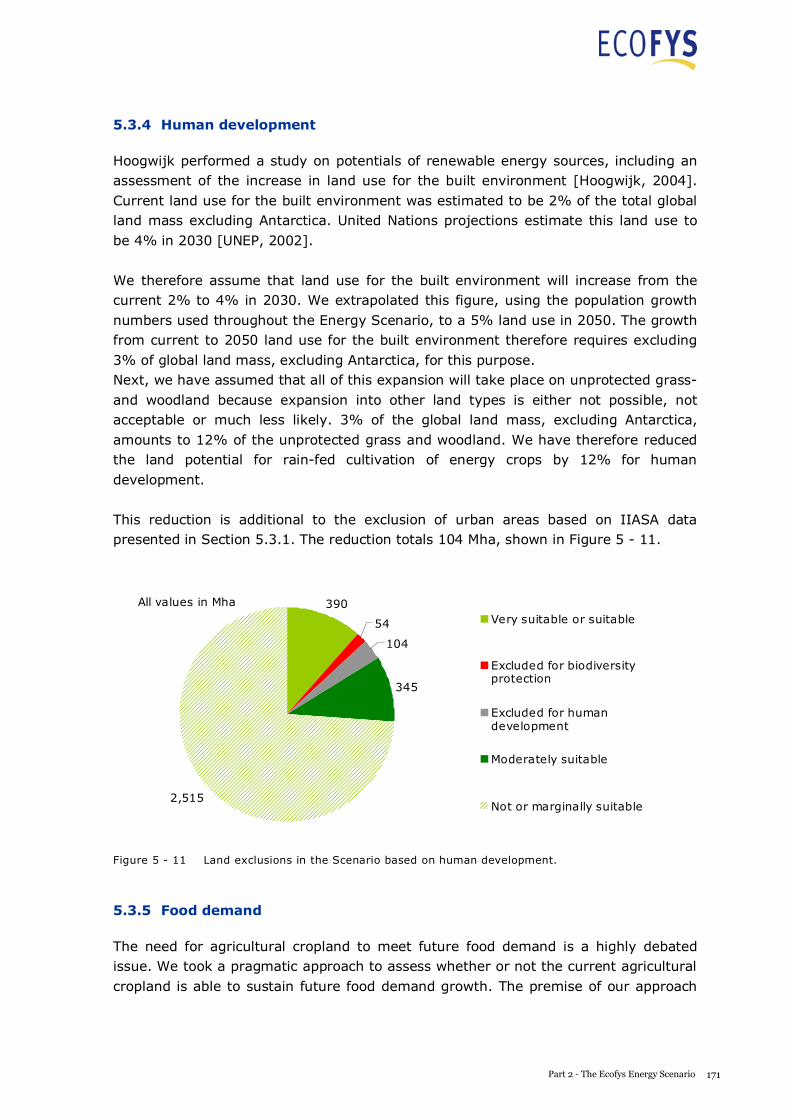
171Part 2 - The Ecofys Energy Scenario
A S USTAI NABLE E NERGY S UPPLY F OR EVERY ONE
was the assumption that, in 2005, food supply equalled food demand41; both were indexed at 100%. We then forecast their evolution to 2050 as follows:
We extrapolated the growth in food demand using the following stepwise approach: 1 We started with current per capita calorie values [FAOSTAT, 2010b] of
~2,400 plant kilocalories per capita and 350 and 950 animal product kilocalories in non-OECD and OECD regions, respectively42. Animal product calories were converted into crop equivalents with conversion factors based on the crop feed intake necessary to produce them. The basis for these factors43 were feed intakes of ~17 (meat) , ~2.4 (eggs) and ~1.7 (dairy) kg of feed per kg of produced animal product.
2 We calculated a “business-as-usual” (BAU) per capita diet in the period 2005–2050 differentiated between OECD and non-OECD countries. This was done based on existing diet projections [FAO, 2006].
3 We then assumed that total animal product consumption worldwide will be constrained to a growth of no more than ~65% between 2005 and 2050, which means that the average animal product consumption per capita (in crop equivalents) increases by about 10% over the same timeframe, given population projections.44
41 This means that we do not make assumptions on changes of food distribution patterns when forecasting future demand and supply. It does not mean that current food distribution patterns should be maintained. There clearly is an imbalance in food distribution globally currently, but this topic was not part of this study. 42 Of which ~210 (non-OECD) and ~480 (OECD) calories are meat products, and the rest are dairy, eggs, fish etc. 43 For meat, this factor was derived from literature values for feed efficiencies per animal type [Smeets, 2008] and current distribution of consumption of meat per animal type [FAO, 2006], which is a mixed diet of bovine, ovine, pig and poultry products. For eggs, literature values from [Blonk, 2008] were used. For dairy, literature values from [Smeets, 2008; Pimentel, 2003; Linn, 2006] were used. The feed is assumed to have an energy content of 19 MJ/kg of dry matter. [Smeets, 2008] 44 This can be achieved in the following diet scenario, which should only be considered as an example:
The diet has the same meat (and egg) intensity in both OECD and non-OECD countries by 2050. This diet means a ~50% reduction in meat consumption (constant in egg consumption) in 2050 compared to 2005 in OECD countries and an ~25% growth in meat consumption (60% in egg consumption) in non-OECD countries. Dairy product consumption is held constant in OECD regions and more than doubled in non-OECD regions to reach ~50% of the OECD per-capita intensity in 2050. The overall daily per capita food intake in this meat-constrained diet is about 2,800 kilocalories per capita per day in non-OECD regions and 3,000 in OECD
A S USTAI NABLE E NERGY S UPPLY F OR EVERY ONE
4 We then multiplied the constrained per capita diets with Scenario population growth numbers to get a total growth in food demand in crop equivalents. This was indexed against 2005 and is presented in the yellow line in the graph in Figure 5 - 12.
We extrapolated the growth in food supplied by the current agricultural croplandby using a yield increase of 1% per year. This value is an intermediate value in a range of yield increase projections of 0.4 to 1.5% found in literature [FAO, 2009; FAO, 2006; PBL, 2009; IIASTD, 2009; Erb, 2009]. The impact of climate change on yield projections was not explicitly considered in this analysis. However, by choosing the intermediate value of yield increase projections we have tried to be moderate in our assumptions.
This yield increase was applied to the indexed value in 2005 of 100% and is represented by the blue line of the graph in Figure 5 - 12. For reference, Figure 5 - 12 also contains the indexed yield development of coarse grains over the last 50 years, which has been higher than the 1% assumed in the Energy Scenario.
0%
20%
40%
60%
80%
100%
120%
140%
160%
180%
1960 1970 1980 1990 2000 2010 2020 2030 2040 2050
Val
ue
(index
edon
2005)
Yield
Demand
Yield of coarsegrains (example)
63 Mha additional needed in 2035
Figure 5 - 12 Calculation of land exclusions in the Scenario based on global food security.
From the graph in Figure 5 - 12 it can be observed that, under our Scenario’s assumptions the current agricultural cropland is projected to be able to supply the entire food demand for 2050. However, in intermediate years this is not always the case. We have calculated that the maximum shortage of food from current agricultural cropland occurs in 2035 and amounts to about 4% of current agricultural cropland. This totals 63 Mha.
regions. This means an ~10% decrease in 2050 compared to 2005 in OECD countries and a ~10% growth in non-OECD countries.
172A Sustainable Energy Supply for Everyone
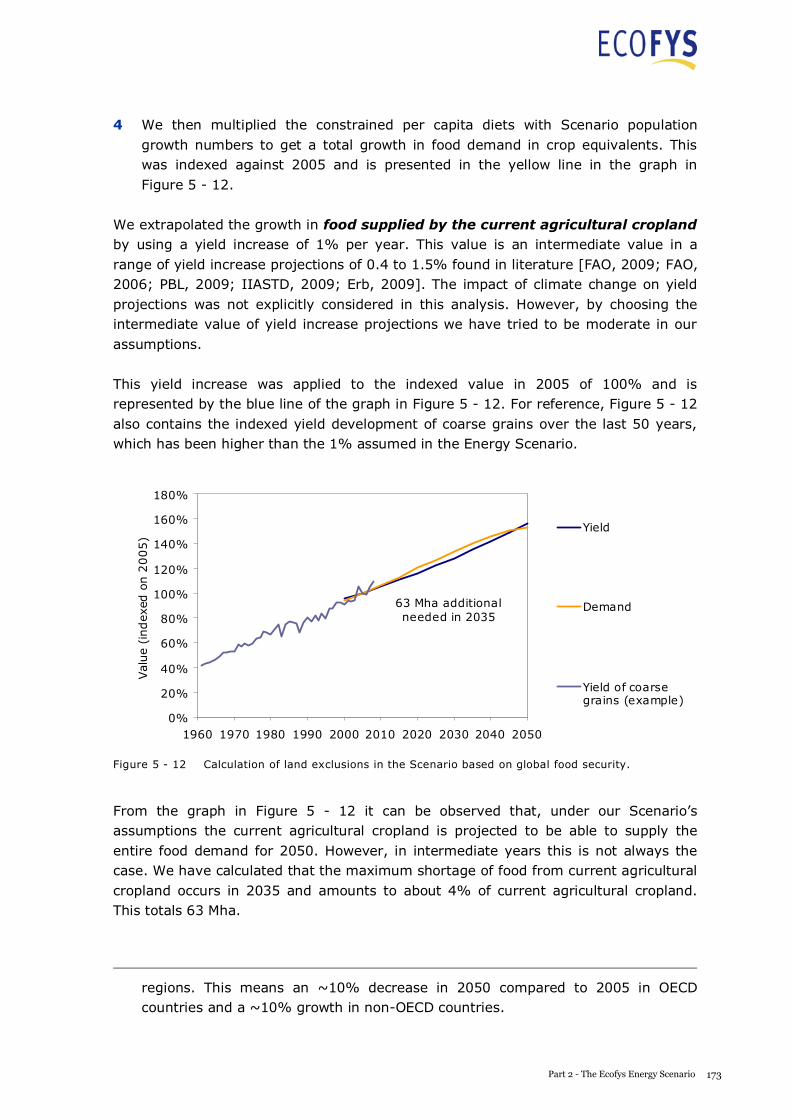
A S USTAI NABLE E NERGY S UPPLY F OR EVERY ONE
4 We then multiplied the constrained per capita diets with Scenario population growth numbers to get a total growth in food demand in crop equivalents. This was indexed against 2005 and is presented in the yellow line in the graph in Figure 5 - 12.
We extrapolated the growth in food supplied by the current agricultural croplandby using a yield increase of 1% per year. This value is an intermediate value in a range of yield increase projections of 0.4 to 1.5% found in literature [FAO, 2009; FAO, 2006; PBL, 2009; IIASTD, 2009; Erb, 2009]. The impact of climate change on yield projections was not explicitly considered in this analysis. However, by choosing the intermediate value of yield increase projections we have tried to be moderate in our assumptions.
This yield increase was applied to the indexed value in 2005 of 100% and is represented by the blue line of the graph in Figure 5 - 12. For reference, Figure 5 - 12 also contains the indexed yield development of coarse grains over the last 50 years, which has been higher than the 1% assumed in the Energy Scenario.
0%
20%
40%
60%
80%
100%
120%
140%
160%
180%
1960 1970 1980 1990 2000 2010 2020 2030 2040 2050
Val
ue
(index
edon
2005)
Yield
Demand
Yield of coarsegrains (example)
63 Mha additional needed in 2035
Figure 5 - 12 Calculation of land exclusions in the Scenario based on global food security.
From the graph in Figure 5 - 12 it can be observed that, under our Scenario’s assumptions the current agricultural cropland is projected to be able to supply the entire food demand for 2050. However, in intermediate years this is not always the case. We have calculated that the maximum shortage of food from current agricultural cropland occurs in 2035 and amounts to about 4% of current agricultural cropland. This totals 63 Mha.
regions. This means an ~10% decrease in 2050 compared to 2005 in OECD countries and a ~10% growth in non-OECD countries.
173Part 2 - The Ecofys Energy Scenario
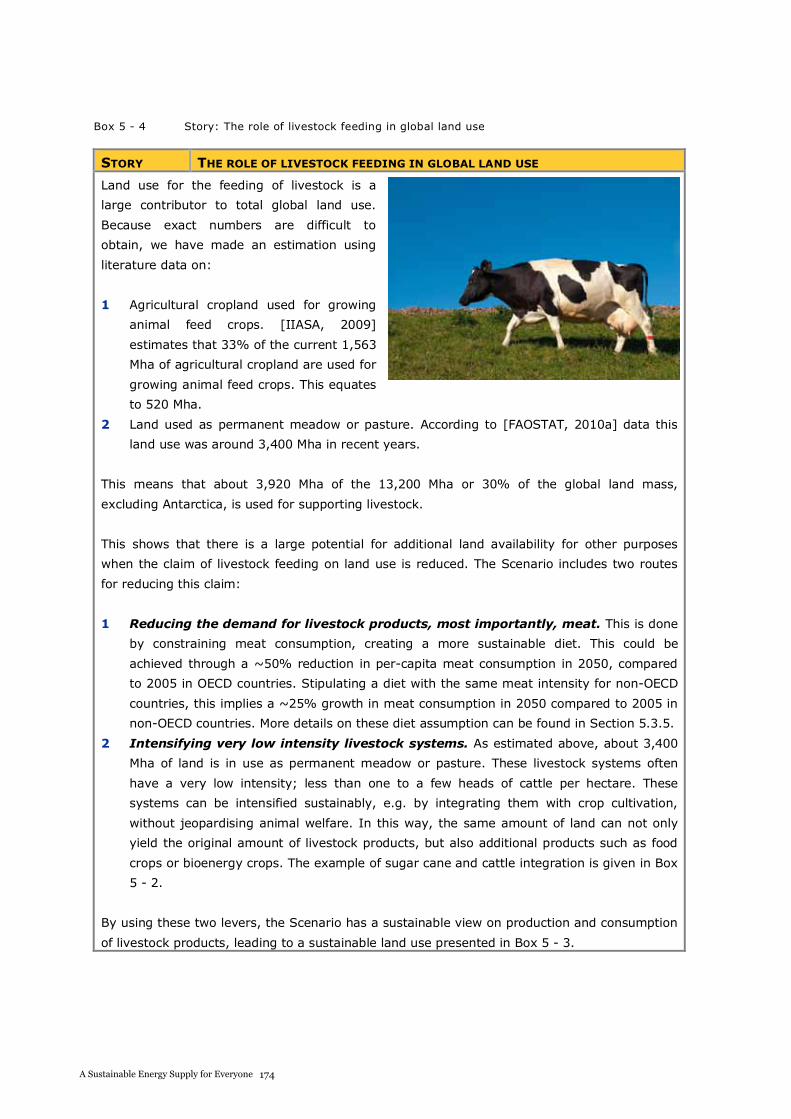
A S USTAI NABLE E NERGY S UPPLY F OR EVERY ONE
Box 5 - 4 Story: The role of livestock feeding in global land use
STORY THE ROLE OF LIVESTOCK FEEDING IN GLOBAL LAND USE
Land use for the feeding of livestock is a
large contributor to total global land use.
Because exact numbers are difficult to
obtain, we have made an estimation using
literature data on:
1 Agricultural cropland used for growing
animal feed crops. [IIASA, 2009]
estimates that 33% of the current 1,563
Mha of agricultural cropland are used for
growing animal feed crops. This equates
to 520 Mha.
2 Land used as permanent meadow or pasture. According to [FAOSTAT, 2010a] data this
land use was around 3,400 Mha in recent years.
This means that about 3,920 Mha of the 13,200 Mha or 30% of the global land mass,
excluding Antarctica, is used for supporting livestock.
This shows that there is a large potential for additional land availability for other purposes
when the claim of livestock feeding on land use is reduced. The Scenario includes two routes
for reducing this claim:
1 Reducing the demand for livestock products, most importantly, meat. This is done
by constraining meat consumption, creating a more sustainable diet. This could be
achieved through a ~50% reduction in per-capita meat consumption in 2050, compared
to 2005 in OECD countries. Stipulating a diet with the same meat intensity for non-OECD
countries, this implies a ~25% growth in meat consumption in 2050 compared to 2005 in
non-OECD countries. More details on these diet assumption can be found in Section 5.3.5.
2 Intensifying very low intensity livestock systems. As estimated above, about 3,400
Mha of land is in use as permanent meadow or pasture. These livestock systems often
have a very low intensity; less than one to a few heads of cattle per hectare. These
systems can be intensified sustainably, e.g. by integrating them with crop cultivation,
without jeopardising animal welfare. In this way, the same amount of land can not only
yield the original amount of livestock products, but also additional products such as food
crops or bioenergy crops. The example of sugar cane and cattle integration is given in Box
5 - 2.
By using these two levers, the Scenario has a sustainable view on production and consumption
of livestock products, leading to a sustainable land use presented in Box 5 - 3.
A S USTAI NABLE E NERGY S UPPLY F OR EVERY ONE
Box 5 - 5 Contingency: Modelling the future demand for, and supply of, food.
CONTINGENCY MODELLING THE FUTURE DEMAND FOR AND SUPPLY OF FOOD
Food is the most important agricultural product in the world. This is reflected by the fact that
practically all agricultural production is directed at feeding the world’s population directly, or
indirectly by feeding livestock that supplies animal products. Other agricultural products, such
as fibres for clothing, biomass for energy generation and tobacco production, make up a very
small share of the total current agricultural production.
This means that modelling the food demand and supply and the balance between them, is
important for all agricultural and land use analyses, including the Scenario’s bioenergy
potential analysis. This is a complex task for the following reasons:
Demand: future food demand depends on the size of the world’s population and the
composition of its diet. This diet, in turn, depends on parameters such as wealth and
cultural choice. Particularly important is the intensity of animal products in that diet, as
these require a large amount of animal feed.
Supply: future food supply depends on the area available for food cultivation and the food
yield per area unit. The development of this yield is hard to predict over longer timescales
because it depends on numerous factors such as R&D results, technology adoption,
education and sustainability requirements.
Balance of demand and supply: the balance between food supply and demand is poorly
understood. It is often argued that the current food supply is adequate for the entire
global demand, but that distribution problems lead to food shortages in parts of the
world45.
The land available for bioenergy cropping in the Energy Scenario is strongly dependent on the
assumptions made in the food analysis. Where possible, we have used conservative
assumptions, with one notable exception, that we have included a constraint on the
consumption of meat, creating a more sustainable diet, see Section 5.3.5.
45 The Energy Report does not make explicit assumptions on changes in the food distribution system. This means that in terms of the calculations here, we assume that food supply and demand are in balance now and will remain in balance in the future. Balance means that there is no shortage of food production at the global level for which we would need to ‘set aside’ additional land and that there is no overuse of cropland at the global level which could be taken out of food production without affecting supply. This does not mean that local shortages or oversupplies do not exist, but merely that the Scenario makes no assumption on these patterns changing in one way or another in the future. Reducing waste in the food and agricultural sector may improve the situation; this was not in the scope of this study but additional research into this issue would be valuable.
174A Sustainable Energy Supply for Everyone
A S USTAI NABLE E NERGY S UPPLY F OR EVERY ONE
Box 5 - 5 Contingency: Modelling the future demand for, and supply of, food.
CONTINGENCY MODELLING THE FUTURE DEMAND FOR AND SUPPLY OF FOOD
Food is the most important agricultural product in the world. This is reflected by the fact that
practically all agricultural production is directed at feeding the world’s population directly, or
indirectly by feeding livestock that supplies animal products. Other agricultural products, such
as fibres for clothing, biomass for energy generation and tobacco production, make up a very
small share of the total current agricultural production.
This means that modelling the food demand and supply and the balance between them, is
important for all agricultural and land use analyses, including the Scenario’s bioenergy
potential analysis. This is a complex task for the following reasons:
Demand: future food demand depends on the size of the world’s population and the
composition of its diet. This diet, in turn, depends on parameters such as wealth and
cultural choice. Particularly important is the intensity of animal products in that diet, as
these require a large amount of animal feed.
Supply: future food supply depends on the area available for food cultivation and the food
yield per area unit. The development of this yield is hard to predict over longer timescales
because it depends on numerous factors such as R&D results, technology adoption,
education and sustainability requirements.
Balance of demand and supply: the balance between food supply and demand is poorly
understood. It is often argued that the current food supply is adequate for the entire
global demand, but that distribution problems lead to food shortages in parts of the
world45.
The land available for bioenergy cropping in the Energy Scenario is strongly dependent on the
assumptions made in the food analysis. Where possible, we have used conservative
assumptions, with one notable exception, that we have included a constraint on the
consumption of meat, creating a more sustainable diet, see Section 5.3.5.
45 The Energy Report does not make explicit assumptions on changes in the food distribution system. This means that in terms of the calculations here, we assume that food supply and demand are in balance now and will remain in balance in the future. Balance means that there is no shortage of food production at the global level for which we would need to ‘set aside’ additional land and that there is no overuse of cropland at the global level which could be taken out of food production without affecting supply. This does not mean that local shortages or oversupplies do not exist, but merely that the Scenario makes no assumption on these patterns changing in one way or another in the future. Reducing waste in the food and agricultural sector may improve the situation; this was not in the scope of this study but additional research into this issue would be valuable.
175Part 2 - The Ecofys Energy Scenario
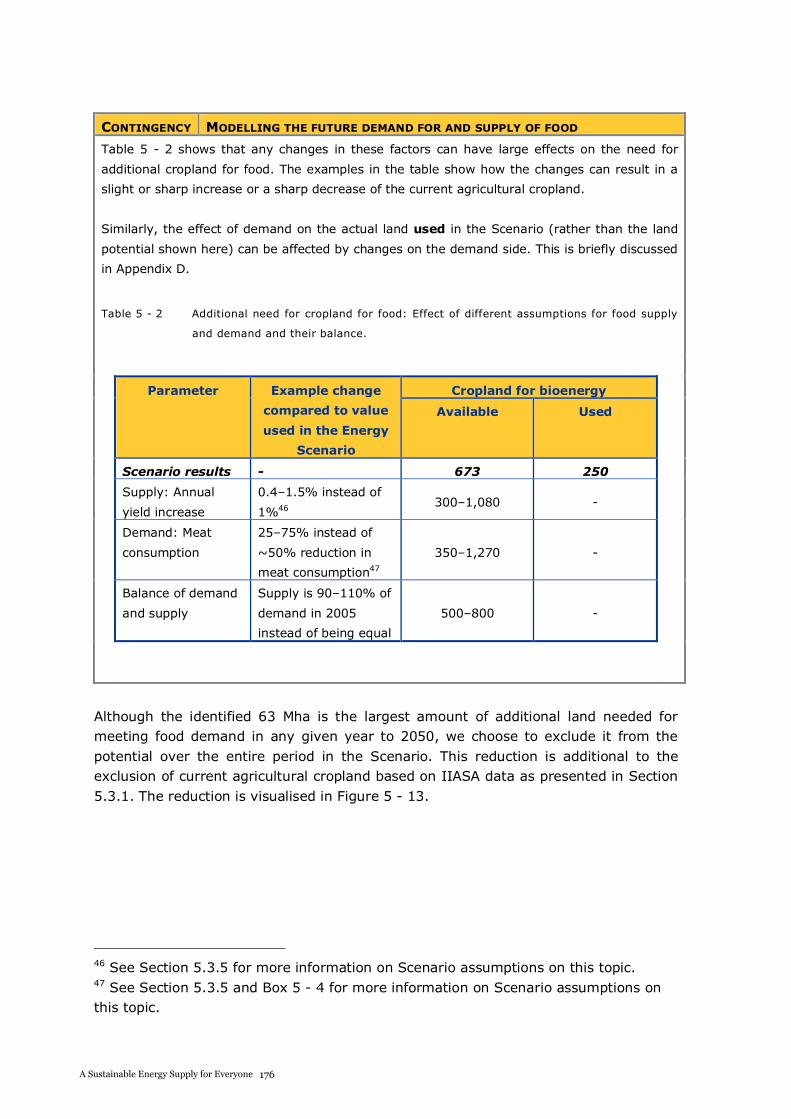
A S USTAI NABLE E NERGY S UPPLY F OR EVERY ONE
CONTINGENCY MODELLING THE FUTURE DEMAND FOR AND SUPPLY OF FOOD
Table 5 - 2 shows that any changes in these factors can have large effects on the need for
additional cropland for food. The examples in the table show how the changes can result in a
slight or sharp increase or a sharp decrease of the current agricultural cropland.
Similarly, the effect of demand on the actual land used in the Scenario (rather than the land
potential shown here) can be affected by changes on the demand side. This is briefly discussed
in Appendix D.
Table 5 - 2 Additional need for cropland for food: Effect of different assumptions for food supply
and demand and their balance.
Parameter Example change
compared to value
used in the Energy
Scenario
Cropland for bioenergy
Available Used
Scenario results - 673 250
Supply: Annual
yield increase
0.4–1.5% instead of
1%46 300–1,080 -
Demand: Meat
consumption
25–75% instead of
~50% reduction in
meat consumption47
350–1,270 -
Balance of demand
and supply
Supply is 90–110% of
demand in 2005
instead of being equal
500–800 -
Although the identified 63 Mha is the largest amount of additional land needed for meeting food demand in any given year to 2050, we choose to exclude it from the potential over the entire period in the Scenario. This reduction is additional to the exclusion of current agricultural cropland based on IIASA data as presented in Section 5.3.1. The reduction is visualised in Figure 5 - 13.
46 See Section 5.3.5 for more information on Scenario assumptions on this topic. 47 See Section 5.3.5 and Box 5 - 4 for more information on Scenario assumptions on this topic.
176A Sustainable Energy Supply for Everyone
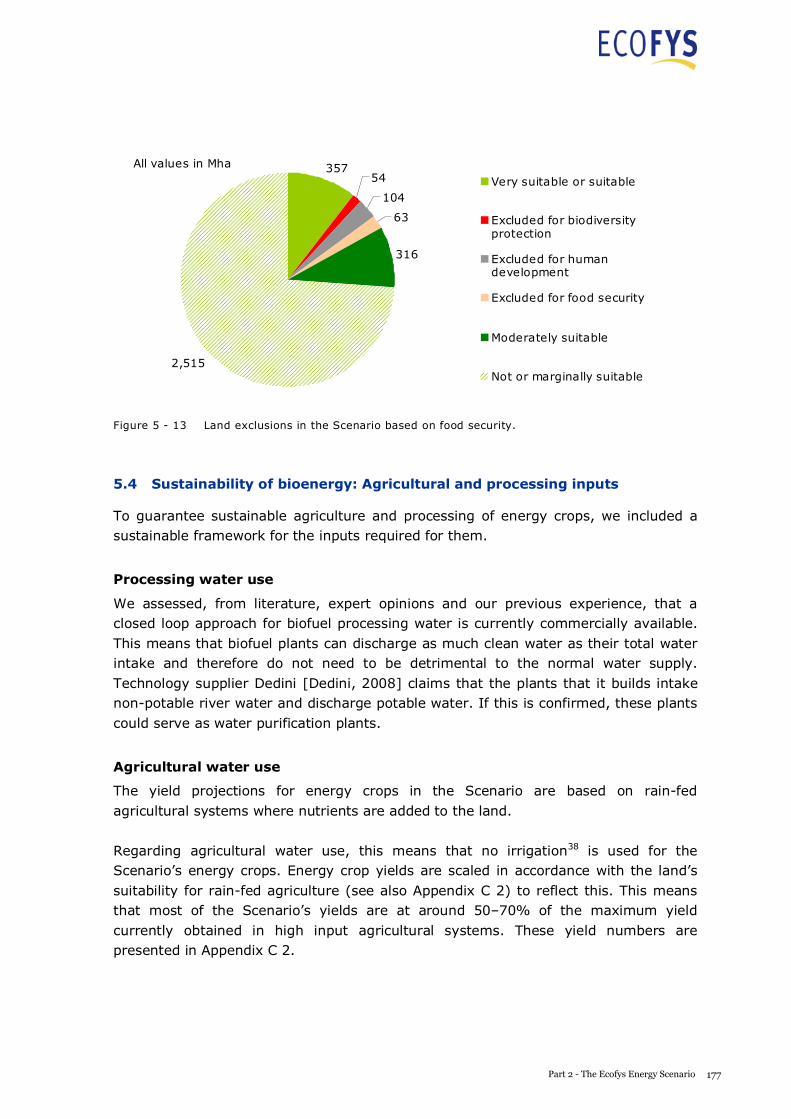
A S USTAI NABLE E NERGY S UPPLY F OR EVERY ONE
35754
104
63
316
2,515
Very suitable or suitable
Excluded for biodiversityprotection
Excluded for humandevelopment
Excluded for food security
Moderately suitable
Not or marginally suitable
All values in Mha
Figure 5 - 13 Land exclusions in the Scenario based on food security.
5.4 Sustainability of bioenergy: Agricultural and processing inputs
To guarantee sustainable agriculture and processing of energy crops, we included a sustainable framework for the inputs required for them.
Processing water use
We assessed, from literature, expert opinions and our previous experience, that a closed loop approach for biofuel processing water is currently commercially available. This means that biofuel plants can discharge as much clean water as their total water intake and therefore do not need to be detrimental to the normal water supply. Technology supplier Dedini [Dedini, 2008] claims that the plants that it builds intake non-potable river water and discharge potable water. If this is confirmed, these plants could serve as water purification plants.
Agricultural water use
The yield projections for energy crops in the Scenario are based on rain-fed agricultural systems where nutrients are added to the land.
Regarding agricultural water use, this means that no irrigation38 is used for the Scenario’s energy crops. Energy crop yields are scaled in accordance with the land’s suitability for rain-fed agriculture (see also Appendix C 2) to reflect this. This means that most of the Scenario’s yields are at around 50–70% of the maximum yield currently obtained in high input agricultural systems. These yield numbers are presented in Appendix C 2.
177Part 2 - The Ecofys Energy Scenario
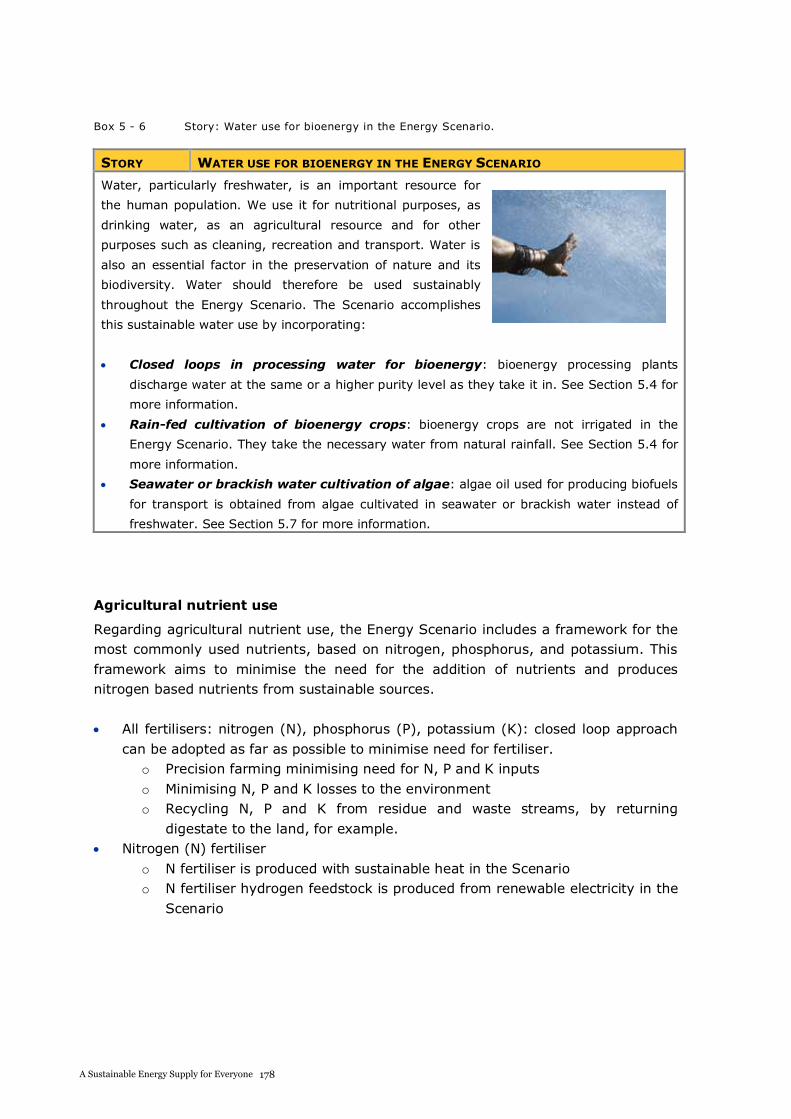
A S USTAI NABLE E NERGY S UPPLY F OR EVERY ONE
Box 5 - 6 Story: Water use for bioenergy in the Energy Scenario.
STORY WATER USE FOR BIOENERGY IN THE ENERGY SCENARIO
Water, particularly freshwater, is an important resource for
the human population. We use it for nutritional purposes, as
drinking water, as an agricultural resource and for other
purposes such as cleaning, recreation and transport. Water is
also an essential factor in the preservation of nature and its
biodiversity. Water should therefore be used sustainably
throughout the Energy Scenario. The Scenario accomplishes
this sustainable water use by incorporating:
Closed loops in processing water for bioenergy: bioenergy processing plants
discharge water at the same or a higher purity level as they take it in. See Section 5.4 for
more information.
Rain-fed cultivation of bioenergy crops: bioenergy crops are not irrigated in the
Energy Scenario. They take the necessary water from natural rainfall. See Section 5.4 for
more information.
Seawater or brackish water cultivation of algae: algae oil used for producing biofuels
for transport is obtained from algae cultivated in seawater or brackish water instead of
freshwater. See Section 5.7 for more information.
Agricultural nutrient use
Regarding agricultural nutrient use, the Energy Scenario includes a framework for the most commonly used nutrients, based on nitrogen, phosphorus, and potassium. This framework aims to minimise the need for the addition of nutrients and produces nitrogen based nutrients from sustainable sources.
All fertilisers: nitrogen (N), phosphorus (P), potassium (K): closed loop approach can be adopted as far as possible to minimise need for fertiliser.
o Precision farming minimising need for N, P and K inputs o Minimising N, P and K losses to the environment o Recycling N, P and K from residue and waste streams, by returning
digestate to the land, for example. Nitrogen (N) fertiliser
o N fertiliser is produced with sustainable heat in the Scenario o N fertiliser hydrogen feedstock is produced from renewable electricity in the
Scenario
A S USTAI NABLE E NERGY S UPPLY F OR EVERY ONE
Therefore, to ensure the most sustainable nutrient use possible, we included in the demand side of the Scenario model:
All heat energy input required to produce N fertiliser for bioenergy cropping All electricity required to produce hydrogen for N fertiliser for bioenergy cropping. This mechanism can also be used as storage for supply-driven renewable electricity sources
As nitrogen from air is the only other necessary component for the current method of N fertiliser production48, N fertiliser production for bioenergy cropping is fully sustainable as long as the required electricity is extracted from sustainable sources as it is in the Energy Scenario.
In addition, we advise a closed loop approach for nutrients as much as possible by using precision farming techniques, minimising nutrient losses and recycling nutrients from residue and waste streams. The trend in this direction has already begun in agriculture in developed countries due to economic or policy considerations on nutrient application, for example.
Precision farming aims to adjust nutrient application to the exact need of the crop. Nutrient losses can be minimised by improved application methods where nutrients are applied in such a way that they are less susceptible to runoff. Nutrient recycling can be achieved by returning nutrient-rich residues and waste to agricultural land. This can include nutrient recovery from returning digestate from wet waste (e.g. manure) digestion to the land as a fertiliser, as the nutrients are preserved during the digesting step, see Section 5.6. Another example would be nutrient recovery from human sewage streams. We acknowledge that the necessary technologies and practices for such a closed approach need to be further refined and more widely adopted before it can be optimised.
5.5 Sustainability of bioenergy: Complementary fellings
Wood from forests is harvested for different purposes, such as construction, paper production or energy production. We have analysed the sustainable potential for the harvesting of woody biomass from forests for energy purposes in the Energy Scenario, taking into consideration the demand for wood for other purposes. These sustainable complementary fellings consist of two components which are discussed here.
48 In current N fertiliser production, natural gas reacts gas with air at high temperatures and pressures to produce ammonia which is further processed into N fertilizer. As the natural gas is both a source for heat as for hydrogen, we have replaced this with sustainable heat and hydrogen in our Scenario.
178A Sustainable Energy Supply for Everyone
A S USTAI NABLE E NERGY S UPPLY F OR EVERY ONE
Therefore, to ensure the most sustainable nutrient use possible, we included in the demand side of the Scenario model:
All heat energy input required to produce N fertiliser for bioenergy cropping All electricity required to produce hydrogen for N fertiliser for bioenergy cropping. This mechanism can also be used as storage for supply-driven renewable electricity sources
As nitrogen from air is the only other necessary component for the current method of N fertiliser production48, N fertiliser production for bioenergy cropping is fully sustainable as long as the required electricity is extracted from sustainable sources as it is in the Energy Scenario.
In addition, we advise a closed loop approach for nutrients as much as possible by using precision farming techniques, minimising nutrient losses and recycling nutrients from residue and waste streams. The trend in this direction has already begun in agriculture in developed countries due to economic or policy considerations on nutrient application, for example.
Precision farming aims to adjust nutrient application to the exact need of the crop. Nutrient losses can be minimised by improved application methods where nutrients are applied in such a way that they are less susceptible to runoff. Nutrient recycling can be achieved by returning nutrient-rich residues and waste to agricultural land. This can include nutrient recovery from returning digestate from wet waste (e.g. manure) digestion to the land as a fertiliser, as the nutrients are preserved during the digesting step, see Section 5.6. Another example would be nutrient recovery from human sewage streams. We acknowledge that the necessary technologies and practices for such a closed approach need to be further refined and more widely adopted before it can be optimised.
5.5 Sustainability of bioenergy: Complementary fellings
Wood from forests is harvested for different purposes, such as construction, paper production or energy production. We have analysed the sustainable potential for the harvesting of woody biomass from forests for energy purposes in the Energy Scenario, taking into consideration the demand for wood for other purposes. These sustainable complementary fellings consist of two components which are discussed here.
48 In current N fertiliser production, natural gas reacts gas with air at high temperatures and pressures to produce ammonia which is further processed into N fertilizer. As the natural gas is both a source for heat as for hydrogen, we have replaced this with sustainable heat and hydrogen in our Scenario.
179Part 2 - The Ecofys Energy Scenario
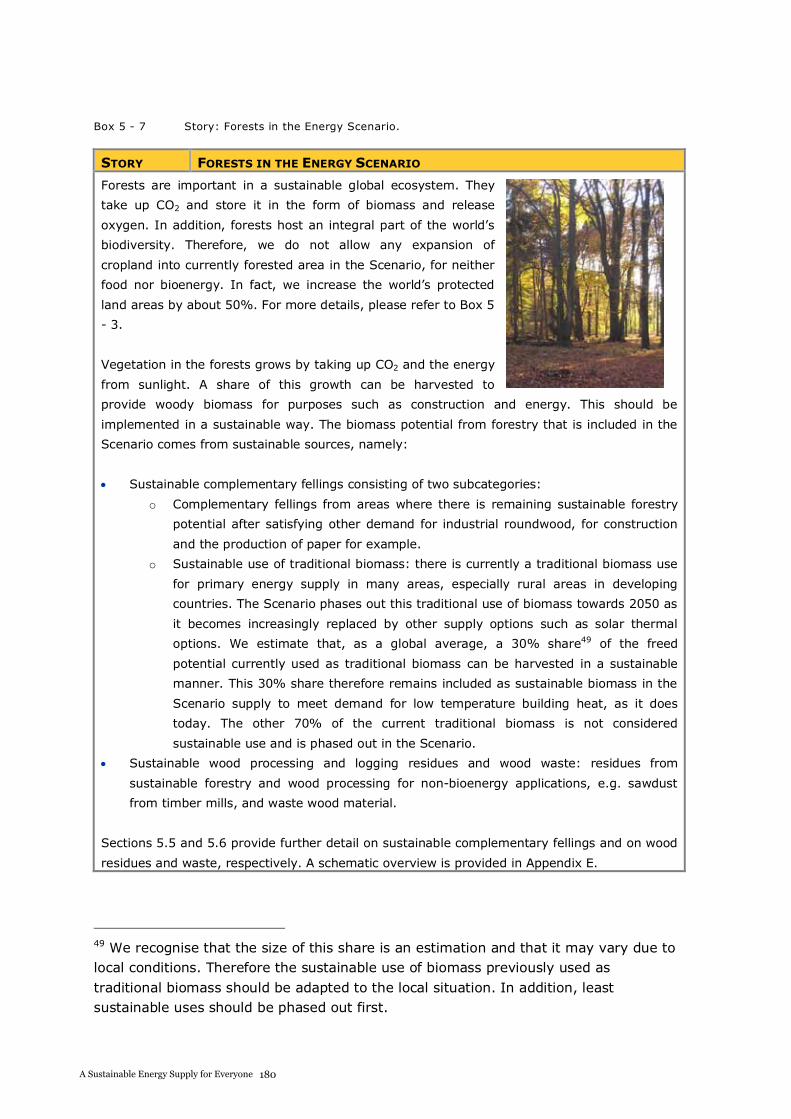
A S USTAI NABLE E NERGY S UPPLY F OR EVERY ONE
Box 5 - 7 Story: Forests in the Energy Scenario.
STORY FORESTS IN THE ENERGY SCENARIO
Forests are important in a sustainable global ecosystem. They
take up CO2 and store it in the form of biomass and release
oxygen. In addition, forests host an integral part of the world’s
biodiversity. Therefore, we do not allow any expansion of
cropland into currently forested area in the Scenario, for neither
food nor bioenergy. In fact, we increase the world’s protected
land areas by about 50%. For more details, please refer to Box 5
- 3.
Vegetation in the forests grows by taking up CO2 and the energy
from sunlight. A share of this growth can be harvested to
provide woody biomass for purposes such as construction and energy. This should be
implemented in a sustainable way. The biomass potential from forestry that is included in the
Scenario comes from sustainable sources, namely:
Sustainable complementary fellings consisting of two subcategories:
o Complementary fellings from areas where there is remaining sustainable forestry
potential after satisfying other demand for industrial roundwood, for construction
and the production of paper for example.
o Sustainable use of traditional biomass: there is currently a traditional biomass use
for primary energy supply in many areas, especially rural areas in developing
countries. The Scenario phases out this traditional use of biomass towards 2050 as
it becomes increasingly replaced by other supply options such as solar thermal
options. We estimate that, as a global average, a 30% share49 of the freed
potential currently used as traditional biomass can be harvested in a sustainable
manner. This 30% share therefore remains included as sustainable biomass in the
Scenario supply to meet demand for low temperature building heat, as it does
today. The other 70% of the current traditional biomass is not considered
sustainable use and is phased out in the Scenario.
Sustainable wood processing and logging residues and wood waste: residues from
sustainable forestry and wood processing for non-bioenergy applications, e.g. sawdust
from timber mills, and waste wood material.
Sections 5.5 and 5.6 provide further detail on sustainable complementary fellings and on wood
residues and waste, respectively. A schematic overview is provided in Appendix E.
49 We recognise that the size of this share is an estimation and that it may vary due to local conditions. Therefore the sustainable use of biomass previously used as traditional biomass should be adapted to the local situation. In addition, least sustainable uses should be phased out first.
A S USTAI NABLE E NERGY S UPPLY F OR EVERY ONE
5.5.1 Additional forest growth
Sustainable additional forest growth is defined here as growth that is currently not harvested and that:
is not needed for future growth in demand for industrial roundwood, (e.g. for construction or paper production) can be harvested in an ecologically sound way.
The Scenario’s potential for sustainable additional forest growth was primarily based on a study by Smeets [Smeets, 2008], with some modifications as described below.
According to the study, the world’s technical potential for additional forest growth would be ~64 EJ of woody biomass in 2050. However, the ecologically constrained potential is found to be ~8 EJ. The reason for this discrepancy is the exclusion of all protected, inaccessible and undisturbed areas50 from the ecological potential. This means that only areas of forest classified as ‘disturbed and currently available for wood supply’ are included. A further sustainability safeguard is the use of only commercial species in the gross annual increment, rather than all available species51.
Because the calculations by Smeets are partially based on an older source [FAO, 1998], an additional calculation was done for a selection of six countries (Brazil, Russia, Latvia, Poland, Argentina and Canada). This was considered necessary because in some of these countries, the area of ‘disturbed’ forest could have considerably changed in the time period from 1998 until today. In the additional calculation, the amount of sustainable complementary fellings resulting from the additional disturbed forest area available for wood supply, compared to the original base data, was determined, based on more recent country reports for the Global Forest Assessment 2010 (with data ranging from 2004–2008) [FAO, 2010]. This resulted in additional potential, particularly for Russia and Canada. The main differences were caused by the updated statistics on disturbed forest available for wood supply. The additional potential for the six countries was included in the ecological potential by Smeets, resulting in a total global potential for sustainable additional forest growth of ~27 EJ.
50 Safeguarding also those areas used for conservation of soil, slopes and watershed. 51 The potential is determined by the gross annual increment (i.e. forest growth in a year per area), the forest area considered and the demand for wood products. Since the value for the gross annual increment for commercial species is based on the country average, whereas in the forest areas under consideration the share of commercial species will be relatively high, the potential is likely to be underestimated here, providing a ‘buffer’ for safeguarding sustainable harvesting practices.
180A Sustainable Energy Supply for Everyone
A S USTAI NABLE E NERGY S UPPLY F OR EVERY ONE
5.5.1 Additional forest growth
Sustainable additional forest growth is defined here as growth that is currently not harvested and that:
is not needed for future growth in demand for industrial roundwood, (e.g. for construction or paper production) can be harvested in an ecologically sound way.
The Scenario’s potential for sustainable additional forest growth was primarily based on a study by Smeets [Smeets, 2008], with some modifications as described below.
According to the study, the world’s technical potential for additional forest growth would be ~64 EJ of woody biomass in 2050. However, the ecologically constrained potential is found to be ~8 EJ. The reason for this discrepancy is the exclusion of all protected, inaccessible and undisturbed areas50 from the ecological potential. This means that only areas of forest classified as ‘disturbed and currently available for wood supply’ are included. A further sustainability safeguard is the use of only commercial species in the gross annual increment, rather than all available species51.
Because the calculations by Smeets are partially based on an older source [FAO, 1998], an additional calculation was done for a selection of six countries (Brazil, Russia, Latvia, Poland, Argentina and Canada). This was considered necessary because in some of these countries, the area of ‘disturbed’ forest could have considerably changed in the time period from 1998 until today. In the additional calculation, the amount of sustainable complementary fellings resulting from the additional disturbed forest area available for wood supply, compared to the original base data, was determined, based on more recent country reports for the Global Forest Assessment 2010 (with data ranging from 2004–2008) [FAO, 2010]. This resulted in additional potential, particularly for Russia and Canada. The main differences were caused by the updated statistics on disturbed forest available for wood supply. The additional potential for the six countries was included in the ecological potential by Smeets, resulting in a total global potential for sustainable additional forest growth of ~27 EJ.
50 Safeguarding also those areas used for conservation of soil, slopes and watershed. 51 The potential is determined by the gross annual increment (i.e. forest growth in a year per area), the forest area considered and the demand for wood products. Since the value for the gross annual increment for commercial species is based on the country average, whereas in the forest areas under consideration the share of commercial species will be relatively high, the potential is likely to be underestimated here, providing a ‘buffer’ for safeguarding sustainable harvesting practices.
181Part 2 - The Ecofys Energy Scenario
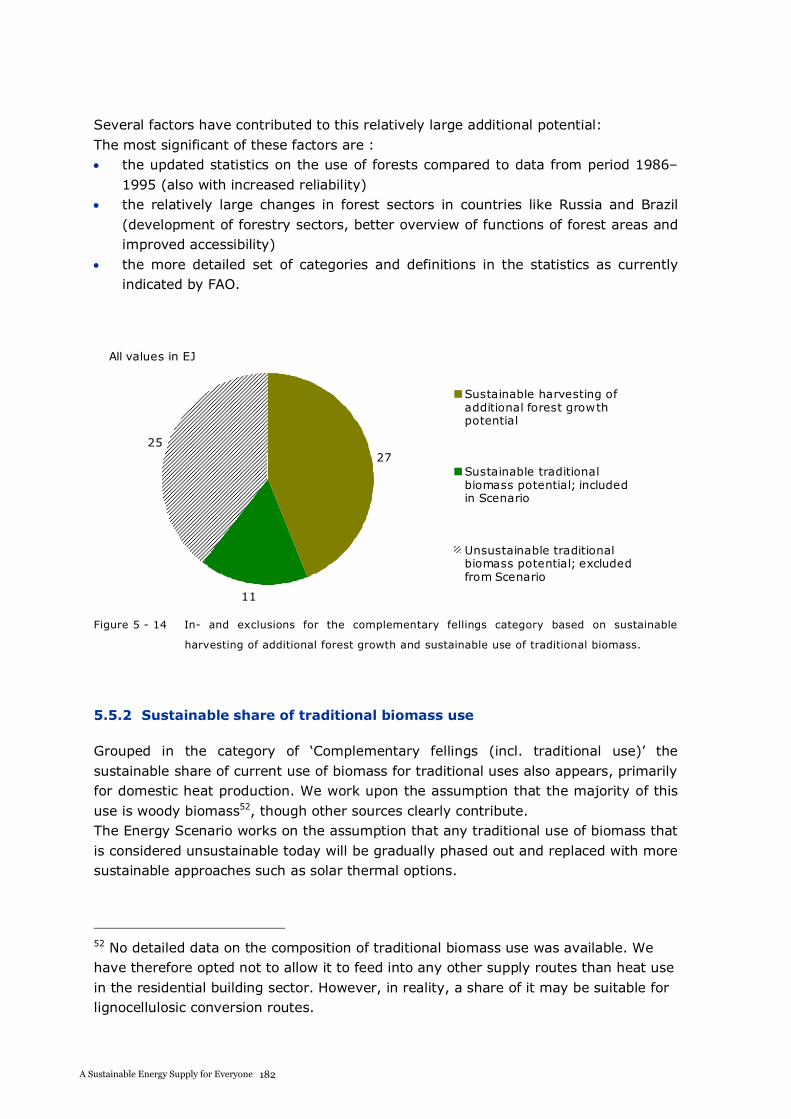
A S USTAI NABLE E NERGY S UPPLY F OR EVERY ONE
Several factors have contributed to this relatively large additional potential: The most significant of these factors are :
the updated statistics on the use of forests compared to data from period 1986–1995 (also with increased reliability) the relatively large changes in forest sectors in countries like Russia and Brazil (development of forestry sectors, better overview of functions of forest areas and improved accessibility) the more detailed set of categories and definitions in the statistics as currently indicated by FAO.
27
11
25
Sustainable harvesting ofadditional forest growthpotential
Sustainable traditionalbiomass potential; includedin Scenario
Unsustainable traditionalbiomass potential; excludedfrom Scenario
All values in EJ
Figure 5 - 14 In- and exclusions for the complementary fellings category based on sustainable
harvesting of additional forest growth and sustainable use of traditional biomass.
5.5.2 Sustainable share of traditional biomass use
Grouped in the category of ‘Complementary fellings (incl. traditional use)’ the sustainable share of current use of biomass for traditional uses also appears, primarily for domestic heat production. We work upon the assumption that the majority of this use is woody biomass52, though other sources clearly contribute. The Energy Scenario works on the assumption that any traditional use of biomass that is considered unsustainable today will be gradually phased out and replaced with more sustainable approaches such as solar thermal options.
52 No detailed data on the composition of traditional biomass use was available. We have therefore opted not to allow it to feed into any other supply routes than heat use in the residential building sector. However, in reality, a share of it may be suitable for lignocellulosic conversion routes.
A S USTAI NABLE E NERGY S UPPLY F OR EVERY ONE
No literature data was available on the sustainable share of current traditional biomass use. Therefore, as the Scenario gradually phases out traditional biomass use, we have estimated that 30% of the phased out biomass can be harvested sustainably. This amounts to approximately 11 EJ worldwide potential for this category. Note that in the later years of the Scenario, this potential is not completely used, as heat demand in buildings decreases substantially and other renewable options take over.
In total we have included 38 EJ of woody biomass in the complementary fellings category as shown in Figure 5 - 14.
5.6 Sustainability of bioenergy: Use of residues and waste
We performed a literature study on residues and waste for the categories53 shown in Figure 5 - 15. The full list of sources used can be found in Appendix G 5.
1
25
25
38
11
Oil and fat residues andwaste
Forestry residues and woodwaste
Agricultural residues
Wet waste and residues
Dry waste
All values in EJ
Total: 101 EJ
Figure 5 - 15 Sustainable residues and waste potential found in the Energy Scenario for 2050 in five
categories. 54
After obtaining the literature values for the potential of each residue and waste class, we performed three additional analyses to arrive at the final residue and waste potential figures:
53 Human sewage is not included as an energy source in the Energy Report as literature on this potential is very limited, so no conclusive data could be gathered. In any case, it is very likely that human sewage would only be a very minor contributor to the overall residue and waste potential [EEA, 2006]. Of course, the Scenario still supports the concept of energy generation from human sewage both in developed and less developed countries. However, for the above reasons, it is not quantitatively included in the Scenario’s energy supply. 54 Individual values can sum to a different total due to rounding differences.
182A Sustainable Energy Supply for Everyone
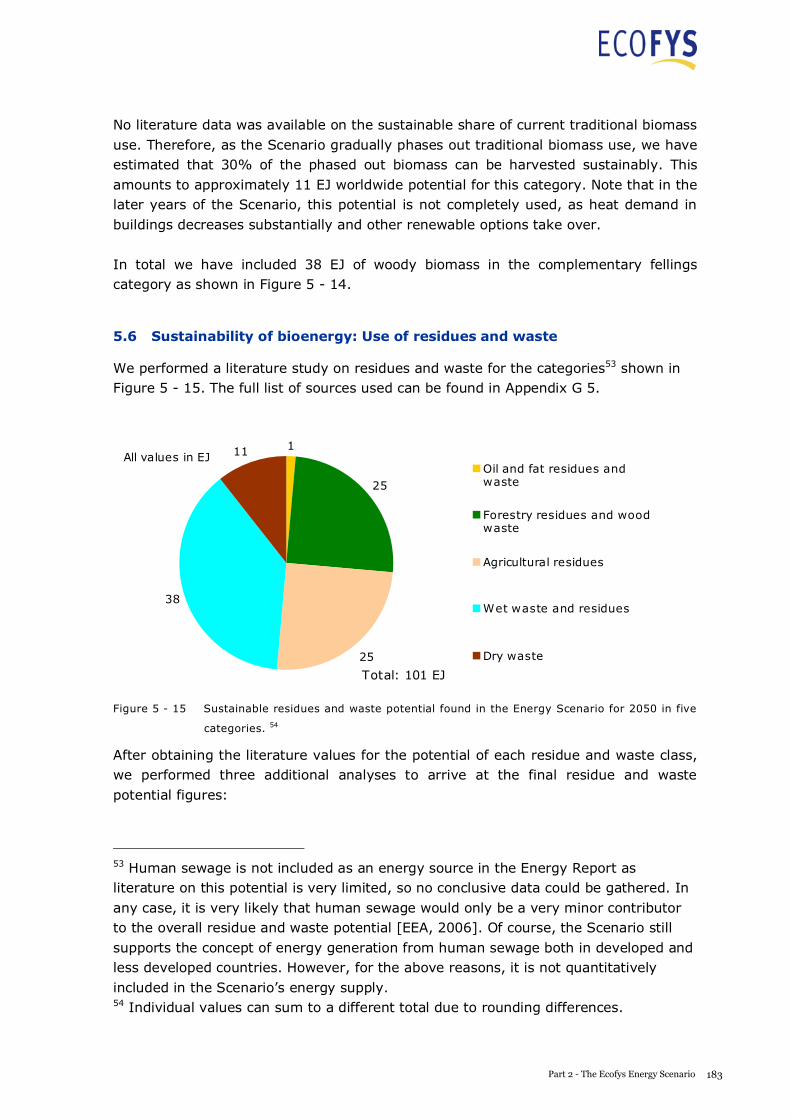
A S USTAI NABLE E NERGY S UPPLY F OR EVERY ONE
No literature data was available on the sustainable share of current traditional biomass use. Therefore, as the Scenario gradually phases out traditional biomass use, we have estimated that 30% of the phased out biomass can be harvested sustainably. This amounts to approximately 11 EJ worldwide potential for this category. Note that in the later years of the Scenario, this potential is not completely used, as heat demand in buildings decreases substantially and other renewable options take over.
In total we have included 38 EJ of woody biomass in the complementary fellings category as shown in Figure 5 - 14.
5.6 Sustainability of bioenergy: Use of residues and waste
We performed a literature study on residues and waste for the categories53 shown in Figure 5 - 15. The full list of sources used can be found in Appendix G 5.
1
25
25
38
11
Oil and fat residues andwaste
Forestry residues and woodwaste
Agricultural residues
Wet waste and residues
Dry waste
All values in EJ
Total: 101 EJ
Figure 5 - 15 Sustainable residues and waste potential found in the Energy Scenario for 2050 in five
categories. 54
After obtaining the literature values for the potential of each residue and waste class, we performed three additional analyses to arrive at the final residue and waste potential figures:
53 Human sewage is not included as an energy source in the Energy Report as literature on this potential is very limited, so no conclusive data could be gathered. In any case, it is very likely that human sewage would only be a very minor contributor to the overall residue and waste potential [EEA, 2006]. Of course, the Scenario still supports the concept of energy generation from human sewage both in developed and less developed countries. However, for the above reasons, it is not quantitatively included in the Scenario’s energy supply. 54 Individual values can sum to a different total due to rounding differences.
183Part 2 - The Ecofys Energy Scenario
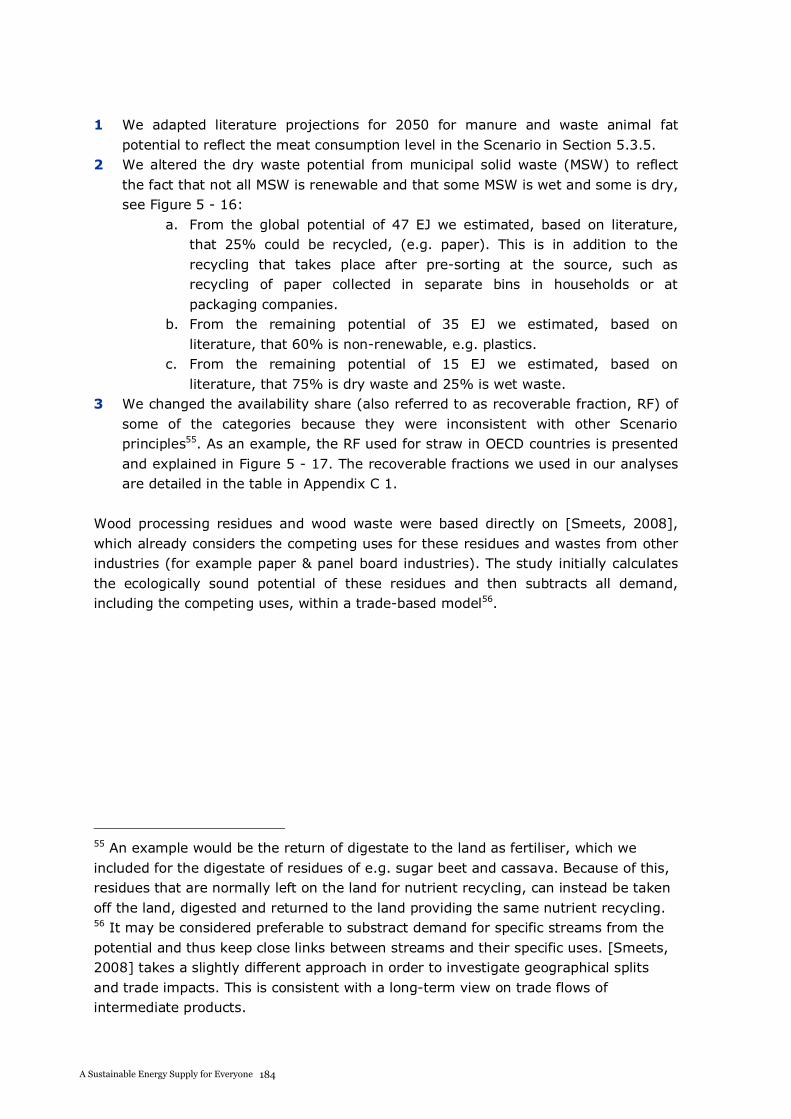
A S USTAI NABLE E NERGY S UPPLY F OR EVERY ONE
1 We adapted literature projections for 2050 for manure and waste animal fat potential to reflect the meat consumption level in the Scenario in Section 5.3.5.
2 We altered the dry waste potential from municipal solid waste (MSW) to reflect the fact that not all MSW is renewable and that some MSW is wet and some is dry, see Figure 5 - 16:
a. From the global potential of 47 EJ we estimated, based on literature, that 25% could be recycled, (e.g. paper). This is in addition to the recycling that takes place after pre-sorting at the source, such as recycling of paper collected in separate bins in households or at packaging companies.
b. From the remaining potential of 35 EJ we estimated, based on literature, that 60% is non-renewable, e.g. plastics.
c. From the remaining potential of 15 EJ we estimated, based on literature, that 75% is dry waste and 25% is wet waste.
3 We changed the availability share (also referred to as recoverable fraction, RF) of some of the categories because they were inconsistent with other Scenario principles55. As an example, the RF used for straw in OECD countries is presented and explained in Figure 5 - 17. The recoverable fractions we used in our analyses are detailed in the table in Appendix C 1.
Wood processing residues and wood waste were based directly on [Smeets, 2008], which already considers the competing uses for these residues and wastes from other industries (for example paper & panel board industries). The study initially calculates the ecologically sound potential of these residues and then subtracts all demand, including the competing uses, within a trade-based model56.
55 An example would be the return of digestate to the land as fertiliser, which we included for the digestate of residues of e.g. sugar beet and cassava. Because of this, residues that are normally left on the land for nutrient recycling, can instead be taken off the land, digested and returned to the land providing the same nutrient recycling. 56 It may be considered preferable to substract demand for specific streams from the potential and thus keep close links between streams and their specific uses. [Smeets, 2008] takes a slightly different approach in order to investigate geographical splits and trade impacts. This is consistent with a long-term view on trade flows of intermediate products.
A S USTAI NABLE E NERGY S UPPLY F OR EVERY ONE
a. Global mixed MSW after pre-sorting recycling optionsb. Excluded: additional recycling in Scenarioc. Non-recycled mixed MSWd. Excluded: non-renewable wastee. Energy Scenario wet waste from mixed MSWf. Energy Scenario dry waste from mixed MSW
47
12
35
21
4
11
a. MSW
b. Scenariorecycling
c. Non-recycled
MSW
d. Non-
renewable
e. Scenario wet
waste
f. Scenario dry
waste
All values in EJ
Figure 5 - 16 Additional analysis for renewable municipal solid waste potential.
35%
65%
Available straw from cereals
Non-available straw fromcereals
Figure 5 - 17 Recoverable fraction of straw from cereals in OECD countries. Only 35% of the straw is
available for energy purposes due to competing use as soil fertiliser, animal feed or
animal bedding and because of collection barriers.
184A Sustainable Energy Supply for Everyone
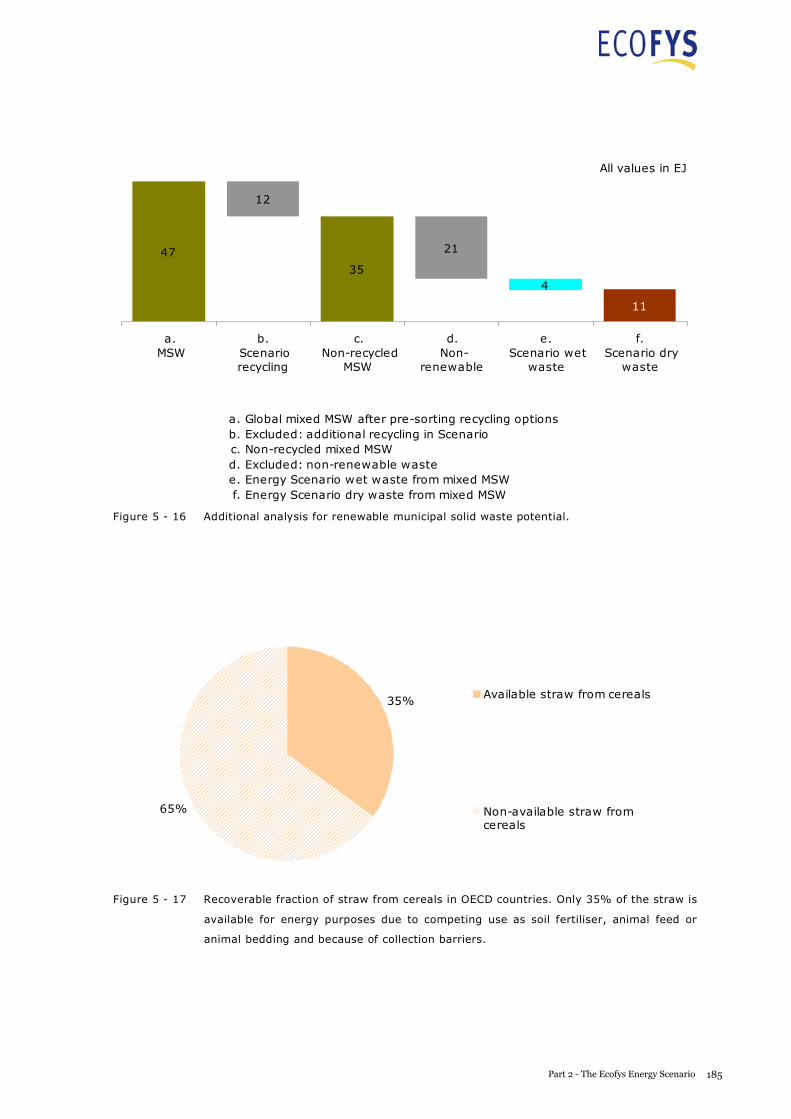
A S USTAI NABLE E NERGY S UPPLY F OR EVERY ONE
a. Global mixed MSW after pre-sorting recycling optionsb. Excluded: additional recycling in Scenarioc. Non-recycled mixed MSWd. Excluded: non-renewable wastee. Energy Scenario wet waste from mixed MSWf. Energy Scenario dry waste from mixed MSW
47
12
35
21
4
11
a. MSW
b. Scenariorecycling
c. Non-recycled
MSW
d. Non-
renewable
e. Scenario wet
waste
f. Scenario dry
waste
All values in EJ
Figure 5 - 16 Additional analysis for renewable municipal solid waste potential.
35%
65%
Available straw from cereals
Non-available straw fromcereals
Figure 5 - 17 Recoverable fraction of straw from cereals in OECD countries. Only 35% of the straw is
available for energy purposes due to competing use as soil fertiliser, animal feed or
animal bedding and because of collection barriers.
185Part 2 - The Ecofys Energy Scenario
A S USTAI NABLE E NERGY S UPPLY F OR EVERY ONE
The resulting residues and waste categories are listed below. Their origin57 in the biomass chain is denoted with a letter between brackets: primary (P), secondary (S) and/or tertiary (T):
Oils and fats – 1 EJ (S, T): o Animal fat o Used cooking oil
Forestry residues and wood waste – 25 EJ (P, S, T): o Logging residues – ~5 EJ o Wood processing residues ~10 EJ o Wood waste – ~10 EJ
Agricultural residues – 25 EJ (P, S): o Cerealso Rapeseedo Coffee o Soy
Wet waste and residues – 38 EJ (S, T): o Sugar beet processing residues o Potato processing residues o Manure o Oil palm empty fruit bunches o Palm oil mill effluent o Sugar cane o Cassava o Wet municipal solid waste
Dry waste – 11 EJ (T): o Dry municipal solid waste
5.7 Sustainable algae
The Energy Scenario uses algae oil to supply remaining demands in oil routes after the use of residues, waste and bioenergy crops58. Because commercial-scale algae growing and harvesting is currently still in development, the Scenario only includes significant algae use from 2030 onwards. The approach to using algae in the Scenario is based on a recent Ecofys study [Ecofys, 2008] on the worldwide potential of aquatic biomass. This study identified a number of different long-term feasible potentials for aquatic biomass. The total long-term energy potential in this study, including macroalgae cultivation at open sea that requires substantial technology development,
57 Primary residues are related to biomass production (e.g. straw), secondary residues to biomass processing (e.g. sawdust) and tertiary residues to product use (e.g. manure). Tertiary residues, especially when they no longer have an economic value, are often called waste. See also Appendix F. 58 As not all land identified in the sustainable bioenergy cropland potential is suitable for growing oil crops, algae are needed even though the cropland potential is not fully used.
A S USTAI NABLE E NERGY S UPPLY F OR EVERY ONE
is approximately 6,000 EJ. The most conservative scenario only contains algae oil from microalgae grown in open ponds on non-arable land filled with salt water. The total potential for algae oil from this technology was estimated at 90 EJ of oil.
The cultivation of algae in the Energy Scenario takes place in a framework that optimises the beneficial properties of microalgae, while remaining within the boundaries set by the land-based algae cultivation scenario from the study. In this framework the bioenergy sustainability criteria set forward by the Scenario are respected. The framework consists of the following elements:
Microalgae are cultivated on non-arable land that does not accommodate significant carbon stocks
o Agricultural fertilisation consists primarily of nitrogen and CO2 fertiliser o The cultivation takes place in salt water
Oil is extracted from the algae and fed to a biofuel processing plant Cultivation energy inputs consist of electricity for pumping and oil extraction etc… Optional: The remaining algae biomass can be refined to collect high value components, e.g. proteins. It may be possible to produce animal feed products from the protein fracture, potentially reducing the need for growing animal feed crops. The biomass residues of oil extraction can be digested, either directly or after the optional refining step. The produced biogas is combusted to produce electricity and heat. The electricity production covers the cultivation energy inputs. The digestate of the digestion step and the CO2 obtained from the biogas combustion are fed back to algae to close the nutrient cycle. For nitrogen nutrients we aim to close 75% of the cycle. The cycle of algae cultivation recommences.
This cycle is shown schematically in Figure 5 - 18.
The maximum amount of algae oil used in the Scenario is 21 EJ of oil in 2050. Based on the yields calculated in the Ecofys study, this amounts to approximately 30 Mha use of non-arable land. The 21 EJ oil use is about 25% of the 90 EJ algae oil potential identified in the most conservative scenario containing only algae oil from microalgae grown in open ponds on non-arable land filled with salt water. Therefore, the algae oil use in the Scenario fits comfortably within the potential identified in the Ecofys study, especially as further potential from algae cultivation in open water may be tapped due to future technological progress.
186A Sustainable Energy Supply for Everyone
A S USTAI NABLE E NERGY S UPPLY F OR EVERY ONE
is approximately 6,000 EJ. The most conservative scenario only contains algae oil from microalgae grown in open ponds on non-arable land filled with salt water. The total potential for algae oil from this technology was estimated at 90 EJ of oil.
The cultivation of algae in the Energy Scenario takes place in a framework that optimises the beneficial properties of microalgae, while remaining within the boundaries set by the land-based algae cultivation scenario from the study. In this framework the bioenergy sustainability criteria set forward by the Scenario are respected. The framework consists of the following elements:
Microalgae are cultivated on non-arable land that does not accommodate significant carbon stocks
o Agricultural fertilisation consists primarily of nitrogen and CO2 fertiliser o The cultivation takes place in salt water
Oil is extracted from the algae and fed to a biofuel processing plant Cultivation energy inputs consist of electricity for pumping and oil extraction etc… Optional: The remaining algae biomass can be refined to collect high value components, e.g. proteins. It may be possible to produce animal feed products from the protein fracture, potentially reducing the need for growing animal feed crops. The biomass residues of oil extraction can be digested, either directly or after the optional refining step. The produced biogas is combusted to produce electricity and heat. The electricity production covers the cultivation energy inputs. The digestate of the digestion step and the CO2 obtained from the biogas combustion are fed back to algae to close the nutrient cycle. For nitrogen nutrients we aim to close 75% of the cycle. The cycle of algae cultivation recommences.
This cycle is shown schematically in Figure 5 - 18.
The maximum amount of algae oil used in the Scenario is 21 EJ of oil in 2050. Based on the yields calculated in the Ecofys study, this amounts to approximately 30 Mha use of non-arable land. The 21 EJ oil use is about 25% of the 90 EJ algae oil potential identified in the most conservative scenario containing only algae oil from microalgae grown in open ponds on non-arable land filled with salt water. Therefore, the algae oil use in the Scenario fits comfortably within the potential identified in the Ecofys study, especially as further potential from algae cultivation in open water may be tapped due to future technological progress.
187Part 2 - The Ecofys Energy Scenario
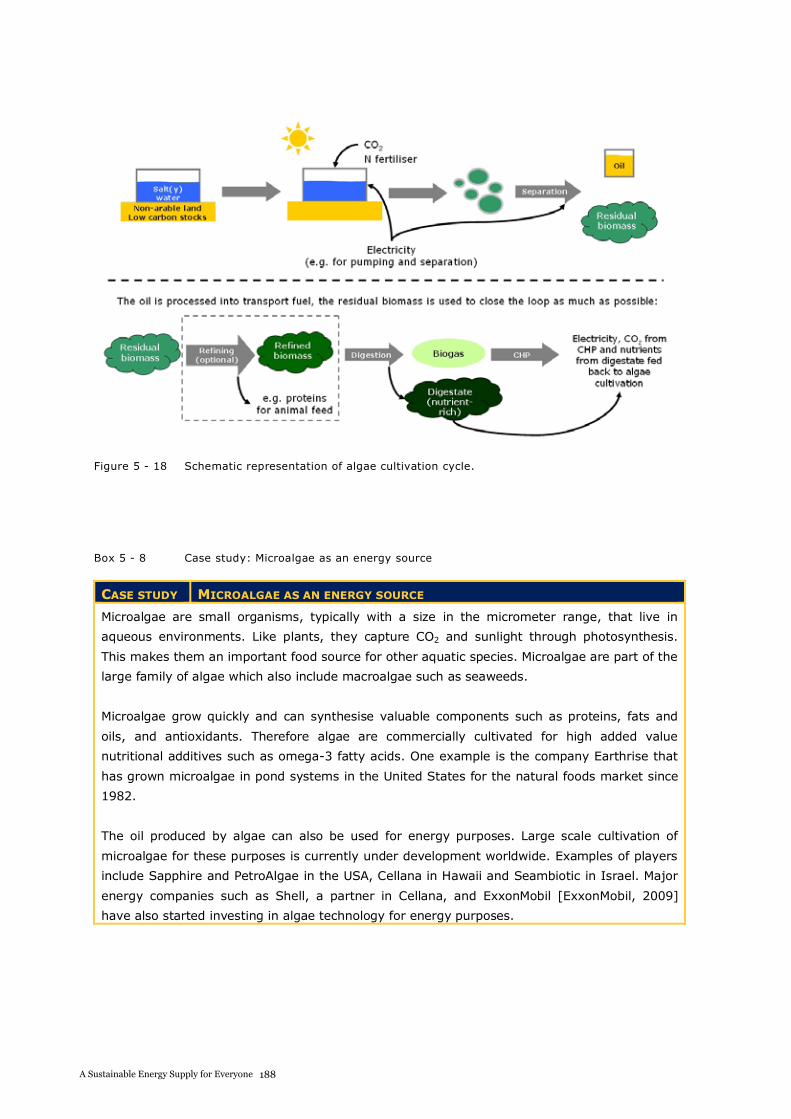
A S USTAI NABLE E NERGY S UPPLY F OR EVERY ONE
Figure 5 - 18 Schematic representation of algae cultivation cycle.
Box 5 - 8 Case study: Microalgae as an energy source
CASE STUDY MICROALGAE AS AN ENERGY SOURCE
Microalgae are small organisms, typically with a size in the micrometer range, that live in
aqueous environments. Like plants, they capture CO2 and sunlight through photosynthesis.
This makes them an important food source for other aquatic species. Microalgae are part of the
large family of algae which also include macroalgae such as seaweeds.
Microalgae grow quickly and can synthesise valuable components such as proteins, fats and
oils, and antioxidants. Therefore algae are commercially cultivated for high added value
nutritional additives such as omega-3 fatty acids. One example is the company Earthrise that
has grown microalgae in pond systems in the United States for the natural foods market since
1982.
The oil produced by algae can also be used for energy purposes. Large scale cultivation of
microalgae for these purposes is currently under development worldwide. Examples of players
include Sapphire and PetroAlgae in the USA, Cellana in Hawaii and Seambiotic in Israel. Major
energy companies such as Shell, a partner in Cellana, and ExxonMobil [ExxonMobil, 2009]
have also started investing in algae technology for energy purposes.
188A Sustainable Energy Supply for Everyone
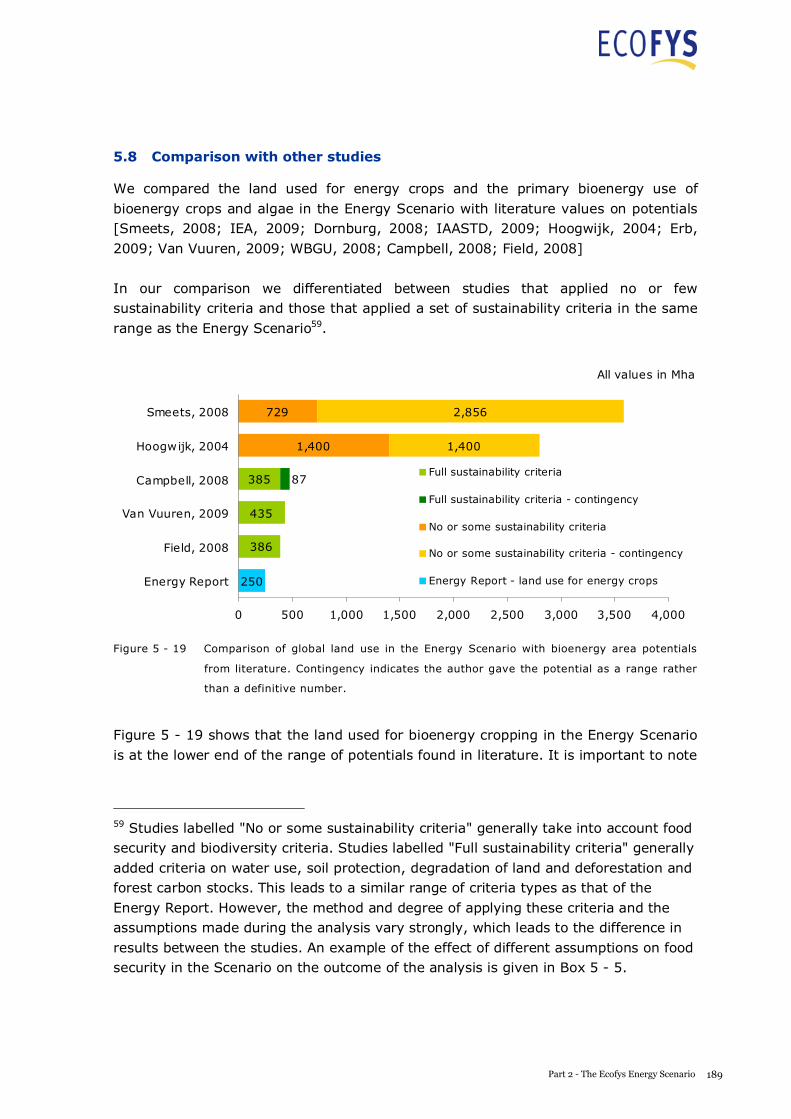
A S USTAI NABLE E NERGY S UPPLY F OR EVERY ONE
5.8 Comparison with other studies
We compared the land used for energy crops and the primary bioenergy use of bioenergy crops and algae in the Energy Scenario with literature values on potentials [Smeets, 2008; IEA, 2009; Dornburg, 2008; IAASTD, 2009; Hoogwijk, 2004; Erb, 2009; Van Vuuren, 2009; WBGU, 2008; Campbell, 2008; Field, 2008]
In our comparison we differentiated between studies that applied no or few sustainability criteria and those that applied a set of sustainability criteria in the same range as the Energy Scenario59.
435
1,400
729
1,400
2,856
250
385
386
87
0 500 1,000 1,500 2,000 2,500 3,000 3,500 4,000
Energy Report
Field, 2008
Van Vuuren, 2009
Campbell, 2008
Hoogwijk, 2004
Smeets, 2008
Full sustainability criteria
Full sustainability criteria - contingency
No or some sustainability criteria
No or some sustainability criteria - contingency
Energy Report - land use for energy crops
All values in Mha
Figure 5 - 19 Comparison of global land use in the Energy Scenario with bioenergy area potentials
from literature. Contingency indicates the author gave the potential as a range rather
than a definitive number.
Figure 5 - 19 shows that the land used for bioenergy cropping in the Energy Scenario is at the lower end of the range of potentials found in literature. It is important to note
59 Studies labelled "No or some sustainability criteria" generally take into account food security and biodiversity criteria. Studies labelled "Full sustainability criteria" generally added criteria on water use, soil protection, degradation of land and deforestation and forest carbon stocks. This leads to a similar range of criteria types as that of the Energy Report. However, the method and degree of applying these criteria and the assumptions made during the analysis vary strongly, which leads to the difference in results between the studies. An example of the effect of different assumptions on food security in the Scenario on the outcome of the analysis is given in Box 5 - 5.
189Part 2 - The Ecofys Energy Scenario
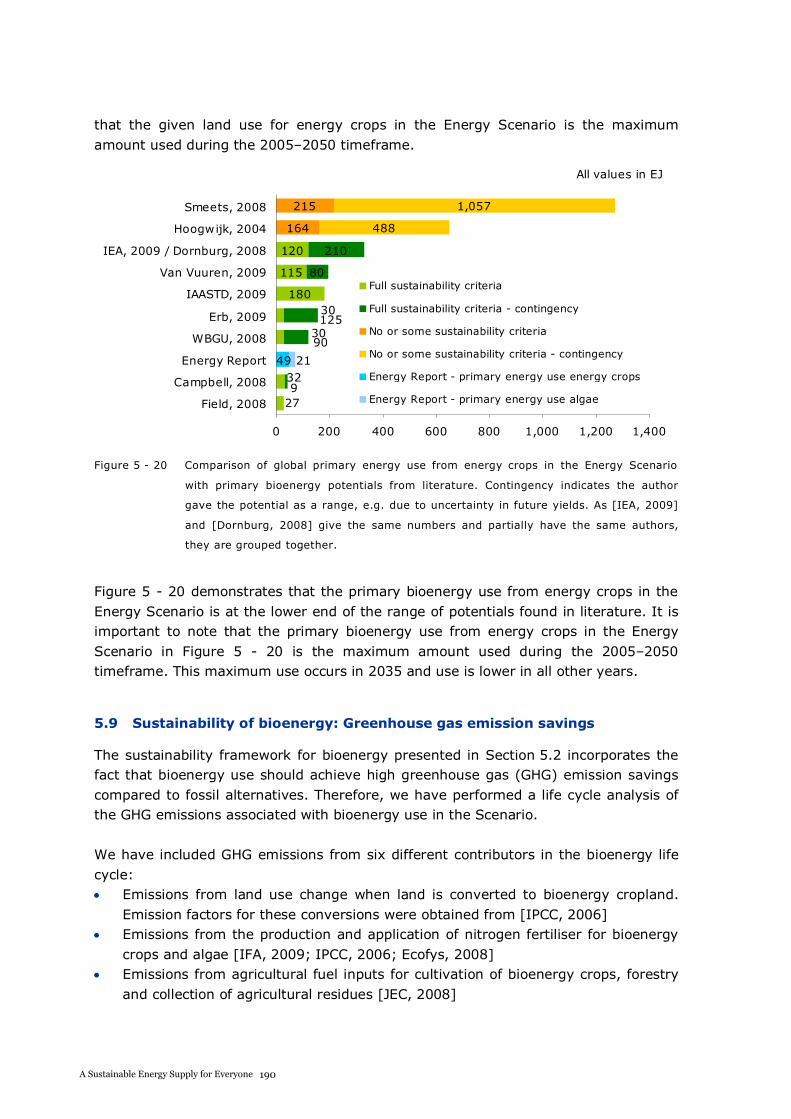
A S USTAI NABLE E NERGY S UPPLY F OR EVERY ONE
that the given land use for energy crops in the Energy Scenario is the maximum amount used during the 2005–2050 timeframe.
180
115
120
80
210
164
215
488
1,057
30
30
32
27
125
90
9
49 21
0 200 400 600 800 1,000 1,200 1,400
Field, 2008
Campbell, 2008
Energy Report
WBGU, 2008
Erb, 2009
IAASTD, 2009
Van Vuuren, 2009
IEA, 2009 / Dornburg, 2008
Hoogwijk, 2004
Smeets, 2008
Full sustainability criteria
Full sustainability criteria - contingency
No or some sustainability criteria
No or some sustainability criteria - contingency
Energy Report - primary energy use energy crops
Energy Report - primary energy use algae
All values in EJ
Figure 5 - 20 Comparison of global primary energy use from energy crops in the Energy Scenario
with primary bioenergy potentials from literature. Contingency indicates the author
gave the potential as a range, e.g. due to uncertainty in future yields. As [IEA, 2009]
and [Dornburg, 2008] give the same numbers and partially have the same authors,
they are grouped together.
Figure 5 - 20 demonstrates that the primary bioenergy use from energy crops in the Energy Scenario is at the lower end of the range of potentials found in literature. It is important to note that the primary bioenergy use from energy crops in the Energy Scenario in Figure 5 - 20 is the maximum amount used during the 2005–2050 timeframe. This maximum use occurs in 2035 and use is lower in all other years.
5.9 Sustainability of bioenergy: Greenhouse gas emission savings
The sustainability framework for bioenergy presented in Section 5.2 incorporates the fact that bioenergy use should achieve high greenhouse gas (GHG) emission savings compared to fossil alternatives. Therefore, we have performed a life cycle analysis of the GHG emissions associated with bioenergy use in the Scenario.
We have included GHG emissions from six different contributors in the bioenergy life cycle:
Emissions from land use change when land is converted to bioenergy cropland. Emission factors for these conversions were obtained from [IPCC, 2006] Emissions from the production and application of nitrogen fertiliser for bioenergy crops and algae [IFA, 2009; IPCC, 2006; Ecofys, 2008] Emissions from agricultural fuel inputs for cultivation of bioenergy crops, forestry and collection of agricultural residues [JEC, 2008]
190A Sustainable Energy Supply for Everyone
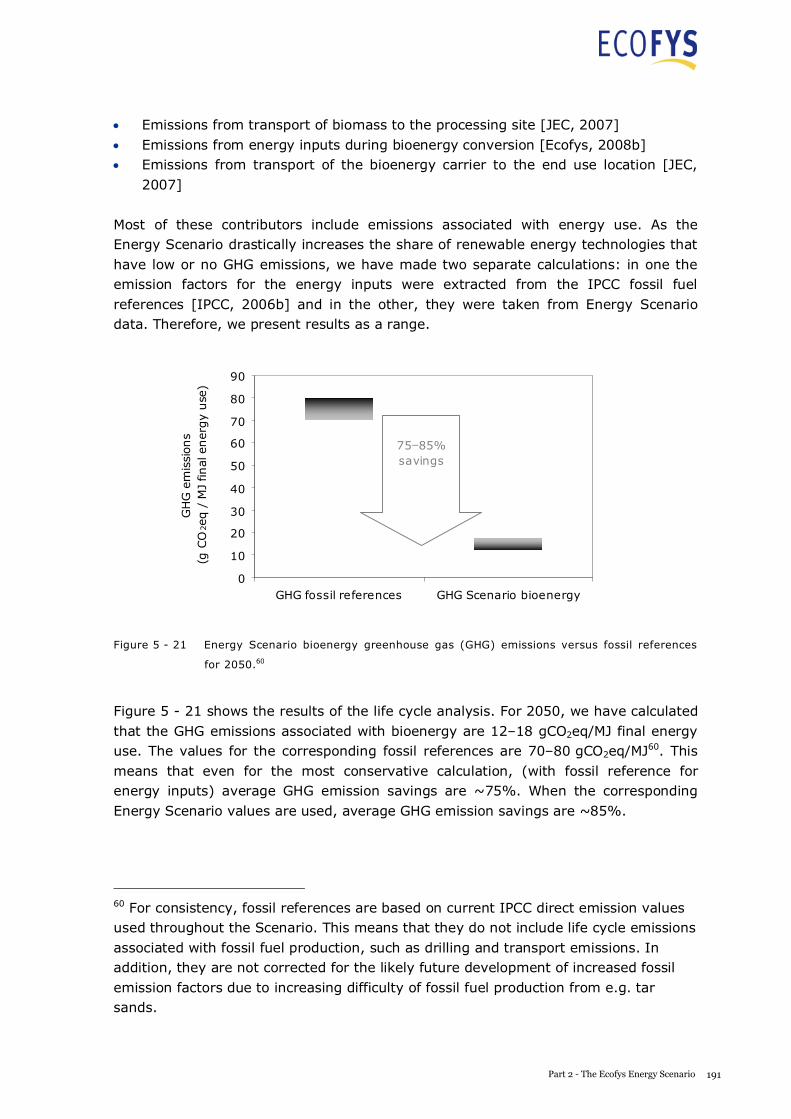
A S USTAI NABLE E NERGY S UPPLY F OR EVERY ONE
that the given land use for energy crops in the Energy Scenario is the maximum amount used during the 2005–2050 timeframe.
180
115
120
80
210
164
215
488
1,057
30
30
32
27
125
90
9
49 21
0 200 400 600 800 1,000 1,200 1,400
Field, 2008
Campbell, 2008
Energy Report
WBGU, 2008
Erb, 2009
IAASTD, 2009
Van Vuuren, 2009
IEA, 2009 / Dornburg, 2008
Hoogwijk, 2004
Smeets, 2008
Full sustainability criteria
Full sustainability criteria - contingency
No or some sustainability criteria
No or some sustainability criteria - contingency
Energy Report - primary energy use energy crops
Energy Report - primary energy use algae
All values in EJ
Figure 5 - 20 Comparison of global primary energy use from energy crops in the Energy Scenario
with primary bioenergy potentials from literature. Contingency indicates the author
gave the potential as a range, e.g. due to uncertainty in future yields. As [IEA, 2009]
and [Dornburg, 2008] give the same numbers and partially have the same authors,
they are grouped together.
Figure 5 - 20 demonstrates that the primary bioenergy use from energy crops in the Energy Scenario is at the lower end of the range of potentials found in literature. It is important to note that the primary bioenergy use from energy crops in the Energy Scenario in Figure 5 - 20 is the maximum amount used during the 2005–2050 timeframe. This maximum use occurs in 2035 and use is lower in all other years.
5.9 Sustainability of bioenergy: Greenhouse gas emission savings
The sustainability framework for bioenergy presented in Section 5.2 incorporates the fact that bioenergy use should achieve high greenhouse gas (GHG) emission savings compared to fossil alternatives. Therefore, we have performed a life cycle analysis of the GHG emissions associated with bioenergy use in the Scenario.
We have included GHG emissions from six different contributors in the bioenergy life cycle:
Emissions from land use change when land is converted to bioenergy cropland. Emission factors for these conversions were obtained from [IPCC, 2006] Emissions from the production and application of nitrogen fertiliser for bioenergy crops and algae [IFA, 2009; IPCC, 2006; Ecofys, 2008] Emissions from agricultural fuel inputs for cultivation of bioenergy crops, forestry and collection of agricultural residues [JEC, 2008]
A S USTAI NABLE E NERGY S UPPLY F OR EVERY ONE
Emissions from transport of biomass to the processing site [JEC, 2007] Emissions from energy inputs during bioenergy conversion [Ecofys, 2008b] Emissions from transport of the bioenergy carrier to the end use location [JEC, 2007]
Most of these contributors include emissions associated with energy use. As the Energy Scenario drastically increases the share of renewable energy technologies that have low or no GHG emissions, we have made two separate calculations: in one the emission factors for the energy inputs were extracted from the IPCC fossil fuel references [IPCC, 2006b] and in the other, they were taken from Energy Scenario data. Therefore, we present results as a range.
0
10
20
30
40
50
60
70
80
90
GHG fossil references GHG Scenario bioenergy
GH
Gem
issi
ons
(gCO
2eq
/M
Jfin
alen
ergy
use
)
75–85%savings
Figure 5 - 21 Energy Scenario bioenergy greenhouse gas (GHG) emissions versus fossil references
for 2050.60
Figure 5 - 21 shows the results of the life cycle analysis. For 2050, we have calculated that the GHG emissions associated with bioenergy are 12–18 gCO2eq/MJ final energy use. The values for the corresponding fossil references are 70–80 gCO2eq/MJ60. This means that even for the most conservative calculation, (with fossil reference for energy inputs) average GHG emission savings are ~75%. When the corresponding Energy Scenario values are used, average GHG emission savings are ~85%.
60 For consistency, fossil references are based on current IPCC direct emission values used throughout the Scenario. This means that they do not include life cycle emissions associated with fossil fuel production, such as drilling and transport emissions. In addition, they are not corrected for the likely future development of increased fossil emission factors due to increasing difficulty of fossil fuel production from e.g. tar sands.
191Part 2 - The Ecofys Energy Scenario
A S USTAI NABLE E NERGY S UPPLY F OR EVERY ONE
6 Investments and Savings
6.1 Introduction
The Energy Scenario examines the feasibility of a fully renewable energy future by taking a bottom-up, physical approach to the energy system. It does not necessarily present the most cost-efficient way of achieving this goal. It is however, insightful to estimate the associated investment and savings of this energy system in comparison to a BAU energy system.
The following sections will describe approaches and assumptions used to derive investments and savings resulting from the Energy Scenario indicate the functionality and limitations of the underlying calculations
The generic approach for all sectors, as well as basic data and parameters used in all or most of the sectors, is presented in Section 6.2. Following Section 6.2, specific methods, assumptions and results are presented in separate sections for each of the sectors:
industry buildings transport-infrastructure transport–vehicle technology power electricity grids renewable heat and fuels research and development (R&D)
Considerations for the uncertainty of key parameters and the distribution of investments and revenues form the conclusion.
6.2 General
The two key questions that the cost model for the Energy Scenario attempts to answer are: What will be the net costs of the Energy Scenario? What will be the upfront investments?
To answer these two questions, the cost calculations per sector differentiate between capital expenditures (CapEx) and operational expenditures (OpEx), which include savings due to lower or no fuel costs.
192A Sustainable Energy Supply for Everyone
A S USTAI NABLE E NERGY S UPPLY F OR EVERY ONE
Costs and savings until 2050 are calculated and fully accounted for in the year in which they occur, meaning that investment is not levelised, which is sometimes practised to inform long-term strategy,61 therefore, the results shown, present “real” investment needs, or “cash flow” for any given time period. This approach is more appropriate for the global and macroeconomic view of the Energy Scenario and to answer the two key questions. To assess the profitability of the investments, a levelised cost approach would need to be added.
Although energy-related CapEx and OpEx have been quantified as well as possible, indirect investments and savings are not taken into account. Therefore, all external benefits, such as reduced risk of environmental degradation, insured and non-insured costs from decreased climate damages, reduced adaptation costs, reduced health costs, are not calculated. [Stern 2006] estimated the costs of climate change in a business-as-usual scenario to be between 5–20% of annual GDP, depending on the scope of social costs taken into consideration, compared to 1% of GDP for keeping global emissions between 500 and 550ppm CO2-eq.62
All calculated costs and savings are additional to the reference case mentioned above. This means that total investments would usually be much higher than CapEx, but the major share of investments would have to be made in the reference scenario anyway. By focusing on the economic differences between the Energy Scenario and business as usual, the results for investment and savings highlight the net financial impact of the Scenario.
All cost values are given in EUR2005.
61 The US Energy Information Administration defines levelised costs as representing “the present value of the total cost of building and operating a generating plant over its financial life, converted to equal annual payments and amortized over expected annual generation from an assumed duty cycle.” Because of the Scenario’s cash-flow approach, the total up-front investments (CapEx) are only compared with that same year’s fuel cost savings (OpEx). A levelised cost approach, which is more common for private investments, would spread the CapEx over the total lifetime and include also savings after 2050, leading to a higher profitability of investments in renewable energies than conventional power plants.
62 [Stern, 2006], Summary of Conclusions
193Part 2 - The Ecofys Energy Scenario
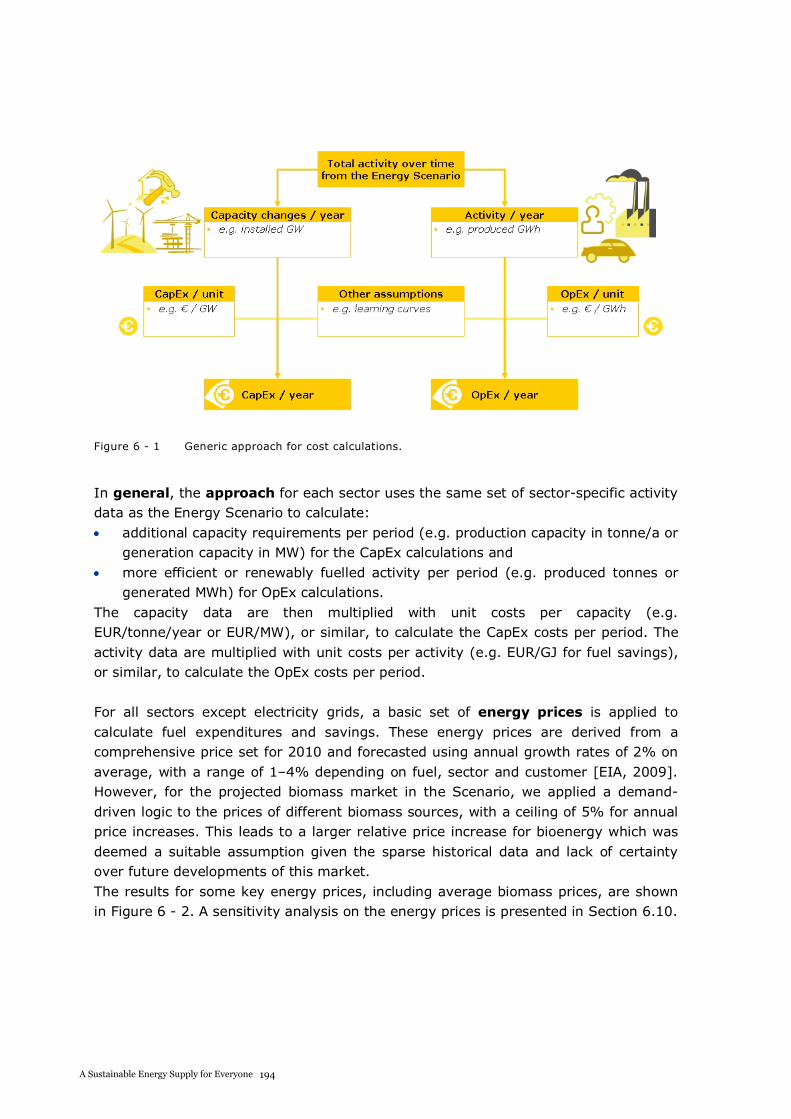
A S USTAI NABLE E NERGY S UPPLY F OR EVERY ONE
Figure 6 - 1 Generic approach for cost calculations.
In general, the approach for each sector uses the same set of sector-specific activity data as the Energy Scenario to calculate:
additional capacity requirements per period (e.g. production capacity in tonne/a or generation capacity in MW) for the CapEx calculations and more efficient or renewably fuelled activity per period (e.g. produced tonnes or generated MWh) for OpEx calculations.
The capacity data are then multiplied with unit costs per capacity (e.g. EUR/tonne/year or EUR/MW), or similar, to calculate the CapEx costs per period. The activity data are multiplied with unit costs per activity (e.g. EUR/GJ for fuel savings), or similar, to calculate the OpEx costs per period.
For all sectors except electricity grids, a basic set of energy prices is applied to calculate fuel expenditures and savings. These energy prices are derived from a comprehensive price set for 2010 and forecasted using annual growth rates of 2% on average, with a range of 1–4% depending on fuel, sector and customer [EIA, 2009]. However, for the projected biomass market in the Scenario, we applied a demand-driven logic to the prices of different biomass sources, with a ceiling of 5% for annual price increases. This leads to a larger relative price increase for bioenergy which was deemed a suitable assumption given the sparse historical data and lack of certainty over future developments of this market. The results for some key energy prices, including average biomass prices, are shown in Figure 6 - 2. A sensitivity analysis on the energy prices is presented in Section 6.10.
194A Sustainable Energy Supply for Everyone
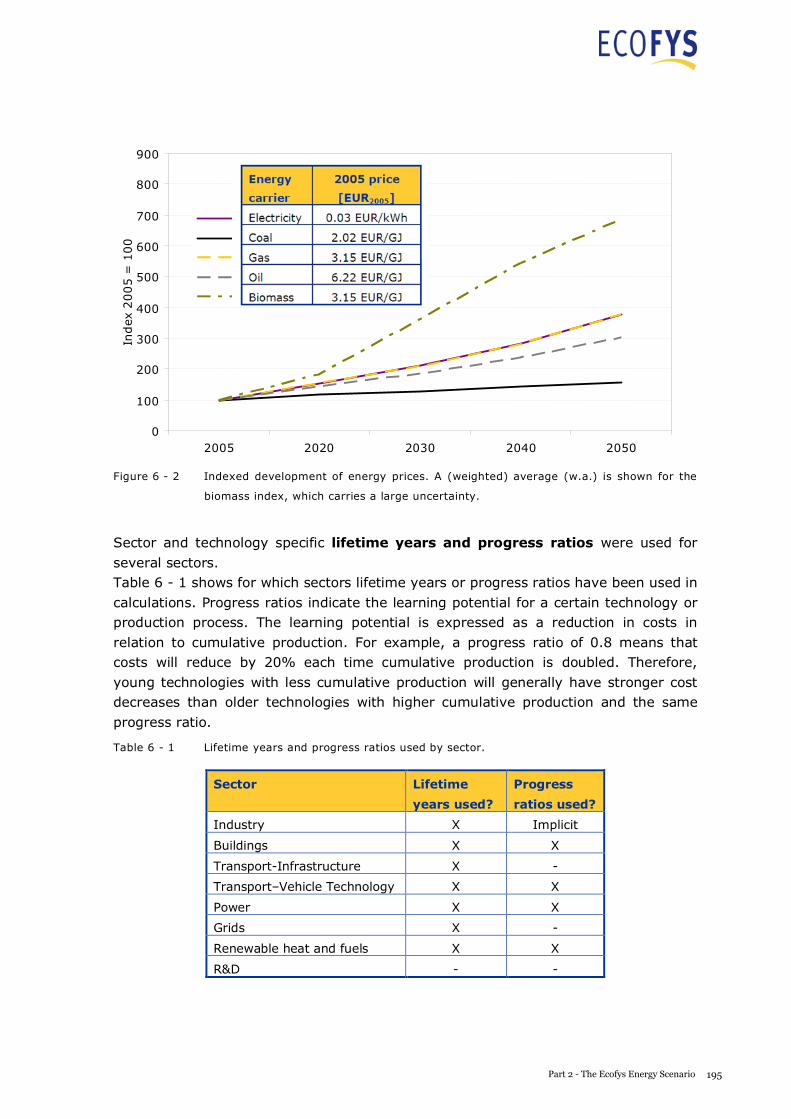
A S USTAI NABLE E NERGY S UPPLY F OR EVERY ONE
0
100
200
300
400
500
600
700
800
900
2005 2020 2030 2040 2050
Index
2005
=100
Electricity
Coal
Gas
Oil
Biomass (w.a.)
Figure 6 - 2 Indexed development of energy prices. A (weighted) average (w.a.) is shown for the
biomass index, which carries a large uncertainty.
Sector and technology specific lifetime years and progress ratios were used for several sectors. Table 6 - 1 shows for which sectors lifetime years or progress ratios have been used in calculations. Progress ratios indicate the learning potential for a certain technology or production process. The learning potential is expressed as a reduction in costs in relation to cumulative production. For example, a progress ratio of 0.8 means that costs will reduce by 20% each time cumulative production is doubled. Therefore, young technologies with less cumulative production will generally have stronger cost decreases than older technologies with higher cumulative production and the same progress ratio.
Table 6 - 1 Lifetime years and progress ratios used by sector.
Sector Lifetime
years used?
Progress
ratios used?
Industry X Implicit
Buildings X X
Transport-Infrastructure X -
Transport–Vehicle Technology X X
Power X X
Grids X -
Renewable heat and fuels X X
R&D - -
195Part 2 - The Ecofys Energy Scenario
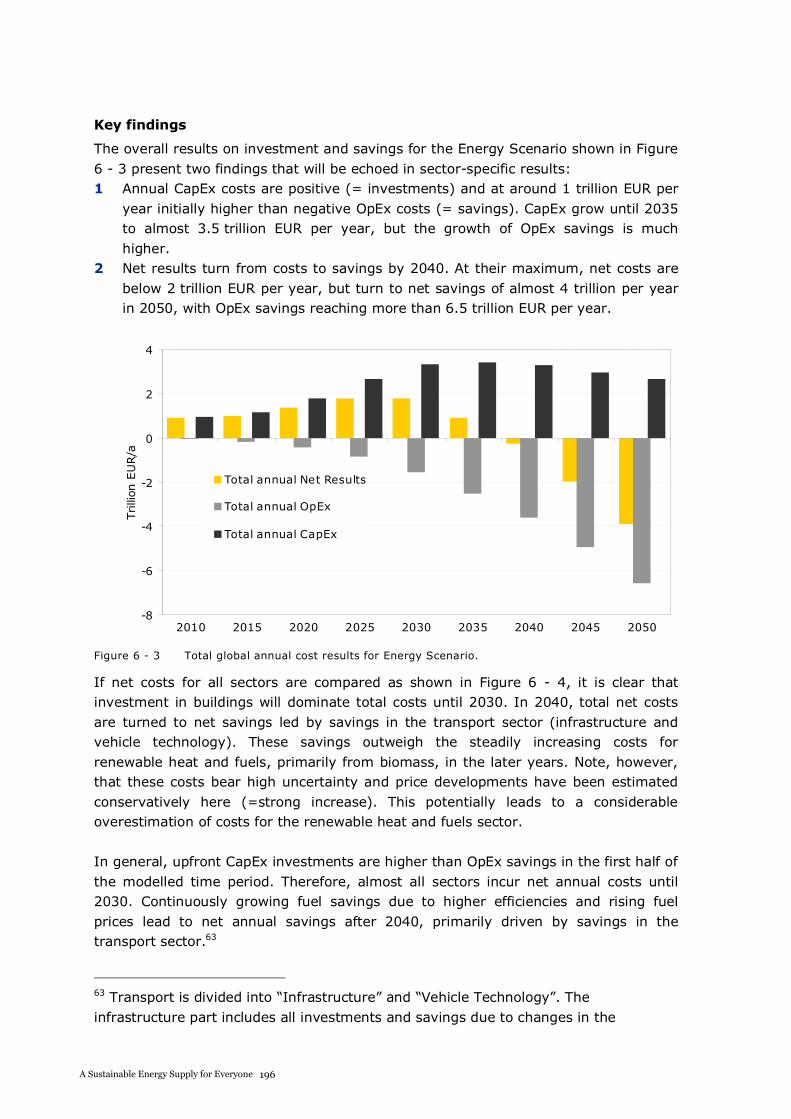
A S USTAI NABLE E NERGY S UPPLY F OR EVERY ONE
Key findings
The overall results on investment and savings for the Energy Scenario shown in Figure 6 - 3 present two findings that will be echoed in sector-specific results: 1 Annual CapEx costs are positive (= investments) and at around 1 trillion EUR per
year initially higher than negative OpEx costs (= savings). CapEx grow until 2035 to almost 3.5 trillion EUR per year, but the growth of OpEx savings is much higher.
2 Net results turn from costs to savings by 2040. At their maximum, net costs are below 2 trillion EUR per year, but turn to net savings of almost 4 trillion per year in 2050, with OpEx savings reaching more than 6.5 trillion EUR per year.
-8
-6
-4
-2
0
2
4
2010 2015 2020 2025 2030 2035 2040 2045 2050
Trilli
onEU
R/a
Total annual Net Results
Total annual OpEx
Total annual CapEx
Figure 6 - 3 Total global annual cost results for Energy Scenario.
If net costs for all sectors are compared as shown in Figure 6 - 4, it is clear that investment in buildings will dominate total costs until 2030. In 2040, total net costs are turned to net savings led by savings in the transport sector (infrastructure and vehicle technology). These savings outweigh the steadily increasing costs for renewable heat and fuels, primarily from biomass, in the later years. Note, however, that these costs bear high uncertainty and price developments have been estimated conservatively here (=strong increase). This potentially leads to a considerable overestimation of costs for the renewable heat and fuels sector.
In general, upfront CapEx investments are higher than OpEx savings in the first half of the modelled time period. Therefore, almost all sectors incur net annual costs until 2030. Continuously growing fuel savings due to higher efficiencies and rising fuel prices lead to net annual savings after 2040, primarily driven by savings in the transport sector.63
63 Transport is divided into “Infrastructure” and “Vehicle Technology”. The infrastructure part includes all investments and savings due to changes in the
196A Sustainable Energy Supply for Everyone
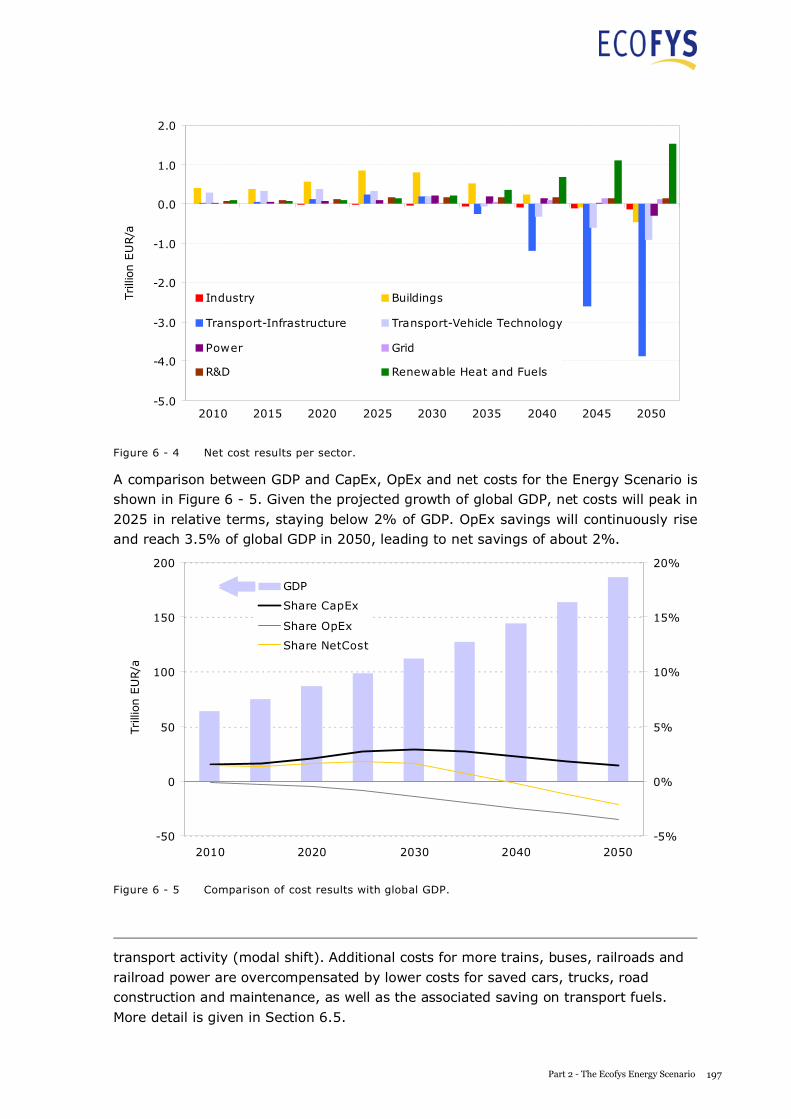
A S USTAI NABLE E NERGY S UPPLY F OR EVERY ONE
-5.0
-4.0
-3.0
-2.0
-1.0
0.0
1.0
2.0
2010 2015 2020 2025 2030 2035 2040 2045 2050
Trill
ion
EU
R/a
Industry Buildings
Transport-Infrastructure Transport-Vehicle Technology
Power Grid
R&D Renewable Heat and Fuels
Figure 6 - 4 Net cost results per sector.
A comparison between GDP and CapEx, OpEx and net costs for the Energy Scenario is shown in Figure 6 - 5. Given the projected growth of global GDP, net costs will peak in 2025 in relative terms, staying below 2% of GDP. OpEx savings will continuously rise and reach 3.5% of global GDP in 2050, leading to net savings of about 2%.
-50
0
50
100
150
200
2010 2020 2030 2040 2050
Trill
ion
EU
R/a
-5%
0%
5%
10%
15%
20%
GDP
Share CapEx
Share OpEx
Share NetCost
-50
0
50
100
150
200
2010 2020 2030 2040 2050
Trill
ion
EU
R/a
-5%
0%
5%
10%
15%
20%
GDP
Share CapEx
Share OpEx
Share NetCost
Figure 6 - 5 Comparison of cost results with global GDP.
transport activity (modal shift). Additional costs for more trains, buses, railroads and railroad power are overcompensated by lower costs for saved cars, trucks, road construction and maintenance, as well as the associated saving on transport fuels. More detail is given in Section 6.5.
197Part 2 - The Ecofys Energy Scenario
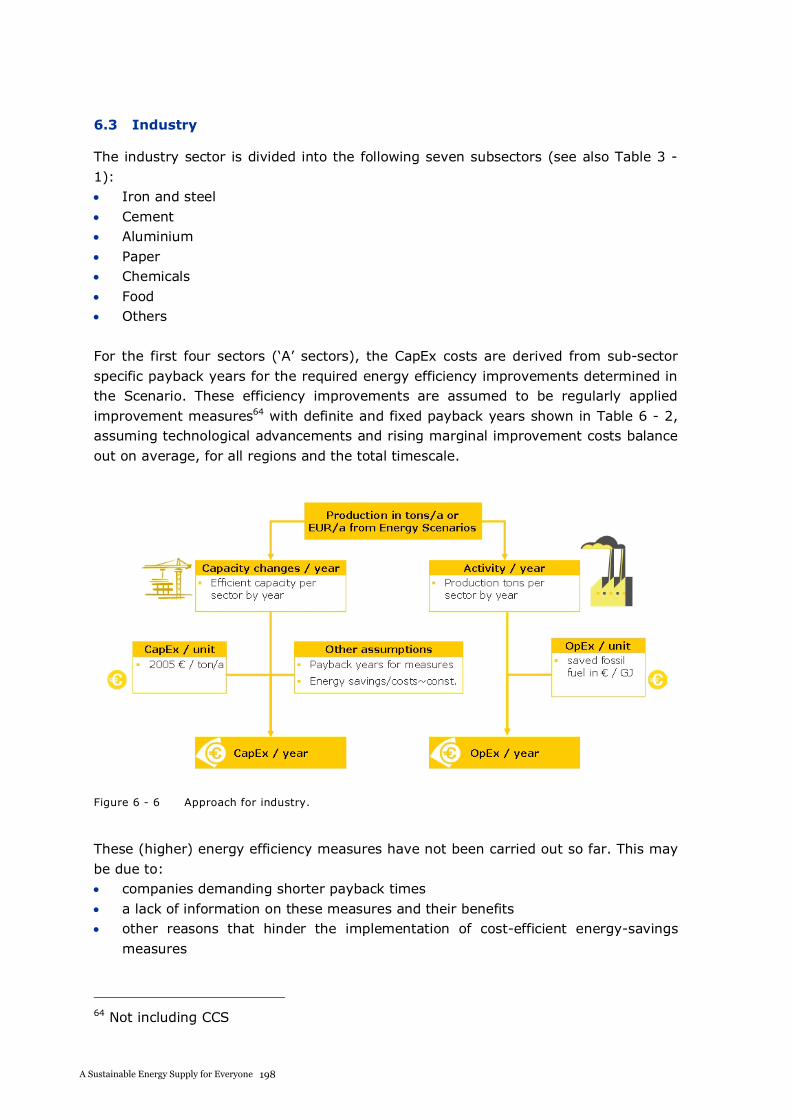
A S USTAI NABLE E NERGY S UPPLY F OR EVERY ONE
6.3 Industry
The industry sector is divided into the following seven subsectors (see also Table 3 - 1):
Iron and steel Cement Aluminium Paper Chemicals Food Others
For the first four sectors (‘A’ sectors), the CapEx costs are derived from sub-sector specific payback years for the required energy efficiency improvements determined in the Scenario. These efficiency improvements are assumed to be regularly applied improvement measures64 with definite and fixed payback years shown in Table 6 - 2, assuming technological advancements and rising marginal improvement costs balance out on average, for all regions and the total timescale.
Figure 6 - 6 Approach for industry.
These (higher) energy efficiency measures have not been carried out so far. This may be due to:
companies demanding shorter payback times a lack of information on these measures and their benefits other reasons that hinder the implementation of cost-efficient energy-savings measures
64 Not including CCS
A S USTAI NABLE E NERGY S UPPLY F OR EVERY ONE
The payback years for the measures required to achieve the Energy Scenario’s additional efficiency improvement are estimated with all implications of the Scenario in mind. This means that the same measures may have longer payback periods in the baseline, as the Scenario contains stronger developments in energy efficiency technologies across all sectors and regions than the baseline. Because of economies of scope and scale, the costs for energy efficiency measures in the industry sector are lower in the Energy Scenario than in the baseline. Parts of the costs are “paid back” by higher demand (and prices) for more energy efficient products and production processes.
Table 6 - 2 Payback years per industry sub-sector
Sector Payback years
Steel 4
Cement 3.5
Aluminium 4
Paper 5.5
The payback years are multiplied by fuel costs to calculate investment per annual production unit. CapEx costs are then calculated based on capacity data derived from activity data used in the Scenario, including the costs for end-of-lifetime replacements. OpEx costs are derived from a fixed OpEx cost share of 2% in relation to CapEx to account for higher operational costs for energy efficiency equipment, as well as fuel cost savings derived from the basic set of energy prices and efficiency improvements, including a shift from fossil fuels to electricity for several processes.
The results for the four ‘A’ sectors were then extrapolated to the entire industry sector using their relative size in energy terms.
198A Sustainable Energy Supply for Everyone
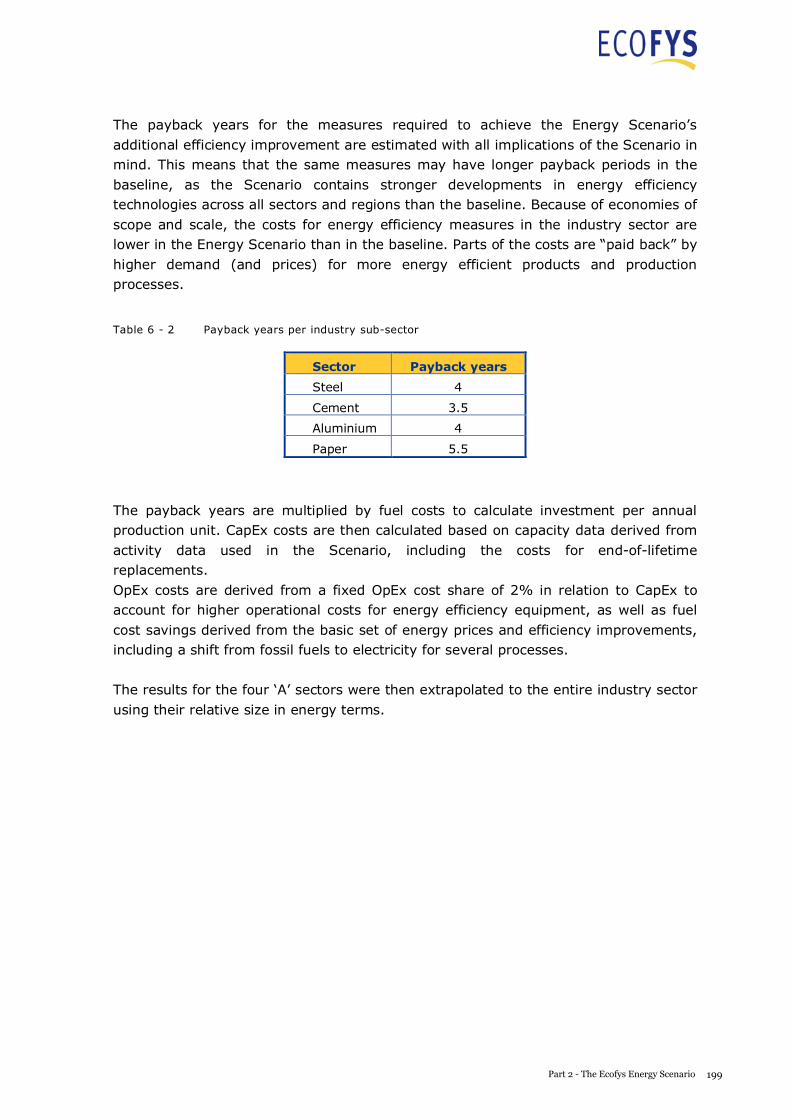
A S USTAI NABLE E NERGY S UPPLY F OR EVERY ONE
The payback years for the measures required to achieve the Energy Scenario’s additional efficiency improvement are estimated with all implications of the Scenario in mind. This means that the same measures may have longer payback periods in the baseline, as the Scenario contains stronger developments in energy efficiency technologies across all sectors and regions than the baseline. Because of economies of scope and scale, the costs for energy efficiency measures in the industry sector are lower in the Energy Scenario than in the baseline. Parts of the costs are “paid back” by higher demand (and prices) for more energy efficient products and production processes.
Table 6 - 2 Payback years per industry sub-sector
Sector Payback years
Steel 4
Cement 3.5
Aluminium 4
Paper 5.5
The payback years are multiplied by fuel costs to calculate investment per annual production unit. CapEx costs are then calculated based on capacity data derived from activity data used in the Scenario, including the costs for end-of-lifetime replacements. OpEx costs are derived from a fixed OpEx cost share of 2% in relation to CapEx to account for higher operational costs for energy efficiency equipment, as well as fuel cost savings derived from the basic set of energy prices and efficiency improvements, including a shift from fossil fuels to electricity for several processes.
The results for the four ‘A’ sectors were then extrapolated to the entire industry sector using their relative size in energy terms.
199Part 2 - The Ecofys Energy Scenario
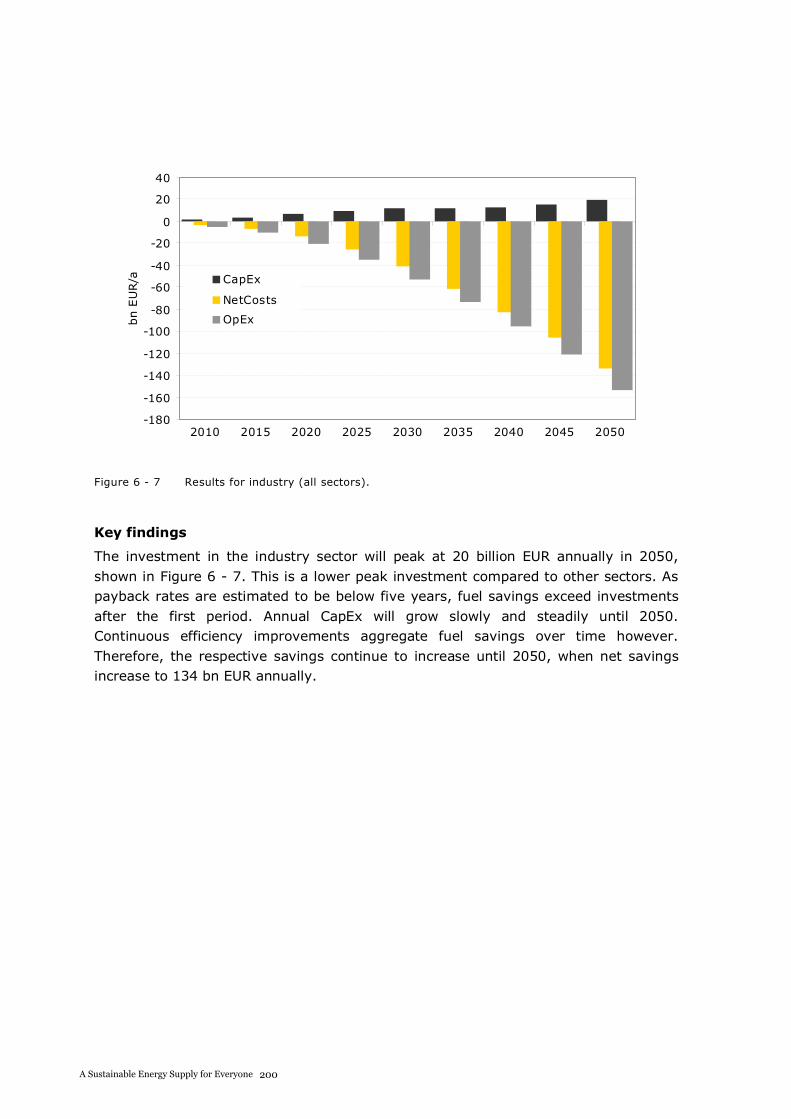
A S USTAI NABLE E NERGY S UPPLY F OR EVERY ONE
-180
-160
-140
-120
-100
-80
-60
-40
-20
0
20
40
2010 2015 2020 2025 2030 2035 2040 2045 2050
bn
EU
R/a CapEx
NetCosts
OpEx
Figure 6 - 7 Results for industry (all sectors).
Key findings
The investment in the industry sector will peak at 20 billion EUR annually in 2050, shown in Figure 6 - 7. This is a lower peak investment compared to other sectors. As payback rates are estimated to be below five years, fuel savings exceed investments after the first period. Annual CapEx will grow slowly and steadily until 2050. Continuous efficiency improvements aggregate fuel savings over time however. Therefore, the respective savings continue to increase until 2050, when net savings increase to 134 bn EUR annually.
200A Sustainable Energy Supply for Everyone
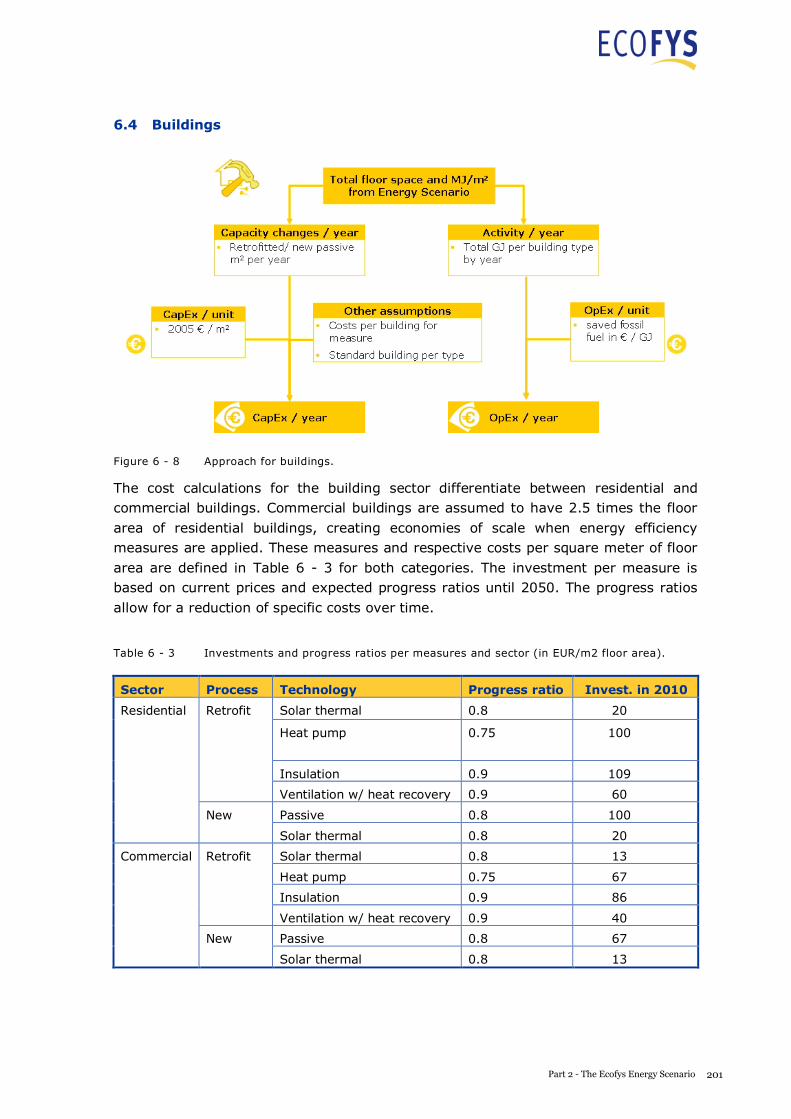
A S USTAI NABLE E NERGY S UPPLY F OR EVERY ONE
-180
-160
-140
-120
-100
-80
-60
-40
-20
0
20
40
2010 2015 2020 2025 2030 2035 2040 2045 2050
bn
EU
R/a CapEx
NetCosts
OpEx
Figure 6 - 7 Results for industry (all sectors).
Key findings
The investment in the industry sector will peak at 20 billion EUR annually in 2050, shown in Figure 6 - 7. This is a lower peak investment compared to other sectors. As payback rates are estimated to be below five years, fuel savings exceed investments after the first period. Annual CapEx will grow slowly and steadily until 2050. Continuous efficiency improvements aggregate fuel savings over time however. Therefore, the respective savings continue to increase until 2050, when net savings increase to 134 bn EUR annually.
A S USTAI NABLE E NERGY S UPPLY F OR EVERY ONE
6.4 Buildings
Figure 6 - 8 Approach for buildings.
The cost calculations for the building sector differentiate between residential and commercial buildings. Commercial buildings are assumed to have 2.5 times the floor area of residential buildings, creating economies of scale when energy efficiency measures are applied. These measures and respective costs per square meter of floor area are defined in Table 6 - 3 for both categories. The investment per measure is based on current prices and expected progress ratios until 2050. The progress ratios allow for a reduction of specific costs over time.
Table 6 - 3 Investments and progress ratios per measures and sector (in EUR/m2 floor area).
Sector Process Technology Progress ratio Invest. in 2010
Residential Retrofit Solar thermal 0.8 20
Heat pump 0.75 100
Insulation 0.9 109
Ventilation w/ heat recovery 0.9 60
New Passive 0.8 100
Solar thermal 0.8 20
Commercial Retrofit Solar thermal 0.8 13
Heat pump 0.75 67
Insulation 0.9 86
Ventilation w/ heat recovery 0.9 40
New Passive 0.8 67
Solar thermal 0.8 13
201Part 2 - The Ecofys Energy Scenario
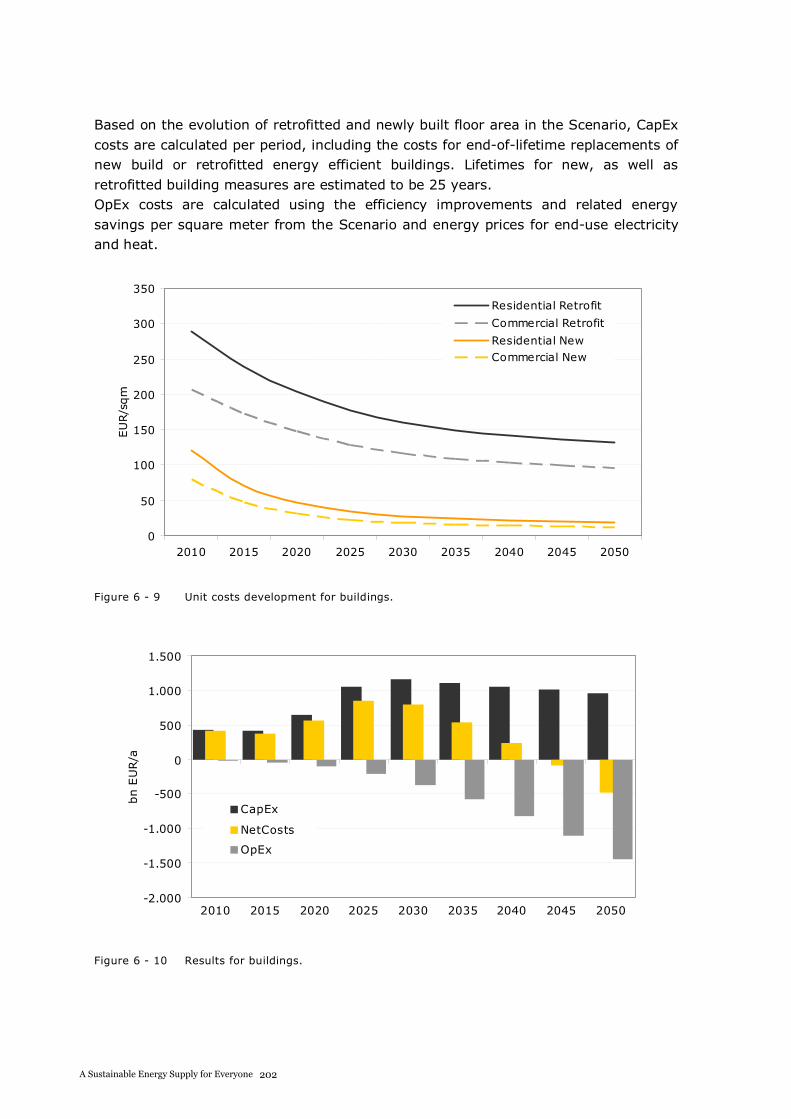
A S USTAI NABLE E NERGY S UPPLY F OR EVERY ONE
Based on the evolution of retrofitted and newly built floor area in the Scenario, CapEx costs are calculated per period, including the costs for end-of-lifetime replacements of new build or retrofitted energy efficient buildings. Lifetimes for new, as well as retrofitted building measures are estimated to be 25 years. OpEx costs are calculated using the efficiency improvements and related energy savings per square meter from the Scenario and energy prices for end-use electricity and heat.
0
50
100
150
200
250
300
350
2010 2015 2020 2025 2030 2035 2040 2045 2050
EU
R/s
qm
Residential Retrofit
Commercial Retrofit
Residential NewCommercial New
Figure 6 - 9 Unit costs development for buildings.
-2.000
-1.500
-1.000
-500
0
500
1.000
1.500
2010 2015 2020 2025 2030 2035 2040 2045 2050
bn
EU
R/a
CapEx
NetCosts
OpEx
Figure 6 - 10 Results for buildings.
202A Sustainable Energy Supply for Everyone
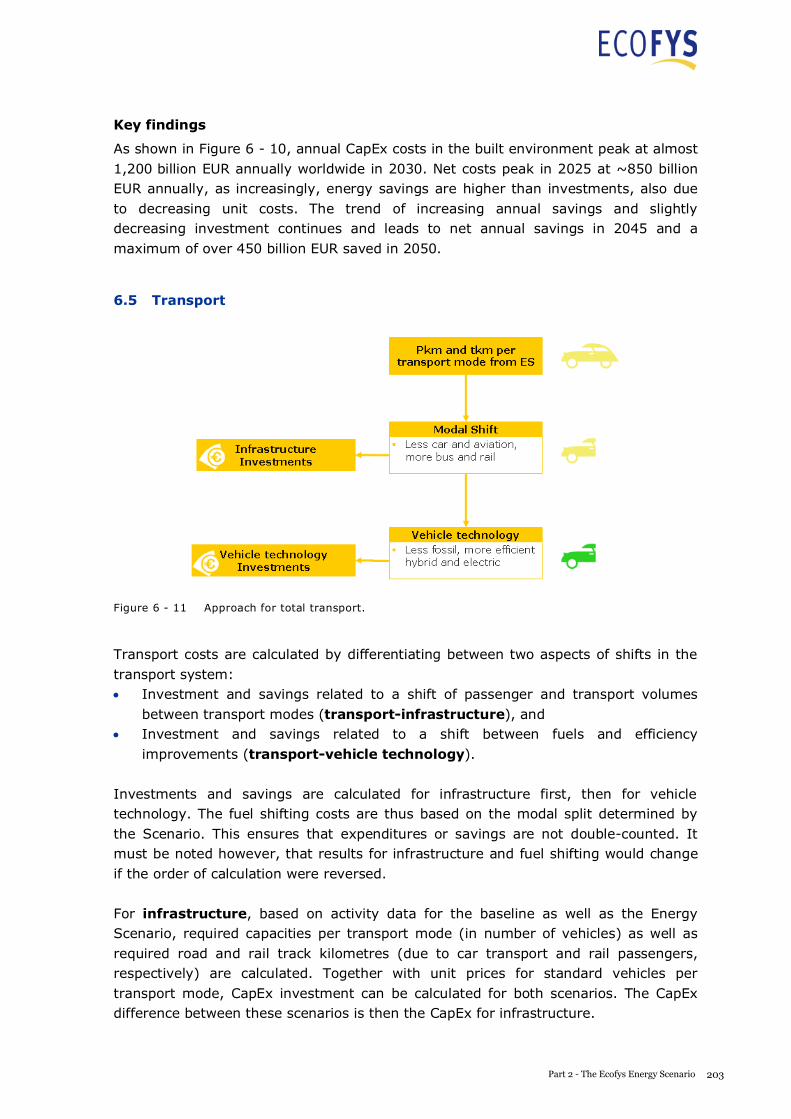
A S USTAI NABLE E NERGY S UPPLY F OR EVERY ONE
Based on the evolution of retrofitted and newly built floor area in the Scenario, CapEx costs are calculated per period, including the costs for end-of-lifetime replacements of new build or retrofitted energy efficient buildings. Lifetimes for new, as well as retrofitted building measures are estimated to be 25 years. OpEx costs are calculated using the efficiency improvements and related energy savings per square meter from the Scenario and energy prices for end-use electricity and heat.
0
50
100
150
200
250
300
350
2010 2015 2020 2025 2030 2035 2040 2045 2050
EU
R/s
qm
Residential Retrofit
Commercial Retrofit
Residential NewCommercial New
Figure 6 - 9 Unit costs development for buildings.
-2.000
-1.500
-1.000
-500
0
500
1.000
1.500
2010 2015 2020 2025 2030 2035 2040 2045 2050
bn
EU
R/a
CapEx
NetCosts
OpEx
Figure 6 - 10 Results for buildings.
A S USTAI NABLE E NERGY S UPPLY F OR EVERY ONE
Key findings
As shown in Figure 6 - 10, annual CapEx costs in the built environment peak at almost 1,200 billion EUR annually worldwide in 2030. Net costs peak in 2025 at ~850 billion EUR annually, as increasingly, energy savings are higher than investments, also due to decreasing unit costs. The trend of increasing annual savings and slightly decreasing investment continues and leads to net annual savings in 2045 and a maximum of over 450 billion EUR saved in 2050.
6.5 Transport
Figure 6 - 11 Approach for total transport.
Transport costs are calculated by differentiating between two aspects of shifts in the transport system:
Investment and savings related to a shift of passenger and transport volumes between transport modes (transport-infrastructure), and Investment and savings related to a shift between fuels and efficiency improvements (transport-vehicle technology).
Investments and savings are calculated for infrastructure first, then for vehicle technology. The fuel shifting costs are thus based on the modal split determined by the Scenario. This ensures that expenditures or savings are not double-counted. It must be noted however, that results for infrastructure and fuel shifting would change if the order of calculation were reversed.
For infrastructure, based on activity data for the baseline as well as the Energy Scenario, required capacities per transport mode (in number of vehicles) as well as required road and rail track kilometres (due to car transport and rail passengers, respectively) are calculated. Together with unit prices for standard vehicles per transport mode, CapEx investment can be calculated for both scenarios. The CapEx difference between these scenarios is then the CapEx for infrastructure.
203Part 2 - The Ecofys Energy Scenario
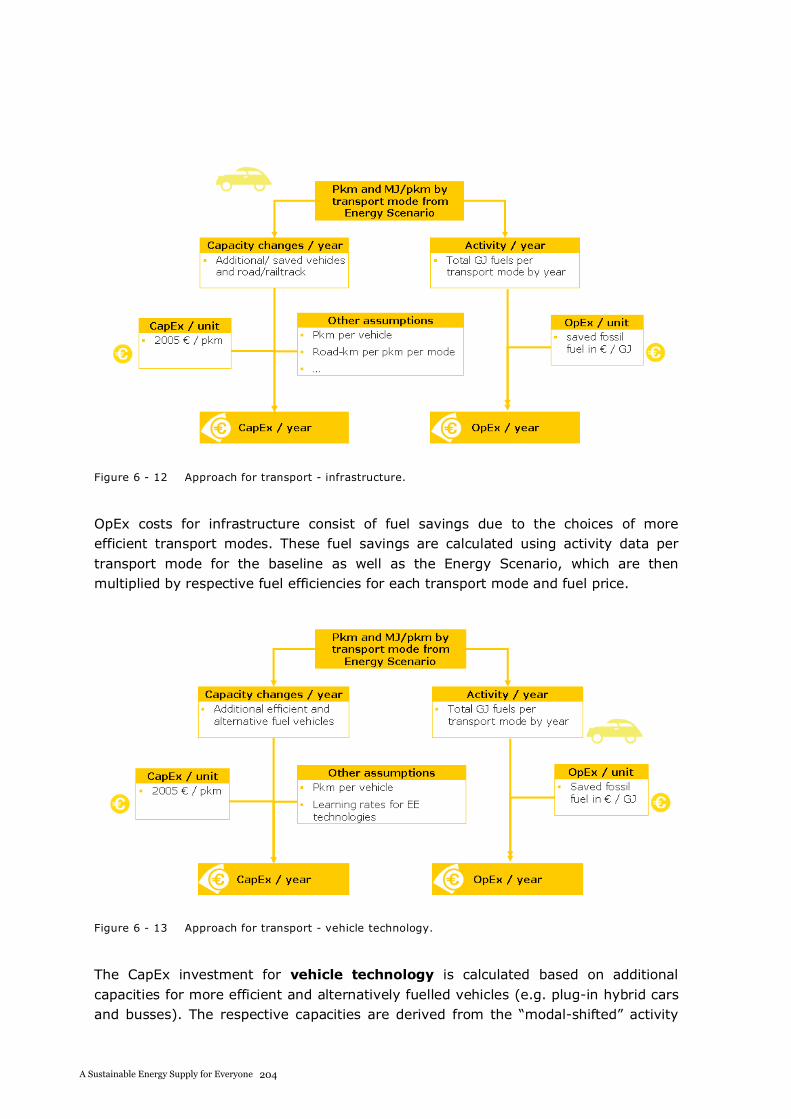
A S USTAI NABLE E NERGY S UPPLY F OR EVERY ONE
Figure 6 - 12 Approach for transport - infrastructure.
OpEx costs for infrastructure consist of fuel savings due to the choices of more efficient transport modes. These fuel savings are calculated using activity data per transport mode for the baseline as well as the Energy Scenario, which are then multiplied by respective fuel efficiencies for each transport mode and fuel price.
Figure 6 - 13 Approach for transport - vehicle technology.
The CapEx investment for vehicle technology is calculated based on additional capacities for more efficient and alternatively fuelled vehicles (e.g. plug-in hybrid cars and busses). The respective capacities are derived from the “modal-shifted” activity
204A Sustainable Energy Supply for Everyone
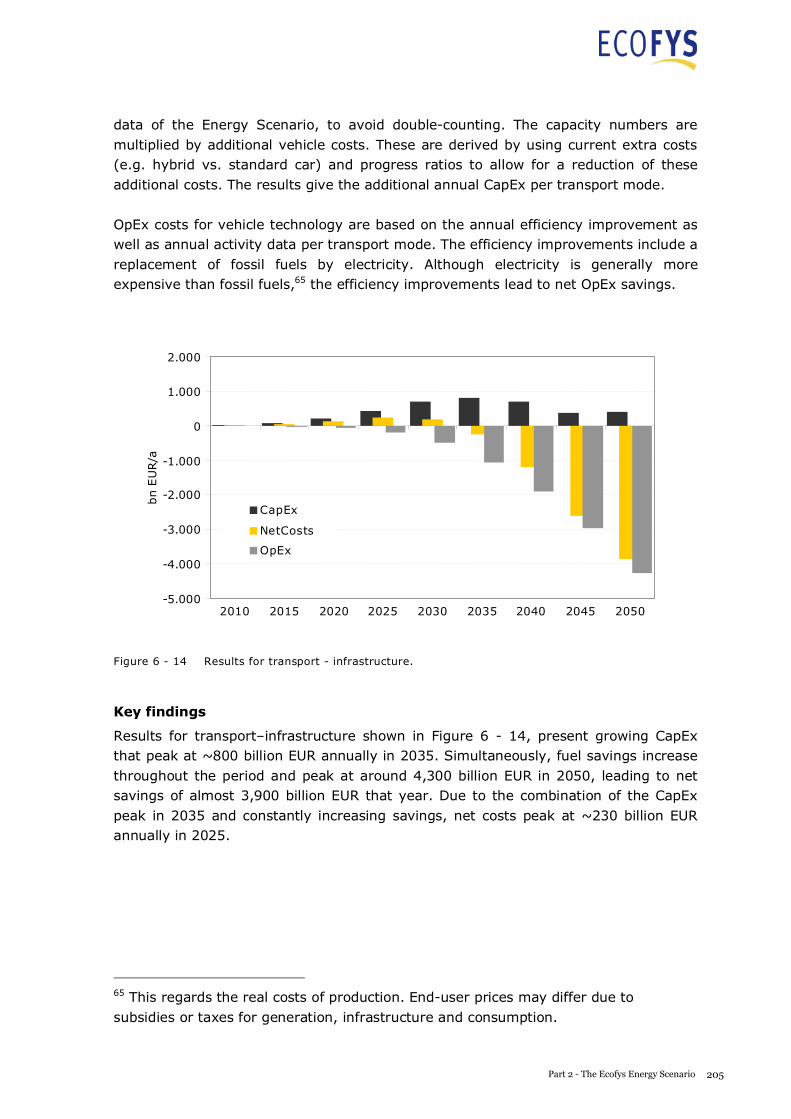
A S USTAI NABLE E NERGY S UPPLY F OR EVERY ONE
Figure 6 - 12 Approach for transport - infrastructure.
OpEx costs for infrastructure consist of fuel savings due to the choices of more efficient transport modes. These fuel savings are calculated using activity data per transport mode for the baseline as well as the Energy Scenario, which are then multiplied by respective fuel efficiencies for each transport mode and fuel price.
Figure 6 - 13 Approach for transport - vehicle technology.
The CapEx investment for vehicle technology is calculated based on additional capacities for more efficient and alternatively fuelled vehicles (e.g. plug-in hybrid cars and busses). The respective capacities are derived from the “modal-shifted” activity
A S USTAI NABLE E NERGY S UPPLY F OR EVERY ONE
data of the Energy Scenario, to avoid double-counting. The capacity numbers are multiplied by additional vehicle costs. These are derived by using current extra costs (e.g. hybrid vs. standard car) and progress ratios to allow for a reduction of these additional costs. The results give the additional annual CapEx per transport mode.
OpEx costs for vehicle technology are based on the annual efficiency improvement as well as annual activity data per transport mode. The efficiency improvements include a replacement of fossil fuels by electricity. Although electricity is generally more expensive than fossil fuels,65 the efficiency improvements lead to net OpEx savings.
-5.000
-4.000
-3.000
-2.000
-1.000
0
1.000
2.000
2010 2015 2020 2025 2030 2035 2040 2045 2050
bn
EU
R/a
CapEx
NetCosts
OpEx
Figure 6 - 14 Results for transport - infrastructure.
Key findings
Results for transport–infrastructure shown in Figure 6 - 14, present growing CapEx that peak at ~800 billion EUR annually in 2035. Simultaneously, fuel savings increase throughout the period and peak at around 4,300 billion EUR in 2050, leading to net savings of almost 3,900 billion EUR that year. Due to the combination of the CapEx peak in 2035 and constantly increasing savings, net costs peak at ~230 billion EUR annually in 2025.
65 This regards the real costs of production. End-user prices may differ due to subsidies or taxes for generation, infrastructure and consumption.
205Part 2 - The Ecofys Energy Scenario
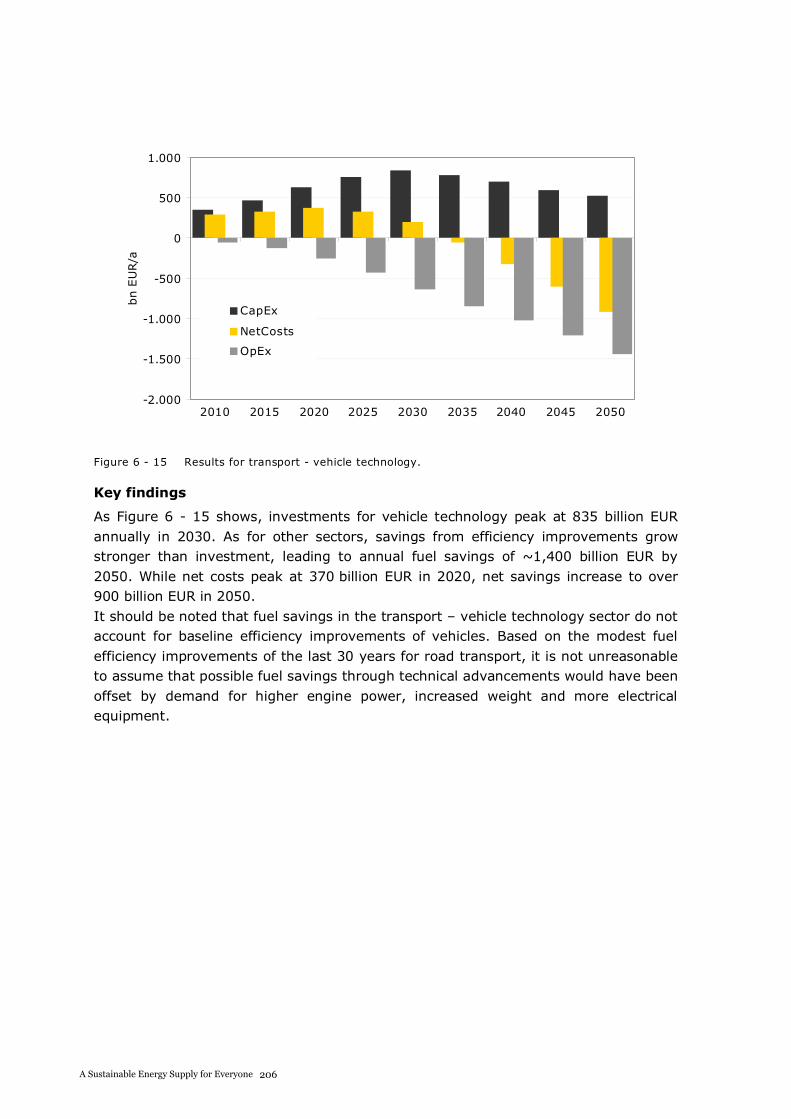
A S USTAI NABLE E NERGY S UPPLY F OR EVERY ONE
-2.000
-1.500
-1.000
-500
0
500
1.000
2010 2015 2020 2025 2030 2035 2040 2045 2050
bn
EU
R/a
CapEx
NetCosts
OpEx
Figure 6 - 15 Results for transport - vehicle technology.
Key findings
As Figure 6 - 15 shows, investments for vehicle technology peak at 835 billion EUR annually in 2030. As for other sectors, savings from efficiency improvements grow stronger than investment, leading to annual fuel savings of ~1,400 billion EUR by 2050. While net costs peak at 370 billion EUR in 2020, net savings increase to over 900 billion EUR in 2050. It should be noted that fuel savings in the transport – vehicle technology sector do not account for baseline efficiency improvements of vehicles. Based on the modest fuel efficiency improvements of the last 30 years for road transport, it is not unreasonable to assume that possible fuel savings through technical advancements would have been offset by demand for higher engine power, increased weight and more electrical equipment.
A S USTAI NABLE E NERGY S UPPLY F OR EVERY ONE
6.6 Power
Figure 6 - 16 Approach for power.
The CapEx costs for power are calculated from additional capacity and unit costs. Additional capacity (in MW) per source is calculated based on activity data per renewable energy source. Capacity unit costs for the different sources are taken from literature sources, mostly [Ecofys, 2009a], as well as expert knowledge. Only CapEx investments for demand-driven power sources have been offset against CapEx investments for conventional plants that would have been built or replaced in the reference scenario. All supply-driven power source investments have been treated as fully additional, e.g. wind and PV. They therefore represent a high estimate. The calculated CapEx costs per RES source are shown in Table 6 - 4.
Table 6 - 4 Capacity costs of RES electricity (000s EUR/ MW).
Source Load
Hrs
Progress
ratio 2010 2020 2030 2040 2050
Wind onshore 2000 0.85 1,200 800 700 600 600
Wind offshore 3500 0.9 3,000 1,800 1,500 1,300 1,200
Wave 2500 0.9 3,600 2,800 2,300 1,800 1,600
PV 1000 0.8 3,300 1,400 700 500 400
CSP 4000 0.9 4,400 3,300 2,500 2,100 1,900
Geothermal 7000 0.8 3,500 2,700 2,000 1,600 1,500
Hydro 5000 1 2,500 2,500 2,500 2,500 2,500
The capacity unit costs until 2050 are derived by using current investment per MW as a basis and applying progress ratios for future periods.
206A Sustainable Energy Supply for Everyone
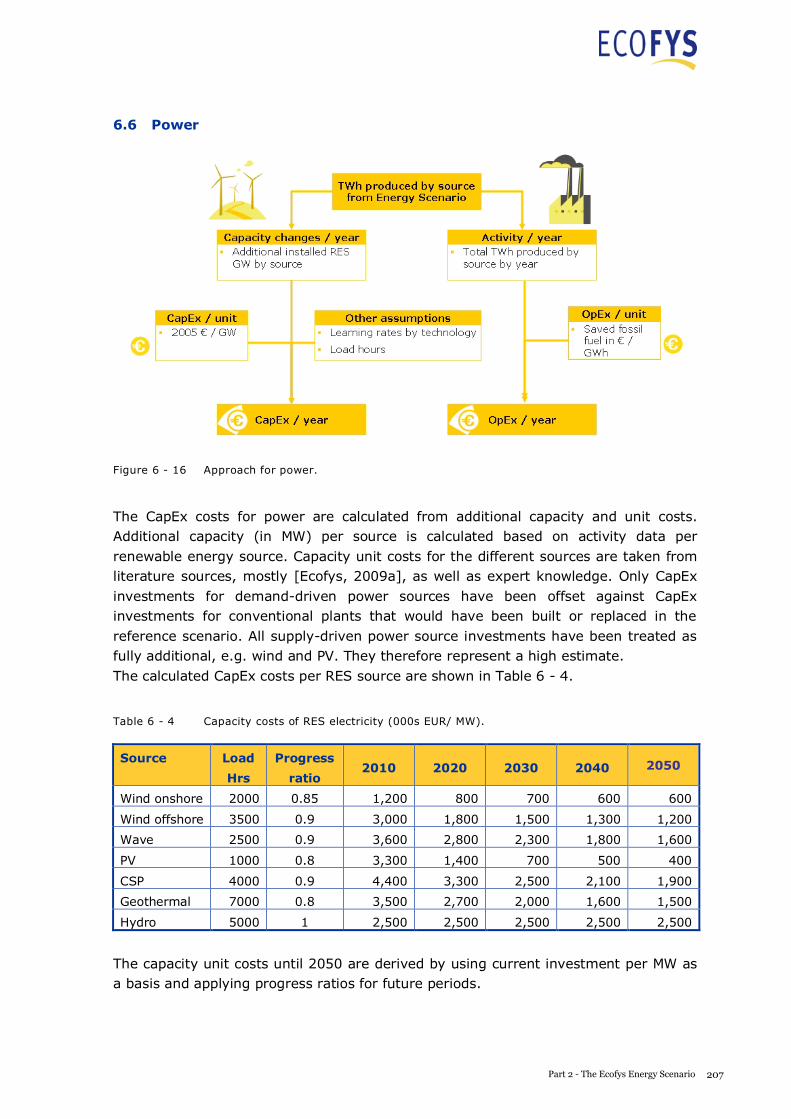
A S USTAI NABLE E NERGY S UPPLY F OR EVERY ONE
6.6 Power
Figure 6 - 16 Approach for power.
The CapEx costs for power are calculated from additional capacity and unit costs. Additional capacity (in MW) per source is calculated based on activity data per renewable energy source. Capacity unit costs for the different sources are taken from literature sources, mostly [Ecofys, 2009a], as well as expert knowledge. Only CapEx investments for demand-driven power sources have been offset against CapEx investments for conventional plants that would have been built or replaced in the reference scenario. All supply-driven power source investments have been treated as fully additional, e.g. wind and PV. They therefore represent a high estimate. The calculated CapEx costs per RES source are shown in Table 6 - 4.
Table 6 - 4 Capacity costs of RES electricity (000s EUR/ MW).
Source Load
Hrs
Progress
ratio 2010 2020 2030 2040 2050
Wind onshore 2000 0.85 1,200 800 700 600 600
Wind offshore 3500 0.9 3,000 1,800 1,500 1,300 1,200
Wave 2500 0.9 3,600 2,800 2,300 1,800 1,600
PV 1000 0.8 3,300 1,400 700 500 400
CSP 4000 0.9 4,400 3,300 2,500 2,100 1,900
Geothermal 7000 0.8 3,500 2,700 2,000 1,600 1,500
Hydro 5000 1 2,500 2,500 2,500 2,500 2,500
The capacity unit costs until 2050 are derived by using current investment per MW as a basis and applying progress ratios for future periods.
207Part 2 - The Ecofys Energy Scenario
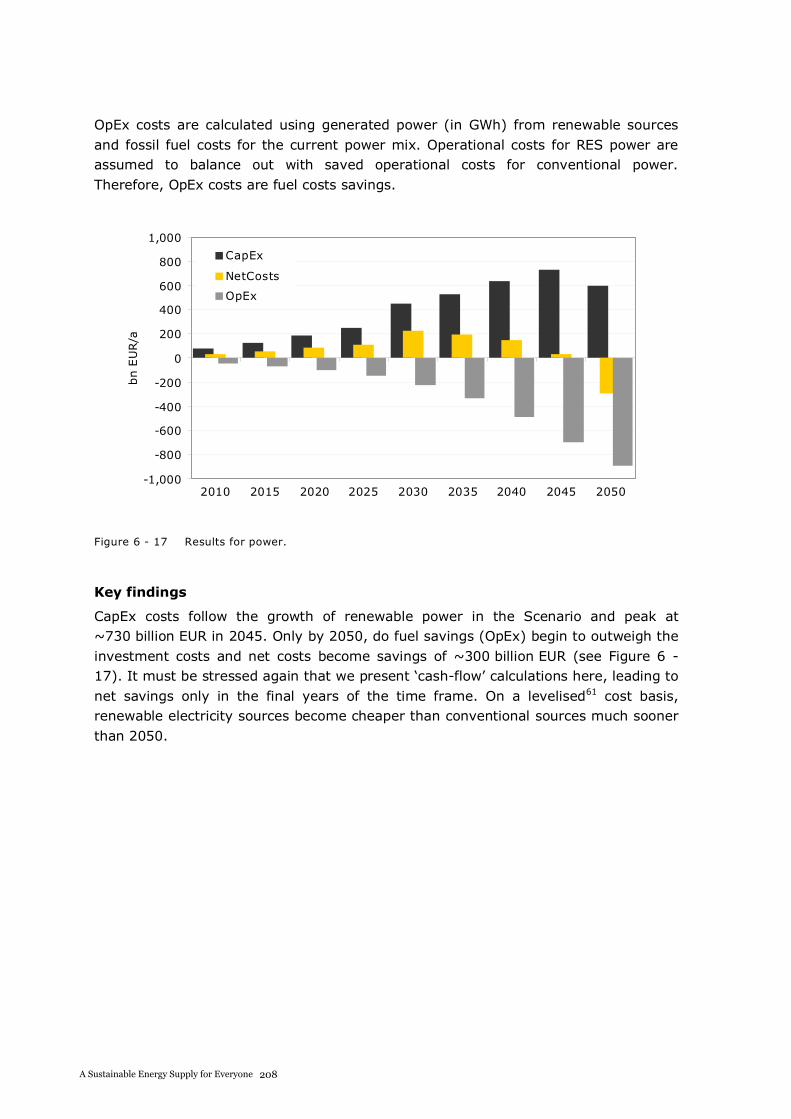
A S USTAI NABLE E NERGY S UPPLY F OR EVERY ONE
OpEx costs are calculated using generated power (in GWh) from renewable sources and fossil fuel costs for the current power mix. Operational costs for RES power are assumed to balance out with saved operational costs for conventional power. Therefore, OpEx costs are fuel costs savings.
-1,000
-800
-600
-400
-200
0
200
400
600
800
1,000
2010 2015 2020 2025 2030 2035 2040 2045 2050
bn
EU
R/a
CapEx
NetCosts
OpEx
Figure 6 - 17 Results for power.
Key findings
CapEx costs follow the growth of renewable power in the Scenario and peak at ~730 billion EUR in 2045. Only by 2050, do fuel savings (OpEx) begin to outweigh the investment costs and net costs become savings of ~300 billion EUR (see Figure 6 - 17). It must be stressed again that we present ‘cash-flow’ calculations here, leading to net savings only in the final years of the time frame. On a levelised61 cost basis, renewable electricity sources become cheaper than conventional sources much sooner than 2050.
208A Sustainable Energy Supply for Everyone
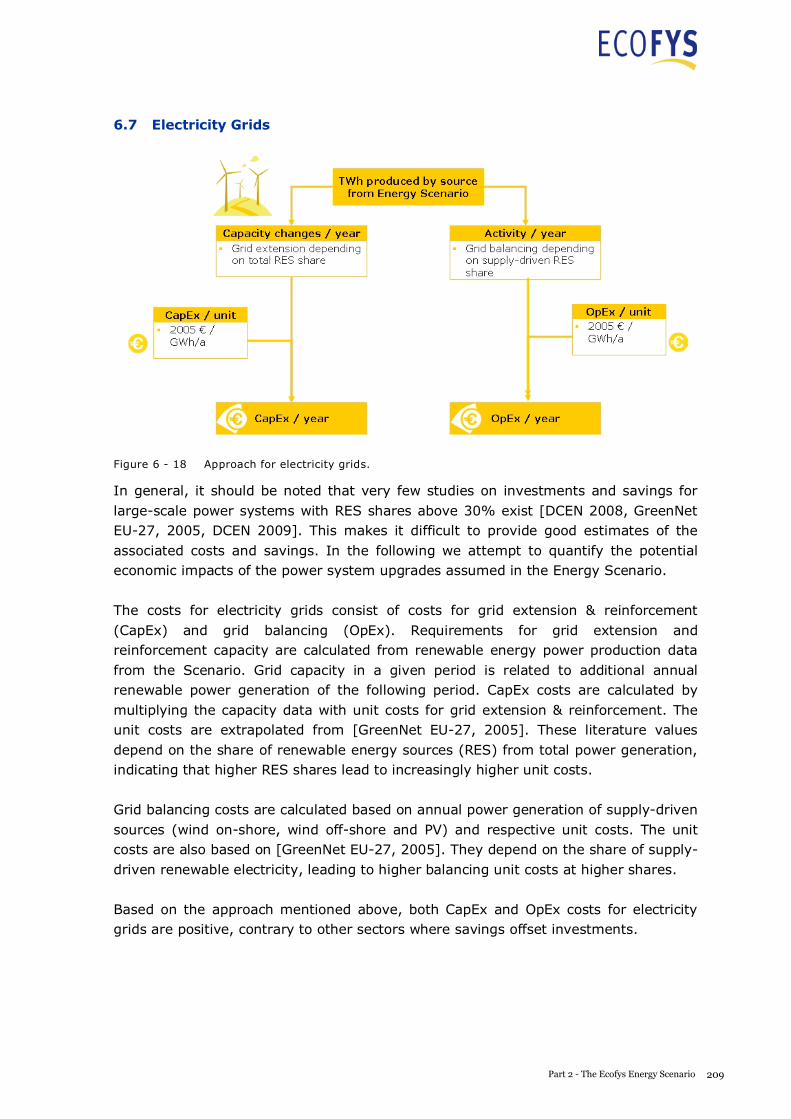
A S USTAI NABLE E NERGY S UPPLY F OR EVERY ONE
OpEx costs are calculated using generated power (in GWh) from renewable sources and fossil fuel costs for the current power mix. Operational costs for RES power are assumed to balance out with saved operational costs for conventional power. Therefore, OpEx costs are fuel costs savings.
-1,000
-800
-600
-400
-200
0
200
400
600
800
1,000
2010 2015 2020 2025 2030 2035 2040 2045 2050
bn
EU
R/a
CapEx
NetCosts
OpEx
Figure 6 - 17 Results for power.
Key findings
CapEx costs follow the growth of renewable power in the Scenario and peak at ~730 billion EUR in 2045. Only by 2050, do fuel savings (OpEx) begin to outweigh the investment costs and net costs become savings of ~300 billion EUR (see Figure 6 - 17). It must be stressed again that we present ‘cash-flow’ calculations here, leading to net savings only in the final years of the time frame. On a levelised61 cost basis, renewable electricity sources become cheaper than conventional sources much sooner than 2050.
A S USTAI NABLE E NERGY S UPPLY F OR EVERY ONE
6.7 Electricity Grids
Figure 6 - 18 Approach for electricity grids.
In general, it should be noted that very few studies on investments and savings for large-scale power systems with RES shares above 30% exist [DCEN 2008, GreenNet EU-27, 2005, DCEN 2009]. This makes it difficult to provide good estimates of the associated costs and savings. In the following we attempt to quantify the potential economic impacts of the power system upgrades assumed in the Energy Scenario.
The costs for electricity grids consist of costs for grid extension & reinforcement (CapEx) and grid balancing (OpEx). Requirements for grid extension and reinforcement capacity are calculated from renewable energy power production data from the Scenario. Grid capacity in a given period is related to additional annual renewable power generation of the following period. CapEx costs are calculated by multiplying the capacity data with unit costs for grid extension & reinforcement. The unit costs are extrapolated from [GreenNet EU-27, 2005]. These literature values depend on the share of renewable energy sources (RES) from total power generation, indicating that higher RES shares lead to increasingly higher unit costs.
Grid balancing costs are calculated based on annual power generation of supply-driven sources (wind on-shore, wind off-shore and PV) and respective unit costs. The unit costs are also based on [GreenNet EU-27, 2005]. They depend on the share of supply-driven renewable electricity, leading to higher balancing unit costs at higher shares.
Based on the approach mentioned above, both CapEx and OpEx costs for electricity grids are positive, contrary to other sectors where savings offset investments.
209Part 2 - The Ecofys Energy Scenario
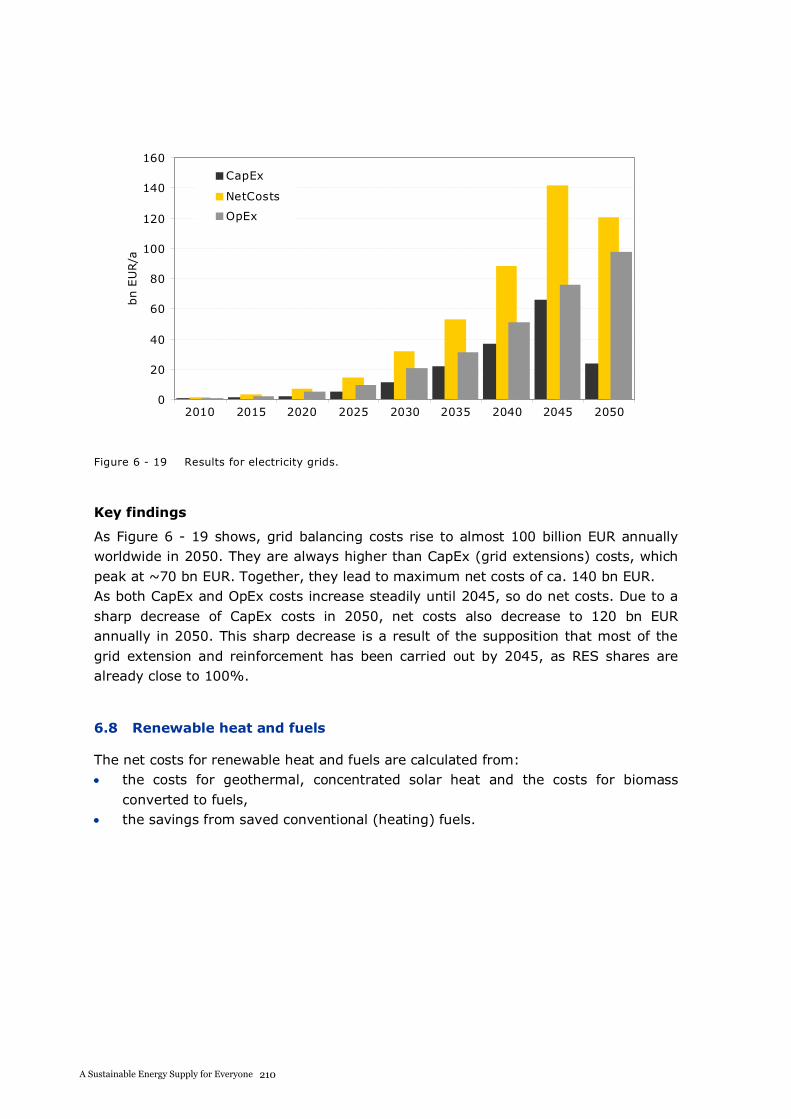
A S USTAI NABLE E NERGY S UPPLY F OR EVERY ONE
0
20
40
60
80
100
120
140
160
2010 2015 2020 2025 2030 2035 2040 2045 2050
bn
EU
R/a
CapEx
NetCosts
OpEx
Figure 6 - 19 Results for electricity grids.
Key findings
As Figure 6 - 19 shows, grid balancing costs rise to almost 100 billion EUR annually worldwide in 2050. They are always higher than CapEx (grid extensions) costs, which peak at ~70 bn EUR. Together, they lead to maximum net costs of ca. 140 bn EUR. As both CapEx and OpEx costs increase steadily until 2045, so do net costs. Due to a sharp decrease of CapEx costs in 2050, net costs also decrease to 120 bn EUR annually in 2050. This sharp decrease is a result of the supposition that most of the grid extension and reinforcement has been carried out by 2045, as RES shares are already close to 100%.
6.8 Renewable heat and fuels
The net costs for renewable heat and fuels are calculated from: the costs for geothermal, concentrated solar heat and the costs for biomass converted to fuels, the savings from saved conventional (heating) fuels.
210A Sustainable Energy Supply for Everyone
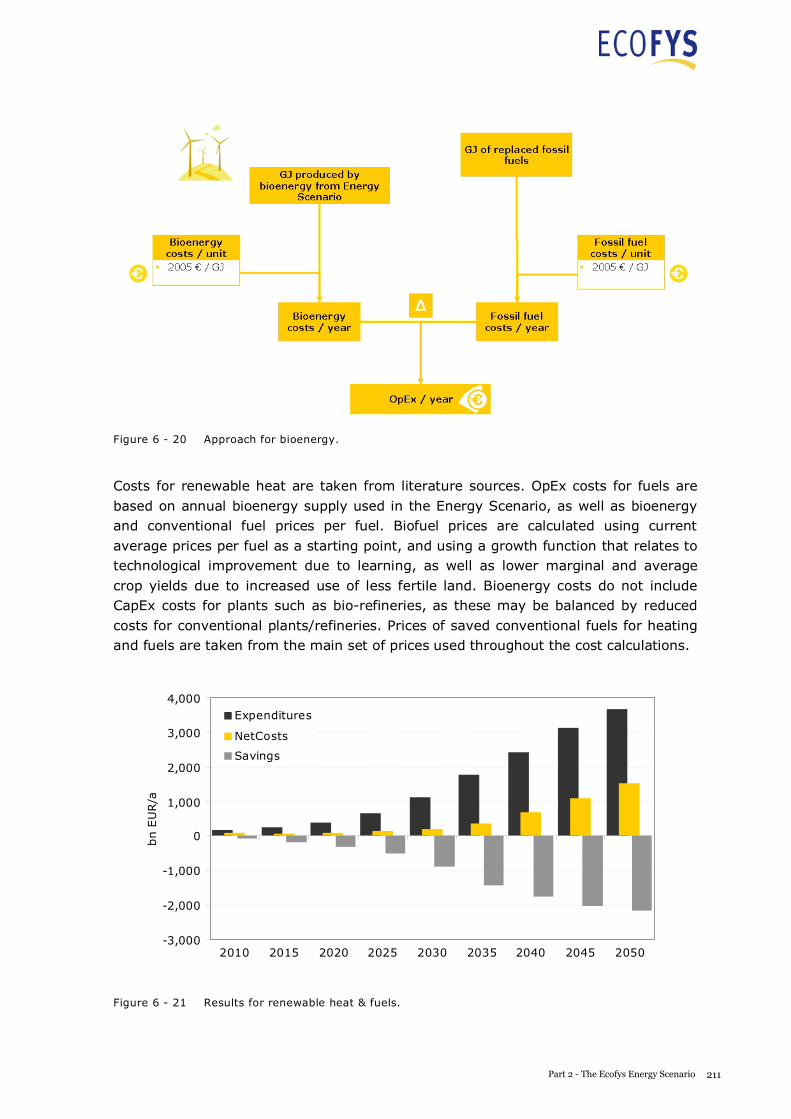
A S USTAI NABLE E NERGY S UPPLY F OR EVERY ONE
Figure 6 - 20 Approach for bioenergy.
Costs for renewable heat are taken from literature sources. OpEx costs for fuels are based on annual bioenergy supply used in the Energy Scenario, as well as bioenergy and conventional fuel prices per fuel. Biofuel prices are calculated using current average prices per fuel as a starting point, and using a growth function that relates to technological improvement due to learning, as well as lower marginal and average crop yields due to increased use of less fertile land. Bioenergy costs do not include CapEx costs for plants such as bio-refineries, as these may be balanced by reduced costs for conventional plants/refineries. Prices of saved conventional fuels for heating and fuels are taken from the main set of prices used throughout the cost calculations.
-3,000
-2,000
-1,000
0
1,000
2,000
3,000
4,000
2010 2015 2020 2025 2030 2035 2040 2045 2050
bn
EU
R/a
Expenditures
NetCosts
Savings
Figure 6 - 21 Results for renewable heat & fuels.
211Part 2 - The Ecofys Energy Scenario
A S USTAI NABLE E NERGY S UPPLY F OR EVERY ONE
Key findings
Figure 6 - 21 shows that steadily increasing expenditures for renewable heat and fuel lead to increased net costs of 1.5 trillion EUR per year in 2050, despite increased savings. This is due primarily to the fact that bioenergy prices are modelled to increase with demand, increasing costs of marginal yield outweighing the economies of scale of a growing market. Regarding the fundamental change of bioenergy use between 2010 and 2050, these assumptions contain high uncertainties and were therefore constructed from a conservative standpoint (=high cost increases). A more optimistic view that assumes higher economies of scale and lower price increases can be expected to change the outcomes considerably.
6.9 Research & Development
Costs for research and development (R&D) include CapEx costs only. They are calculated from CapEx investment per sector and sector-specific R&D intensities. R&D investment for a given 5-year-period is based on the CapEx investment for that sector for the following period. The specific R&D intensities by sector are assumed to be around 7% on average, depending on the sector. In accordance with necessary technological development for the Energy Scenario, we assume higher shares for
industry transport (Transport – vehicle technology) and electricity grids sectors,
and lower intensities for buildings, infrastructure (Transport – infrastructure). power renewable heat and fuels
A S USTAI NABLE E NERGY S UPPLY F OR EVERY ONE
Figure 6 - 22 Approach for R&D.
Key findings
Figure 6 - 22 shows that R&D investments rise to ~170 billion EUR in 2040 and decrease slightly afterwards. They reach 155 bn EUR in 2050. Until 2025, R&D spending is largely directed to energy demand sectors, especially the transport sector. Although this sector continues to be the top recipient, R&D spending is partially shifted to energy supply sectors after 2030, particularly the power and renewable fuels.
0
20
40
60
80
100
120
140
160
180
200
2010 2015 2020 2025 2030 2035 2040 2045 2050
bn
EU
R/a
CapEx
NetCosts
OpEx
Figure 6 - 23 Results for research & development.
6.10 Sensitivity analysis on energy prices
Most of the sector approaches described above calculate OpEx costs based on fossil fuel prices. In many cases, OpEx costs consist of saved fossil fuel expenditures only.
212A Sustainable Energy Supply for Everyone
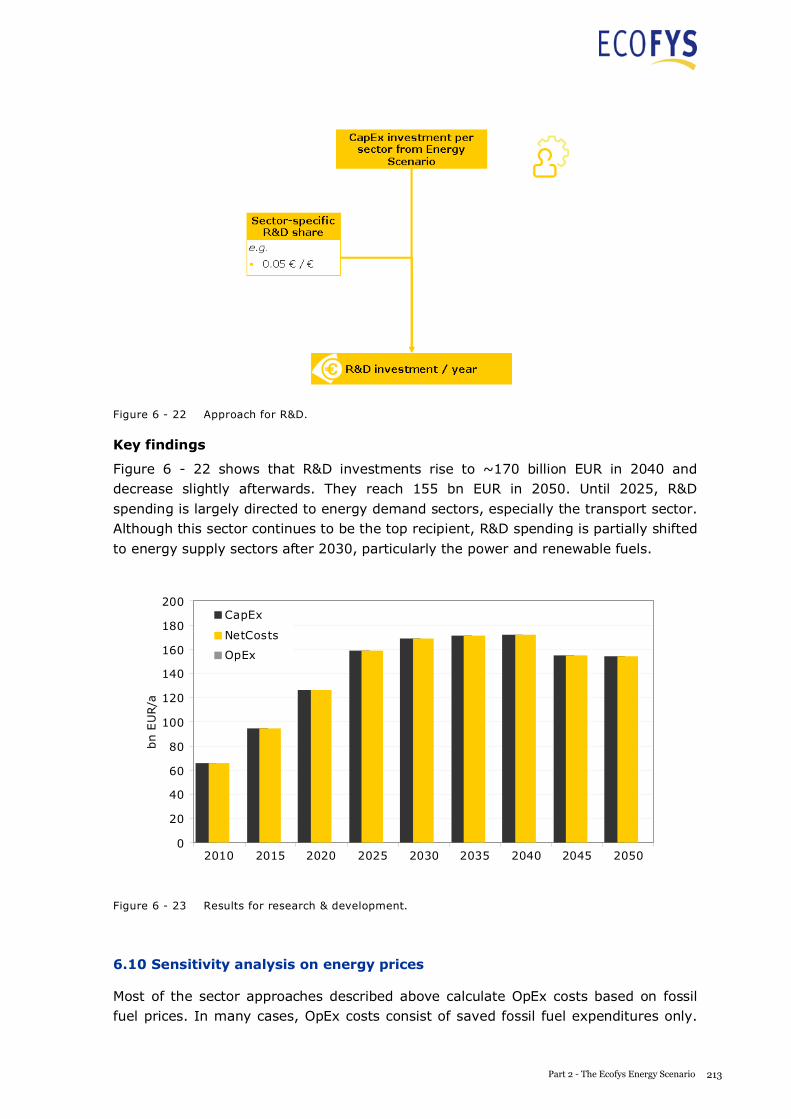
A S USTAI NABLE E NERGY S UPPLY F OR EVERY ONE
Figure 6 - 22 Approach for R&D.
Key findings
Figure 6 - 22 shows that R&D investments rise to ~170 billion EUR in 2040 and decrease slightly afterwards. They reach 155 bn EUR in 2050. Until 2025, R&D spending is largely directed to energy demand sectors, especially the transport sector. Although this sector continues to be the top recipient, R&D spending is partially shifted to energy supply sectors after 2030, particularly the power and renewable fuels.
0
20
40
60
80
100
120
140
160
180
200
2010 2015 2020 2025 2030 2035 2040 2045 2050
bn
EU
R/a
CapEx
NetCosts
OpEx
Figure 6 - 23 Results for research & development.
6.10 Sensitivity analysis on energy prices
Most of the sector approaches described above calculate OpEx costs based on fossil fuel prices. In many cases, OpEx costs consist of saved fossil fuel expenditures only.
213Part 2 - The Ecofys Energy Scenario
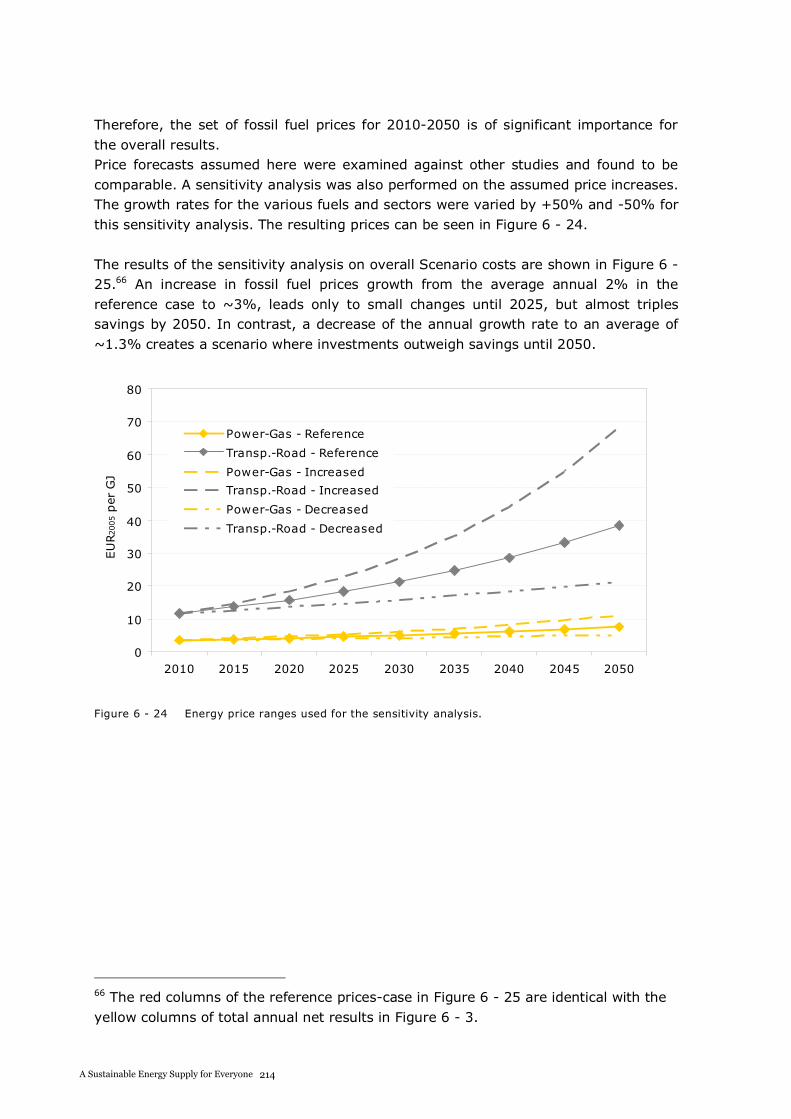
A S USTAI NABLE E NERGY S UPPLY F OR EVERY ONE
Therefore, the set of fossil fuel prices for 2010-2050 is of significant importance for the overall results. Price forecasts assumed here were examined against other studies and found to be comparable. A sensitivity analysis was also performed on the assumed price increases. The growth rates for the various fuels and sectors were varied by +50% and -50% for this sensitivity analysis. The resulting prices can be seen in Figure 6 - 24.
The results of the sensitivity analysis on overall Scenario costs are shown in Figure 6 - 25.66 An increase in fossil fuel prices growth from the average annual 2% in the reference case to ~3%, leads only to small changes until 2025, but almost triples savings by 2050. In contrast, a decrease of the annual growth rate to an average of ~1.3% creates a scenario where investments outweigh savings until 2050.
0
10
20
30
40
50
60
70
80
2010 2015 2020 2025 2030 2035 2040 2045 2050
EU
R2005
per
GJ
Power-Gas - Reference
Transp.-Road - Reference
Power-Gas - Increased
Transp.-Road - Increased
Power-Gas - Decreased
Transp.-Road - Decreased
Figure 6 - 24 Energy price ranges used for the sensitivity analysis.
66 The red columns of the reference prices-case in Figure 6 - 25 are identical with the yellow columns of total annual net results in Figure 6 - 3.
214A Sustainable Energy Supply for Everyone
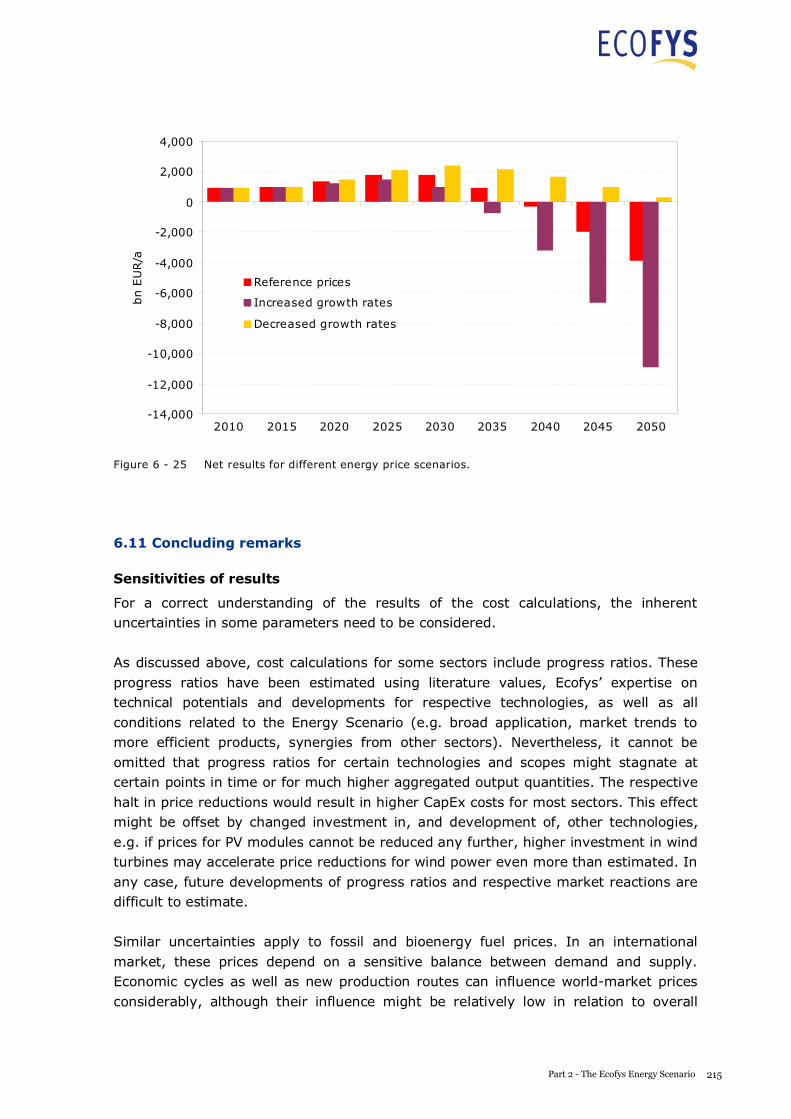
A S USTAI NABLE E NERGY S UPPLY F OR EVERY ONE
Therefore, the set of fossil fuel prices for 2010-2050 is of significant importance for the overall results. Price forecasts assumed here were examined against other studies and found to be comparable. A sensitivity analysis was also performed on the assumed price increases. The growth rates for the various fuels and sectors were varied by +50% and -50% for this sensitivity analysis. The resulting prices can be seen in Figure 6 - 24.
The results of the sensitivity analysis on overall Scenario costs are shown in Figure 6 - 25.66 An increase in fossil fuel prices growth from the average annual 2% in the reference case to ~3%, leads only to small changes until 2025, but almost triples savings by 2050. In contrast, a decrease of the annual growth rate to an average of ~1.3% creates a scenario where investments outweigh savings until 2050.
0
10
20
30
40
50
60
70
80
2010 2015 2020 2025 2030 2035 2040 2045 2050
EU
R2005
per
GJ
Power-Gas - Reference
Transp.-Road - Reference
Power-Gas - Increased
Transp.-Road - Increased
Power-Gas - Decreased
Transp.-Road - Decreased
Figure 6 - 24 Energy price ranges used for the sensitivity analysis.
66 The red columns of the reference prices-case in Figure 6 - 25 are identical with the yellow columns of total annual net results in Figure 6 - 3.
A S USTAI NABLE E NERGY S UPPLY F OR EVERY ONE
-14,000
-12,000
-10,000
-8,000
-6,000
-4,000
-2,000
0
2,000
4,000
2010 2015 2020 2025 2030 2035 2040 2045 2050
bn
EU
R/a
Reference prices
Increased growth rates
Decreased growth rates
Figure 6 - 25 Net results for different energy price scenarios.
6.11 Concluding remarks
Sensitivities of results
For a correct understanding of the results of the cost calculations, the inherent uncertainties in some parameters need to be considered.
As discussed above, cost calculations for some sectors include progress ratios. These progress ratios have been estimated using literature values, Ecofys’ expertise on technical potentials and developments for respective technologies, as well as all conditions related to the Energy Scenario (e.g. broad application, market trends to more efficient products, synergies from other sectors). Nevertheless, it cannot be omitted that progress ratios for certain technologies and scopes might stagnate at certain points in time or for much higher aggregated output quantities. The respective halt in price reductions would result in higher CapEx costs for most sectors. This effect might be offset by changed investment in, and development of, other technologies, e.g. if prices for PV modules cannot be reduced any further, higher investment in wind turbines may accelerate price reductions for wind power even more than estimated. In any case, future developments of progress ratios and respective market reactions are difficult to estimate.
Similar uncertainties apply to fossil and bioenergy fuel prices. In an international market, these prices depend on a sensitive balance between demand and supply. Economic cycles as well as new production routes can influence world-market prices considerably, although their influence might be relatively low in relation to overall
215Part 2 - The Ecofys Energy Scenario
A S USTAI NABLE E NERGY S UPPLY F OR EVERY ONE
traded volumes. Therefore, even a small shift from low levels of surplus capacities to a relatively small amount of unmatched demand can lead to steep price increases. It should also be noted that calculated fuel cost savings use fuel prices that are estimated within a baseline, i.e. higher dependence on and demand for fossil fuels. In this Energy Scenario, where fossil fuels are largely replaced by renewable energies, these prices could decrease considerably. However, since the costs calculated here are understood to be costs in comparison to a baseline, it is appropriate to use baseline fossil fuel prices to calculate these costs.
Conclusion
It should be taken into consideration that most cost calculations assume the most effective policies and measures will facilitate necessary changes in respective markets. This may include the application of research schemes, subsidies, additional taxes and other market-based incentive schemes. Although the Energy Scenario does not differentiate between certain groups of investors and beneficiaries, experience suggests that public funding is required in the early stages of a technology and market-based instruments that direct investment flows at later stages. The choice and implementation of policies and the resulting distribution of costs and benefits is, however, specific to sectoral, as well as national conditions and is beyond the scope of the Energy Scenario.
Perceived economic costs and benefits, both for investors and the general public are also a function of the overall economic investment climate for new technologies and infrastructures. In many countries, there is no economic or political level playing field between non-renewable and renewable energy systems. The required return on investments into a sustainable energy supply is therefore not secured, and investments into unsustainable technologies continue.
One key example is global fossil fuel subsidies. According to recent assessments by IEA and OECD [OECD, 2010], they amount to about $US 700 billion per year, representing ~20–50% of the CapEx need annually between now and 2025 for clean technologies. It is therefore important to build a level playing field. A shift of these subsidies to sustainable energy technologies could further help to mobilise the CapEx required to make the transition to the Scenario’s energy system, while avoiding negative social consequences of the removal of energy subsidies.
216A Sustainable Energy Supply for Everyone
A S USTAI NABLE E NERGY S UPPLY F OR EVERY ONE
traded volumes. Therefore, even a small shift from low levels of surplus capacities to a relatively small amount of unmatched demand can lead to steep price increases. It should also be noted that calculated fuel cost savings use fuel prices that are estimated within a baseline, i.e. higher dependence on and demand for fossil fuels. In this Energy Scenario, where fossil fuels are largely replaced by renewable energies, these prices could decrease considerably. However, since the costs calculated here are understood to be costs in comparison to a baseline, it is appropriate to use baseline fossil fuel prices to calculate these costs.
Conclusion
It should be taken into consideration that most cost calculations assume the most effective policies and measures will facilitate necessary changes in respective markets. This may include the application of research schemes, subsidies, additional taxes and other market-based incentive schemes. Although the Energy Scenario does not differentiate between certain groups of investors and beneficiaries, experience suggests that public funding is required in the early stages of a technology and market-based instruments that direct investment flows at later stages. The choice and implementation of policies and the resulting distribution of costs and benefits is, however, specific to sectoral, as well as national conditions and is beyond the scope of the Energy Scenario.
Perceived economic costs and benefits, both for investors and the general public are also a function of the overall economic investment climate for new technologies and infrastructures. In many countries, there is no economic or political level playing field between non-renewable and renewable energy systems. The required return on investments into a sustainable energy supply is therefore not secured, and investments into unsustainable technologies continue.
One key example is global fossil fuel subsidies. According to recent assessments by IEA and OECD [OECD, 2010], they amount to about $US 700 billion per year, representing ~20–50% of the CapEx need annually between now and 2025 for clean technologies. It is therefore important to build a level playing field. A shift of these subsidies to sustainable energy technologies could further help to mobilise the CapEx required to make the transition to the Scenario’s energy system, while avoiding negative social consequences of the removal of energy subsidies.
A S USTAI NABLE E NERGY S UPPLY F OR EVERY ONE
7 Policy considerations
7.1 The need for policy
The Energy Scenario presents a radical departure from our current system of energy use. It postulates the fastest possible deployment of energy efficiency and sustainable energy options. It is clear that the current policy context would not be able to deliver on this Scenario. Instead, an adapted political and economic environment must be established to allow these developments to happen in the economic marketplace.
This will require detailed analysis of possible instruments and current best practices at regional level. In this section, we provide a brief overview and initial thoughts but this cannot replace a comprehensive analysis of policies required to deliver the Energy Scenario.
7.2 Policy objectives
The core conditions that allow the Energy Scenario to be actualised are presented in Table 7 - 1 and Table 7 - 2, and can be summarised as follows:
Public bodies at all levels have two key roles to play: 1 Creation of the correct framework for enabling the energy transition, e.g.
mandating performance standards in all demand sectors, levelling the playing field for all energy sources and providing incentives for the deployment of renewable energy technologies
2 Investment in large infrastructure, particularly the public transport and power grids infrastructure, and early-stage R&D projects, to ensure continued innovation, both in demand and supply
Private actors, both consumers and companies, are also required to 'step up to the mark' by: 1 Operating under a long-term perspective, resulting in adoption of best practices in
energy efficiency 2 Channelling investments into the most efficient and renewable energy options
Although a detailed policy discussion is beyond the scope of this report, we present in the following the minimum requirements the Energy Scenario asks of the policy environment in order for it to become reality. For each key sector or sub-sector, the primary policy objective is presented, which aims to generate the pre-conditions that formed the premise for the creation of this Energy Scenario. For each objective, some possible policy design examples and potential obstacles are noted.
217Part 2 - The Ecofys Energy Scenario
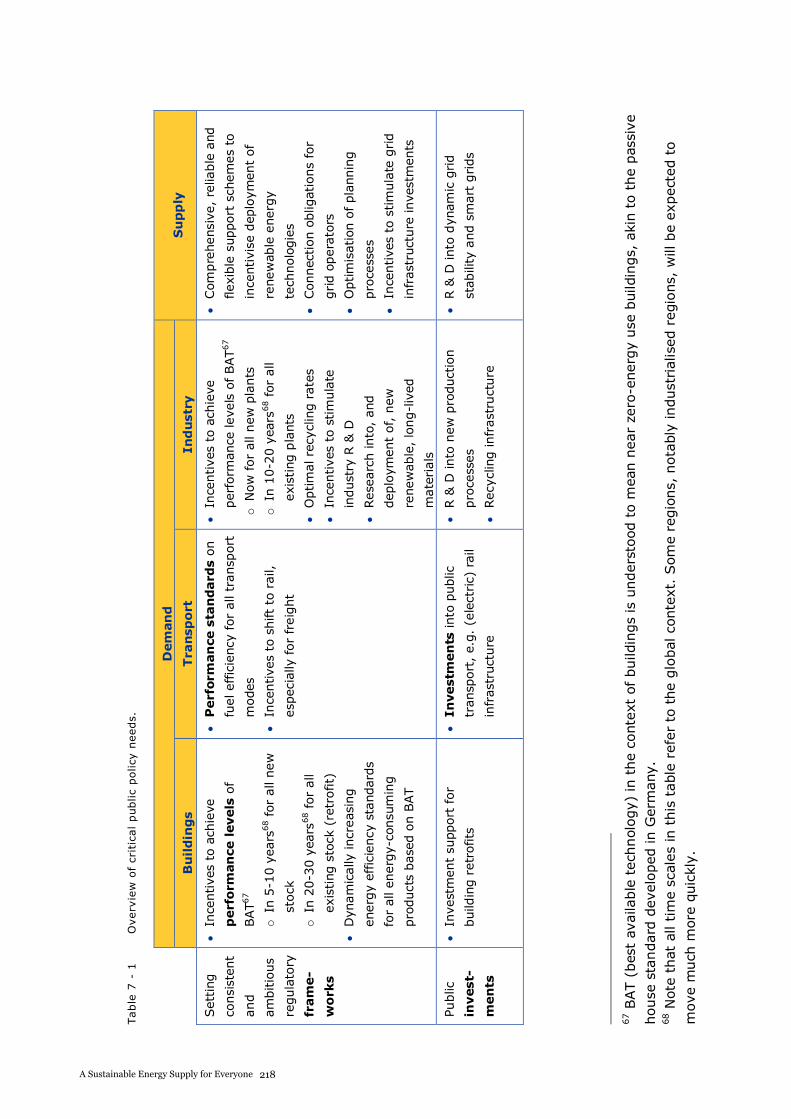
A S
US
TA
INA
BL
E E
NE
RG
Y S
UP
PL
Y F
OR
EV
ER
YO
NE
Table
7 -
1
Overv
iew
of
crit
ical public
policy
needs.
Dem
an
d
Su
pp
ly
Bu
ild
ing
s T
ransp
ort
In
du
stry
Set
ting
consi
sten
t
and
ambitio
us
regula
tory
fram
e-
wo
rks
Ince
ntive
s to
ach
ieve
perf
orm
an
ce levels
of
BAT6
7
oIn
5-1
0 y
ears
68 for
all
new
stock
oIn
20-3
0 y
ears
68 for
all
exis
ting
sto
ck (
retr
ofit)
Dyn
am
ically
incr
eas
ing
energ
y ef
fici
ency
sta
ndar
ds
for
all e
nerg
y-co
nsu
min
g
pro
duct
s bas
ed o
n B
AT
Perf
orm
an
cest
an
dard
s o
n
fuel ef
fici
ency
for
all
transp
ort
modes
Ince
ntive
s to
shift
to r
ail,
esp
ecia
lly for
freig
ht
Ince
ntive
s to
ach
ieve
perf
orm
ance
leve
ls o
f BAT
67
oN
ow
for
all new
pla
nts
oIn
10-2
0 y
ears
68 for
all
exi
stin
g p
lants
Optim
al re
cycl
ing r
ate
s
Ince
ntive
s to
stim
ula
te
indust
ry R
& D
Res
earc
h in
to,
and
dep
loym
ent
of, n
ew
renew
able
, lo
ng-l
ived
mate
rials
Com
pre
hensi
ve,
relia
ble
and
flex
ible
support
sch
em
es
to
ince
ntivi
se d
eplo
ymen
t of
renew
able
energ
y
tech
nolo
gie
s
Connec
tion o
blig
atio
ns
for
grid o
pera
tors
Optim
isat
ion o
f pla
nnin
g
pro
cess
es
Ince
ntive
s to
stim
ula
te g
rid
infr
astr
uct
ure
inve
stm
ents
Public
invest
-
men
ts
Inve
stm
ent
supp
ort
for
build
ing r
etr
ofits
Investm
en
ts into
public
transp
ort
, e.
g.
(ele
ctric)
rail
infr
astr
uct
ure
R &
D in
to n
ew p
roduct
ion
pro
cess
es
Rec
yclin
g infr
ast
ruct
ure
R &
D in
to d
ynam
ic g
rid
stab
ility
and s
mart
grids
67 B
AT (
bes
t av
aila
ble
tec
hnol
ogy)
in t
he
conte
xt o
f build
ings
is u
nder
stood
to m
ean n
ear
zero
-ener
gy
use
build
ings,
aki
n t
o t
he
pas
sive
house
sta
ndar
d d
evel
oped
in G
erm
any.
68 N
ote
that
all
tim
e sc
ales
in t
his
tab
le r
efer
to t
he
glo
bal
con
text
. Som
e re
gio
ns,
nota
bly
indust
rial
ised
reg
ions,
will
be
expec
ted t
o
move
much
mor
e qu
ickl
y.
218A Sustainable Energy Supply for Everyone
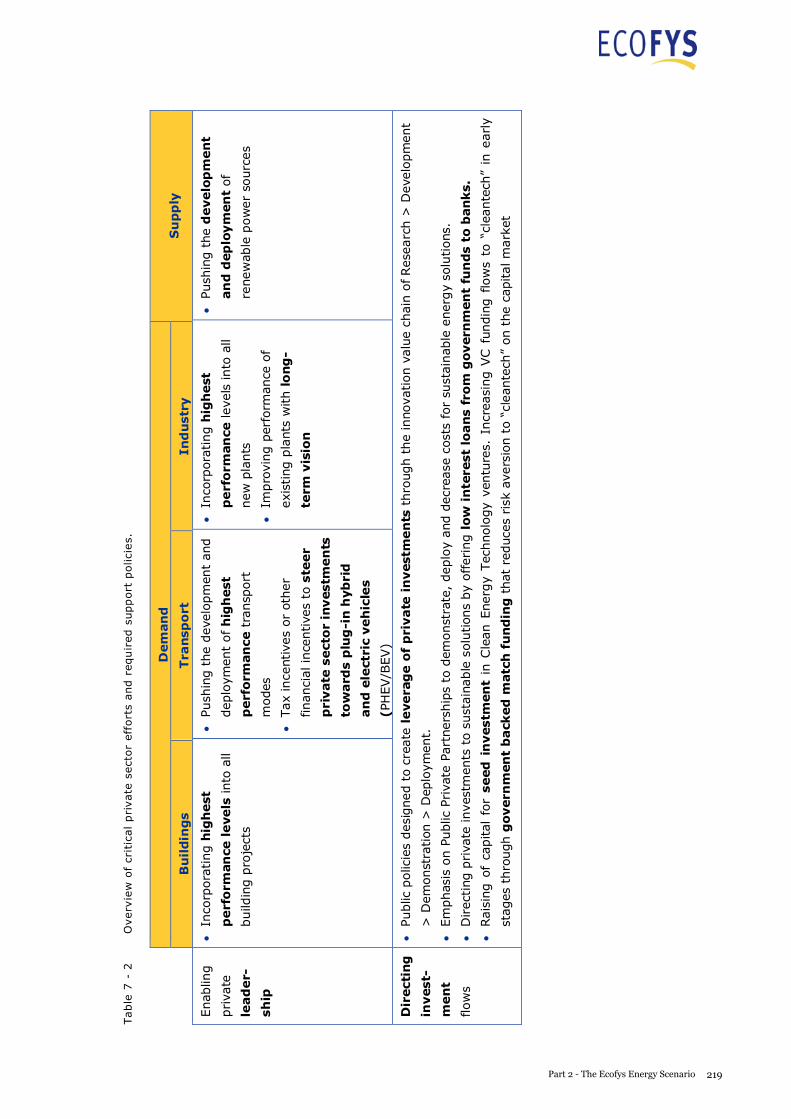
A S
US
TA
INA
BL
E E
NE
RG
Y S
UP
PL
Y F
OR
EV
ER
YO
NE
Table
7 -
2
Overv
iew
of
crit
ical pri
vate
sect
or
eff
ort
s and r
equir
ed s
upport
polici
es.
Dem
an
d
Su
pp
ly
Bu
ild
ing
s T
ransp
ort
In
du
stry
Enab
ling
priva
te
lead
er-
ship
Inco
rpora
ting h
igh
est
perf
orm
an
cele
vels
into
all
build
ing p
roje
cts
Push
ing t
he
dev
elopm
ent
and
dep
loym
ent
of
hig
hest
perf
orm
an
ce t
ransp
ort
modes
Tax
ince
ntiv
es
or o
ther
finan
cial
ince
ntive
s to
ste
er
pri
vate
sect
or
investm
en
ts
tow
ard
s p
lug
-in
hyb
rid
an
d e
lect
ric
veh
icle
s
(PH
EV/B
EV)
Inco
rpora
ting h
igh
est
perf
orm
an
ce lev
els
into
all
new
pla
nts
Impro
ving p
erfo
rman
ce o
f
exi
stin
g p
lants
with lo
ng
-
term
vis
ion
Push
ing
the
develo
pm
en
t
an
d d
ep
loym
en
t of
renew
able
pow
er
sourc
es
Dir
ect
ing
invest
-
men
t
flow
s
Public
polic
ies
des
igned
to c
reate
levera
ge o
f p
rivate
in
vest
men
ts t
hro
ugh t
he
inno
vation v
alue
chai
n o
f Res
earc
h >
Dev
elopm
ent
> D
emonst
ration
> D
eplo
ymen
t.
Em
phas
is o
n P
ublic
Priva
te P
artn
ersh
ips
to d
emonst
rate
, dep
loy
and d
ecre
ase
cost
s fo
r su
stai
nab
le e
ner
gy
solu
tions
.
Direc
ting
priva
te inve
stm
ents
to s
ust
aina
ble
solu
tion
s by
offer
ing l
ow
in
tere
st lo
ans
fro
m g
overn
men
t fu
nds
to b
an
ks.
Rais
ing o
f ca
pital
for
seed i
nvestm
en
t in
Cle
an E
ner
gy
Tec
hnolo
gy
ventu
res.
Incr
easi
ng V
C f
undin
g f
low
s to
“cl
eante
ch”
in e
arly
stag
es t
hro
ugh g
overn
men
t b
ack
ed
matc
h f
un
din
g t
hat
red
uce
s risk
ave
rsio
n t
o “c
lean
tech
” on
the
capital m
ark
et
A S USTAI NABLE E NERGY S UPPLY F OR EVERY ONE
Table 7 - 5 Demand-side policy suggestions for the Buildings sector: appliances etc.
BUILDINGS APPLIANCES AND LIGHTING
POLICY OBJECTIVE
Aggressively moving to the most efficient technologies
EXAMPLES BARRIERS & THREATS
Dynamically increasing energy efficiency
standards based on BAT for all energy-
consuming products, including lighting
Bounded rationality70
Rebound effects in appliances’ electricity
use
In the Transport sector, there are four influential factors that apply to both passenger and freight transport and that need to be addressed by policies in this sector:
Activity Structure (modal shift) Intensity Fuel
Table 7 - 6 Demand-side policy suggestions for the Transport sector: modal shift.
TRANSPORT ACTIVITY AND STRUCTURE (INCL. MODAL SHIFT)
POLICY OBJECTIVE
Moving large volumes of current and future passenger travel from individual air and road
modes to the most efficient modes, such as human-powered, rail or shared road modes
Moving to alternatives to provide services, such as video-conferencing for business travel
and reduced commuter travel through regional planning
EXAMPLES BARRIERS & THREATS
Policies delivering high-quality public transport at
competitive prices
Dis-incentivising car use and incentivising other modes,
e.g. congestion charging, public cycle hire schemes
Sustainable urban / land-use planning to sustain local
and / or low-energy transport systems
High speed railway systems between large city centres
to challenge short- and medium distance air travel
Large investments to
upgrade public transport
systems
Public perception
70 Bounded rationality is an understanding of decision-making processes that recognises that individuals or organisations may not always make the most rational choices, but rather that their decisions are highly dependent upon the information they have access to, the time they have to make the decision and even their cognitive limitations. In this context, we want to recognise that one of the barriers to the implementation of efficient appliances in households is insufficient information or simple lack of consideration.
219Part 2 - The Ecofys Energy Scenario
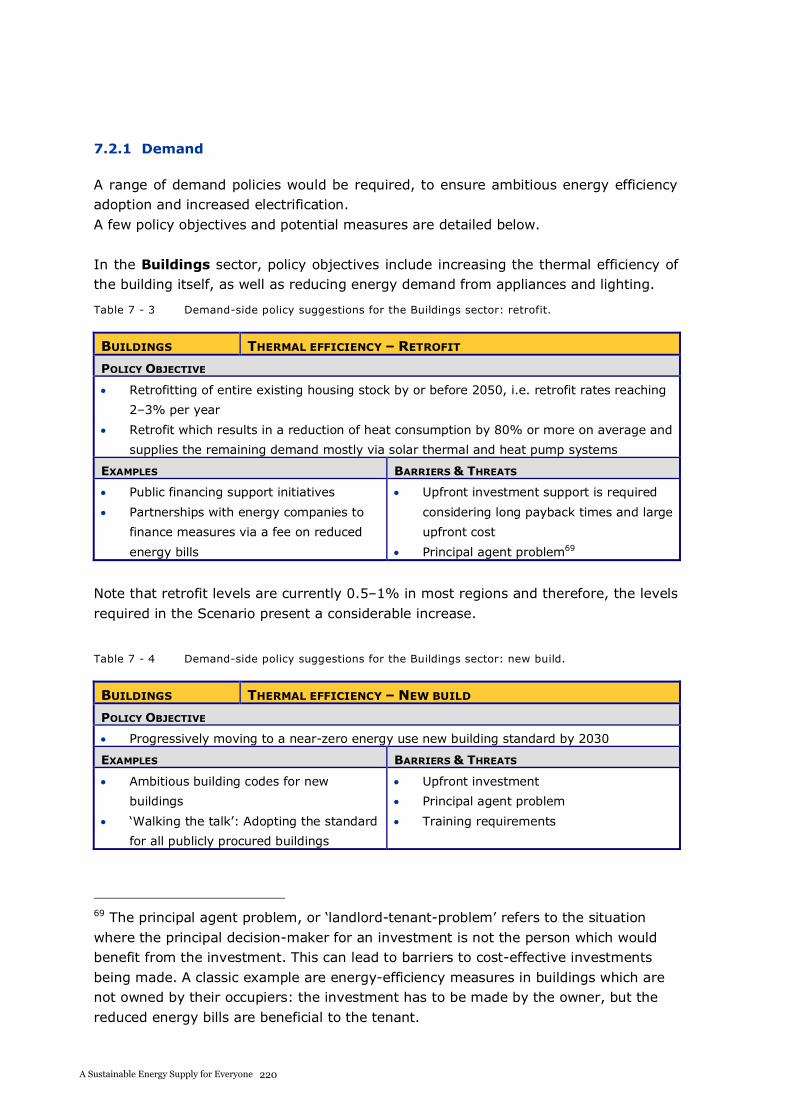
A S USTAI NABLE E NERGY S UPPLY F OR EVERY ONE
7.2.1 Demand
A range of demand policies would be required, to ensure ambitious energy efficiency adoption and increased electrification. A few policy objectives and potential measures are detailed below.
In the Buildings sector, policy objectives include increasing the thermal efficiency of the building itself, as well as reducing energy demand from appliances and lighting.
Table 7 - 3 Demand-side policy suggestions for the Buildings sector: retrofit.
BUILDINGS THERMAL EFFICIENCY – RETROFIT
POLICY OBJECTIVE
Retrofitting of entire existing housing stock by or before 2050, i.e. retrofit rates reaching
2–3% per year
Retrofit which results in a reduction of heat consumption by 80% or more on average and
supplies the remaining demand mostly via solar thermal and heat pump systems
EXAMPLES BARRIERS & THREATS
Public financing support initiatives
Partnerships with energy companies to
finance measures via a fee on reduced
energy bills
Upfront investment support is required
considering long payback times and large
upfront cost
Principal agent problem69
Note that retrofit levels are currently 0.5–1% in most regions and therefore, the levels required in the Scenario present a considerable increase.
Table 7 - 4 Demand-side policy suggestions for the Buildings sector: new build.
BUILDINGS THERMAL EFFICIENCY – NEW BUILD
POLICY OBJECTIVE
Progressively moving to a near-zero energy use new building standard by 2030
EXAMPLES BARRIERS & THREATS
Ambitious building codes for new
buildings
‘Walking the talk’: Adopting the standard
for all publicly procured buildings
Upfront investment
Principal agent problem
Training requirements
69 The principal agent problem, or ‘landlord-tenant-problem’ refers to the situation where the principal decision-maker for an investment is not the person which would benefit from the investment. This can lead to barriers to cost-effective investments being made. A classic example are energy-efficiency measures in buildings which are not owned by their occupiers: the investment has to be made by the owner, but the reduced energy bills are beneficial to the tenant.
A S USTAI NABLE E NERGY S UPPLY F OR EVERY ONE
Table 7 - 5 Demand-side policy suggestions for the Buildings sector: appliances etc.
BUILDINGS APPLIANCES AND LIGHTING
POLICY OBJECTIVE
Aggressively moving to the most efficient technologies
EXAMPLES BARRIERS & THREATS
Dynamically increasing energy efficiency
standards based on BAT for all energy-
consuming products, including lighting
Bounded rationality70
Rebound effects in appliances’ electricity
use
In the Transport sector, there are four influential factors that apply to both passenger and freight transport and that need to be addressed by policies in this sector:
Activity Structure (modal shift) Intensity Fuel
Table 7 - 6 Demand-side policy suggestions for the Transport sector: modal shift.
TRANSPORT ACTIVITY AND STRUCTURE (INCL. MODAL SHIFT)
POLICY OBJECTIVE
Moving large volumes of current and future passenger travel from individual air and road
modes to the most efficient modes, such as human-powered, rail or shared road modes
Moving to alternatives to provide services, such as video-conferencing for business travel
and reduced commuter travel through regional planning
EXAMPLES BARRIERS & THREATS
Policies delivering high-quality public transport at
competitive prices
Dis-incentivising car use and incentivising other modes,
e.g. congestion charging, public cycle hire schemes
Sustainable urban / land-use planning to sustain local
and / or low-energy transport systems
High speed railway systems between large city centres
to challenge short- and medium distance air travel
Large investments to
upgrade public transport
systems
Public perception
70 Bounded rationality is an understanding of decision-making processes that recognises that individuals or organisations may not always make the most rational choices, but rather that their decisions are highly dependent upon the information they have access to, the time they have to make the decision and even their cognitive limitations. In this context, we want to recognise that one of the barriers to the implementation of efficient appliances in households is insufficient information or simple lack of consideration.
220A Sustainable Energy Supply for Everyone
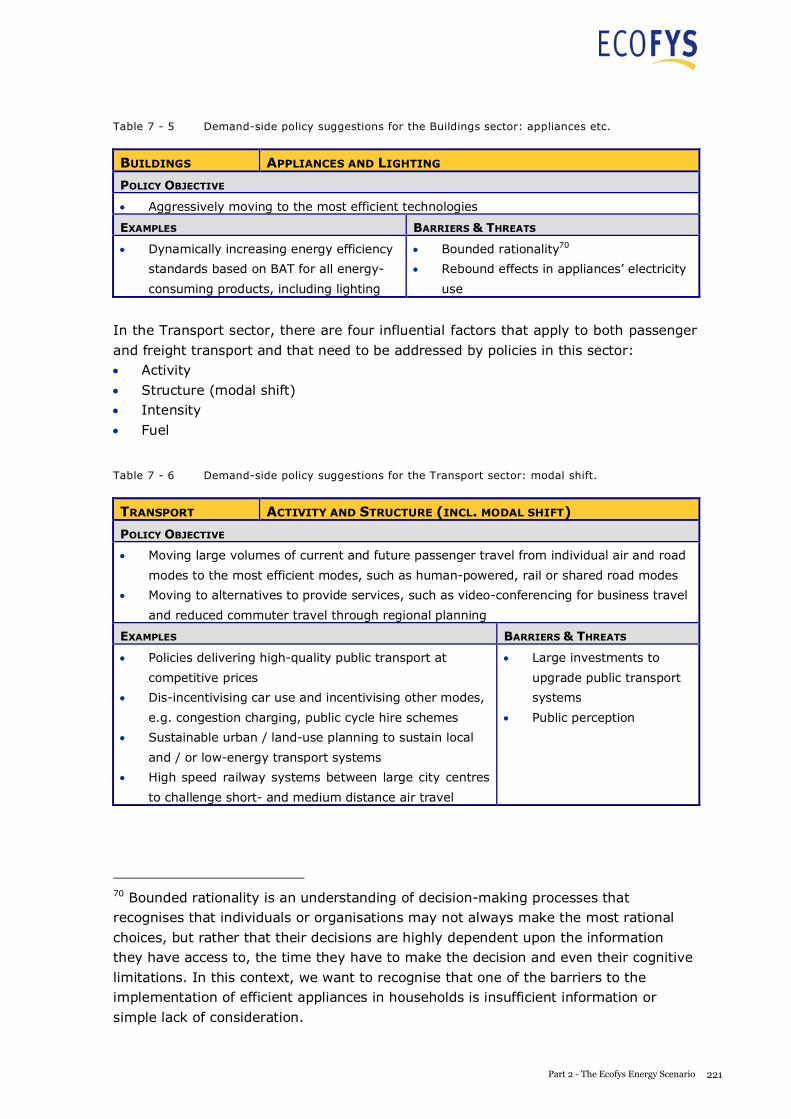
A S USTAI NABLE E NERGY S UPPLY F OR EVERY ONE
Table 7 - 5 Demand-side policy suggestions for the Buildings sector: appliances etc.
BUILDINGS APPLIANCES AND LIGHTING
POLICY OBJECTIVE
Aggressively moving to the most efficient technologies
EXAMPLES BARRIERS & THREATS
Dynamically increasing energy efficiency
standards based on BAT for all energy-
consuming products, including lighting
Bounded rationality70
Rebound effects in appliances’ electricity
use
In the Transport sector, there are four influential factors that apply to both passenger and freight transport and that need to be addressed by policies in this sector:
Activity Structure (modal shift) Intensity Fuel
Table 7 - 6 Demand-side policy suggestions for the Transport sector: modal shift.
TRANSPORT ACTIVITY AND STRUCTURE (INCL. MODAL SHIFT)
POLICY OBJECTIVE
Moving large volumes of current and future passenger travel from individual air and road
modes to the most efficient modes, such as human-powered, rail or shared road modes
Moving to alternatives to provide services, such as video-conferencing for business travel
and reduced commuter travel through regional planning
EXAMPLES BARRIERS & THREATS
Policies delivering high-quality public transport at
competitive prices
Dis-incentivising car use and incentivising other modes,
e.g. congestion charging, public cycle hire schemes
Sustainable urban / land-use planning to sustain local
and / or low-energy transport systems
High speed railway systems between large city centres
to challenge short- and medium distance air travel
Large investments to
upgrade public transport
systems
Public perception
70 Bounded rationality is an understanding of decision-making processes that recognises that individuals or organisations may not always make the most rational choices, but rather that their decisions are highly dependent upon the information they have access to, the time they have to make the decision and even their cognitive limitations. In this context, we want to recognise that one of the barriers to the implementation of efficient appliances in households is insufficient information or simple lack of consideration.
221Part 2 - The Ecofys Energy Scenario
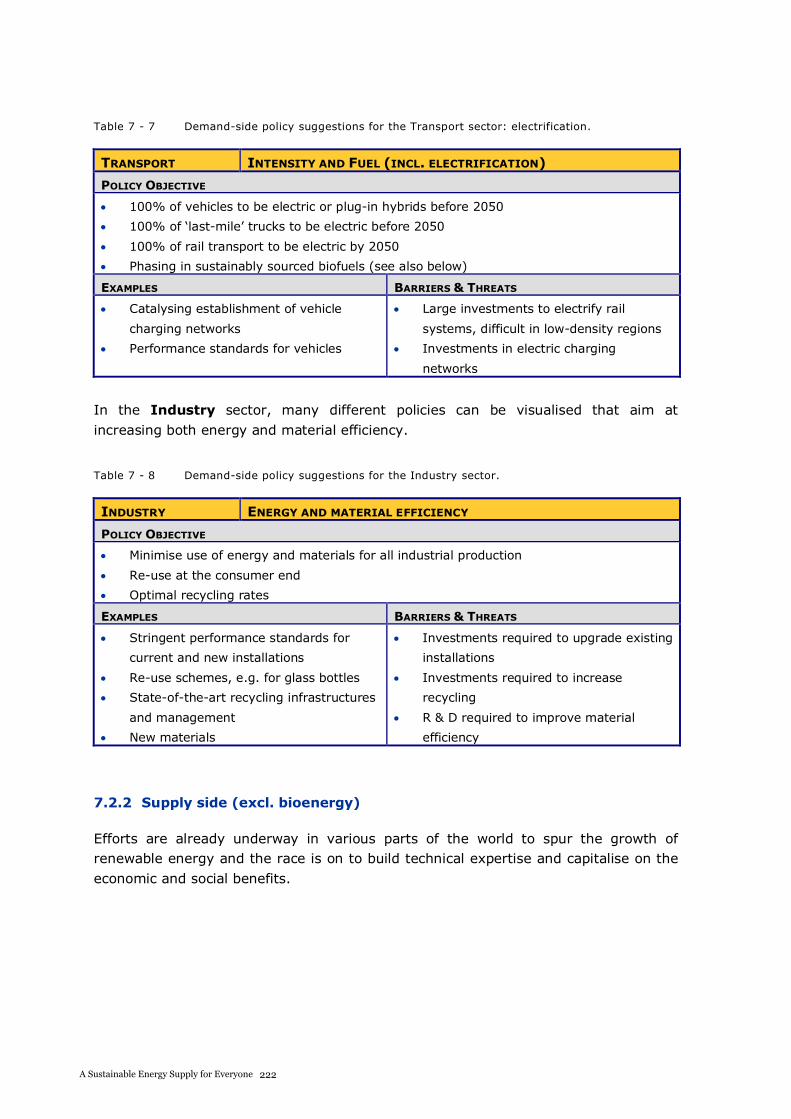
A S USTAI NABLE E NERGY S UPPLY F OR EVERY ONE
Table 7 - 7 Demand-side policy suggestions for the Transport sector: electrification.
TRANSPORT INTENSITY AND FUEL (INCL. ELECTRIFICATION)
POLICY OBJECTIVE
100% of vehicles to be electric or plug-in hybrids before 2050
100% of ‘last-mile’ trucks to be electric before 2050
100% of rail transport to be electric by 2050
Phasing in sustainably sourced biofuels (see also below)
EXAMPLES BARRIERS & THREATS
Catalysing establishment of vehicle
charging networks
Performance standards for vehicles
Large investments to electrify rail
systems, difficult in low-density regions
Investments in electric charging
networks
In the Industry sector, many different policies can be visualised that aim at increasing both energy and material efficiency.
Table 7 - 8 Demand-side policy suggestions for the Industry sector.
INDUSTRY ENERGY AND MATERIAL EFFICIENCY
POLICY OBJECTIVE
Minimise use of energy and materials for all industrial production
Re-use at the consumer end
Optimal recycling rates
EXAMPLES BARRIERS & THREATS
Stringent performance standards for
current and new installations
Re-use schemes, e.g. for glass bottles
State-of-the-art recycling infrastructures
and management
New materials
Investments required to upgrade existing
installations
Investments required to increase
recycling
R & D required to improve material
efficiency
7.2.2 Supply side (excl. bioenergy)
Efforts are already underway in various parts of the world to spur the growth of renewable energy and the race is on to build technical expertise and capitalise on the economic and social benefits.
A S USTAI NABLE E NERGY S UPPLY F OR EVERY ONE
Table 7 - 9 Supply-side policy suggestions: renewable heat and power.
POWER RENEWABLE HEAT AND POWER
POLICY OBJECTIVE
Continued rapid deployment of renewable sources for power and thermal use
EXAMPLES BARRIERS & THREATS
Feed-in tariff systems to give long-term
price signals
Streamlining of planning processes
R & D support
Grid integration
As mentioned above, the key requirement for the power sector in this Energy Scenario is the readiness of power grids for a new era of a diversified power source mix.
Table 7 - 10 Supply-side policy suggestions: power grids.
POWER POWER SYSTEM READINESS
POLICY OBJECTIVE
Ensure power systems are able to manage high shares of supply-driven power sources
EXAMPLES BARRIERS & THREATS
Increasing transmission capacities
Provision of storage
R & D into smart power system
management
Re-thinking of power system
management required
Large investments required into grid
infrastructure
Rural energy supply in developing countries currently depends, to a large extent, on inefficient and pollution-heavy use of solid biomass fuel. In the Energy Scenario, the assumption is that a complete transition to a clean and efficient use of renewable energy will be made. To enable such a transition, the correct market incentives are required that, not only discourage the use of unsustainable energy, but also encourage the various uses of renewable energy. World Bank funding, ODA and other public funding can play a supporting role in this transition and should no longer be used to expand the use of fossil-based systems.
Table 7 - 11 Supply-side policy suggestions: energy transition for the rural poor.
POWER ENERGY TRANSITION FOR THE RURAL POOR
POLICY OBJECTIVE
Create the right market environment for a transition to clean, reliable and affordable
energy to the rural poor in developing countries
EXAMPLES BARRIERS & THREATS
Direct use of solar heat
Efficient use of biomass resources
Investment requirements
Established fossil fuel subsidies
222A Sustainable Energy Supply for Everyone
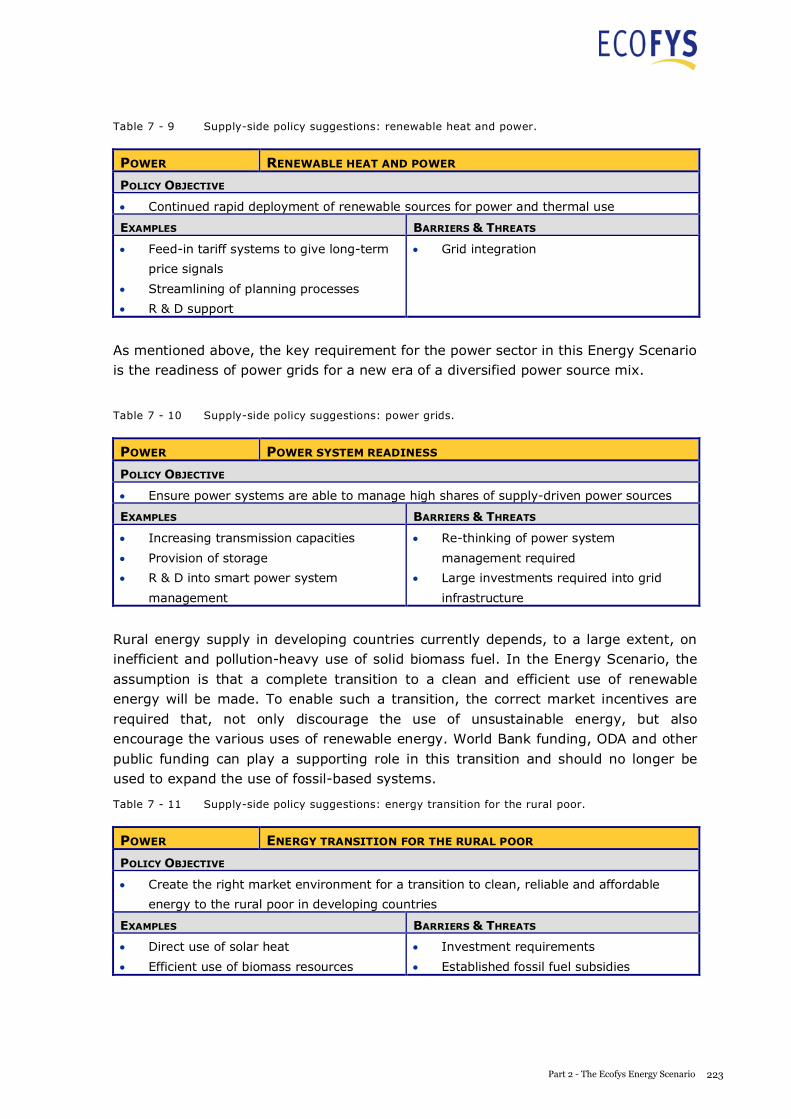
A S USTAI NABLE E NERGY S UPPLY F OR EVERY ONE
Table 7 - 9 Supply-side policy suggestions: renewable heat and power.
POWER RENEWABLE HEAT AND POWER
POLICY OBJECTIVE
Continued rapid deployment of renewable sources for power and thermal use
EXAMPLES BARRIERS & THREATS
Feed-in tariff systems to give long-term
price signals
Streamlining of planning processes
R & D support
Grid integration
As mentioned above, the key requirement for the power sector in this Energy Scenario is the readiness of power grids for a new era of a diversified power source mix.
Table 7 - 10 Supply-side policy suggestions: power grids.
POWER POWER SYSTEM READINESS
POLICY OBJECTIVE
Ensure power systems are able to manage high shares of supply-driven power sources
EXAMPLES BARRIERS & THREATS
Increasing transmission capacities
Provision of storage
R & D into smart power system
management
Re-thinking of power system
management required
Large investments required into grid
infrastructure
Rural energy supply in developing countries currently depends, to a large extent, on inefficient and pollution-heavy use of solid biomass fuel. In the Energy Scenario, the assumption is that a complete transition to a clean and efficient use of renewable energy will be made. To enable such a transition, the correct market incentives are required that, not only discourage the use of unsustainable energy, but also encourage the various uses of renewable energy. World Bank funding, ODA and other public funding can play a supporting role in this transition and should no longer be used to expand the use of fossil-based systems.
Table 7 - 11 Supply-side policy suggestions: energy transition for the rural poor.
POWER ENERGY TRANSITION FOR THE RURAL POOR
POLICY OBJECTIVE
Create the right market environment for a transition to clean, reliable and affordable
energy to the rural poor in developing countries
EXAMPLES BARRIERS & THREATS
Direct use of solar heat
Efficient use of biomass resources
Investment requirements
Established fossil fuel subsidies
223Part 2 - The Ecofys Energy Scenario
A S USTAI NABLE E NERGY S UPPLY F OR EVERY ONE
7.2.3 Bioenergy
Section 5 of this report demonstrates that bioenergy can supply the necessary demand while being sustainable and achieving high greenhouse gas emission savings. Achieving this goal requires a strong policy framework to ensure that the bioenergy supply is developed in accordance with the sustainability criteria suggested in Section 5.2. This section provides background information and policy suggestions and examples for reaching this goal; it is not a comprehensive overview of all required policy. It is categorised around the four topics of bioenergy sustainability, (see Section 5.2):
Land use and food security Agricultural and processing inputs Residues and waste Complementary fellings
Land use and food security
It is vital to provide human services such as food, animal feed, fibre, living space and energy in a sustainable way, ensuring that natural ecosystem functions are preserved. This means that international agreements must be made on land use management and agricultural policy necessary to meet this goal. These agreements need to be global and applied to all sectors, including the food sector and the chemical sector, as well as the bioenergy sector. Land use for human development should also be planned carefully to minimise expansion onto land that is highly suitable for agriculture. If only the bioenergy sector was regulated and other sectors neglected, leakage effects would occur from the bioenergy sector to the other, unregulated, sectors.
Should such agreements be made and effectively enforced globally, there would be limited need for individual sustainability certification schemes. However, certification schemes can be developed for, and applied in, the bioenergy sector complementary to policy development. This further safeguards sustainability and enhances experience with and dialogue on the topic. Table 7 - 12 provides further suggestions for, and examples of, required policy.
A S USTAI NABLE E NERGY S UPPLY F OR EVERY ONE
Table 7 - 12 Bioenergy policy suggestions and examples: land use.
BIOENERGY LAND USE AND FOOD SECURITY
POLICY OBJECTIVE
Managing all new land use so that no displacement of important land functions occurs:
biodiversity and ecosystem protection, carbon storage in carbon stock, human
development, provision of feed, food and fibre.
Develop such a framework and accompanying certification schemes for biomass and
bioenergy as a pioneer sector
EXAMPLES BARRIERS & THREATS
International agreement on land use
management
International R&D programme for
sustainable agriculture
Biomass and bioenergy sustainability
certification schemes complementary to
policy development
For the example of sugar cane and cattle
integration see Box 5 - 2
Different national (economic) interests
can slow international agreement
Need for comprehensive tracing system
for bioenergy chains
Agricultural and processing inputs
Policy should be developed that provides incentives for minimising agricultural inputs and maximising recovery of these inputs. Table 7 - 13 contains further suggestions for, and examples of, such policy. In addition, policy that incentivises the deployment of renewable energy technologies should enable the nitrogen fertiliser industry to switch to sustainable energy and feedstock sources, as described in Section 5.4.
Table 7 - 13 Bioenergy policy suggestions and examples: agricultural and processing inputs.
BIOENERGY AGRICULTURAL AND PROCESSING INPUTS
POLICY OBJECTIVE
Closing agricultural nutrient cycles
Closing water loops in processing plants
EXAMPLES BARRIERS & THREATS
Incentives for minimising agricultural
inputs by precision farming
Policy framework for nutrient collection
from residue and waste streams
Economic unattractiveness at low prices
of agricultural fertilisers
Slow dissemination of agricultural
knowledge needed for precision farming
Residues and waste
As residues and waste are a by-product of other processes, their maximum sustainable use for energy purposes is an important objective. Any policy effort should take into consideration which by-products already have another use, ensuring that the
224A Sustainable Energy Supply for Everyone
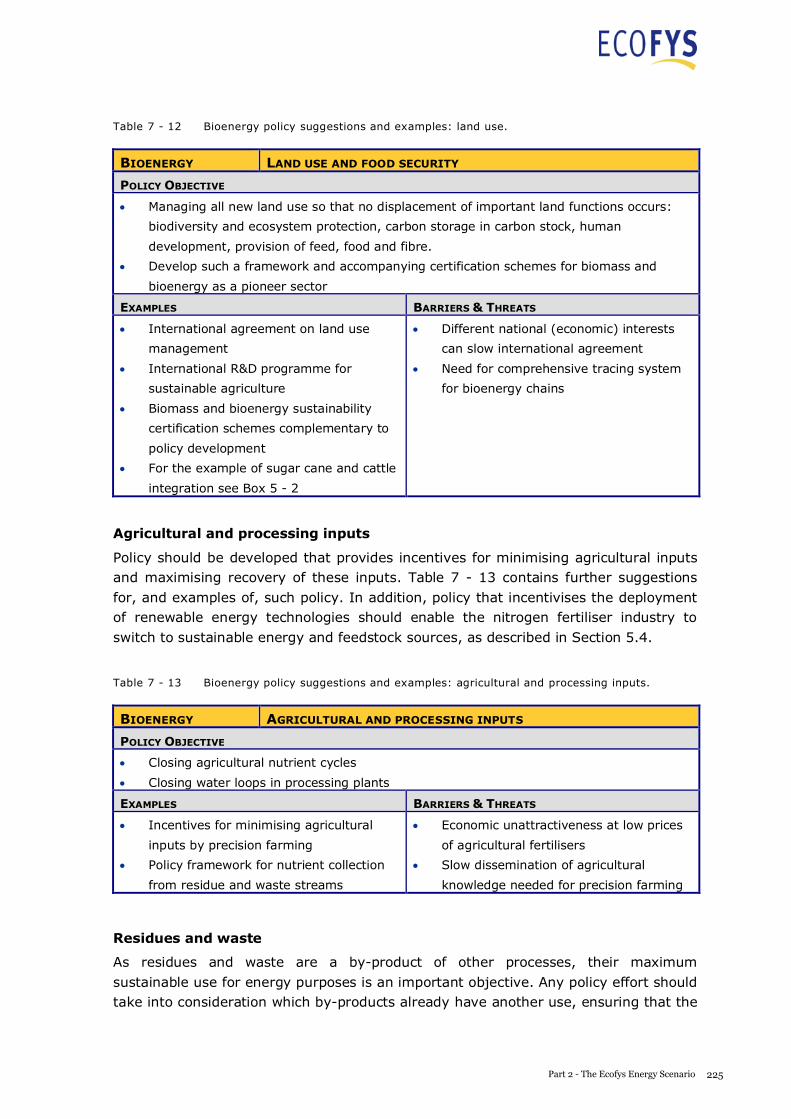
A S USTAI NABLE E NERGY S UPPLY F OR EVERY ONE
Table 7 - 12 Bioenergy policy suggestions and examples: land use.
BIOENERGY LAND USE AND FOOD SECURITY
POLICY OBJECTIVE
Managing all new land use so that no displacement of important land functions occurs:
biodiversity and ecosystem protection, carbon storage in carbon stock, human
development, provision of feed, food and fibre.
Develop such a framework and accompanying certification schemes for biomass and
bioenergy as a pioneer sector
EXAMPLES BARRIERS & THREATS
International agreement on land use
management
International R&D programme for
sustainable agriculture
Biomass and bioenergy sustainability
certification schemes complementary to
policy development
For the example of sugar cane and cattle
integration see Box 5 - 2
Different national (economic) interests
can slow international agreement
Need for comprehensive tracing system
for bioenergy chains
Agricultural and processing inputs
Policy should be developed that provides incentives for minimising agricultural inputs and maximising recovery of these inputs. Table 7 - 13 contains further suggestions for, and examples of, such policy. In addition, policy that incentivises the deployment of renewable energy technologies should enable the nitrogen fertiliser industry to switch to sustainable energy and feedstock sources, as described in Section 5.4.
Table 7 - 13 Bioenergy policy suggestions and examples: agricultural and processing inputs.
BIOENERGY AGRICULTURAL AND PROCESSING INPUTS
POLICY OBJECTIVE
Closing agricultural nutrient cycles
Closing water loops in processing plants
EXAMPLES BARRIERS & THREATS
Incentives for minimising agricultural
inputs by precision farming
Policy framework for nutrient collection
from residue and waste streams
Economic unattractiveness at low prices
of agricultural fertilisers
Slow dissemination of agricultural
knowledge needed for precision farming
Residues and waste
As residues and waste are a by-product of other processes, their maximum sustainable use for energy purposes is an important objective. Any policy effort should take into consideration which by-products already have another use, ensuring that the
225Part 2 - The Ecofys Energy Scenario
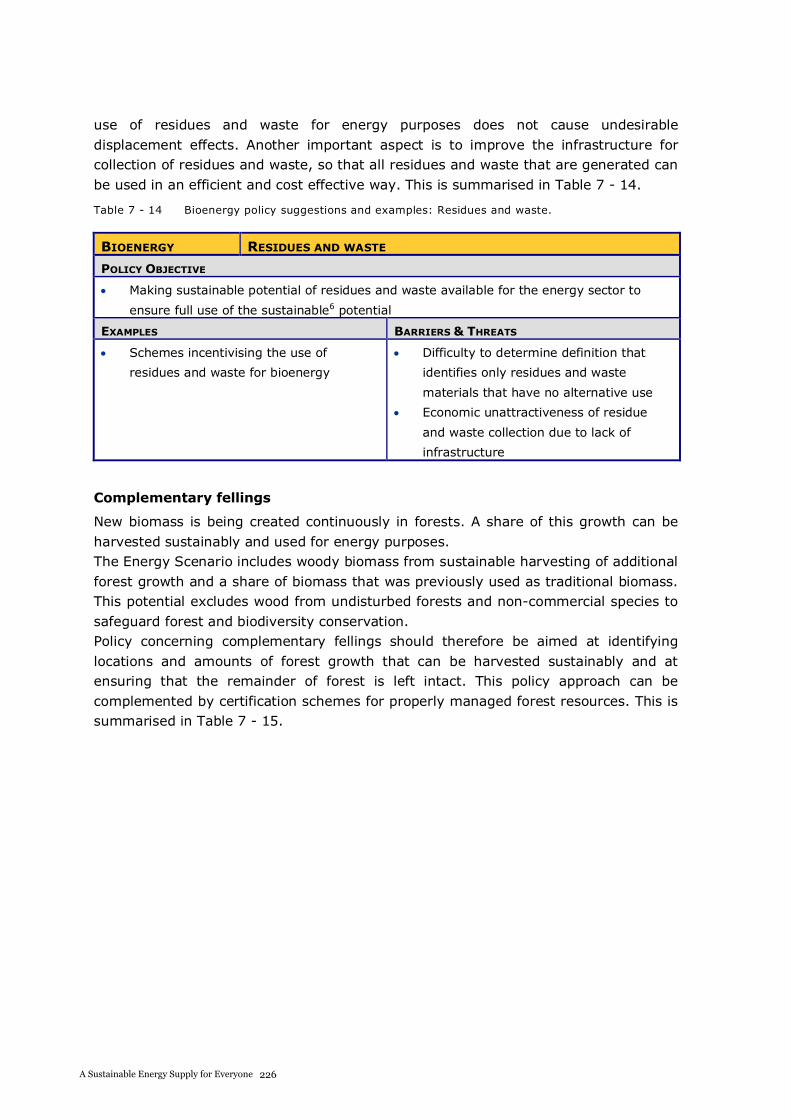
A S USTAI NABLE E NERGY S UPPLY F OR EVERY ONE
use of residues and waste for energy purposes does not cause undesirable displacement effects. Another important aspect is to improve the infrastructure for collection of residues and waste, so that all residues and waste that are generated can be used in an efficient and cost effective way. This is summarised in Table 7 - 14.
Table 7 - 14 Bioenergy policy suggestions and examples: Residues and waste.
BIOENERGY RESIDUES AND WASTE
POLICY OBJECTIVE
Making sustainable potential of residues and waste available for the energy sector to
ensure full use of the sustainable6 potential
EXAMPLES BARRIERS & THREATS
Schemes incentivising the use of
residues and waste for bioenergy
Difficulty to determine definition that
identifies only residues and waste
materials that have no alternative use
Economic unattractiveness of residue
and waste collection due to lack of
infrastructure
Complementary fellings
New biomass is being created continuously in forests. A share of this growth can be harvested sustainably and used for energy purposes. The Energy Scenario includes woody biomass from sustainable harvesting of additional forest growth and a share of biomass that was previously used as traditional biomass. This potential excludes wood from undisturbed forests and non-commercial species to safeguard forest and biodiversity conservation. Policy concerning complementary fellings should therefore be aimed at identifying locations and amounts of forest growth that can be harvested sustainably and at ensuring that the remainder of forest is left intact. This policy approach can be complemented by certification schemes for properly managed forest resources. This is summarised in Table 7 - 15.
A S USTAI NABLE E NERGY S UPPLY F OR EVERY ONE
Table 7 - 15 Bioenergy policy suggestions and examples: Complementary fellings.
BIOENERGY COMPLEMENTARY FELLINGS
POLICY OBJECTIVE
Identifying locations and amounts of forest growth that can be harvested sustainably and
making sure that other forest is left intact.
EXAMPLES BARRIERS & THREATS
Policy framework for sustainable
management of forest resources
Certification schemes for properly
managed forest resources
Difficulty to do forest assessments and
controlled harvesting, especially in
remote locations
7.3 Recommendations
Although policies are necessary to address all sectors of the energy system, some policy needs are more pressing than others because they represent enabling factors:failing to address them will have repercussions for the likelihood of success in one, or several, other sectors.
The two key enabling factors in this Energy Scenario are: Strong energy efficiency measures coupled with electrification for remaining demand. The preparation of our energy grids to cope with the increasing demand for renewable, often supply-driven, electricity.
In addition, a set of policy and market rules needs to be enforced, which ensures that the sustainability of biomass use for energy is safeguarded.
The remaining policy requirements cannot easily be prioritised: they all need to be addressed to allow this Scenario to become a reality and the ranking of objectives will depend strongly on the local context. There are, however, some policies which either:
have a long lag time to full implementation have effects for many decades to come, rely on mature technologies only, or have very short payback times
and could therefore be considered to warrant immediate attention. Policies in the built environment, addressing both retrofit and new build and investments in grid infrastructure could be considered to be candidates for such time critical policies.
It has been suggested that carbon pricing could deliver on all fronts because it is a single instrument that could be used to steer all sectors.71 A silver bullet like this does
71 Note that this is an Energy Scenario, primarily concerned with the establishment of a sustainable energy system, and only in the second instance with the reduction of
226A Sustainable Energy Supply for Everyone
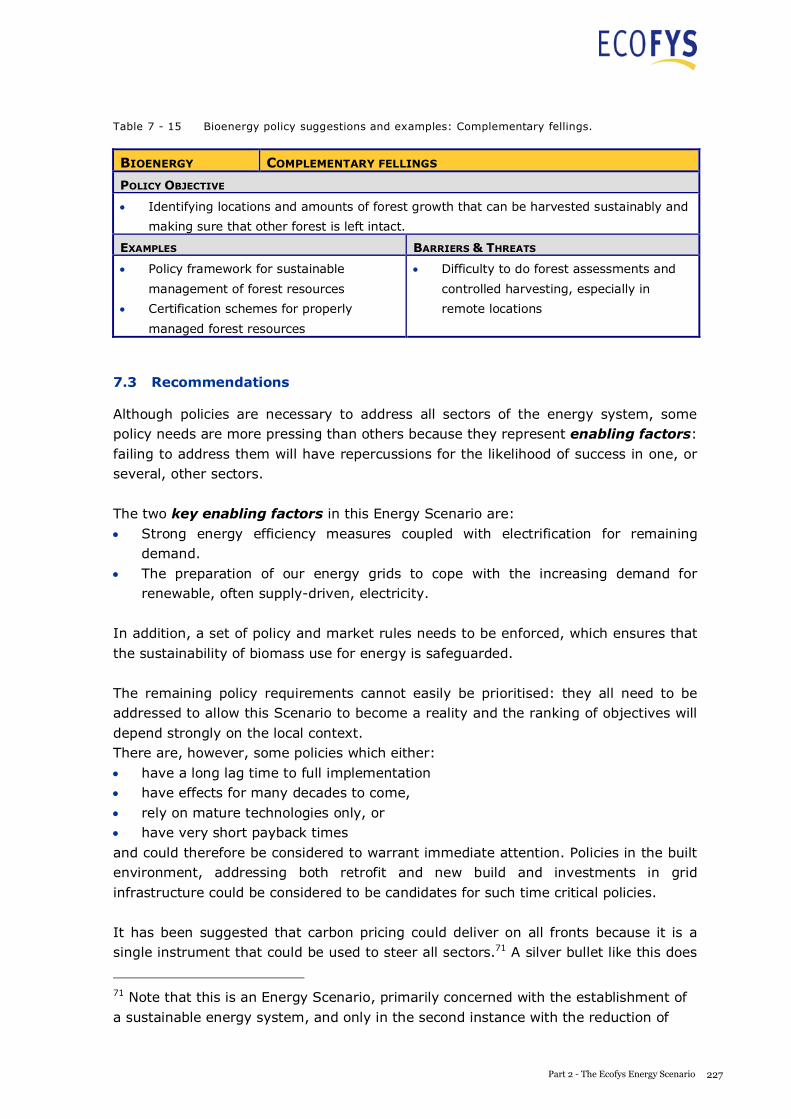
A S USTAI NABLE E NERGY S UPPLY F OR EVERY ONE
Table 7 - 15 Bioenergy policy suggestions and examples: Complementary fellings.
BIOENERGY COMPLEMENTARY FELLINGS
POLICY OBJECTIVE
Identifying locations and amounts of forest growth that can be harvested sustainably and
making sure that other forest is left intact.
EXAMPLES BARRIERS & THREATS
Policy framework for sustainable
management of forest resources
Certification schemes for properly
managed forest resources
Difficulty to do forest assessments and
controlled harvesting, especially in
remote locations
7.3 Recommendations
Although policies are necessary to address all sectors of the energy system, some policy needs are more pressing than others because they represent enabling factors:failing to address them will have repercussions for the likelihood of success in one, or several, other sectors.
The two key enabling factors in this Energy Scenario are: Strong energy efficiency measures coupled with electrification for remaining demand. The preparation of our energy grids to cope with the increasing demand for renewable, often supply-driven, electricity.
In addition, a set of policy and market rules needs to be enforced, which ensures that the sustainability of biomass use for energy is safeguarded.
The remaining policy requirements cannot easily be prioritised: they all need to be addressed to allow this Scenario to become a reality and the ranking of objectives will depend strongly on the local context. There are, however, some policies which either:
have a long lag time to full implementation have effects for many decades to come, rely on mature technologies only, or have very short payback times
and could therefore be considered to warrant immediate attention. Policies in the built environment, addressing both retrofit and new build and investments in grid infrastructure could be considered to be candidates for such time critical policies.
It has been suggested that carbon pricing could deliver on all fronts because it is a single instrument that could be used to steer all sectors.71 A silver bullet like this does
71 Note that this is an Energy Scenario, primarily concerned with the establishment of a sustainable energy system, and only in the second instance with the reduction of
227Part 2 - The Ecofys Energy Scenario
A S USTAI NABLE E NERGY S UPPLY F OR EVERY ONE
not exist. 72 In practice, a policy mix is always required to effectively incentivise the diversity of sectors and technologies. It is clear that new methods for integrating the risk and the true cost of our energy resources need to be found to ensure re-direction towards sustainable energy solutions.
The benefit of the Energy Scenario is that it could form the basis for a set of clear indicators of the impact of policies in each sector, e.g.
What is the average amount of energy used in the economy to produce a tonne of steel? How far have we come in adopting 100% plug-in hybrid or electric car concept? What is the share of passenger travel effected via our rails rather than our roads? How many of our houses have been retrofitted to minimum energy standard and are we still allowing non-passive houses to be built? What is the share of renewable power in our local economy? How much of our bioenergy is sustainably sourced?
It must be stressed that many different policy designs can be envisaged and they could happen at many different levels of society; at the neighbourhood, town, regional, national or international level. Ultimately, it is not important which policy is used. The challenge is to find a set of instruments that addresses the policy needs in all sectors in a comprehensive and coordinated way. This is particularly critical if policies and measures are implemented at a regional or town level.
GHG emissions. While many policies aimed at reducing GHG emissions may also have an effect on the energy system, they often do not, and would thus miss the goal with respect to this Scenario. 72 For example, for sectors with low price elasticity, a carbon price would not necessarily be the most effective instrument, depending on the sector and local circumstances.
228A Sustainable Energy Supply for Everyone
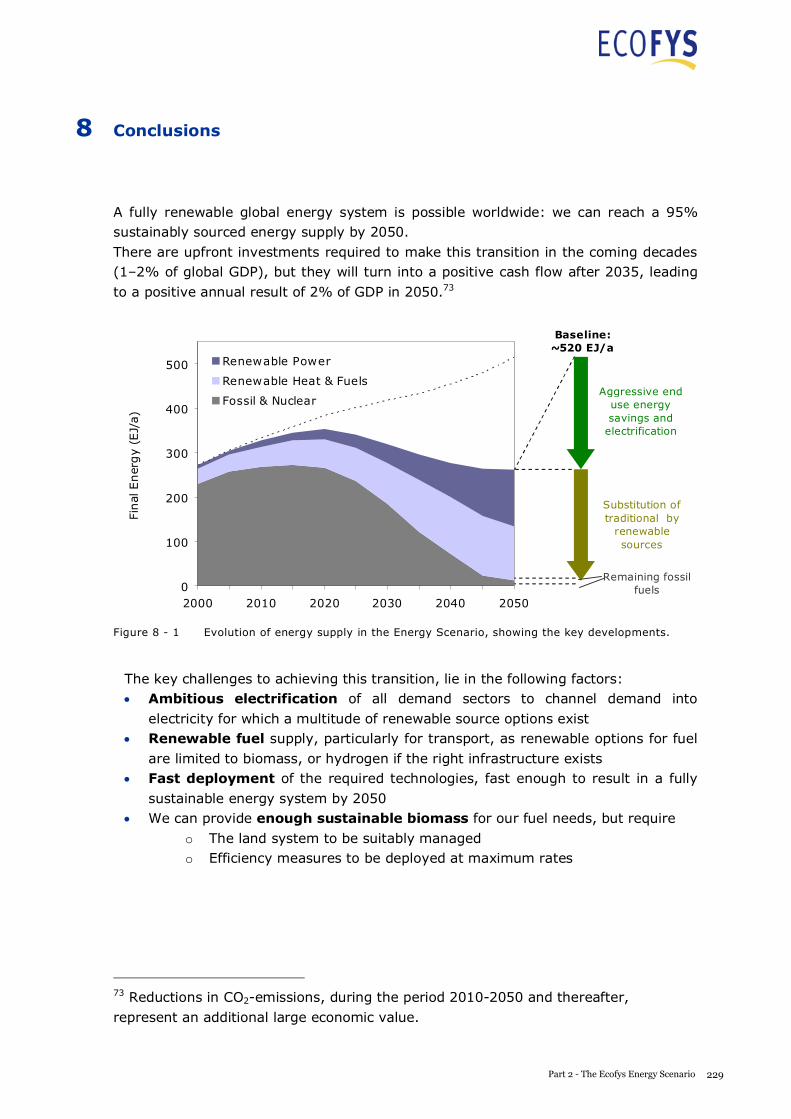
A S USTAI NABLE E NERGY S UPPLY F OR EVERY ONE
8 Conclusions
A fully renewable global energy system is possible worldwide: we can reach a 95% sustainably sourced energy supply by 2050. There are upfront investments required to make this transition in the coming decades (1–2% of global GDP), but they will turn into a positive cash flow after 2035, leading to a positive annual result of 2% of GDP in 2050.73
0
100
200
300
400
500
2000 2010 2020 2030 2040 2050
Final
Ener
gy
(EJ/
a)
Renewable Power
Renewable Heat & Fuels
Fossil & Nuclear
Baseline:~520 EJ/a
Aggressive end-use energy savings and
electrification
Substitution of traditional by
renewable sources
Remaining fossil fuels
Figure 8 - 1 Evolution of energy supply in the Energy Scenario, showing the key developments.
The key challenges to achieving this transition, lie in the following factors: Ambitious electrification of all demand sectors to channel demand into electricity for which a multitude of renewable source options exist Renewable fuel supply, particularly for transport, as renewable options for fuel are limited to biomass, or hydrogen if the right infrastructure exists Fast deployment of the required technologies, fast enough to result in a fully sustainable energy system by 2050 We can provide enough sustainable biomass for our fuel needs, but require
o The land system to be suitably managed o Efficiency measures to be deployed at maximum rates
73 Reductions in CO2-emissions, during the period 2010-2050 and thereafter, represent an additional large economic value.
229Part 2 - The Ecofys Energy Scenario
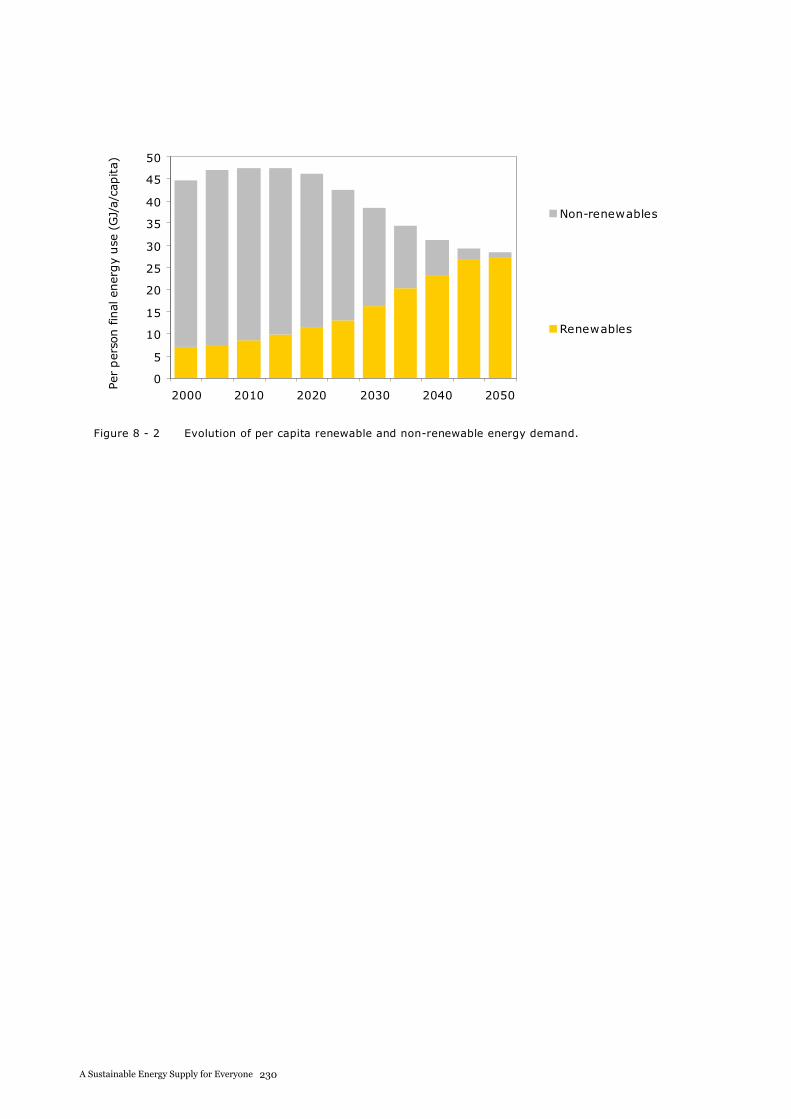
A S USTAI NABLE E NERGY S UPPLY F OR EVERY ONE
0
5
10
15
20
25
30
35
40
45
50
2000 2010 2020 2030 2040 2050
Per
per
son
final
ener
gy
use
(GJ/
a/ca
pita)
Non-renewables
Renewables
Figure 8 - 2 Evolution of per capita renewable and non-renewable energy demand.
A S USTAI NABLE E NERGY S UPPLY F OR EVERY ONE
Appendix A Key figures
Table A - 1 Global energy provided by source and year (EJ/a).
Source 2000 2010 2020 2030 2040 2050
Total electricity (EJ/a) 45.7 60.0 71.9 85.7 103.5 127.4
Wind power: On-shore 0.2 1.4 6.7 14.3 22.0 25.3
Wind power: Off-shore 0.0 0.0 0.5 1.3 3.4 6.7
Wave & Tidal 0.0 0.0 0.0 0.1 0.3 0.9
Photovoltaic solar 0.0 0.1 0.7 6.5 16.9 37.0
Concentrated solar: Power 0.0 0.1 0.6 3.9 13.7 21.6
Hydropower 7.9 11.3 13.4 14.4 14.8 14.9
Geothermal 0.1 0.3 0.7 1.7 3.4 4.9
Biomass 0.0 0.0 0.0 0.0 1.7 16.2
Coal 18.2 21.5 14.8 10.0 5.4 0.0
Gas 8.6 14.0 25.6 28.3 20.1 0.0
Oil 4.2 3.1 2.5 1.4 0.5 0.0
Nuclear 6.5 8.2 6.5 3.8 1.2 0.0
Industry fuels & heat (EJ/a) 63.7 79.1 82.3 74.6 63.0 59.0
Concentrated solar: Heat 0.0 0.0 0.1 0.4 2.6 8.8
Geothermal 0.0 0.1 0.2 0.6 1.6 2.9
Biomass 1.0 6.1 16.9 31.3 40.7 34.8
Fossil fuels 62.7 72.9 65.0 42.2 18.0 12.5
Building fuels & heat (EJ/a) 77.7 86.0 87.4 67.8 47.4 24.1
Solar thermal 0.0 0.7 3.3 11.9 16.0 12.6
Geothermal 0.2 0.5 1.5 4.1 10.5 8.4
Biomass 33.4 33.2 29.2 14.2 10.2 3.1
Fossil fuels 44.1 51.6 53.5 37.6 10.6 0.0
Transport fuels (EJ/a) 86.2 102.6 111.6 91.3 62.3 50.8
Biomass 0.7 4.8 12.9 29.7 45.7 50.8
Fossil fuels 85.5 97.8 98.8 61.7 16.6 0.0
Grand total (EJ/a) 273.4 327.6 353.3 319.4 276.2 261.4
230A Sustainable Energy Supply for Everyone
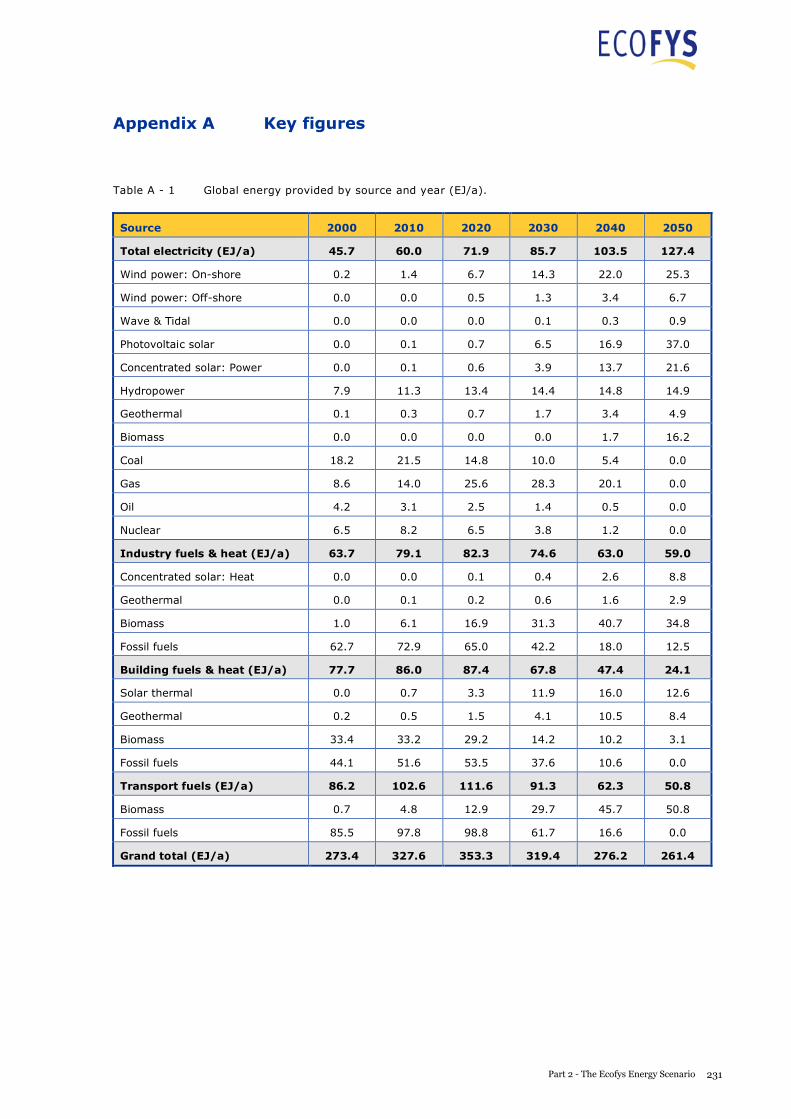
A S USTAI NABLE E NERGY S UPPLY F OR EVERY ONE
Appendix A Key figures
Table A - 1 Global energy provided by source and year (EJ/a).
Source 2000 2010 2020 2030 2040 2050
Total electricity (EJ/a) 45.7 60.0 71.9 85.7 103.5 127.4
Wind power: On-shore 0.2 1.4 6.7 14.3 22.0 25.3
Wind power: Off-shore 0.0 0.0 0.5 1.3 3.4 6.7
Wave & Tidal 0.0 0.0 0.0 0.1 0.3 0.9
Photovoltaic solar 0.0 0.1 0.7 6.5 16.9 37.0
Concentrated solar: Power 0.0 0.1 0.6 3.9 13.7 21.6
Hydropower 7.9 11.3 13.4 14.4 14.8 14.9
Geothermal 0.1 0.3 0.7 1.7 3.4 4.9
Biomass 0.0 0.0 0.0 0.0 1.7 16.2
Coal 18.2 21.5 14.8 10.0 5.4 0.0
Gas 8.6 14.0 25.6 28.3 20.1 0.0
Oil 4.2 3.1 2.5 1.4 0.5 0.0
Nuclear 6.5 8.2 6.5 3.8 1.2 0.0
Industry fuels & heat (EJ/a) 63.7 79.1 82.3 74.6 63.0 59.0
Concentrated solar: Heat 0.0 0.0 0.1 0.4 2.6 8.8
Geothermal 0.0 0.1 0.2 0.6 1.6 2.9
Biomass 1.0 6.1 16.9 31.3 40.7 34.8
Fossil fuels 62.7 72.9 65.0 42.2 18.0 12.5
Building fuels & heat (EJ/a) 77.7 86.0 87.4 67.8 47.4 24.1
Solar thermal 0.0 0.7 3.3 11.9 16.0 12.6
Geothermal 0.2 0.5 1.5 4.1 10.5 8.4
Biomass 33.4 33.2 29.2 14.2 10.2 3.1
Fossil fuels 44.1 51.6 53.5 37.6 10.6 0.0
Transport fuels (EJ/a) 86.2 102.6 111.6 91.3 62.3 50.8
Biomass 0.7 4.8 12.9 29.7 45.7 50.8
Fossil fuels 85.5 97.8 98.8 61.7 16.6 0.0
Grand total (EJ/a) 273.4 327.6 353.3 319.4 276.2 261.4
231Part 2 - The Ecofys Energy Scenario
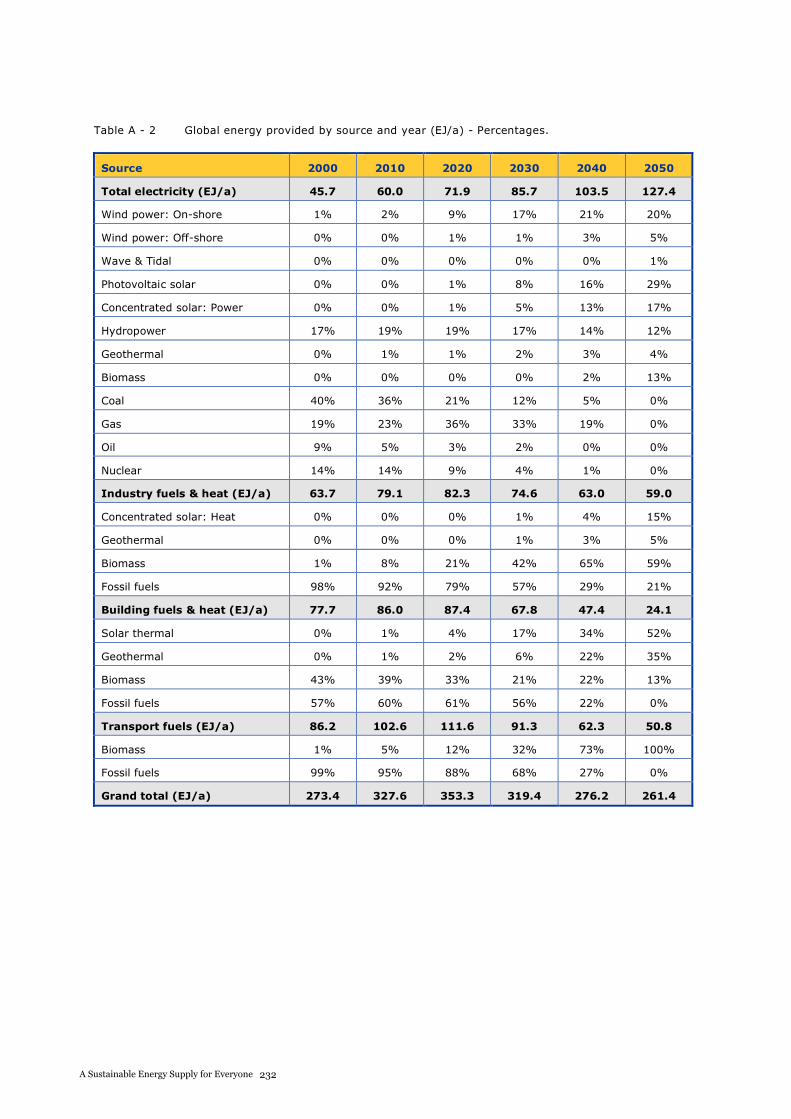
A S USTAI NABLE E NERGY S UPPLY F OR EVERY ONE
Table A - 2 Global energy provided by source and year (EJ/a) - Percentages.
Source 2000 2010 2020 2030 2040 2050
Total electricity (EJ/a) 45.7 60.0 71.9 85.7 103.5 127.4
Wind power: On-shore 1% 2% 9% 17% 21% 20%
Wind power: Off-shore 0% 0% 1% 1% 3% 5%
Wave & Tidal 0% 0% 0% 0% 0% 1%
Photovoltaic solar 0% 0% 1% 8% 16% 29%
Concentrated solar: Power 0% 0% 1% 5% 13% 17%
Hydropower 17% 19% 19% 17% 14% 12%
Geothermal 0% 1% 1% 2% 3% 4%
Biomass 0% 0% 0% 0% 2% 13%
Coal 40% 36% 21% 12% 5% 0%
Gas 19% 23% 36% 33% 19% 0%
Oil 9% 5% 3% 2% 0% 0%
Nuclear 14% 14% 9% 4% 1% 0%
Industry fuels & heat (EJ/a) 63.7 79.1 82.3 74.6 63.0 59.0
Concentrated solar: Heat 0% 0% 0% 1% 4% 15%
Geothermal 0% 0% 0% 1% 3% 5%
Biomass 1% 8% 21% 42% 65% 59%
Fossil fuels 98% 92% 79% 57% 29% 21%
Building fuels & heat (EJ/a) 77.7 86.0 87.4 67.8 47.4 24.1
Solar thermal 0% 1% 4% 17% 34% 52%
Geothermal 0% 1% 2% 6% 22% 35%
Biomass 43% 39% 33% 21% 22% 13%
Fossil fuels 57% 60% 61% 56% 22% 0%
Transport fuels (EJ/a) 86.2 102.6 111.6 91.3 62.3 50.8
Biomass 1% 5% 12% 32% 73% 100%
Fossil fuels 99% 95% 88% 68% 27% 0%
Grand total (EJ/a) 273.4 327.6 353.3 319.4 276.2 261.4
232A Sustainable Energy Supply for Everyone
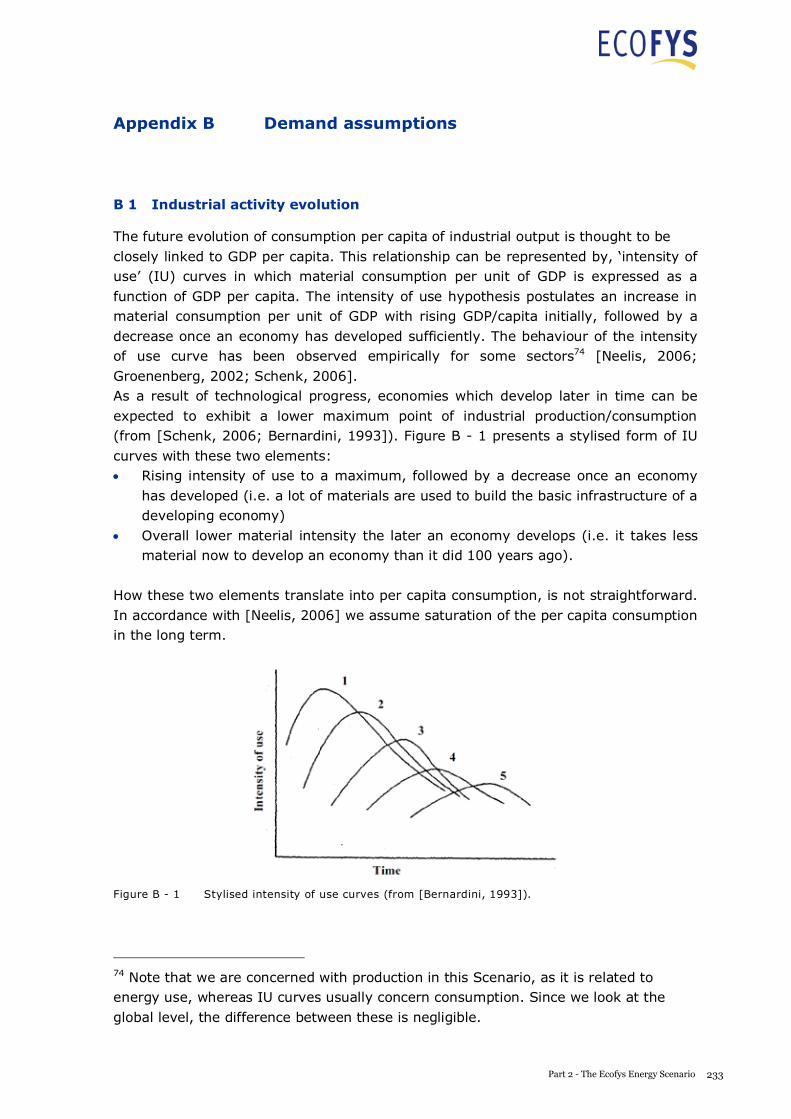
A S USTAI NABLE E NERGY S UPPLY F OR EVERY ONE
Appendix B Demand assumptions
B 1 Industrial activity evolution
The future evolution of consumption per capita of industrial output is thought to be closely linked to GDP per capita. This relationship can be represented by, ‘intensity of use’ (IU) curves in which material consumption per unit of GDP is expressed as a function of GDP per capita. The intensity of use hypothesis postulates an increase in material consumption per unit of GDP with rising GDP/capita initially, followed by a decrease once an economy has developed sufficiently. The behaviour of the intensity of use curve has been observed empirically for some sectors74 [Neelis, 2006; Groenenberg, 2002; Schenk, 2006]. As a result of technological progress, economies which develop later in time can be expected to exhibit a lower maximum point of industrial production/consumption (from [Schenk, 2006; Bernardini, 1993]). Figure B - 1 presents a stylised form of IU curves with these two elements:
Rising intensity of use to a maximum, followed by a decrease once an economy has developed (i.e. a lot of materials are used to build the basic infrastructure of a developing economy) Overall lower material intensity the later an economy develops (i.e. it takes less material now to develop an economy than it did 100 years ago).
How these two elements translate into per capita consumption, is not straightforward. In accordance with [Neelis, 2006] we assume saturation of the per capita consumption in the long term.
Figure B - 1 Stylised intensity of use curves (from [Bernardini, 1993]).
74 Note that we are concerned with production in this Scenario, as it is related to energy use, whereas IU curves usually concern consumption. Since we look at the global level, the difference between these is negligible.
233Part 2 - The Ecofys Energy Scenario
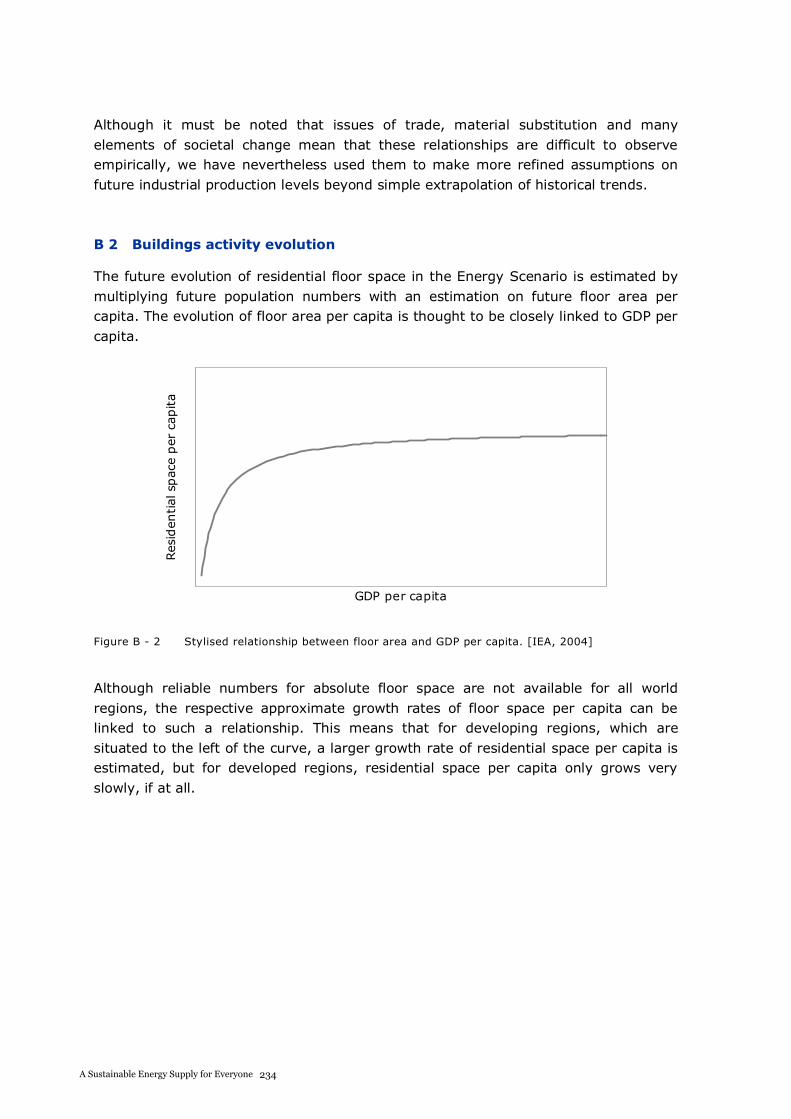
A S USTAI NABLE E NERGY S UPPLY F OR EVERY ONE
Although it must be noted that issues of trade, material substitution and many elements of societal change mean that these relationships are difficult to observe empirically, we have nevertheless used them to make more refined assumptions on future industrial production levels beyond simple extrapolation of historical trends.
B 2 Buildings activity evolution
The future evolution of residential floor space in the Energy Scenario is estimated by multiplying future population numbers with an estimation on future floor area per capita. The evolution of floor area per capita is thought to be closely linked to GDP per capita.
GDP per capita
Res
iden
tial
spac
eper
capita
Figure B - 2 Stylised relationship between floor area and GDP per capita. [IEA, 2004]
Although reliable numbers for absolute floor space are not available for all world regions, the respective approximate growth rates of floor space per capita can be linked to such a relationship. This means that for developing regions, which are situated to the left of the curve, a larger growth rate of residential space per capita is estimated, but for developed regions, residential space per capita only grows very slowly, if at all.
A S USTAI NABLE E NERGY S UPPLY F OR EVERY ONE
Appendix C Bioenergy assumptions
The Energy Scenario uses the following primary inputs to perform the bioenergy modelling:
The sustainable residues and waste potential described in Section 5.6. For the residue potential, estimations on the recoverable fraction of residues were used. These are specified in Appendix C 1. The sustainable energy crop hectare potential as described in Section 5.3. The sustainable complementary fellings potential as described in Section 5.5. The sustainable algae potential as described in Section 5.7.
To calculate the demand that can be supplied by the above, the Energy Scenario uses two additional data sources:
The yields of the energy crops under the expected circumstances. An overview of these yields is given in Appendix C 2. The efficiencies of conversion technologies used in meeting the demand. An overview of these efficiencies is provided in Appendix C 3.
C 1 Recoverable fractions
We have undertaken a literature study to obtain potentials of the residues used in the Scenario. In some instances, these potentials could be found directly in literature however, in the majority of these cases, we calculated these potentials in our own analyses. In these cases, we sourced recoverable fractions (RF) from literature where possible. Ecofys expert estimates were used in case literature values were not available. Subsequently, we have adapted some of the obtained RF values to adapt them to Scenario principles and future developments.
In practice, this means that the following obstacles for residue availability were most often adapted:
Economic feasibility: as (agricultural) infrastructure improves and the value of residues for energy purposes increases in the Scenario timeframe, economic barriers to residue collection diminish. Recycling of nutrients: primary agricultural residues are, in many cases, left on the land to recycle the nutrients contained in them. This practice can be adapted, according to the Scenario’s framework for recycling nutrients after energy has been extracted from the residues, by returning digestate from digestion of residues to the land, for example. This means that these residues can be used to supply energy as well as recycle nutrients.
Table C - 1 provides an overview of the non-adapted RF and the adapted RF, including reasoning and sources for the values.
234A Sustainable Energy Supply for Everyone
A S USTAI NABLE E NERGY S UPPLY F OR EVERY ONE
Appendix C Bioenergy assumptions
The Energy Scenario uses the following primary inputs to perform the bioenergy modelling:
The sustainable residues and waste potential described in Section 5.6. For the residue potential, estimations on the recoverable fraction of residues were used. These are specified in Appendix C 1. The sustainable energy crop hectare potential as described in Section 5.3. The sustainable complementary fellings potential as described in Section 5.5. The sustainable algae potential as described in Section 5.7.
To calculate the demand that can be supplied by the above, the Energy Scenario uses two additional data sources:
The yields of the energy crops under the expected circumstances. An overview of these yields is given in Appendix C 2. The efficiencies of conversion technologies used in meeting the demand. An overview of these efficiencies is provided in Appendix C 3.
C 1 Recoverable fractions
We have undertaken a literature study to obtain potentials of the residues used in the Scenario. In some instances, these potentials could be found directly in literature however, in the majority of these cases, we calculated these potentials in our own analyses. In these cases, we sourced recoverable fractions (RF) from literature where possible. Ecofys expert estimates were used in case literature values were not available. Subsequently, we have adapted some of the obtained RF values to adapt them to Scenario principles and future developments.
In practice, this means that the following obstacles for residue availability were most often adapted:
Economic feasibility: as (agricultural) infrastructure improves and the value of residues for energy purposes increases in the Scenario timeframe, economic barriers to residue collection diminish. Recycling of nutrients: primary agricultural residues are, in many cases, left on the land to recycle the nutrients contained in them. This practice can be adapted, according to the Scenario’s framework for recycling nutrients after energy has been extracted from the residues, by returning digestate from digestion of residues to the land, for example. This means that these residues can be used to supply energy as well as recycle nutrients.
Table C - 1 provides an overview of the non-adapted RF and the adapted RF, including reasoning and sources for the values.
235Part 2 - The Ecofys Energy Scenario
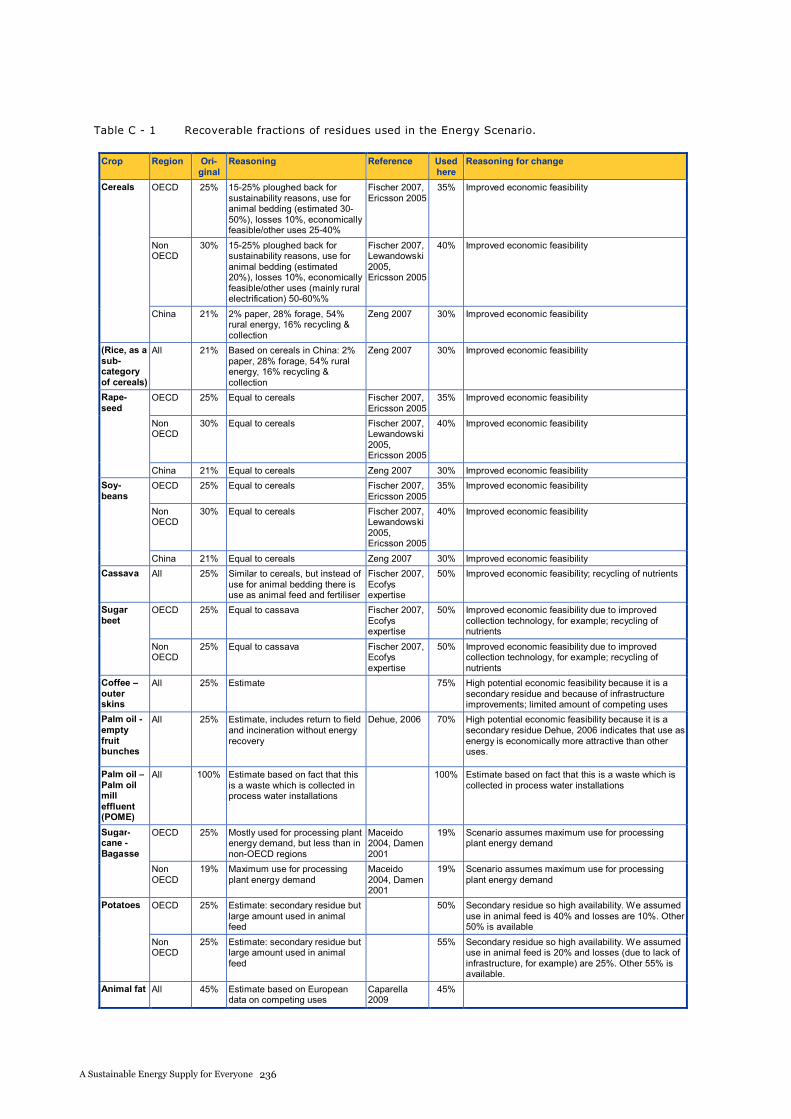
A S USTAI NABLE E NERGY S UPPLY F OR EVERY ONE
Table C - 1 Recoverable fractions of residues used in the Energy Scenario.
Crop Region Ori-ginal
Reasoning Reference Usedhere
Reasoning for change
Cereals OECD 25% 15-25% ploughed back for sustainability reasons, use for animal bedding (estimated 30-50%), losses 10%, economically feasible/other uses 25-40%
Fischer 2007, Ericsson 2005
35% Improved economic feasibility
NonOECD
30% 15-25% ploughed back for sustainability reasons, use for animal bedding (estimated 20%), losses 10%, economically feasible/other uses (mainly rural electrification) 50-60%%
Fischer 2007, Lewandowski 2005,Ericsson 2005
40% Improved economic feasibility
China 21% 2% paper, 28% forage, 54% rural energy, 16% recycling & collection
Zeng 2007 30% Improved economic feasibility
(Rice, as a sub-category of cereals)
All 21% Based on cereals in China: 2% paper, 28% forage, 54% rural energy, 16% recycling & collection
Zeng 2007 30% Improved economic feasibility
Rape-seed
OECD 25% Equal to cereals Fischer 2007, Ericsson 2005
35% Improved economic feasibility
NonOECD
30% Equal to cereals Fischer 2007, Lewandowski 2005,Ericsson 2005
40% Improved economic feasibility
China 21% Equal to cereals Zeng 2007 30% Improved economic feasibility Soy-beans
OECD 25% Equal to cereals Fischer 2007, Ericsson 2005
35% Improved economic feasibility
NonOECD
30% Equal to cereals Fischer 2007, Lewandowski 2005,Ericsson 2005
40% Improved economic feasibility
China 21% Equal to cereals Zeng 2007 30% Improved economic feasibility Cassava All 25% Similar to cereals, but instead of
use for animal bedding there is use as animal feed and fertiliser
Fischer 2007, Ecofys expertise
50% Improved economic feasibility; recycling of nutrients
Sugar beet
OECD 25% Equal to cassava Fischer 2007, Ecofys expertise
50% Improved economic feasibility due to improved collection technology, for example; recycling of nutrients
NonOECD
25% Equal to cassava Fischer 2007, Ecofys expertise
50% Improved economic feasibility due to improved collection technology, for example; recycling of nutrients
Coffee –outerskins
All 25% Estimate 75% High potential economic feasibility because it is a secondary residue and because of infrastructure improvements; limited amount of competing uses
Palm oil -empty fruit bunches
All 25% Estimate, includes return to field and incineration without energy recovery
Dehue, 2006 70% High potential economic feasibility because it is a secondary residue Dehue, 2006 indicates that use as energy is economically more attractive than other uses.
Palm oil –Palm oil milleffluent (POME)
All 100% Estimate based on fact that this is a waste which is collected in process water installations
100% Estimate based on fact that this is a waste which is collected in process water installations
Sugar-cane - Bagasse
OECD 25% Mostly used for processing plant energy demand, but less than in non-OECD regions
Maceido 2004, Damen 2001
19% Scenario assumes maximum use for processing plant energy demand
NonOECD
19% Maximum use for processing plant energy demand
Maceido 2004, Damen 2001
19% Scenario assumes maximum use for processing plant energy demand
Potatoes OECD 25% Estimate: secondary residue but large amount used in animal feed
50% Secondary residue so high availability. We assumed use in animal feed is 40% and losses are 10%. Other 50% is available
NonOECD
25% Estimate: secondary residue but large amount used in animal feed
55% Secondary residue so high availability. We assumed use in animal feed is 20% and losses (due to lack of infrastructure, for example) are 25%. Other 55% is available.
Animal fat All 45% Estimate based on European data on competing uses
Caparella 2009
45%
236A Sustainable Energy Supply for Everyone
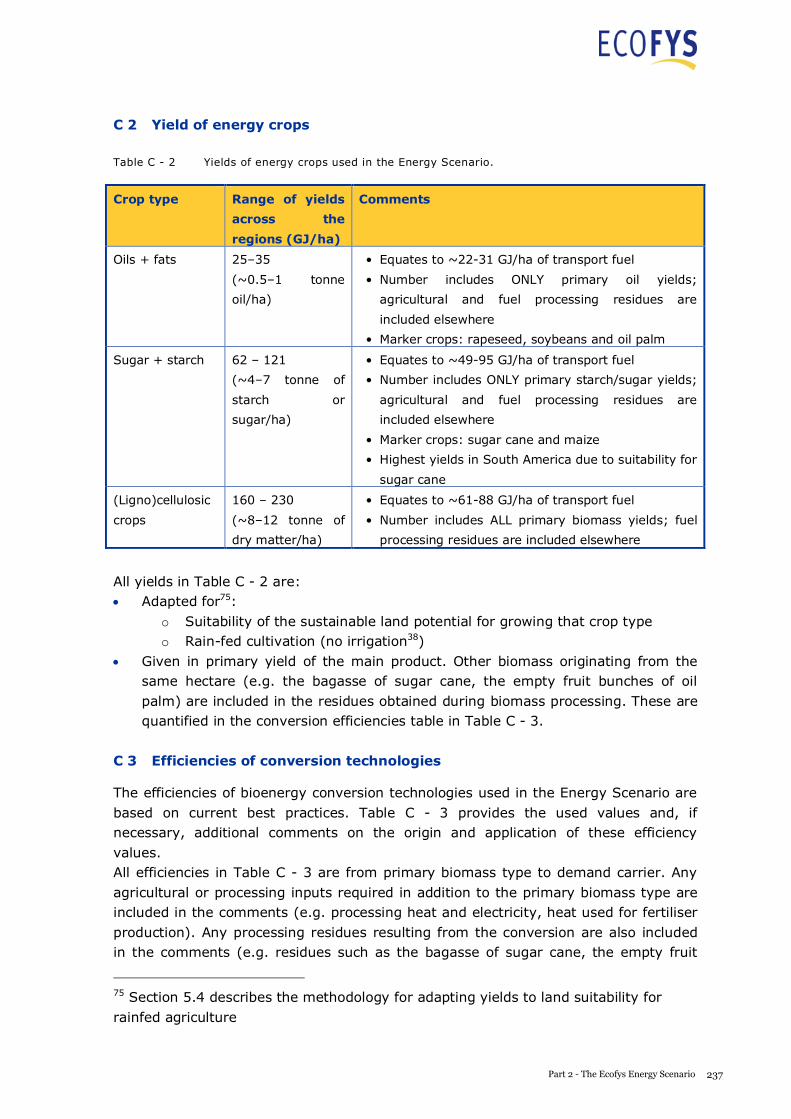
A S USTAI NABLE E NERGY S UPPLY F OR EVERY ONE
C 2 Yield of energy crops
Table C - 2 Yields of energy crops used in the Energy Scenario.
Crop type Range of yields
across the
regions (GJ/ha)
Comments
Oils + fats 25–35
(~0.5–1 tonne
oil/ha)
• Equates to ~22-31 GJ/ha of transport fuel
• Number includes ONLY primary oil yields;
agricultural and fuel processing residues are
included elsewhere
• Marker crops: rapeseed, soybeans and oil palm
Sugar + starch 62 – 121
(~4–7 tonne of
starch or
sugar/ha)
• Equates to ~49-95 GJ/ha of transport fuel
• Number includes ONLY primary starch/sugar yields;
agricultural and fuel processing residues are
included elsewhere
• Marker crops: sugar cane and maize
• Highest yields in South America due to suitability for
sugar cane
(Ligno)cellulosic
crops
160 – 230
(~8–12 tonne of
dry matter/ha)
• Equates to ~61-88 GJ/ha of transport fuel
• Number includes ALL primary biomass yields; fuel
processing residues are included elsewhere
All yields in Table C - 2 are: Adapted for75:
o Suitability of the sustainable land potential for growing that crop type o Rain-fed cultivation (no irrigation38)
Given in primary yield of the main product. Other biomass originating from the same hectare (e.g. the bagasse of sugar cane, the empty fruit bunches of oil palm) are included in the residues obtained during biomass processing. These are quantified in the conversion efficiencies table in Table C - 3.
C 3 Efficiencies of conversion technologies
The efficiencies of bioenergy conversion technologies used in the Energy Scenario are based on current best practices. Table C - 3 provides the used values and, if necessary, additional comments on the origin and application of these efficiency values. All efficiencies in Table C - 3 are from primary biomass type to demand carrier. Any agricultural or processing inputs required in addition to the primary biomass type are included in the comments (e.g. processing heat and electricity, heat used for fertiliser production). Any processing residues resulting from the conversion are also included in the comments (e.g. residues such as the bagasse of sugar cane, the empty fruit
75 Section 5.4 describes the methodology for adapting yields to land suitability for rainfed agriculture
237Part 2 - The Ecofys Energy Scenario
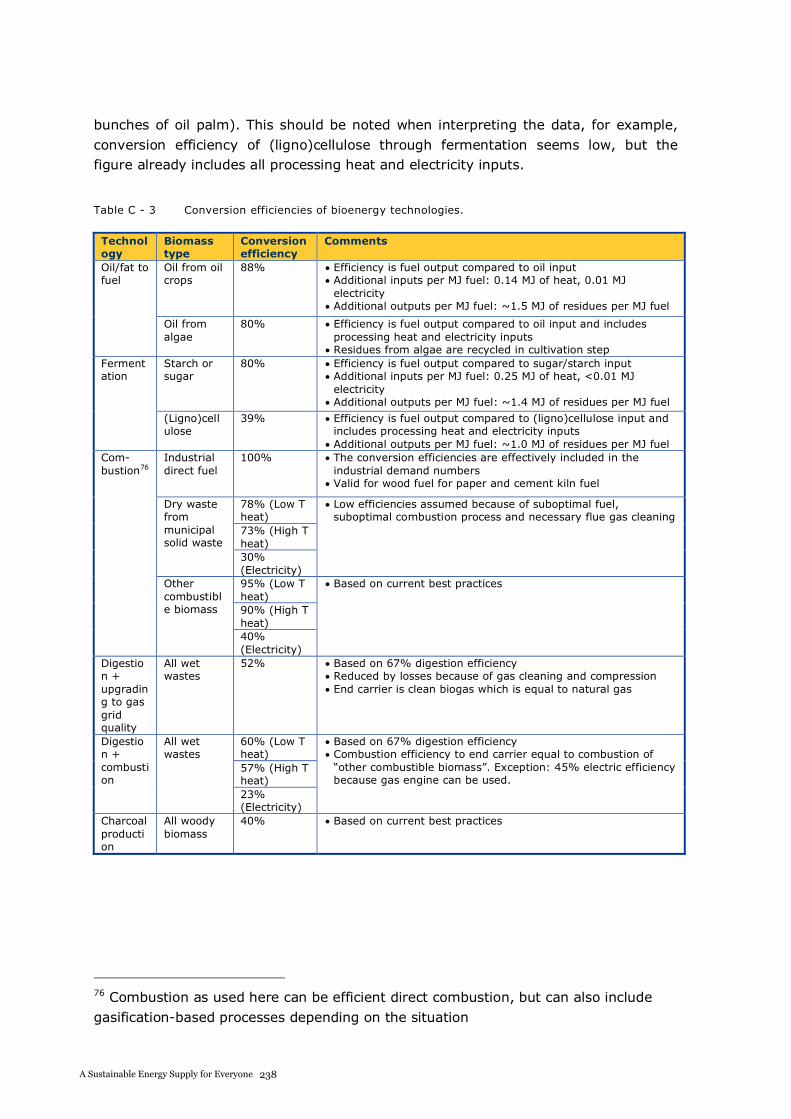
A S USTAI NABLE E NERGY S UPPLY F OR EVERY ONE
bunches of oil palm). This should be noted when interpreting the data, for example, conversion efficiency of (ligno)cellulose through fermentation seems low, but the figure already includes all processing heat and electricity inputs.
Table C - 3 Conversion efficiencies of bioenergy technologies.
Technology
Biomass type
Conversion efficiency
Comments
Oil/fat to fuel
Oil from oil crops
88% Efficiency is fuel output compared to oil input Additional inputs per MJ fuel: 0.14 MJ of heat, 0.01 MJ electricity Additional outputs per MJ fuel: ~1.5 MJ of residues per MJ fuel
Oil from algae
80% Efficiency is fuel output compared to oil input and includes processing heat and electricity inputs Residues from algae are recycled in cultivation step
Fermentation
Starch or sugar
80% Efficiency is fuel output compared to sugar/starch input Additional inputs per MJ fuel: 0.25 MJ of heat, <0.01 MJ electricity Additional outputs per MJ fuel: ~1.4 MJ of residues per MJ fuel
(Ligno)cellulose
39% Efficiency is fuel output compared to (ligno)cellulose input and includes processing heat and electricity inputs Additional outputs per MJ fuel: ~1.0 MJ of residues per MJ fuel
Com-bustion76
Industrial direct fuel
100% The conversion efficiencies are effectively included in the industrial demand numbers Valid for wood fuel for paper and cement kiln fuel
Dry waste frommunicipalsolid waste
78% (Low T heat)
Low efficiencies assumed because of suboptimal fuel, suboptimal combustion process and necessary flue gas cleaning
73% (High T heat)30%(Electricity)
Other combustible biomass
95% (Low T heat)
Based on current best practices
90% (High T heat)40%(Electricity)
Digestion + upgrading to gas grid quality
All wet wastes
52% Based on 67% digestion efficiency Reduced by losses because of gas cleaning and compression End carrier is clean biogas which is equal to natural gas
Digestion + combustion
All wet wastes
60% (Low T heat)
Based on 67% digestion efficiency Combustion efficiency to end carrier equal to combustion of “other combustible biomass”. Exception: 45% electric efficiency because gas engine can be used.
57% (High T heat)23%(Electricity)
Charcoalproduction
All woody biomass
40% Based on current best practices
76 Combustion as used here can be efficient direct combustion, but can also include gasification-based processes depending on the situation
A S USTAI NABLE E NERGY S UPPLY F OR EVERY ONE
Appendix D Sensitivity analyses on bioenergy
The Energy Scenario uses 250 Mha of land to grow bioenergy crops. A share of these crops is destined for fuel transport. It is therefore insightful to understand the relationship between transport demand assumptions and required land for bioenergy cropping. Although a full multiple scenario analysis was beyond the scope of this work, some basic calculations have been made, based on the relative share of various demand sectors, in the total biocrop volume. These are presented, together with the analysis on food demand and yield evolution, in Table D - 1.
Table D - 1 Basic sensitivity analysis on bioenergy from crops.
Metric Example change Cropland for bioenergy Reduction
in demand
(EJ/a)
Equiv. area
if supplied from
biocrops
available used
Energy Scenario (2050) 673 Mha 250 Mha
Supply:
Annual yield
increase
0.4%–1.5% (instead
of 1%)
300–1,080
Mha
n/a
Demand:
Animal
production
consumption
25%–75% instead of
50% meat
consumption in
OECD
350–1,270
Mha
n/a
Balance of
food demand
and supply
Supply is 90%–
110% of demand in
2005 instead of
being equal
500–800
Mha
n/a
Total freight
transport
10% reduction n/a ± 0 Mha* 1.6 ~7 Mha
30% reduction n/a ± 0 Mha* 4.9 ~21 Mha
Electrification
of freight
50% instead of 30%
electrification
n/a ± 0 Mha* 4.6 ~20 Mha
Passenger air
travel
10% reduction n/a - 4 Mha 1.4 ~6 Mha
30% reduction n/a - 11 Mha 4.2 ~19 Mha * by 2050 all road fuel in the Scenario is supplied from bioenergy streams other than crops
238A Sustainable Energy Supply for Everyone
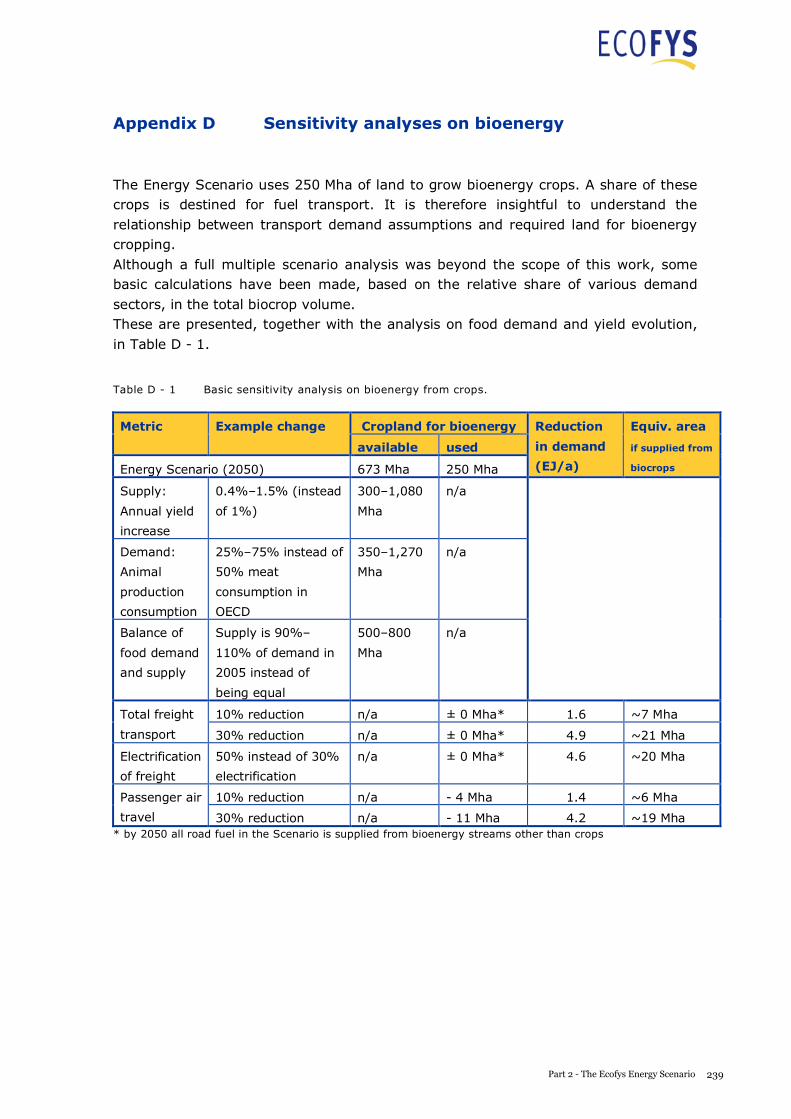
A S USTAI NABLE E NERGY S UPPLY F OR EVERY ONE
Appendix D Sensitivity analyses on bioenergy
The Energy Scenario uses 250 Mha of land to grow bioenergy crops. A share of these crops is destined for fuel transport. It is therefore insightful to understand the relationship between transport demand assumptions and required land for bioenergy cropping. Although a full multiple scenario analysis was beyond the scope of this work, some basic calculations have been made, based on the relative share of various demand sectors, in the total biocrop volume. These are presented, together with the analysis on food demand and yield evolution, in Table D - 1.
Table D - 1 Basic sensitivity analysis on bioenergy from crops.
Metric Example change Cropland for bioenergy Reduction
in demand
(EJ/a)
Equiv. area
if supplied from
biocrops
available used
Energy Scenario (2050) 673 Mha 250 Mha
Supply:
Annual yield
increase
0.4%–1.5% (instead
of 1%)
300–1,080
Mha
n/a
Demand:
Animal
production
consumption
25%–75% instead of
50% meat
consumption in
OECD
350–1,270
Mha
n/a
Balance of
food demand
and supply
Supply is 90%–
110% of demand in
2005 instead of
being equal
500–800
Mha
n/a
Total freight
transport
10% reduction n/a ± 0 Mha* 1.6 ~7 Mha
30% reduction n/a ± 0 Mha* 4.9 ~21 Mha
Electrification
of freight
50% instead of 30%
electrification
n/a ± 0 Mha* 4.6 ~20 Mha
Passenger air
travel
10% reduction n/a - 4 Mha 1.4 ~6 Mha
30% reduction n/a - 11 Mha 4.2 ~19 Mha * by 2050 all road fuel in the Scenario is supplied from bioenergy streams other than crops
239Part 2 - The Ecofys Energy Scenario
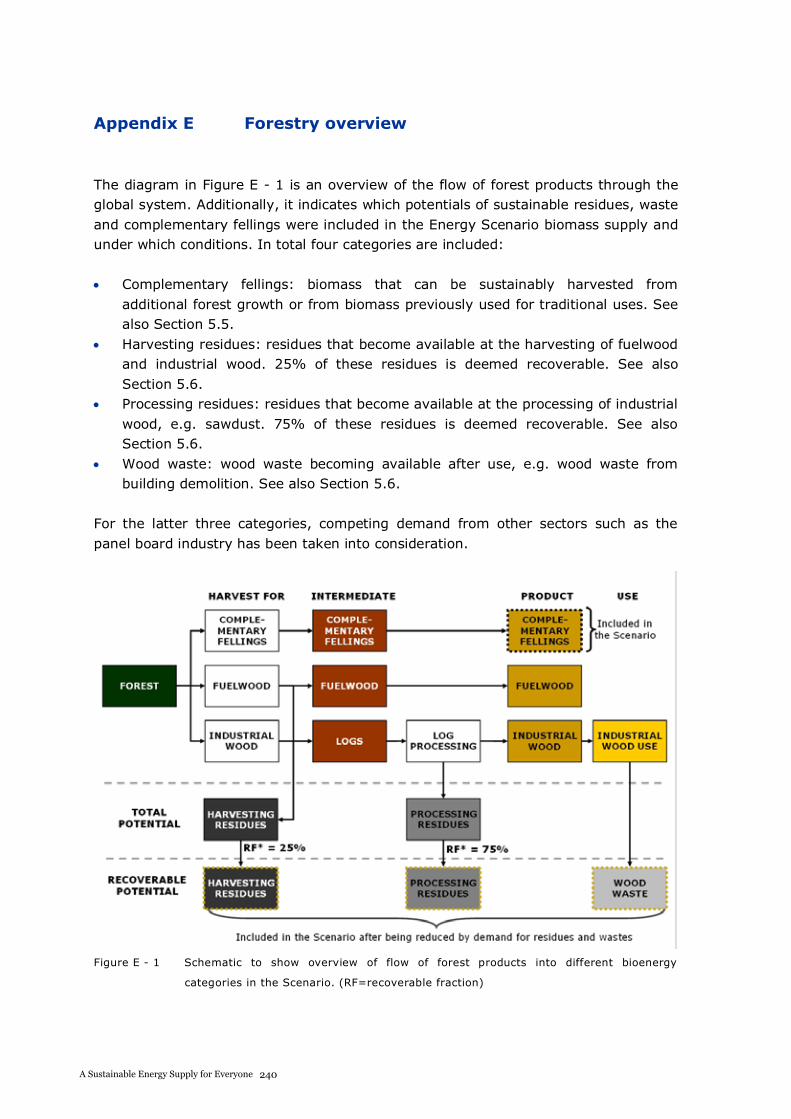
A S USTAI NABLE E NERGY S UPPLY F OR EVERY ONE
Appendix E Forestry overview
The diagram in Figure E - 1 is an overview of the flow of forest products through the global system. Additionally, it indicates which potentials of sustainable residues, waste and complementary fellings were included in the Energy Scenario biomass supply and under which conditions. In total four categories are included:
Complementary fellings: biomass that can be sustainably harvested from additional forest growth or from biomass previously used for traditional uses. See also Section 5.5. Harvesting residues: residues that become available at the harvesting of fuelwood and industrial wood. 25% of these residues is deemed recoverable. See also Section 5.6. Processing residues: residues that become available at the processing of industrial wood, e.g. sawdust. 75% of these residues is deemed recoverable. See also Section 5.6. Wood waste: wood waste becoming available after use, e.g. wood waste from building demolition. See also Section 5.6.
For the latter three categories, competing demand from other sectors such as the panel board industry has been taken into consideration.
Figure E - 1 Schematic to show overview of flow of forest products into different bioenergy
categories in the Scenario. (RF=recoverable fraction)
A S USTAI NABLE E NERGY S UPPLY F OR EVERY ONE
Appendix F Residues and waste categorisation overview
Figure F - 1 is a summary of residue and waste flows in the Energy Scenario. It illustrates the differentiation between primary, secondary and tertiary residues and waste made in Section 5.6.
Figure F - 1 Schematic to show overview of residue and waste flows in the Scenario, differentiating
between primary, secondary and tertiary residues and waste.
240A Sustainable Energy Supply for Everyone
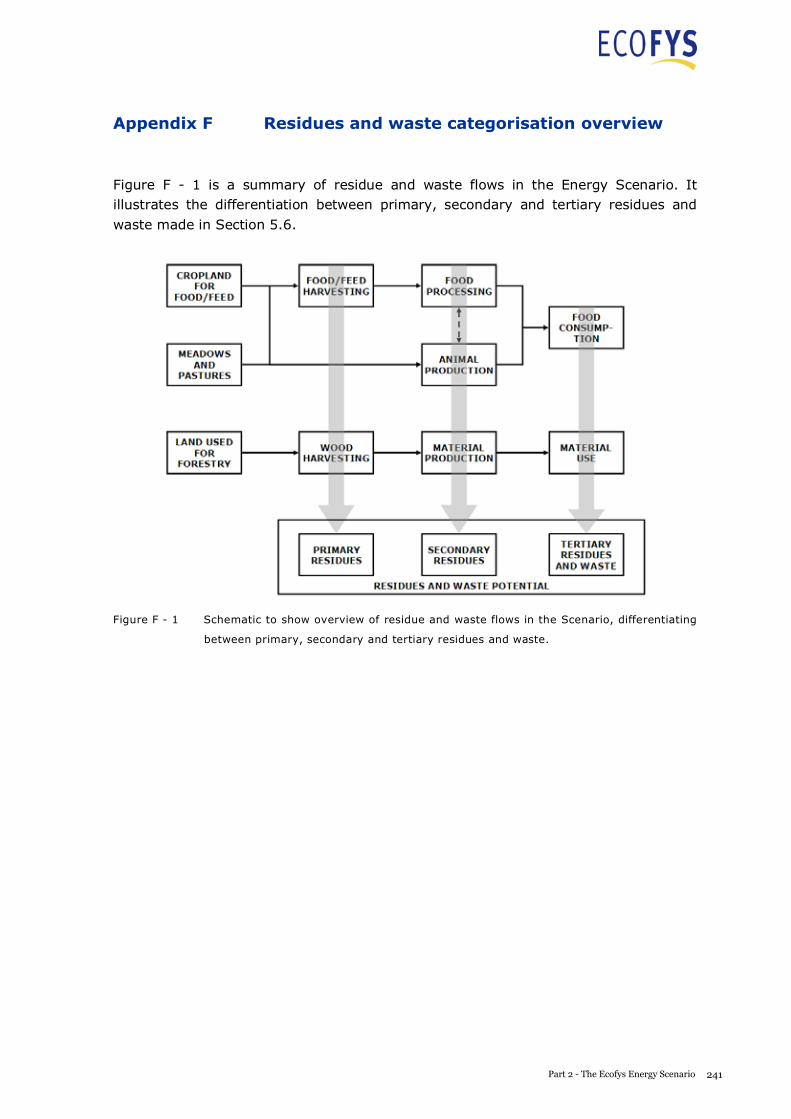
A S USTAI NABLE E NERGY S UPPLY F OR EVERY ONE
Appendix F Residues and waste categorisation overview
Figure F - 1 is a summary of residue and waste flows in the Energy Scenario. It illustrates the differentiation between primary, secondary and tertiary residues and waste made in Section 5.6.
Figure F - 1 Schematic to show overview of residue and waste flows in the Scenario, differentiating
between primary, secondary and tertiary residues and waste.
241Part 2 - The Ecofys Energy Scenario
A S USTAI NABLE E NERGY S UPPLY F OR EVERY ONE
Appendix G References
G 1 References – Introduction / Approach
Reports and publications
[Climate Solutions] “Climate Solutions” report, Climate Risk for WWF, with kind permission by WWF
[IPCC, 2000] Technical Support Unit IPCC-WG3, IPCC SRES emission scenarios, v1.1, Cambridge University Press
[Greenpeace, 2010] Greenpeace and EREC, energy [r]evolution, version 3, 2010 [Shell, 2008] “Shell scenarios to 2050”, Shell International bv, (2008),
Energy scenarios: Scramble and Blueprints [van Vuuren, 2007] Van Vuuren et al., (2007), Climatic Change, 81 2, pp 119-
159, “Stabilizing greenhouse gas concentrations at low levels: an assessment of reduction strategies and costs”
[WEO, 2009] International Energy Agency, (2009), World Energy Outlook
G 2 References – Demand
Data sources
[IEA, 2008] International Energy Agency, World Energy Balances, OECD and nonOECD databases, 2008 Edition
Reports and publications
[Bernardini, 1993] Bernardini and Galli, (1993), “Dematerialization: long-term trends in the intensity of use of materials and energy”, Futures
[CCC, 2009] UK Committee on Climate Change, (2009), “Meeting the UK aviation target – options for reducing emissions to 2050”
[DE Gov, 2006] German CO2 buildings report by the Federal Ministry of Transport, Building and Urban Development, “CO2 Gebäudereport”, www.bmvbs.de
[DE Gov, 2007] National Energy Efficiency Plan by the German Federal Ministry of Economy and Technology77
[Groenenberg, 2002] H Groenenberg, PhD thesis, (2002), “Development and Convergence” , Utrecht University
[IEA, 2004] International Energy Agency, (2004), “30 years of energy use – Oil Crises & Climate Challenges”, Fig. 5-5
77 http://www.bmwi.de/BMWi/Redaktion/PDF/Publikationen/nationaler-enerieeffizienzplan,property=pdf,bereich=bmwi,sprache=de,rwb=true.pdf
A S USTAI NABLE E NERGY S UPPLY F OR EVERY ONE
[IEA, 2007] International Energy Agency, (2007), “Tracking Industrial Energy Efficiency and CO2 Emissions”
[IEA, 2007b] International Energy Agency, (2007), “Energy use in the new millennium – Trends in IEA countries”
[IMO, 2009] International Maritime Organization, Marine environment protection committee, (2009), “Prevention of air pollution from ships – second GHG study”
[Kim, 2002] Kim & Worrell, Energy Policy 30, (2002), p. 827 [Neelis, 2006] M Neelis and M Patel, (2006), Report NWS-E-2006-180,
“Long-term production, energy consumption and CO2
emission scenarios for the worldwide iron and steel industry”, Copernicus Institute for Sustainable Development and Innovation, Utrecht University
[Martin, 2000] N. Martin, E. Worrell, M. Ruth, L. Price, R.N. Elliott, A.M. Shipley, J. Thorne, (2000), “Emerging Energy-Efficient Industrial Technologies,” Lawrence Berkeley National Laboratory/American Council for an Energy-Efficient Economy, Berkeley, CA/Washington, DC (LBNL-46990).
[Schenk, 2006] N Schenk, International Institute for Applied Systems Analysis, (2006), Interim report IR-06-014, “Long-term Energy Scenarios for the Industry Sector: Use of Physical Indicators”
[WBCSD, 2004] IEA/SMP. Model Documentation and Reference Case Projection for WBCSD’s Sustainable Mobility Project (SMP) (2004)
[Worrell, 2008] E Worrell et al., (2008), Lawrence Berkeley National Laboratory, LBNL-62806 ,“World Best Practice Energy Intensity Values for Selected Industrial Sectors”
[UN, 2007] United Nations, (2007), World Urbanization Prospects: The 2007 Revision Population Database
G 3 References – Supply (excl. bioenergy)
Data sources
[IEA, 2008] International Energy Agency, World Energy Balances, OECD and nonOECD databases, 2008 Edition
Reports and publications [Bertani, 2005] Bertani, Geothermics 34, (2005), p. 651 [Bertani, 2007] Bertani, EGC 2007- 30 May-1 June Unterhaching,
Germany [Blok, 1984] K. Blok, A Renewable Energy System for the Netherlands,
Proc. 5th International Solar Forum, DGS Sonnenenergie Verlags, München, 1984.
242A Sustainable Energy Supply for Everyone
A S USTAI NABLE E NERGY S UPPLY F OR EVERY ONE
[IEA, 2007] International Energy Agency, (2007), “Tracking Industrial Energy Efficiency and CO2 Emissions”
[IEA, 2007b] International Energy Agency, (2007), “Energy use in the new millennium – Trends in IEA countries”
[IMO, 2009] International Maritime Organization, Marine environment protection committee, (2009), “Prevention of air pollution from ships – second GHG study”
[Kim, 2002] Kim & Worrell, Energy Policy 30, (2002), p. 827 [Neelis, 2006] M Neelis and M Patel, (2006), Report NWS-E-2006-180,
“Long-term production, energy consumption and CO2
emission scenarios for the worldwide iron and steel industry”, Copernicus Institute for Sustainable Development and Innovation, Utrecht University
[Martin, 2000] N. Martin, E. Worrell, M. Ruth, L. Price, R.N. Elliott, A.M. Shipley, J. Thorne, (2000), “Emerging Energy-Efficient Industrial Technologies,” Lawrence Berkeley National Laboratory/American Council for an Energy-Efficient Economy, Berkeley, CA/Washington, DC (LBNL-46990).
[Schenk, 2006] N Schenk, International Institute for Applied Systems Analysis, (2006), Interim report IR-06-014, “Long-term Energy Scenarios for the Industry Sector: Use of Physical Indicators”
[WBCSD, 2004] IEA/SMP. Model Documentation and Reference Case Projection for WBCSD’s Sustainable Mobility Project (SMP) (2004)
[Worrell, 2008] E Worrell et al., (2008), Lawrence Berkeley National Laboratory, LBNL-62806 ,“World Best Practice Energy Intensity Values for Selected Industrial Sectors”
[UN, 2007] United Nations, (2007), World Urbanization Prospects: The 2007 Revision Population Database
G 3 References – Supply (excl. bioenergy)
Data sources
[IEA, 2008] International Energy Agency, World Energy Balances, OECD and nonOECD databases, 2008 Edition
Reports and publications [Bertani, 2005] Bertani, Geothermics 34, (2005), p. 651 [Bertani, 2007] Bertani, EGC 2007- 30 May-1 June Unterhaching,
Germany [Blok, 1984] K. Blok, A Renewable Energy System for the Netherlands,
Proc. 5th International Solar Forum, DGS Sonnenenergie Verlags, München, 1984.
243Part 2 - The Ecofys Energy Scenario
A S USTAI NABLE E NERGY S UPPLY F OR EVERY ONE
[DLR, 2005] DLR (German Aerospace Centre) (2005) Concentrating Solar Power for the Mediterrenean Region, MED-CSP, Commissioned by the Federal Ministry for the Environment, Nature
[ECF, 2010] ECF, Roadmap 2050 – A Practical Guide to a Prosperous, Low-Carbon Europe, European Climate Foundation, The Hague, 2010.
[Ecofys, 2010] Ecofys study for the Irish grid operator, Eirgrid, titled: “All Island TSO Facilitation of renewables studies”, available at http://www.eirgrid.com/media/Faciltiation%20of%20Renwables%20WP3%20Final%20Report.pdf
[EOEA, 2010] EU-OEA (European Ocean Energy Association0, (2010), “European Ocean Energy Roadmap”
[EPIA, 2008] EPIA report, (2008), “Solar Generation V” [EPIA, 2009] EPIA report, (2009), “Global Market Outlook for
Photovoltaics until 2013” [Forseo, 2008] “The Investor's Guide to Geothermal Energy”, (2008),
http://www.forseo.eu/english/publications.html[Gagnon, 1997] Gagnon and van de Vate, (1997), Energy Policy, 25 1, pp.
7-13 [GWEC, 2007] Global Wind Energy Council - GWEC (2007), “Global Wind
Report 2007” [Hofman, 2002] Hofman et al., (2002), “The potential of solar electricity to
reduce CO2 emissions”, Report no. PH4/14 for the Executive Committee of the IEA Greenhouse Gas R&D Programme
[Hoogwijk, 2008] Hoogwijk, M. and Graus, W. (2008), “Global potential of renewable energy sources: a literature assessment, Ecofys Netherlands”
[IPCC, 2006] Intergovernmental Panel on Climate Change, (2006), Task force on national greenhouse gas inventories – Guidelines, Volume 2; Energy
[Leutz, 2001] Leutz, R., T. Ackermann, A. Suzuki, A. Akisawa, T. Kashiwagi, (2001), “Technical offshore wind energy potentials around the globe”, In: European Wind Energy Conference and Exhibition, Copenhagen, Denmark.
[Lund, 2005] Lund et al, Geothermics 34, (2005), 691–727 [OES-IA, 2010] International Energy Agency – Implementing Agreement
on Ocean Energy Systems, (2010), 2009 Annual Report [REN21, 2010] Renewables 2010 Global Status Report, REN21
(Renewable Energy Network for the 21st Century) [Sørensen, 2004] B. Sørensen: Renewable Energy, Academic Press, 2004. [WWF, 2006] Climate Solutions, WWF (2006)
A S USTAI NABLE E NERGY S UPPLY F OR EVERY ONE
[WWF, 2008] China Wind Power Report, ISBN: 978-82-90980-29-9, WWF China, Chinese Renewable Energy Industries Association, 2008
G 4 References – Bioenergy: General
Data sources
[FAO, 1998] FAO 1998, Global Fibre Supply Model, Rome [FAOSTAT, 2010a] FAO, FAOSTAT, Statistics on permanent pastures and
meadows, 2010, http://faostat.fao.org [FAOSTAT, 2010b] FAO, FAOSTAT, Statistics on primary crops and livestock
equivalent, 2010, http://faostat.fao.org [WDPA, 2009] World Database on Protected Areas, Statistics January 2009,
http://www.unep-wcmc.org/wdpa/mdgs/WDPAPAstats_Jan09_download.xls
Scientific papers
[Campbell, 2008] Campbell et al., The global potential of bioenergy on abandoned agricultural lands, Environmental Sc Technol., 2008
[Erb, 2009] Karl-Heinz Erb: Universität Klagenfurt and PIK, Eating the Planet: Feeding and fuelling the world sustainably, fairly and humanely – a scoping study, 2009
[Field, 2008] Field et al., Biomass energy: the scale of the potential resource, 2008
[Pimentel, 2003] Pimentel, D. and Pimentel, M., Sustainability of meat-based and plant-based diets and the environment, American Journal of Clinical Nutrition, Vol. 78, No. 3, 2003
[Sparovek, 2007] Sparovek, G. et al, Sugarcane ethanol production in Brazil: an expansion model sensitive to socioeconomic and environmental concerns, Biofuel, Bioproducts & Biorefining, 2007
[Van Vuuren, 2009] Van Vuuren et al., Future bio-energy potential under various natural constraints, Energy Policy, 2009
Reports
[Blonk, 2008] Blonk, H. et al., Milieueffecten van Nederlandse consumptie van eiwitrijke producten (in Dutch; English equivalent: Environmental effects of Dutch consumption of protein-rich products), 2008
[Dedini, 2008] Dedini, Dedini launches ethanol mill that produces water (Press Release), 2008, available at http://uk.reuters.com/article/idUKN0234991420080702
244A Sustainable Energy Supply for Everyone
A S USTAI NABLE E NERGY S UPPLY F OR EVERY ONE
[WWF, 2008] China Wind Power Report, ISBN: 978-82-90980-29-9, WWF China, Chinese Renewable Energy Industries Association, 2008
G 4 References – Bioenergy: General
Data sources
[FAO, 1998] FAO 1998, Global Fibre Supply Model, Rome [FAOSTAT, 2010a] FAO, FAOSTAT, Statistics on permanent pastures and
meadows, 2010, http://faostat.fao.org [FAOSTAT, 2010b] FAO, FAOSTAT, Statistics on primary crops and livestock
equivalent, 2010, http://faostat.fao.org [WDPA, 2009] World Database on Protected Areas, Statistics January 2009,
http://www.unep-wcmc.org/wdpa/mdgs/WDPAPAstats_Jan09_download.xls
Scientific papers
[Campbell, 2008] Campbell et al., The global potential of bioenergy on abandoned agricultural lands, Environmental Sc Technol., 2008
[Erb, 2009] Karl-Heinz Erb: Universität Klagenfurt and PIK, Eating the Planet: Feeding and fuelling the world sustainably, fairly and humanely – a scoping study, 2009
[Field, 2008] Field et al., Biomass energy: the scale of the potential resource, 2008
[Pimentel, 2003] Pimentel, D. and Pimentel, M., Sustainability of meat-based and plant-based diets and the environment, American Journal of Clinical Nutrition, Vol. 78, No. 3, 2003
[Sparovek, 2007] Sparovek, G. et al, Sugarcane ethanol production in Brazil: an expansion model sensitive to socioeconomic and environmental concerns, Biofuel, Bioproducts & Biorefining, 2007
[Van Vuuren, 2009] Van Vuuren et al., Future bio-energy potential under various natural constraints, Energy Policy, 2009
Reports
[Blonk, 2008] Blonk, H. et al., Milieueffecten van Nederlandse consumptie van eiwitrijke producten (in Dutch; English equivalent: Environmental effects of Dutch consumption of protein-rich products), 2008
[Dedini, 2008] Dedini, Dedini launches ethanol mill that produces water (Press Release), 2008, available at http://uk.reuters.com/article/idUKN0234991420080702
245Part 2 - The Ecofys Energy Scenario
A S USTAI NABLE E NERGY S UPPLY F OR EVERY ONE
[Dornburg, 2008] Dornburg, V. et al., Assessment of global biomass potentials and their links to food, water, biodiversity, energy demand and economy, Main Report, 2008
[Ecofys, 2008] Ecofys, Worldwide potential of aquatic biomass, 2008 [Ecofys, 2008b] Ecofys, Technical specification: greenhouse gas calculator for
biofuels, v1.5, 2008 [EEA, 2006] EEA, How much bioenergy can Europe produce without
harming the environment?, 2006 [ExxonMobil, 2009] ExxonMobil, ExxonMobil Algae Biofuels Research and
Development Program (Brochure), http://www.exxonmobil.com/corporate/files/news_pub_algae_factsheet.pdf
[FAO, 2006] World agriculture: towards 2030/2050 - Prospects for food, nutrition, agriculture and major commodity groups, Global Perspective Studies Unit Food and Agriculture Organization of the United Nations Rome, June 2006
[FAO, 2009] FAO, Agricultural Outlook 2009 – 2018, 2009 [FAO, 2010] FAO, Global Forest Resources Assessment 2010, Country
Reports [Fischer, 2009] Fischer, G. et al. (IIASA), Biofuels and Food Security, 2009 [Greenpeace, 2010] Greenpeace and EREC, energy [r]evolution, version 3, 2010 [Hoogwijk, 2004] Hoogwijk, On the global and regional potential of renewable
energy sources, 2004 [IAASTD, 2009] IAASTD, Agriculture at a Crossroads, Global Report, 2009 [IEA, 2009] IEA Bioenergy, Bioenergy – a Sustainable and Reliable
Energy Source, 2009 [IFA, 2009] IFA, Fertilizers, climate change and enhancing Agricultural
Productivity Sustainably, 2009 [IPCC, 2006] IPCC, 2006 IPCC Guidelines for National Greenhouse Gas
Inventories, Volume 4: Agriculture, Forestry and Other Land Use, 2006
[IPCC, 2006b] Intergovernmental Panel on Climate Change, (2006), Task force on national greenhouse gas inventories – Guidelines, Volume 2; Energy
[JEC, 2007] JEC, Well-to-Wheel study, Version 2C, Well-to-tank report Appendix 1, 2007
[JEC, 2008] JEC, Well-to-Wheel results, version 3.0, 2008 [Linn, 2006] Linn, J. and Salfer, J., Feed Efficiency, paper available
through University of Minnesota Extension Service, http://www.cyfernet.extension.umn.edu/dairy/dairydays06/pdfs/LinnSalfer_FeedEfficiency.pdf
[OECD/IEA, 2009] OECD/IEA, Reference scenario from World Energy Outlook 2009, 2009
[PBL, 2009] PBL, Growing within Limits, 2009
A S USTAI NABLE E NERGY S UPPLY F OR EVERY ONE
[Shell, 2008] Shell, Shell Blueprints scenario from Shell energy scenarios to 2050, 2008
[Smeets, 2008] Smeets, Possibilities and limitations for sustainable bioenergy production systems, 2008
[UNEP, 2002] UNEP, Global Environmental Outlook, 2002 [WBGU, 1999] WBGU, Conversation and sustainable use of the biosphere,
1999 [WBGU, 2008] WBGU, World in Transition - Future Bioenergy and
sustainable land use, 2008
G 5 References – Bioenergy: Residues and waste
Oils and fats
Gunstone, F.D., Harwood, J.L., Dijkstra, A.J., 2007, The Lipid Handbook with CD-rom,Taylor & Francis Group, CRC Press, USA SEI 2003, A resource study on recovered vegetable oil and animal fats, Clearpower Ltd on behalf of Sustainable Energy Ireland, Ireland Caparella, T., European Renderers Shape Their Future, Render Magazine, August 2009
Forestry residues and wood waste
FAO 2005, Statistics on crop and forestry production available at http://faostat.fao.org/ , Food and Agriculture Organization of United Nations Smeets (2008), ‘Possibilities and limitations for sustainable bioenergy production systems’, Utrecht, The Netherlands
Agricultural residues
BTG 2004, ‘BIO-ENERGY'S ROLE IN THE EU ENERGY MARKET A view of developments until 2020’ Report to the European Commission, Enschede, Netherlands Cai 2004 ‘An assessment of biomass resources availability in Shanghai: 2005 analysis’ Chungsangunsit, Gheewala and Patumsawad 2004,‘Environmental Assessment of Electricity Production from Rice Husk: A Case Study in Thailand’ Electricity Supply Industry in Transition: Issues and Prospect for Asia 14-16 January 2004 Damen 2001, ‘Future prospects for biofuel production in Brazil’ Copernicus Institute Utrecht University Dehue B, 2006: Palm Oil and its By-Products as a Renewable Energy Source, Potential, Sustainability and Governance. Wageningen EEA (2006), ‘How much bioenergy can Europe produce without harming the environment?’ European Environment Agency (EEA), Copenhagen, Denmark, p. 59 + Appendices.
246A Sustainable Energy Supply for Everyone
A S USTAI NABLE E NERGY S UPPLY F OR EVERY ONE
[Shell, 2008] Shell, Shell Blueprints scenario from Shell energy scenarios to 2050, 2008
[Smeets, 2008] Smeets, Possibilities and limitations for sustainable bioenergy production systems, 2008
[UNEP, 2002] UNEP, Global Environmental Outlook, 2002 [WBGU, 1999] WBGU, Conversation and sustainable use of the biosphere,
1999 [WBGU, 2008] WBGU, World in Transition - Future Bioenergy and
sustainable land use, 2008
G 5 References – Bioenergy: Residues and waste
Oils and fats
Gunstone, F.D., Harwood, J.L., Dijkstra, A.J., 2007, The Lipid Handbook with CD-rom,Taylor & Francis Group, CRC Press, USA SEI 2003, A resource study on recovered vegetable oil and animal fats, Clearpower Ltd on behalf of Sustainable Energy Ireland, Ireland Caparella, T., European Renderers Shape Their Future, Render Magazine, August 2009
Forestry residues and wood waste
FAO 2005, Statistics on crop and forestry production available at http://faostat.fao.org/ , Food and Agriculture Organization of United Nations Smeets (2008), ‘Possibilities and limitations for sustainable bioenergy production systems’, Utrecht, The Netherlands
Agricultural residues
BTG 2004, ‘BIO-ENERGY'S ROLE IN THE EU ENERGY MARKET A view of developments until 2020’ Report to the European Commission, Enschede, Netherlands Cai 2004 ‘An assessment of biomass resources availability in Shanghai: 2005 analysis’ Chungsangunsit, Gheewala and Patumsawad 2004,‘Environmental Assessment of Electricity Production from Rice Husk: A Case Study in Thailand’ Electricity Supply Industry in Transition: Issues and Prospect for Asia 14-16 January 2004 Damen 2001, ‘Future prospects for biofuel production in Brazil’ Copernicus Institute Utrecht University Dehue B, 2006: Palm Oil and its By-Products as a Renewable Energy Source, Potential, Sustainability and Governance. Wageningen EEA (2006), ‘How much bioenergy can Europe produce without harming the environment?’ European Environment Agency (EEA), Copenhagen, Denmark, p. 59 + Appendices.
247Part 2 - The Ecofys Energy Scenario
A S USTAI NABLE E NERGY S UPPLY F OR EVERY ONE
Ericsson, Karin, Nilsson Lars J., 2005 ‘Assessment of the potential biomass supply in Europe using a resource-focused approach’, Environmental and Energy System Studies, Lund University, Gerdagatan 13SE-223 62 Lund, Sweden FAO 19xx, ‘The potential of crop residues, particularly wheat straw, as livestock feed in Ethiopia’ Lulseged Gebrehiwot and Jamal Mohammed, Institute of Agricultural Research, P.O. Box 2003, Addis Ababa, Ethiopia FAO 2005, Statistics on crop and forestry production available at http://faostat.fao.org/ , Food and Agriculture Organization of United Nations FAO and IIASA (2002), ‘Global Agro-ecological Assessment for Agriculture in the 21st century: Methodology and Results’, International Institute of Applied Systems Analysis (IIASA), United Nations Food Agricultural Organisation (FAO), Laxenburg, Austria; Rome, Italy, p. 119. Fischer, Hizsnyik, Prieler, van Velthuizen 2007 ‘Assessment of biomass potentials for biofuel feedstock production in Europe: Methodology and results’ Work Package 2 - Biomass potentials for bio-fuels: sources, magnitudes, land use impacts REFUEL Gupta 2004, ‘Residue burning in rice–wheat cropping system: Causes and implications’ National Physical Laboratory, Dr. K.S. Krishnan Road, New Delhi 110 012, India JRC, EUCAR and CONCAWE (2004), ‘Well-to wheel analysis of future automotive fuels and powertrains in the European context’, European Council for Automotive R&D (EUCAR), European association for environment, health and safety in oil refining and distribution (CONCAWE), the Institute for Environment and Sustainability of the EU Commission's Joint Research Centre (JRC/IES). Junmeng Cai, Ronghou Liu, Chunjian Deng, Renewable and Sustainable Energy Reviews 12 (2008) 1997–2004 Kim, Dale 2004, ‘Global potential bioethanol production from wasted crops and crop residues’,Department of Chemical Engineering & Materials Science, Room 2527 Engineering Building, Michigan State University, East Lansing, MI 48824-1226, USA Biomass and Bioenergy 26 (2004) 361 – 375 Lewandowski 2005, ‘The potential biomass for energy production in the Czech Republic’ Biomass and Bioenergy 30 (2006) 405–421 Macedo, I.C., M.R.L.V. Leal and J.E.A.R. Da Silva (2004), ‘Assessment of greenhouse gas emissions in the production and use of fuel ethanol in Brazil’, Secretariat of the Environment of the State of São Paulo, Brazil, p. 32. R. Lal 2004, ‘World crop residues production and implications of its use as a biofuel’ Carbon Management and Sequestration Center, The Ohio State University, Columbus, OH 43210, United States Environment International 31 (2005) 575– 584 S. Sokhansanj, S. Mani1, M. Stumborg, R. Samson and J. Fenton, 2006 ‘Production and distribution of cereal straw on the Canadian prairies’ Canadian Biosystems Engineering/Le génie des biosystèmes au Canada 48: 3.39 - 3.46. Steunpunt voor duurzame landbouw 2003 ‘ENERGIEGEWASSEN IN DE VLAAMSE LANDBOUWSECTOR’ Visi García Cidad, Erik Mathijs, Frank Nevens, Dirk Reheul, België
A S USTAI NABLE E NERGY S UPPLY F OR EVERY ONE
Workshop: "Cereals straw and agricultural residues for bioenergy in New Member States and Candidate Countries" Novi Sad, Serbia, 2-3 October 2007 WUR 2005, ‘Gewasresten afvoeren: Utopie of optie’, Praktijkonderzoek Plant en Omgeving, Wageningen UR Xianyang Zeng, Yitai Ma_, Lirong Ma, 2007 ‘Utilization of straw in biomass energy in China’ Thermal Energy Research Institute, Tianjin University, Tianjin 300072, People’s Republic of China , Renewable and Sustainable Energy Reviews 11 (2007) 976–987 Yusoff 2004 ‘Renewable energy from palm oil - innovation on effective utilization of waste’ Department of Civil and Environmental Engineering, University of Malaya, Malaysia
Wet waste and residues
Dehue B, 2006: Palm Oil and its By-Products as a Renewable Energy Source, Potential, Sustainability and Governance. Wageningen FAO 2005, Statistics on crop and forestry production available at http://faostat.fao.org/ , Food and Agriculture Organization of United Nations FAO and IIASA (2002), ‘Global Agro-ecological Assessment for Agriculture in the 21st century: Methodology and Results’, International Institute of Applied Systems Analysis (IIASA), United Nations Food Agricultural Organisation (FAO), Laxenburg, Austria; Rome, Italy, p. 119. GRAIN 2001, Global Restrictions on biomass Availability for Import to the Netherlands, Novem projectnr. 356598/1010. UCE, UU-NW&S, RIVM, WU-PP, ECN, Ecofys Junmeng Cai, Ronghou Liu, Chunjian Deng, Renewable and Sustainable Energy Reviews 12 (2008) 1997–2004 Kim, Dale 2004, ‘Global potential bioethanol production from wasted crops and crop residues’, Department of Chemical Engineering & Materials Science, Room 2527 Engineering Building, Michigan State University, East Lansing, MI 48824-1226, USA Biomass and Bioenergy 26 (2004) 361 – 375 Steunpunt voor duurzame landbouw 2003 ‘ENERGIEGEWASSEN IN DE VLAAMSE LANDBOUWSECTOR’ Visi García Cidad, Erik Mathijs, Frank Nevens, Dirk Reheul, BelgiëVan Haandel, van Lier 2006 ‘Vinasse treatment for energy production and environmental protection at alcohol distillery plants’ Proc. of DIVER 2006, Int. Conf. on Production and Uses of Ethanol. June 19-23 2006, Havana, Cuba. Invited Key Note WUR 2005, ‘Gewasresten afvoeren: Utopie of optie’, Praktijkonderzoek Plant en Omgeving, Wageningen UR
Dry waste
EPA Office of Solid Waste, Municipal Solid Waste in the United States – 2007 Facts & Figures OECD, Environmental Data Compendium 2006-2008
248A Sustainable Energy Supply for Everyone
A S USTAI NABLE E NERGY S UPPLY F OR EVERY ONE
Workshop: "Cereals straw and agricultural residues for bioenergy in New Member States and Candidate Countries" Novi Sad, Serbia, 2-3 October 2007 WUR 2005, ‘Gewasresten afvoeren: Utopie of optie’, Praktijkonderzoek Plant en Omgeving, Wageningen UR Xianyang Zeng, Yitai Ma_, Lirong Ma, 2007 ‘Utilization of straw in biomass energy in China’ Thermal Energy Research Institute, Tianjin University, Tianjin 300072, People’s Republic of China , Renewable and Sustainable Energy Reviews 11 (2007) 976–987 Yusoff 2004 ‘Renewable energy from palm oil - innovation on effective utilization of waste’ Department of Civil and Environmental Engineering, University of Malaya, Malaysia
Wet waste and residues
Dehue B, 2006: Palm Oil and its By-Products as a Renewable Energy Source, Potential, Sustainability and Governance. Wageningen FAO 2005, Statistics on crop and forestry production available at http://faostat.fao.org/ , Food and Agriculture Organization of United Nations FAO and IIASA (2002), ‘Global Agro-ecological Assessment for Agriculture in the 21st century: Methodology and Results’, International Institute of Applied Systems Analysis (IIASA), United Nations Food Agricultural Organisation (FAO), Laxenburg, Austria; Rome, Italy, p. 119. GRAIN 2001, Global Restrictions on biomass Availability for Import to the Netherlands, Novem projectnr. 356598/1010. UCE, UU-NW&S, RIVM, WU-PP, ECN, Ecofys Junmeng Cai, Ronghou Liu, Chunjian Deng, Renewable and Sustainable Energy Reviews 12 (2008) 1997–2004 Kim, Dale 2004, ‘Global potential bioethanol production from wasted crops and crop residues’, Department of Chemical Engineering & Materials Science, Room 2527 Engineering Building, Michigan State University, East Lansing, MI 48824-1226, USA Biomass and Bioenergy 26 (2004) 361 – 375 Steunpunt voor duurzame landbouw 2003 ‘ENERGIEGEWASSEN IN DE VLAAMSE LANDBOUWSECTOR’ Visi García Cidad, Erik Mathijs, Frank Nevens, Dirk Reheul, BelgiëVan Haandel, van Lier 2006 ‘Vinasse treatment for energy production and environmental protection at alcohol distillery plants’ Proc. of DIVER 2006, Int. Conf. on Production and Uses of Ethanol. June 19-23 2006, Havana, Cuba. Invited Key Note WUR 2005, ‘Gewasresten afvoeren: Utopie of optie’, Praktijkonderzoek Plant en Omgeving, Wageningen UR
Dry waste
EPA Office of Solid Waste, Municipal Solid Waste in the United States – 2007 Facts & Figures OECD, Environmental Data Compendium 2006-2008
249Part 2 - The Ecofys Energy Scenario
A S USTAI NABLE E NERGY S UPPLY F OR EVERY ONE
SenterNovem Uitvoering Afvalbeheer, Nederlands Afval in Cijfers 2000-2006 Statline, CBS, statistical data on the Netherlands for 2000-2005
G 6 References – Investments & Savings
[Airbus, 2008] Airbus aircraft, Range of 2008 list prices, 2008. [B737.org, 2010] The Boeing 737 Technical site, Advanced blended winglets last
visited on 2010-06-28 [DB, 2004] Deutsche Bahn, Unsere Schienenfahrzeuge im Fernverkehr,
2004. [DBSchenker, 2010] DBSchenker, Güterwagen der Bahn, Catalogue of railroad
freight cars of German railroad company Deutsche Bahn, last visited on 2010-06-28
[DCEN, 2008] Department of Communications, Energy and Natural Resources, All Island Grid Study, 2008.
[DCEN, 2009] Department of Communications, Energy and Natural Resources, All Island Renewable Grid Study – Updated to include demand side management, 2009.
[DLR, 2006] Deutsches Zentrum für Luft- und Raumfahrt, Trans-Mediterranean Interconnection for Concentrating Solar Power – Final Report, 2006.
[ECB, 2010] European Central Bank, ECB deflator data and quarterly USD exchange rates, downloaded on 2010-03-05.
[SERPECEcofys, 2009a] SERPEC Ecofys, (Sectoral Emission Reduction Potentials and Economic Costs for Climate Change), (2009), Study for the European Commission by a consortium of institutes led by Ecofys2009.
[Ecofys, 2009b] Ecofys, Policy instrument design to reduce financing costs in renewable energy technology projects, 2009.
[EIA, 2009] Energy Information Administration, An Updated Annual Energy Outlook 2009 Reference Case, 2009.
[EIA, 2009] Energy Information Administration, An Updated Annual Energy Outlook 2009.
[ERF, 2009] European Union Road Federation, European Road Statistics 2009.
[ETH Zürich, 2009] ETH Zürich, Institut für Raum- und Landschaftsentwicklung, Professur für Raumentwicklung, Vorlesung Raum- und Infrastrukturentwicklung, 2009, downloaded on 2009-11-02
[Hansa Treuhand, 2009] Hansa Treuhand, Sky Cloud A380 Emirates, Sales information for closed capital fund, 2009.
[IEA, 2000] International Energy Agency, Experience Curves for Energy Technology Policy, 2000.
A S USTAI NABLE E NERGY S UPPLY F OR EVERY ONE
[IEA, 2005] International Energy Agency, Projected Costs of Generating Electricity - 2005 Update, 2005.
[IEA, 2007] International Energy Agency, Energy Technology Essentials - Biomass for Power Generation and CHP, 2007.
[IMO, 2009] International Maritime Organisation, International Shipping and World Trade - Facts and figures 2009.
[Lufthansa, 2008] Lufthansa, Annual report 2008 – Our strengths in detail, 2009. [OECD, 2010] IEA, OPEC, OECD, World Bank Joint Report, Analysis of the
Scope of Energy Subsidies and Suggestions for the G-20 Initiative, Prepared for submission to the G-20 Summit Meeting Toronto (Canada), June 2010; http://www.oecd.org/dataoecd/55/5/45575666.pdf
[Railway Technical, 2010] Railway Technical Web Pages, Railway Finance, last visited on 2010-06-28
[Stern, 2006] Stern, N., Stern Review on The Economics of Climate Change (pre-publication edition). Summary of Conclusions. 2006
250A Sustainable Energy Supply for Everyone
A S USTAI NABLE E NERGY S UPPLY F OR EVERY ONE
[IEA, 2005] International Energy Agency, Projected Costs of Generating Electricity - 2005 Update, 2005.
[IEA, 2007] International Energy Agency, Energy Technology Essentials - Biomass for Power Generation and CHP, 2007.
[IMO, 2009] International Maritime Organisation, International Shipping and World Trade - Facts and figures 2009.
[Lufthansa, 2008] Lufthansa, Annual report 2008 – Our strengths in detail, 2009. [OECD, 2010] IEA, OPEC, OECD, World Bank Joint Report, Analysis of the
Scope of Energy Subsidies and Suggestions for the G-20 Initiative, Prepared for submission to the G-20 Summit Meeting Toronto (Canada), June 2010; http://www.oecd.org/dataoecd/55/5/45575666.pdf
[Railway Technical, 2010] Railway Technical Web Pages, Railway Finance, last visited on 2010-06-28
[Stern, 2006] Stern, N., Stern Review on The Economics of Climate Change (pre-publication edition). Summary of Conclusions. 2006
251Part 2 - The Ecofys Energy Scenario
A S USTAI NABLE E NERGY S UPPLY F OR EVERY ONE
Appendix H Glossary
BAT best available technology
BAU business as usual
CapEx capital expenditures
CCS carbon Capture and Storage
cleantech collective term used to describe the ensemble of ‘clean’ or low-
carbon / low-energy technologies
GAI gross annual increment = equivalent to natural tree growth in a year
in the forest
GDP gross domestic product
GHG greenhouse gas
GJ giga joules
IEA International Energy Agency
IU Intensity of Use
kWh kilo watt hour
J joules, SI unit to express quantities of energy
Mha mega hectare (10,000 km2)
MWh mega watt hour
MJ mega joules
OpEx operational expenditures
per capita per person
period period in the context of this study usually means 5-year period.
pkm person-km (unit of activity in passenger transport)
PTW Personal two- and three- wheelers
PHEV Plug-in Hybrid Electric Vehicle
BEV Battery-Electric Vehicle
region here: region is a geographic area comprising one or several
countries. The world contains 10 regions.
RES Renewable Energy Sources
Residue in this study: leftover biomass of production or processing of raw
materials or use of products. Commonly split into primary residues of
biomass production (e.g. straw), secondary residues of biomass
processing (e.g. sawdust) and tertiary residues after product use
(e.g. manure). Tertiary residues, especially when they no longer have
an economic value, are often called waste
252A Sustainable Energy Supply for Everyone

A S USTAI NABLE E NERGY S UPPLY F OR EVERY ONE
Appendix H Glossary
BAT best available technology
BAU business as usual
CapEx capital expenditures
CCS carbon Capture and Storage
cleantech collective term used to describe the ensemble of ‘clean’ or low-
carbon / low-energy technologies
GAI gross annual increment = equivalent to natural tree growth in a year
in the forest
GDP gross domestic product
GHG greenhouse gas
GJ giga joules
IEA International Energy Agency
IU Intensity of Use
kWh kilo watt hour
J joules, SI unit to express quantities of energy
Mha mega hectare (10,000 km2)
MWh mega watt hour
MJ mega joules
OpEx operational expenditures
per capita per person
period period in the context of this study usually means 5-year period.
pkm person-km (unit of activity in passenger transport)
PTW Personal two- and three- wheelers
PHEV Plug-in Hybrid Electric Vehicle
BEV Battery-Electric Vehicle
region here: region is a geographic area comprising one or several
countries. The world contains 10 regions.
RES Renewable Energy Sources
Residue in this study: leftover biomass of production or processing of raw
materials or use of products. Commonly split into primary residues of
biomass production (e.g. straw), secondary residues of biomass
processing (e.g. sawdust) and tertiary residues after product use
(e.g. manure). Tertiary residues, especially when they no longer have
an economic value, are often called waste
A S USTAI NABLE E NERGY S UPPLY F OR EVERY ONE
RF recoverable fraction. Fraction of the totally generated residue that
can be recovered for energy production.
sqm square metres, unit used to express the amount of building area in
the building sector
tkm tonne-km (unit of activity in freight transport)
Waste term used to refer to tertiary residues (see ‘Residue’), especially
when they no longer have an economic value
Wh Watt-hours, alternative unit to measure the energy provided by
electricity sources
253Part 2 - The Ecofys Energy Scenario

WWF Offices
ArmeniaAzerbaijanAustraliaAustriaBelgiumBelizeBhutanBoliviaBrazilBulgariaCambodiaCameroonCanadaCape VerdeCentral African RepublicChileChinaColombiaCosta RicaD.R. of CongoDenmarkEcuadorFinlandFijiFranceGabonGambiaGeorgiaGermanyGhanaGreeceGuatemalaGuyanaHonduras
Hong KongHungaryIndiaIndonesiaItalyJapanKenyaLaosMadagascarMalaysiaMauritaniaMexicoMongoliaMozambiqueNamibiaNepalNetherlandsNew ZealandNígerNorwayPakistanPanamaPapua New GuineaParaguayPeruPhilippinesPolandRomaniaRussiaSenegalSingaporeSolomon IslandsSouth AfricaSpainSurinameSweden
WWF Associates
Fundación Vida Silvestre (Argentina)Fundación Natura (Ecuador)Pasaules Dabas Fonds (Latvia)Nigerian Conservation Foundation (Nigeria)
Others
Emirate Wildlife Society (UAE)
As at: October 2010
Publication details
Published in January 2011 by WWF – World Wide Fund For Nature (Formerly World Wildlife Fund), Gland, Switzerland. Any reproduction in full or in part of this publication must mention the title and credit the above-mentioned publisher as the copyright owner.
© Text and graphics: 2011 WWFAll rights reserved
The material and the geographical designations in this report do not imply the expression of any opinion whatsoever on the part of WWF concerning the legal status of any country, territory, or area, or concerning the delimitation of its frontiers or boundaries.
SwitzerlandTanzaniaThailandTunisiaTurkeyUgandaUnited Arab EmiratesUnited KingdomUnited States of AmericaVietnamZambiaZimbabwe
WWF WORLDWIDE NETWORk
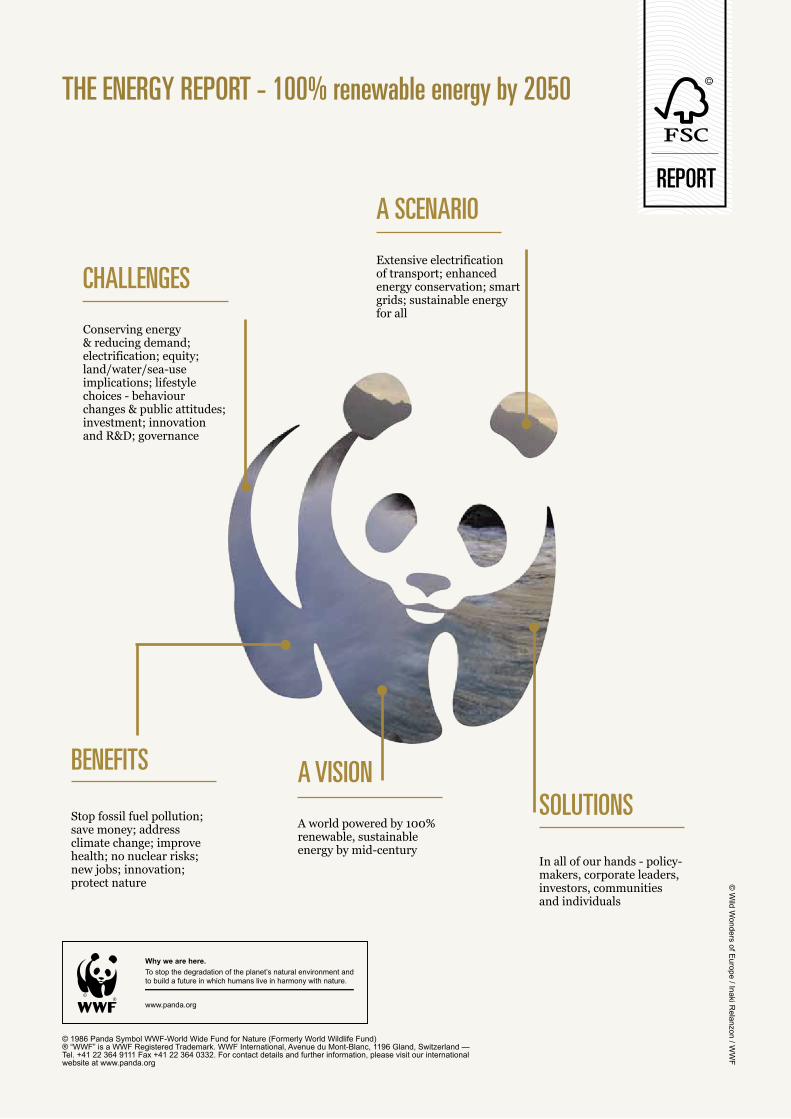
Why we are here.To stop the degradation of the planet’s natural environment andto build a future in which humans live in harmony with nature.
www.panda.org
THIS REPORT HAS BEEN PRODUCED IN COLLABORATION WITH:
REPORT
REPORTINT
2011
SOLUTIONS
In all of our hands - policy-makers, corporate leaders, investors, communities and individuals
BENEFITS
Stop fossil fuel pollution; save money; address climate change; improve health; no nuclear risks; new jobs; innovation; protect nature
A SCENARIO
Extensive electrification of transport; enhanced energy conservation; smart grids; sustainable energy for all
CHALLENGES
Conserving energy & reducing demand; electrification; equity; land/water/sea-use implications; lifestyle choices - behaviour changes & public attitudes; investment; innovation and R&D; governance
A VISION
A world powered by 100% renewable, sustainable energy by mid-century
THE ENERGY REPORT - 100% renewable energy by 2050
© 1986 Panda Symbol WWF-World Wide Fund for Nature (Formerly World Wildlife Fund)® “WWF” is a WWF Registered Trademark. WWF International, Avenue du Mont-Blanc, 1196 Gland, Switzerland — Tel. +41 22 364 9111 Fax +41 22 364 0332. For contact details and further information, please visit our international website at www.panda.org
© W
ild Wonders of E
urope / Inaki Relanzon / W
WF
Related Documents