100 200 400 300 400 Functions Writing Equations Modeling Equations Scatter Plots 300 200 400 200 100 500 100.
Dec 25, 2015
Welcome message from author
This document is posted to help you gain knowledge. Please leave a comment to let me know what you think about it! Share it to your friends and learn new things together.
Transcript


100 100
200 200
400 400
300
400
Functions Writing Equations
Modeling Equations
Scatter Plots
300 300 300
200
400
200
100
500 500 500 500
100

Row 1, Col 1
What is Graph B ?
Which is a linear function?
A. B.
C. D.

2,1
What is the Equation C?

4,2
What is non linear function?
Identify the graph as a function/non-function and as linear/nonlinear?

4,4
What is equation D?

5,1
What is this is not a function, because it crosses two points?
Is this a function? Why or why not?

1,2
What is 16, 20 and m= 2?
The data set has a constant rate of change. Find the missing numbers and identify the slope.
X 0 2 4 6 8
Y 4 8 12
2,3
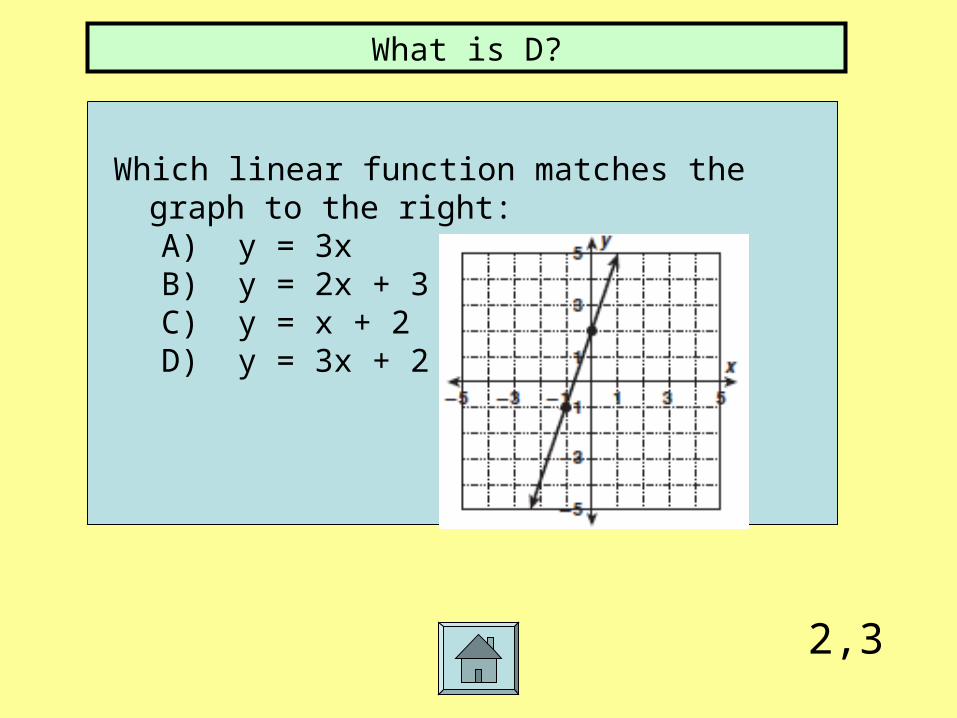
What is D?
Which linear function matches the graph to the right:A) y = 3xB) y = 2x + 3C) y = x + 2D) y = 3x + 2

3,3
What is slope = 3/1 and y-intercept is 2?
What is the slope and the y intercept of the following graph?

4,3
What is 1/-9 and y= -1/9 + 6 ?
Find the slope that passes through the points ( 9, 5 ) and ( 0, 6) and then write the equation?

2,1
What is x=2?
Write the equation of the line?
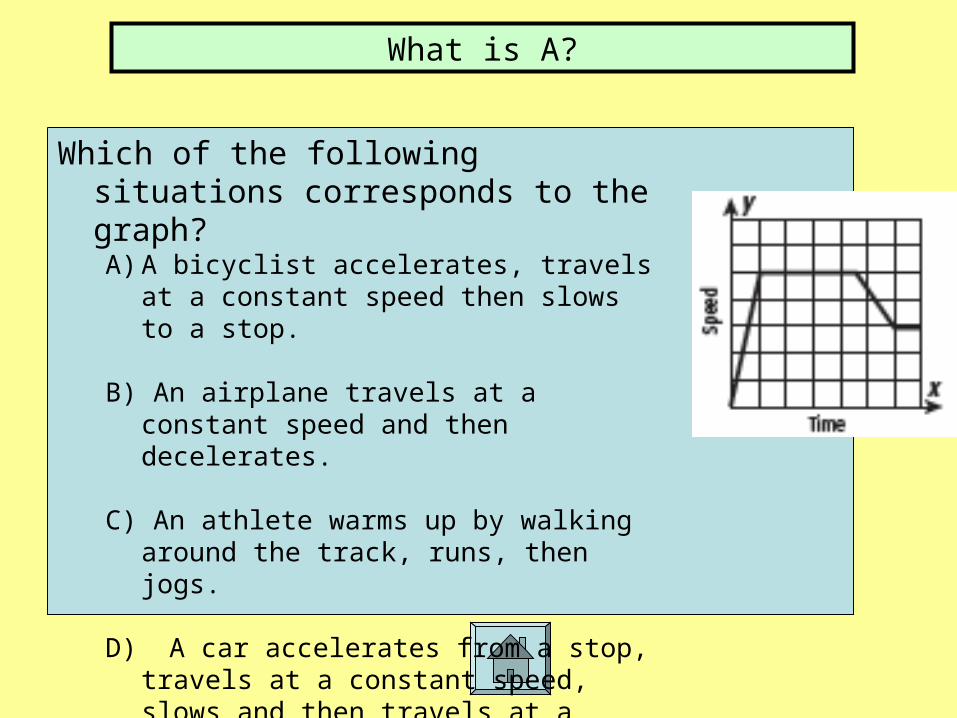
What is A?
Which of the following situations corresponds to the graph? A) A bicyclist accelerates, travels at a constant
speed then slows to a stop.
B) An airplane travels at a constant speed and then decelerates.
C) An athlete warms up by walking around the track, runs, then jogs.
D) A car accelerates from a stop, travels at a constant speed, slows and then travels at a slower speed.
1,4
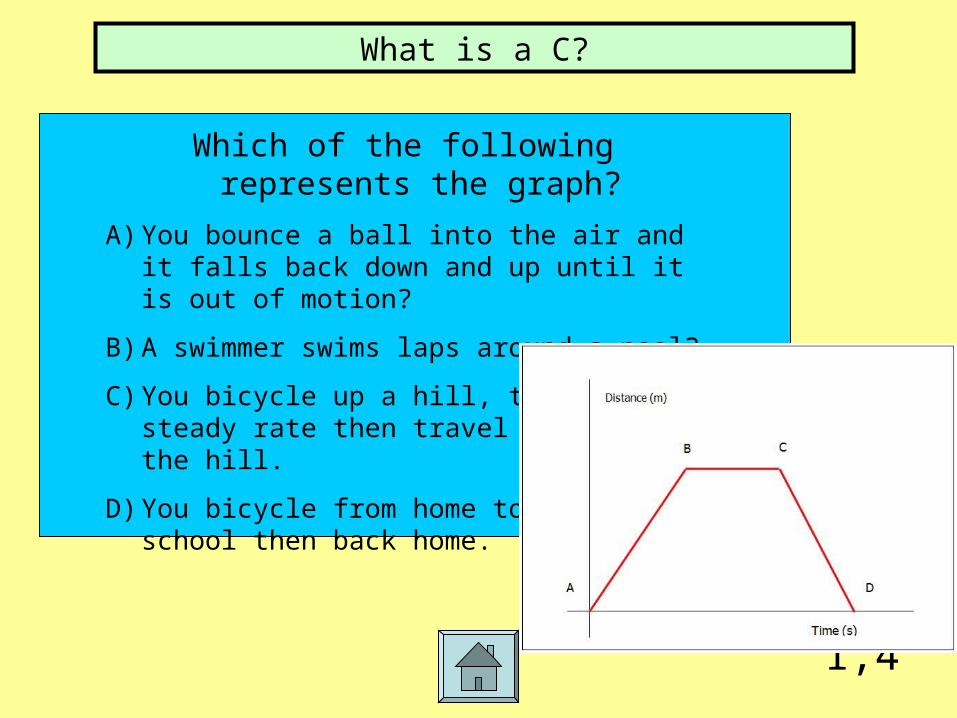
What is a C?
Which of the following represents the graph?
A) You bounce a ball into the air and it falls back down and up until it is out of motion?
B) A swimmer swims laps around a pool?
C) You bicycle up a hill, travel at a steady rate then travel back down the hill.
D) You bicycle from home to school then back home.

2,2
What is a D?
Write the equation to match the word problem.
You have 8 red marbles and 2 blue marbles, your friend gives you 3 more marbles each day. Write
an equation to represent your total marbles.
A)Y=8x +3
B) Y= 10x +3
C) Y= 3x + 6
D)Y= 3x + 10

3,2
What is C ?
You are participating in a bake sell selling cookie dough. You purchased the 50 pounds cookie dough from the store for $150. You
are selling it for $5 a pound. Write the equation to show your profit?
A.y= 5x +50
B.Y= 50x + 5
C.Y= 5x – 150
D.Y= 150x – 50

What is C?
Match the word problem to the correct table.
A.You had 55 apples and sold them for 5 a piece.
B.You had 5 dollars in your account and made 55 dollars a day.
C.You had 55 dollars saved up in your account and made and additional 7 dollars a day.
X 0 1 2 3
y 55 62 69 76

2,4
What is _10 weeks_?
Approximately how many weeks of practice must you have in order to type 100 words per minutes?
A.4B.6C.8D.10

3,4
What is a negative correlation?
What type of correlation does the graph have?

What is no corrlation?
What is the correlations?
Your hair color related to your math class?

4,1
What is B?
Make a prediction for an average test score for 4 hours of study?
A.60
B. 80
C.95
D.100
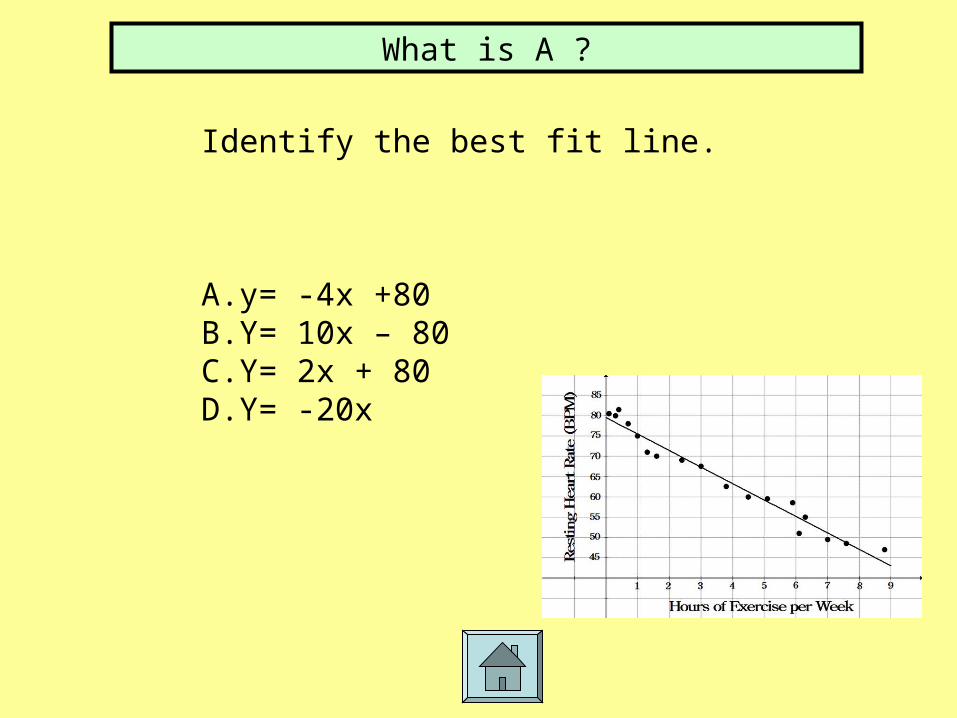
What is A ?
Identify the best fit line.
A. y= -4x +80B. Y= 10x – 80C.Y= 2x + 80 D.Y= -20x
Related Documents