University of Cyprus Biomedical Imaging and Applied Optics Biomedical Imaging and Applied Optics SERS, CARS, IR, FTIR SERS, CARS, IR, FTIR

Welcome message from author
This document is posted to help you gain knowledge. Please leave a comment to let me know what you think about it! Share it to your friends and learn new things together.
Transcript
University of CyprusBiomedical Imaging and Applied OpticsBiomedical Imaging and Applied Optics
SERS, CARS, IR, FTIRSERS, CARS, IR, FTIR
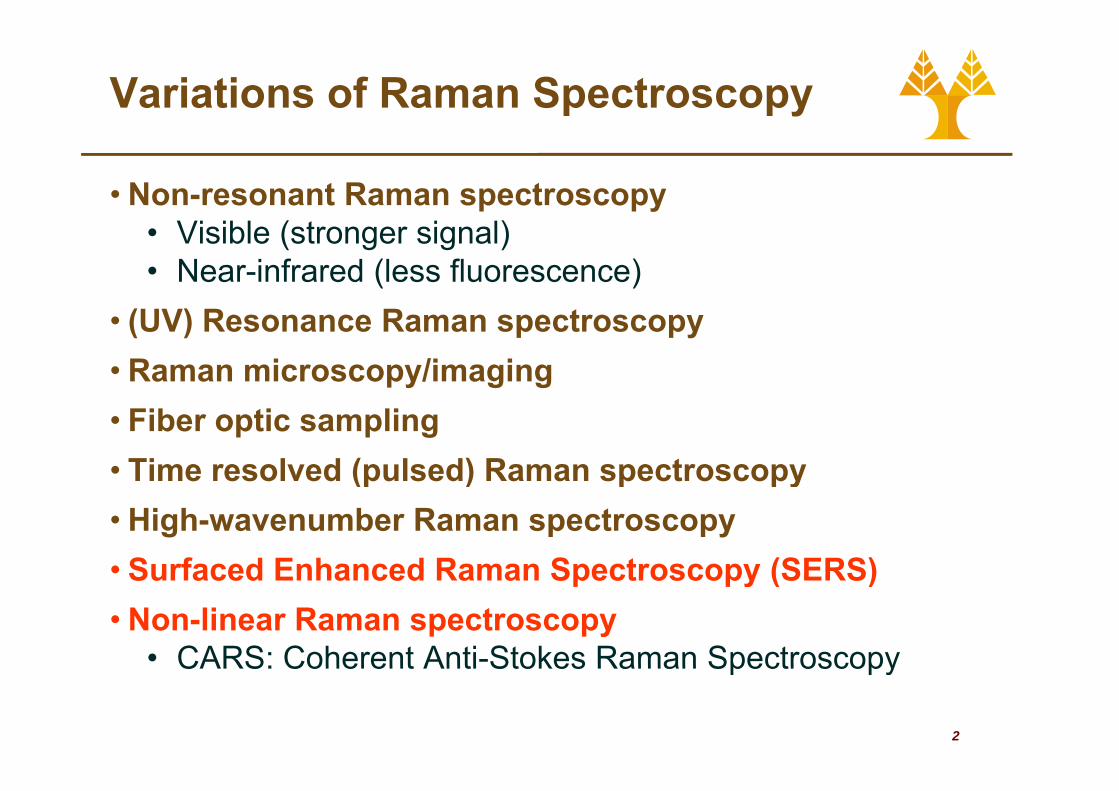
Variations of Raman Spectroscopy
• Non-resonant Raman spectroscopy• Visible (stronger signal)• Near-infrared (less fluorescence)
• (UV) Resonance Raman spectroscopy • Raman microscopy/imaging• Fiber optic sampling• Time resolved (pulsed) Raman spectroscopy(p ) p py• High-wavenumber Raman spectroscopy• Surfaced Enhanced Raman Spectroscopy (SERS)Surfaced Enhanced Raman Spectroscopy (SERS)• Non-linear Raman spectroscopy
• CARS: Coherent Anti-Stokes Raman Spectroscopy
2
CARS: Coherent Anti Stokes Raman Spectroscopy

SERS
• Raman Limitations• Raman intensity lines are
0.001% (1:10-5, at most) of the source intensity
λ1
the source intensity.
• Surface Enhanced Raman Spectroscopy (SERS) λ2>λ1Spectroscopy (SERS)
• Sample adsorbed on the surface of colloidal metal particles
• The intensity can be increased by 103 – 106(1014)increased by 10 – 10 (10 )
• Enhancement due to Surface Plasmons
3
SERS
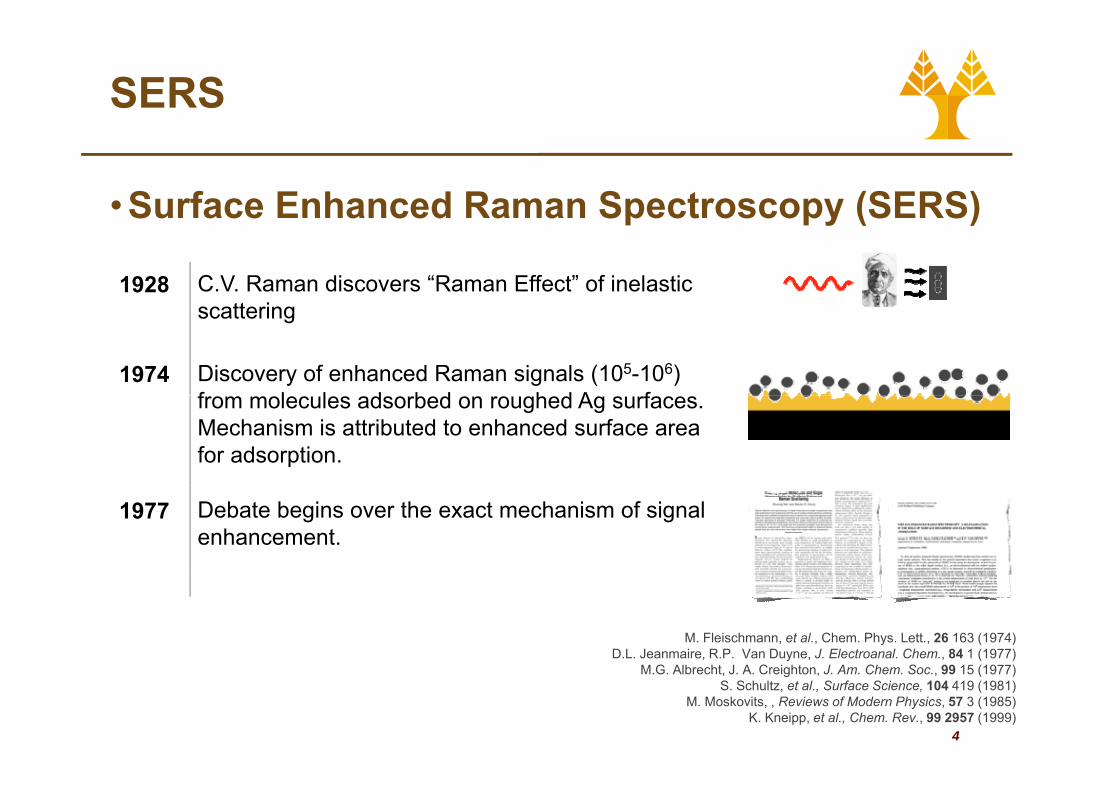
• Surface Enhanced Raman Spectroscopy (SERS)Surface Enhanced Raman Spectroscopy (SERS)
1928 C.V. Raman discovers “Raman Effect” of inelastic tt iscattering
1974 Discovery of enhanced Raman signals (105-106) f l l d b d h d A ffrom molecules adsorbed on roughed Ag surfaces.Mechanism is attributed to enhanced surface area for adsorption.
1977 Debate begins over the exact mechanism of signal enhancement.
M. Fleischmann, et al., Chem. Phys. Lett., 26 163 (1974)D.L. Jeanmaire, R.P. Van Duyne, J. Electroanal. Chem., 84 1 (1977)
M G Alb ht J A C i ht J A Ch S 99 15 (1977)
4
M.G. Albrecht, J. A. Creighton, J. Am. Chem. Soc., 99 15 (1977)S. Schultz, et al., Surface Science, 104 419 (1981)
M. Moskovits, , Reviews of Modern Physics, 57 3 (1985)K. Kneipp, et al., Chem. Rev., 99 2957 (1999)
SERS
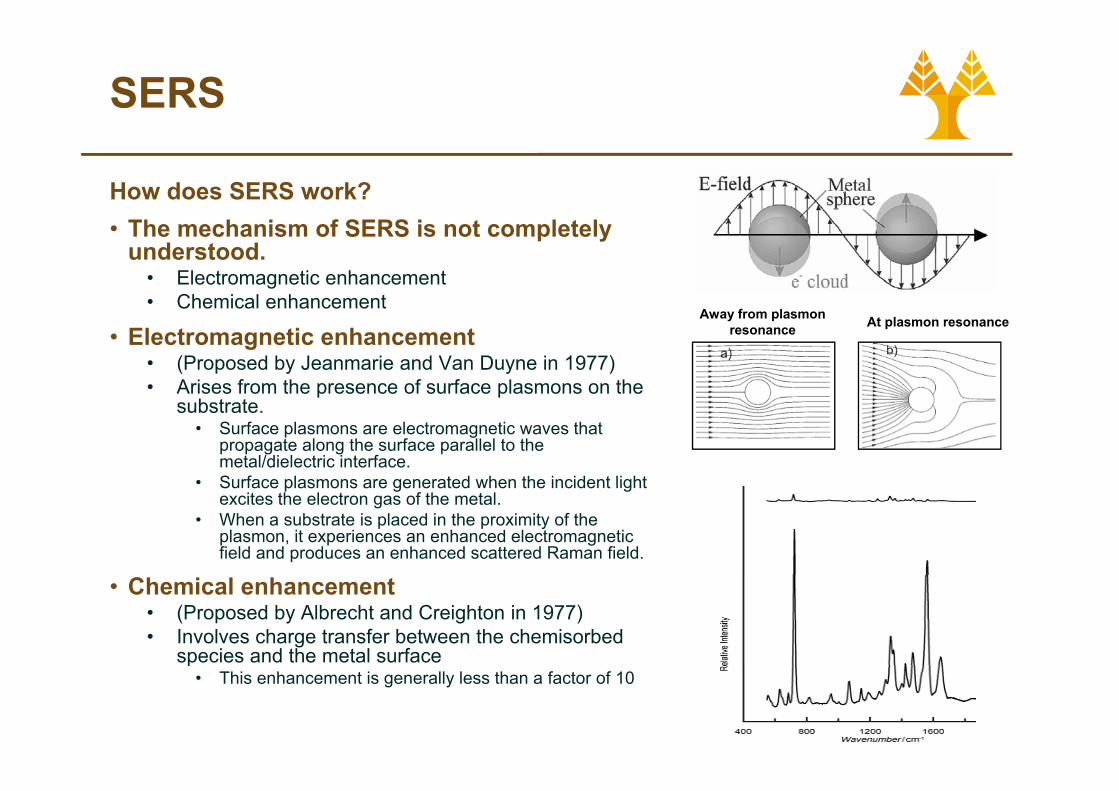
How does SERS work?• The mechanism of SERS is not completely
understood.• Electromagnetic enhancement • Chemical enhancementChemical enhancement
• Electromagnetic enhancement • (Proposed by Jeanmarie and Van Duyne in 1977)• Arises from the presence of surface plasmons on the
Away from plasmonresonance At plasmon resonance
p psubstrate.
• Surface plasmons are electromagnetic waves that propagate along the surface parallel to the metal/dielectric interface.
• Surface plasmons are generated when the incident lightSurface plasmons are generated when the incident light excites the electron gas of the metal.
• When a substrate is placed in the proximity of the plasmon, it experiences an enhanced electromagnetic field and produces an enhanced scattered Raman field.
• Chemical enhancement• (Proposed by Albrecht and Creighton in 1977)• Involves charge transfer between the chemisorbed
species and the metal surface
5
p• This enhancement is generally less than a factor of 10
SERS
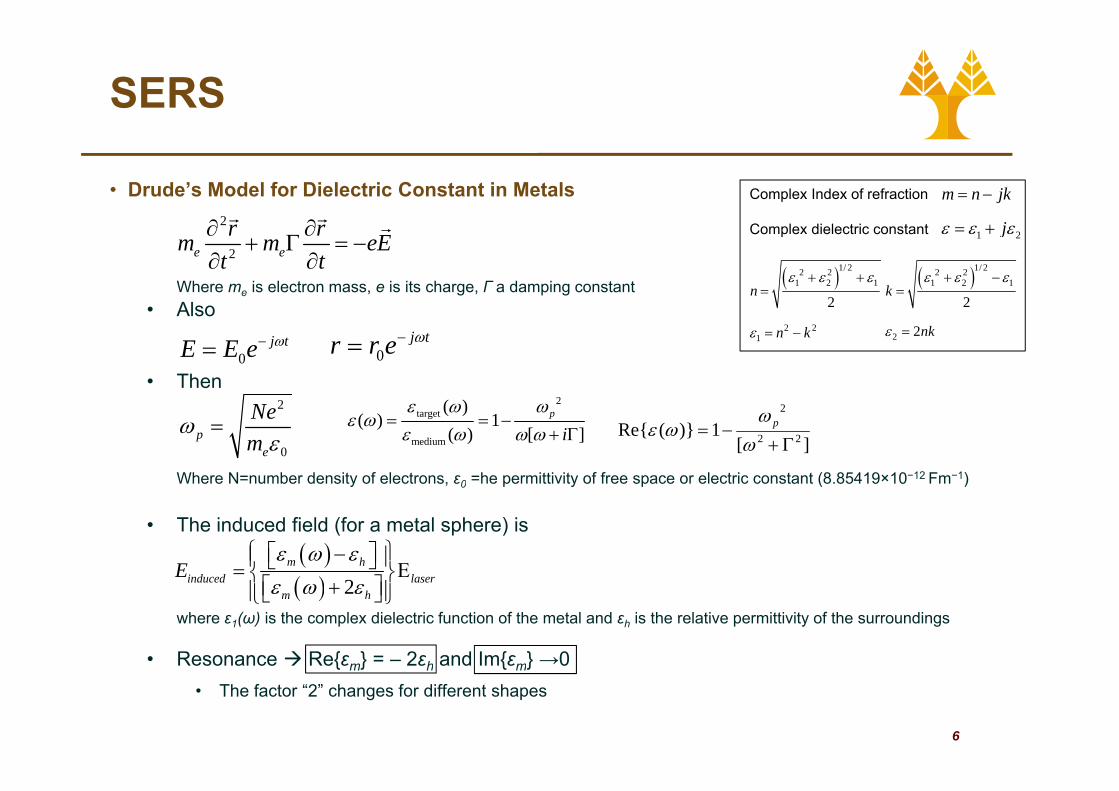
• Drude’s Model for Dielectric Constant in Metals2
m n jk= −Complex Index of refraction
Where me is electron mass, e is its charge, Г a damping constantAlso
2
2e er rm m eE
t t∂ ∂
+ Γ = −∂ ∂
Complex dielectric constant 1 2jε ε ε= +
( )1/ 22 21 2 1
2n
ε ε ε+ +=
( )1/ 22 21 2 1
2k
ε ε ε+ −=
• Also
• Then0
j tE E e ω−= 0j tr r e ω−=
2 22 2
1 n kε = − 2 2nkε =
Where N=number density of electrons, ε0 =he permittivity of free space or electric constant (8.85419×10⁻¹² Fm−1)
2target
medium
( )( ) 1
( ) [ ]p
iε ω ω
ε ωε ω ω ω
= = −+ Γ ][
1)}(Re{ 22
2
Γ+−=ωω
ωε p2
0p
e
Nem
ωε
=
y , 0 p y p ( )
• The induced field (for a metal sphere) is( )m h
i d d lEε ω ε⎧ ⎫−⎡ ⎤⎪ ⎪⎣ ⎦= Ε⎨ ⎬
⎡ ⎤where ε1(ω) is the complex dielectric function of the metal and εh is the relative permittivity of the surroundings
• Resonance Re{εm} = – 2εh and Im{εm} →0
( ) 2induced laserm h
Eε ω ε
Ε⎨ ⎬+⎡ ⎤⎪ ⎪⎣ ⎦⎩ ⎭
6
Resonance Re{εm} 2εh and Im{εm} 0• The factor “2” changes for different shapes

SERS
• SERS substrates commonly usedSilver (Ag) gold (Au) and copper• Silver (Ag), gold (Au) and copper (Cu)
• The energy required to generate plasmons matches the light p gsources typically used in Raman spectroscopy
• Metal nanoparticles• Spheres• Rods• Nanoshells
• Surface preparations• Chemically etched• Nano lithography, • Electron beam lithography• Imprint• Largest enhancements for rough
7
g gsurfaces of 10 – 100 nm
SERS
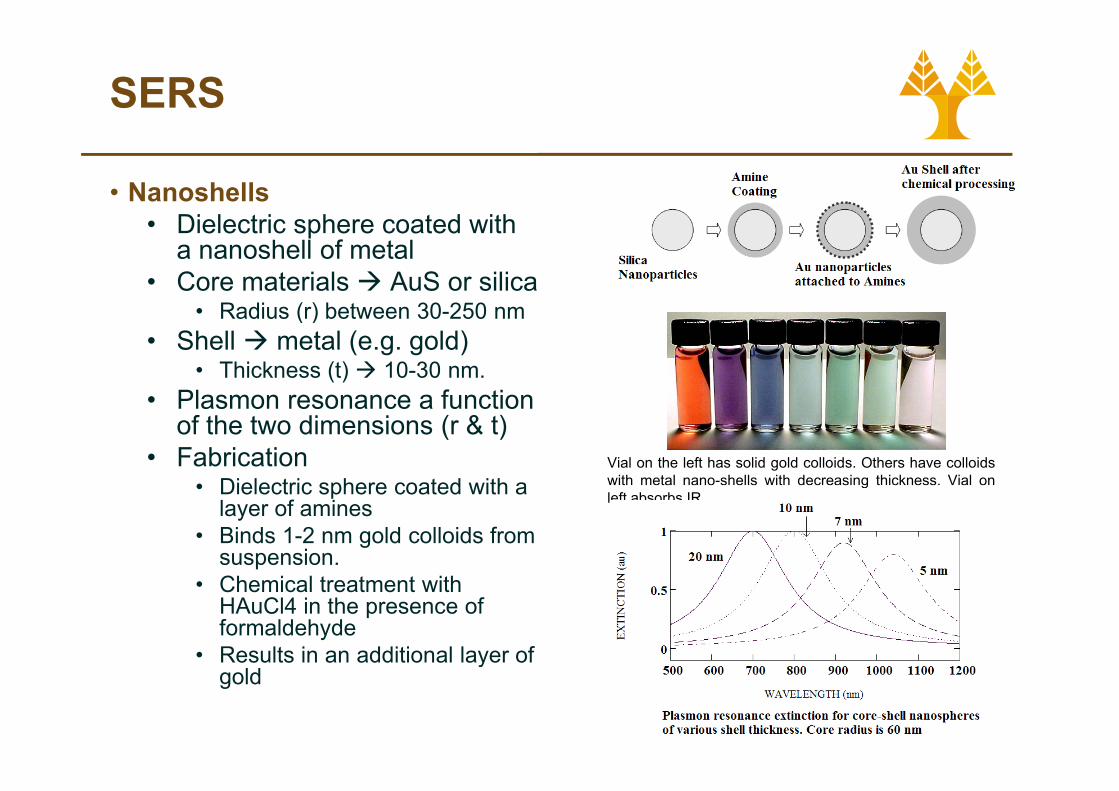
• NanoshellsDi l t i h t d ith• Dielectric sphere coated with a nanoshell of metal
• Core materials AuS or silicaR di ( ) b t 30 250• Radius (r) between 30-250 nm
• Shell metal (e.g. gold)• Thickness (t) 10-30 nm.
Plasmon resonance a function• Plasmon resonance a function of the two dimensions (r & t)
• Fabrication• Dielectric sphere coated with a
Vial on the left has solid gold colloids. Others have colloidswith metal nano-shells with decreasing thickness. Vial on• Dielectric sphere coated with a
layer of amines • Binds 1-2 nm gold colloids from
suspension.
gleft absorbs IR
• Chemical treatment with HAuCl4 in the presence of formaldehyde
• Results in an additional layer of
8
ygold
SERS
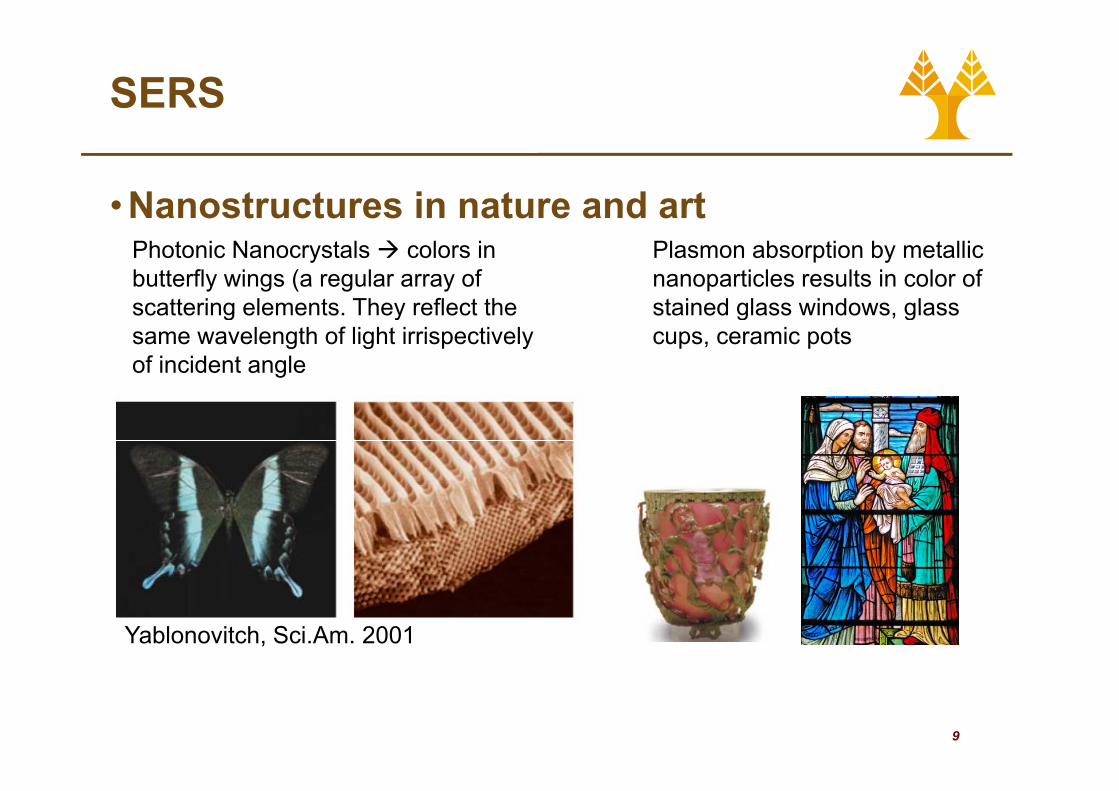
• Nanostructures in nature and artNanostructures in nature and artPhotonic Nanocrystals colors in butterfly wings (a regular array of scattering elements They reflect the
Plasmon absorption by metallic nanoparticles results in color of stained glass windows glassscattering elements. They reflect the
same wavelength of light irrispectivelyof incident angle
stained glass windows, glass cups, ceramic pots
Yablonovitch, Sci.Am. 2001
9

SERS
• Why use SERS?Hi h iti it d S ifi it• High sensitivity and Specificity
• Low-power lasers and low magnification optics are suitable to acquire SERS spectra in very short acquisition times (typical ~10 s)(typical ~10 s).
• Many applications• Molecular fingerprinting
• Unique vibrational spectra distinguishes molecules• Tagless biosensing
• Fluorescent dyes are not needed• Multiplexed sensing
• Plasmon resonances allow for sensor tunability• In vivo applicability
1500 cm-1 1532cm-1
• Near-IR excitation and biocompatability• Femtomolar and beyond
• Single molecule spectroscopy is possible 1600cm-1 1635cm-1
10
• Nanoprobes can be multimodal

SERS
• Cancer imaging with SERS• Nanoparticles attached to a tumour-seeking antibody or peptide• Tracked as they move around the body
11
SERS
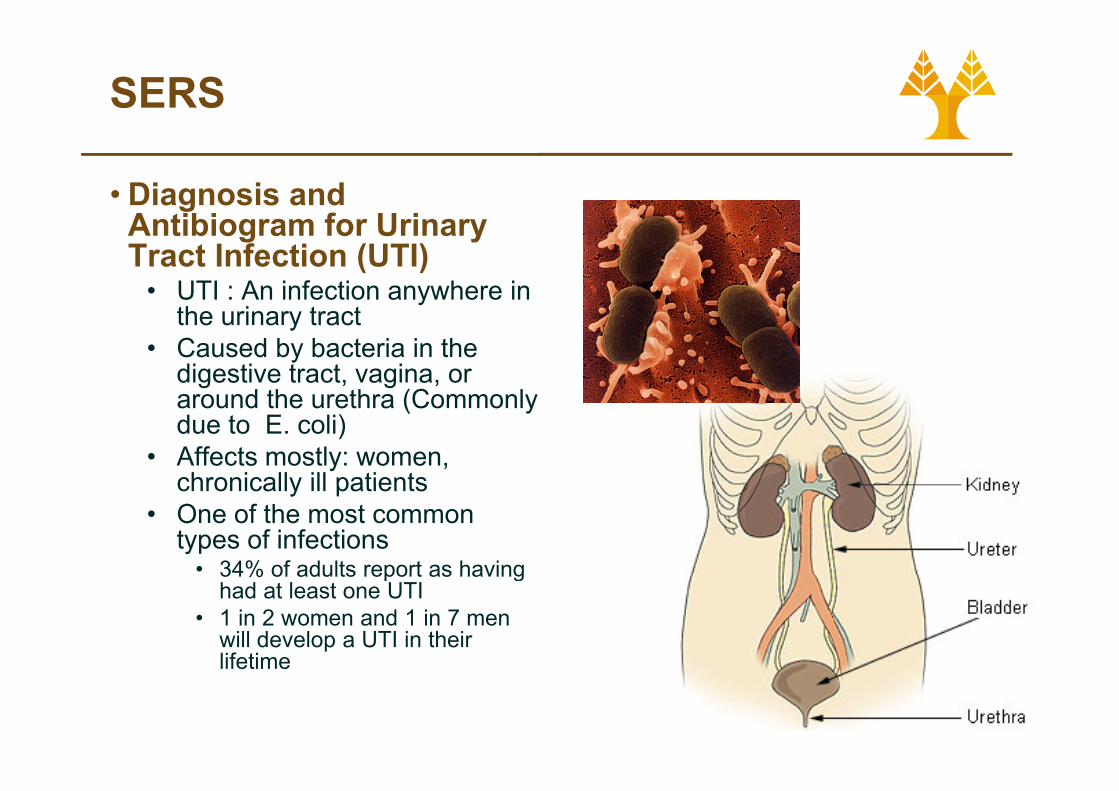
• Diagnosis and A tibi f U iAntibiogram for Urinary Tract Infection (UTI)
• UTI : An infection anywhere in the urinary tract
• Caused by bacteria in the digestive tract, vagina, or around the urethra (Commonlyaround the urethra (Commonly due to E. coli)
• Affects mostly: women, chronically ill patientschronically ill patients
• One of the most common types of infections
• 34% of adults report as having34% of adults report as having had at least one UTI
• 1 in 2 women and 1 in 7 men will develop a UTI in their lifetime
12
lifetime

SERS
• Diagnosis andDiagnosis and Antibiogram for Urinary Tract InfectionUrinary Tract Infection (UTI)
• Identification of bacteriaIdentification of bacteria with cultures: 24h
• Specific antibiotic can be pdetermined after antibiogram: another 24 h
13

SERS
• Complete urinary tract i f ti (UTI)infection (UTI) diagnosis and antibiogram using SERSantibiogram using SERS
1. Identification of positive and negative samples for UTIUTI
2. Classification of causative bacteria
3 Determination of antibiotic3. Determination of antibiotic sensitivity
• AdvantagesAdvantages• Minimal sample preparation• Inexpensive
R id
14
• Rapid

SERS
• Complete urinary tract i f ti (UTI)infection (UTI) diagnosis and antibiogram using SERSantibiogram using SERS
• Bacterial isolates from patients with UTI (n=50)
• E coli Klebsiella p• E. coli, Klebsiella p., Proteus spp., Enterococcusspp., Citrobacter spp.
• SERS: S S• 785 nm laser• 180 mW power• 4.5 cm-1 resolution4.5 cm 1 resolution• Data acquisition: 20s x 30 • Raman spectra collected
with gold NP
15
g
SERS
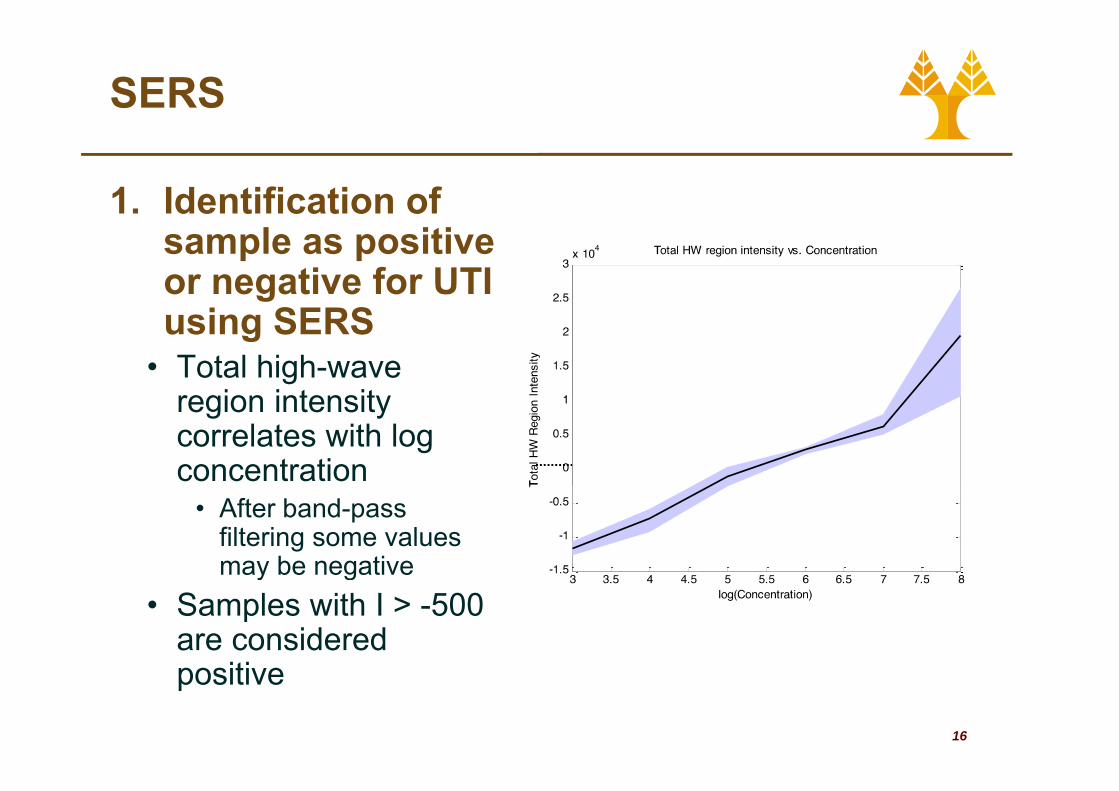
1. Identification of sample as positive or negative for UTI using SERS
• Total high-wave region intensityregion intensity correlates with log concentration
• After band-pass filtering some values may be negativey g
• Samples with I > -500 are considered
iti
16
positive
SERS
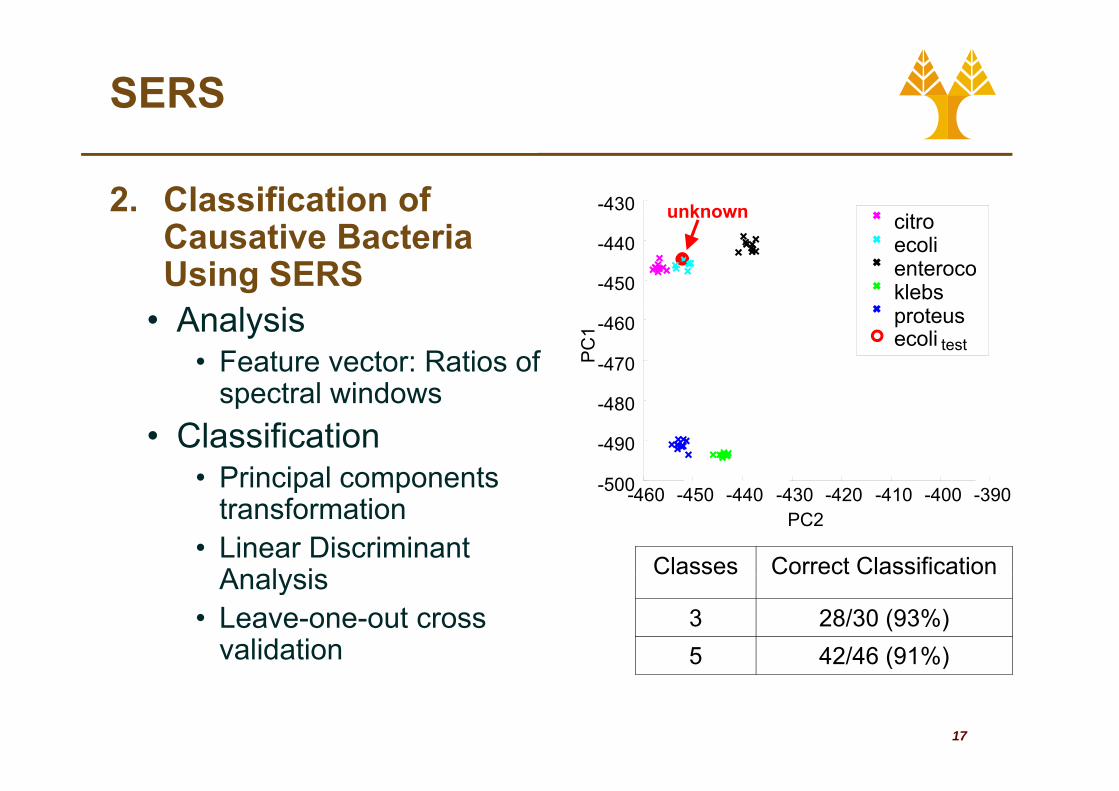
2. Classification of unknown-430itCausative Bacteria
Using SERS
unknown
-450
-440citroecolienterocoklebs
• Analysis• Feature vector: Ratios of
spectral windows
PC1
-470
-460 proteusecoli test
spectral windows• Classification
• Principal components -500
-490
-480
Classes Correct Classification
Principal components transformation
• Linear DiscriminantAnalysis
PC2-460 -450 -440 -430 -420 -410 -400 -390-500
3 28/30 (93%)5 42/46 (91%)
Analysis• Leave-one-out cross
validation
17
( )
SERS
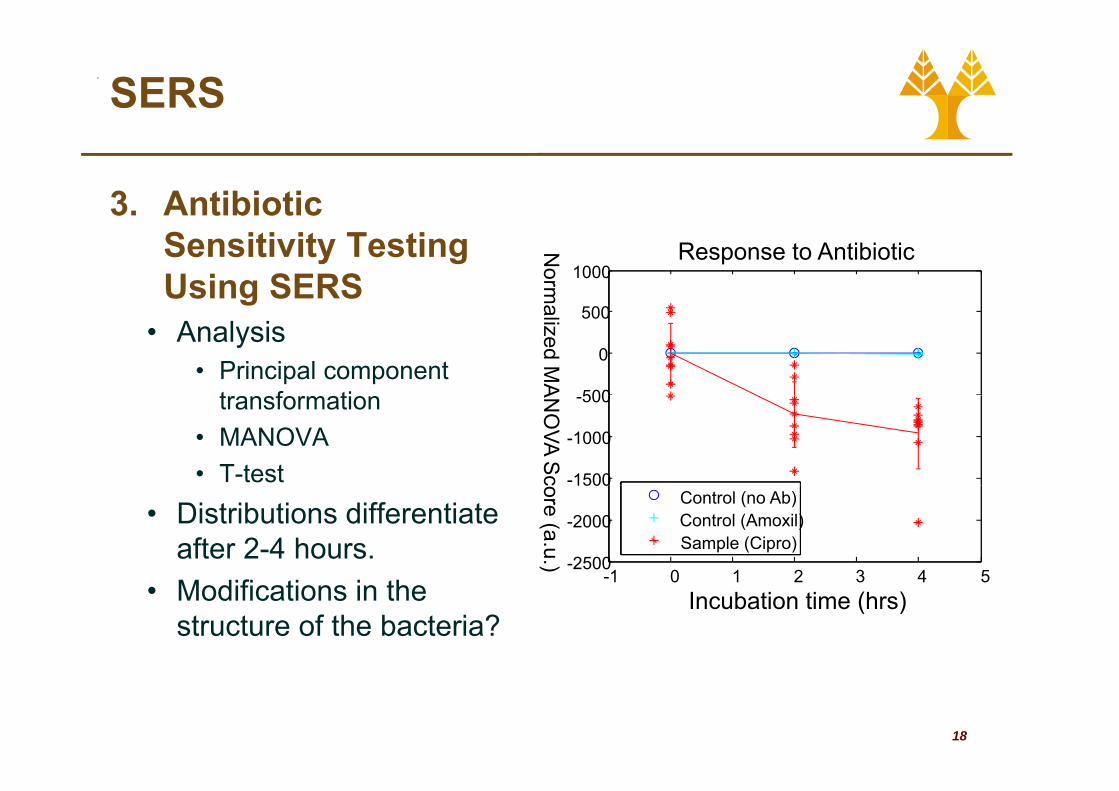
3. Antibiotic
1000
Norm
a
Response to AntibioticSensitivity Testing Using SERS
500
0
500
alized MA
• Analysis• Principal component
t f ti
-1500
-1000
-500
AN
OVA S
c
transformation• MANOVA• T-test
1 0 1 2 3 4 5-2500
-2000
1500core (a.u.)
Control (no Ab)Control (Amoxil)Sample (Cipro)
• Distributions differentiate after 2-4 hours.
-1 0 1 2 3 4 5Incubation time (hrs)• Modifications in the
structure of the bacteria?
18
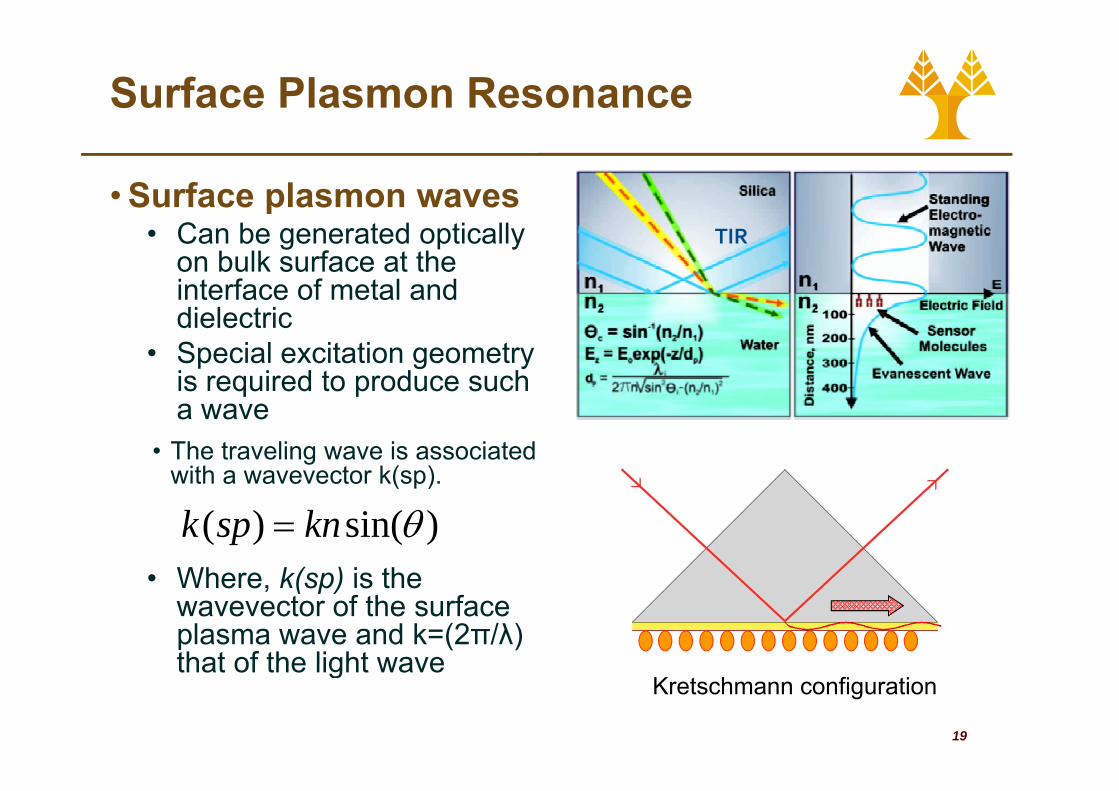
Surface Plasmon Resonance
• Surface plasmon waves • Can be generated optically
on bulk surface at the interface of metal and
TIR
dielectric• Special excitation geometry
is required to produce such q pa wave
• The traveling wave is associated with a wavevector k(sp). ( p)
• Where k(sp) is the
)sin()( θknspk =• Where, k(sp) is the
wavevector of the surface plasma wave and k=(2π/λ) that of the light wave
19
that of the light waveKretschmann configuration

Surface Plasmon Resonance
• Typical TIRF SSensogram
• Advantages• High Signal to noise
ratio (very little secondary emission f b lk l ti )from bulk solution)
• Highly robust, low cost, portable
• Drawbacks• Need for labels• High cross-reactivity
(hence not easy to multiplex)
20http://www.tirftechnologies.com/principles.php
TIRFEpifluorescence

CARS
• Coherent Anti-Stokes Raman Spectroscopy (CARS)
• Non linear Raman processG t d t th f f• Generated at the focus of the beam
• ωAS = 2ωp – ωs
• Signal is coherentg
sp III 2)(∝*2)3(spas EEP χ=
21“CARS Microscopy for Biology and Medicine” E. Potma & X. S. XieOptics and Photonics News 40 November (2004)

CARS
• CARS Microscopypy• Two lasers at
different frequenciesq• ps or fs pulse trains
with high peak g pIntensity
• Two beams spatially p yoverlapped at focii
• Two beams temporally overlapped
22“CARS Microscopy for Biology and Medicine” E. Potma & X. S. XieOptics and Photonics News 40 November (2004)

CARS
• AdvantagesI t i i ib ti l t t• Intrinsic vibrational contrast
• Strong, directional signal Sensitive• Requires moderate average powers good for biological samples• Only generated at focus 3D sectioning capability • Higher in frequency than one-photon fluorescence easily detected
in presence of a strong fluorescent background. • Near IR
• Little scattering deep penetration in tissues• Little absorption Low photodamage
• Disadvantages• Non resonant background from bulk very strong• Expensive laser sourcesExpensive laser sources• Have to know beforehand the vibrational band of interest• Currently limited tunability of sources – improving in line with the laser
sources….
23
sources….

CARS
• ApplicationsApplications• Sensitive probe for lipids• Lipid bilayer thin objectsLipid bilayer, thin objects,
small objects• Fast dynamic scanning ast dy a c sca g
of processes in living cells
• In vivo capabilites
24“CARS Microscopy for Biology and Medicine” E. Potma & X. S. XieOptics and Photonics News 40 November (2004)

CARS
Images of a hairless mouse ear Chemical imaging of tissue in vivo with video-rate coherent anti-Stokes Raman scattering microscopy C. Evans et al. Proc. Natl. Acad. Sci. 102 (46) 16807 (2005)( ) ( )
Stratum corneum with brightSebaceous glands at ~30 Individual cells of the Adipocytes of the dermis atStratum corneum with bright
signals from the lamellar lipid intercellular space that surrounds the polygonal corneocytes. Bright
g
μm from skin surface.Individual cells of the gland compartment can be recognized, with nuclei visible as dark holes (arrow).
Adipocytes of the dermis at
~60 μm from skin surface.
punctuated dots are ducts of sebaceous glands.
2D projection of 60 depth-resolved slices separated by 2 μm. Panels to the right
d d F h thand under F show the yzand xz cross sections taken at the white lines, respectively.
25
Adipocytes of the subcutaneous layer at a
depth of ~100 μm.

Photo-Molecular Interactions
3
22
1
0n11
2
1
Ene
rgy 1
0n’1
ΔE=hνR
2
1
0
26
Auto- IR Rayleigh Stokes Anti-Stokes NIRFluorescence Absorption Scattering Raman Scattering Fluorescence
n0

Infrared Absorption
• IRA b ti ( R hi h i tt i )• An absorptive process (vs. Raman which is a scattering process)
• Directly interrogates molecular vibrations
27

Infrared Absorption
• IR and Raman are complementary techniquesSymmetric molecules with a center of inversion have vibrations which are• Symmetric molecules with a center of inversion have vibrations which are either Raman or IR active, but not both (e.g. benzene)
• Molecules with no symmetry are active in both methods
(N)IR absorption RamanAbsorption Scattering
Requires change in dipole moment(No symmetric stretches observed, No diatomic activity)
Requires a change in polarizabilitywith vibrational motion
O OOnly observed in NIR and IR spectral regions
Occurs at all wavelengths
Strong signal Weak signal
High water absorption Water not a problem
Broad spectral features Sharp spectral features for molecular fingerprinting
28
g p gRequires some sample preparation in most cases
Does not require sample preparation

Infrared Absorption
29www.kosi.com

FTIR
• Fourier Transform Infrared (FTIR) Ab ti Michelson
M i(FTIR) Absorption• Interferometric (instead of
spectrograph-based) t
Interferometer Moving Mirror
measurement• Interferometer
• An optical Fourier Transform on the emitted lightthe emitted light
• Modulates light emitted an interferogram which has all IR frequencies encoded into it
Ad t
Detector
• Advantages• The whole infrared spectrum is
measured at high speed • Spectral range is continuously
Interferogram
Spectral range is continuously calibrated with HeNe laser
• Fast, extremely accurate measurements
Mi h l I t f t OCTIR Spectrum
FourierTransforma-tion
30
• Michelson Interferometer OCT lecture
Related Documents

![Recent Progress on Liquid Biopsy Analysis using Surface ... · biomedical applications of SERS: labelfree detection - and indirect detection using SERS tags [20]. In label-free SERS](https://static.cupdf.com/doc/110x72/5f48e596b982e00d4625f82d/recent-progress-on-liquid-biopsy-analysis-using-surface-biomedical-applications.jpg)