1 10 pt 15 pt 20 pt 25 pt 5 pt 10 pt 15 pt 20 pt 25 pt 5 pt 10 pt 15 pt 20 pt 25 pt 5 pt 10 pt 15 pt 20 pt 25 pt 5 pt 10 pt 15 pt 20 pt 25 pt 5 pt VOCAB. GRAPHS RANGE MEDIAN AND MODE MORE VOCAB!

10 pt
Dec 31, 2015
VOCAB. GRAPHS. RANGE. MEDIAN AND MODE. MORE VOCAB!. 5 pt. 5 pt. 5 pt. 5 pt. 5 pt. 10 pt. 10 pt. 10 pt. 10 pt. 10 pt. 15 pt. 15 pt. 15 pt. 15 pt. 15 pt. 20 pt. 20 pt. 20 pt. 20 pt. 20 pt. 25 pt. 25 pt. 25 pt. 25 pt. 25 pt. WHAT IS A PICTOGRAPH?. - PowerPoint PPT Presentation
Welcome message from author
This document is posted to help you gain knowledge. Please leave a comment to let me know what you think about it! Share it to your friends and learn new things together.
Transcript

1
10 pt
15 pt
20 pt
25 pt
5 pt
10 pt
15 pt
20 pt
25 pt
5 pt
10 pt
15 pt
20 pt
25 pt
5 pt
10 pt
15 pt
20 pt
25 pt
5 pt
10 pt
15 pt
20 pt
25 pt
5 pt
VOCAB. GRAPHS RANGEMEDIAN
AND MODEMORE
VOCAB!

2
WHAT IS A PICTOGRAPH?

3
A PICTOGRAPH USES PICTURES
OR SYMBOLS TO SHOW DATA.

4
WHAT IS A BAR GRAPH?

5
A BAR GRAPH USES VERTICAL
OR HORIZONTAL
BARS TO SHOW DATA.

6
WHAT IS A LINE PLOT?

7
A LINE PLOT USES A LINE PLOT USES SYMBOLS ABOVE SYMBOLS ABOVE A NUMBER LINE A NUMBER LINE TO SHOW DATA.TO SHOW DATA.

8
WHAT ARE COORDINATES?

9
ORDERED NUMBER PAIR
USED IN GRAPHING.

10
WHAT IS SCALE?

11
THE MARKED INTERVALS
ON A GRAPH.

12
What type of graph is this?
13
Bar graph!!!

14
Name the following graph.

15
Line graph.

16
Name the type of graph that uses pictures!

17
PictographPictograph

18
What are stems? What are
leaves?NOT THESE!

19
Stems = tensStems = tens
Leaves= onesLeaves= ones
20
If you wanted to graph the trend in weather
for the month of September. Which
graph would be best?

21
Line graph!

22
WHAT IS THE RANGE OF THESE
NUMBERS?
4, 5, 5, 5, 7, 7, 7, 99, 99, 78, 78, 56

23
95

24
Define range.

25
Range is the difference between the greatest number and the least
number.

26
Find the range in the following data.
3, 4, 8, 7, 8, 2, 1, 10, 11, 3, 5, 6, 3

27
1010

28
Find the range in the following data.2, 4, 6, 7, 4, 26, 78, 3, 5, 89, 4, 6, 9, 11,
12, 14, 54, 4, 5, 7,

29
87

30
Find the range.67, 68, 98, 34, 66, 33, 10, 78, 324, 64,
98, 11

31
314

32
What is the median for the following.
2, 2, 3, 4, 5, 5, 6, 7, 7, 8, 8, 9, 9, 9, 9,

33
7
34
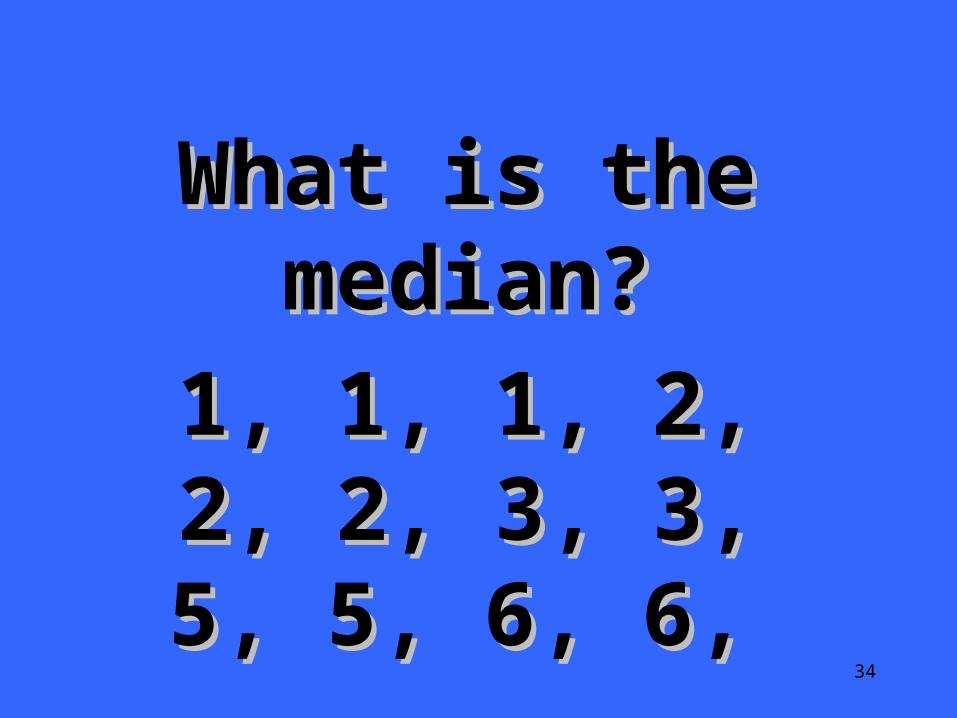
What is the What is the median?median?
1, 1, 1, 2, 2, 2, 3, 1, 1, 1, 2, 2, 2, 3, 3, 5, 5, 6, 6,3, 5, 5, 6, 6,
35
2.5

36
What is the mode?
1, 1, 1, 1, 2, 2, 2, 4, 4, 4, 5, 5, 5, 6, 6, 6, 6, 6, 6, 7, 7, 8, 8, 8, 8, 8, 8, 8, 9,
37
88

38
What is the mode?
12, 12, 12, 12, 14, 14, 15, 15, 15, 15, 17, 17, 17, 17, 17, 17, 17, 17, 17, 18, 18, 18, 18, 18, 18, 18, 18, 18,
18, 18, 19, 19

39
18

40
True or false- mode means the difference between the largest
and smallest number.

41
FalseFalse -it is the number that occurs
most in a set of data.

42
WHAT WHAT IS A IS A
LINE LINE GRAPH?GRAPH?

43
A GRAPH THAT A GRAPH THAT SHOWS SHOWS
INCREASES OR INCREASES OR DECREASES DECREASES OVER TIME.OVER TIME.

44
WHAT IS WHAT IS AN AN
INTERVAL?INTERVAL?

45
THE FIXED DISTANCE
BETWEEN THE NUMBERS ON THE
SCALE OF A GRAPH.

46
WHAT IS A WHAT IS A VERTICAL VERTICAL
AXIS?AXIS?

47
THE UP-AND-DOWN LINE
ON A GRAPH.

48
WHAT IS A HORIZONTAL
AXIS?

49
LEFT-TO-RIGHT NUMBER LINE ON A
GRAPH.
50
WHAT IS A STEM –AND- LEAF PLOT?

51
A GRAPH USED FOR
ORGANIZING DATA.
Related Documents