10 kHz repetitive high-resolution TV Thomson scattering on TEXTOR: Design and performance „invited… H. J. van der Meiden, S. K. Varshney, C. J. Barth, T. Oyevaar, R. Jaspers, and A. J. H. Donné a FOM-Institute for Plasma Physics Rijnhuizen, b,c Association EURATOM-FOM, P.O. Box 1207, 3430 BE Nieuwegein, The Netherlands M. Yu. Kantor and D. V. Kouprienko Ioffe Institute, RAS, Saint Petersburg 194021, Russia E. Uzgel, W. Biel, A. Pospieszczyk, and TEXTOR Team Institut für Plasmaphysik, Forschungszentrum Jülich, c EURATOM Association, D-52425 Jülich, Germany Received 2 May 2006; presented on 8 May 2006; accepted 11 June 2006; published online 4 October 2006 In late 2003 a 10 kHz multiposition Thomson scattering diagnostic with high spatial resolution became operational on the TEXTOR tokamak. In the initial phase of operation, one burst of 18 pulses of 12 J each with a repetition rate of 5 kHz could be extracted from the laser system. The installation of a low-dope ruby rod spring 2005 resulted in a system, which can deliver higher pulse energy and moreover a divergence of better than 0.7 mrad, leading to a big improvement in the detection of Thomson scattering photons. Furthermore, the number of laser pulses in one burst could be extended to even more than 30. The achieved laser energy of more than 15 J/pulse makes it possible to measure electron temperature and density profiles with an observational error of 8% on the electron temperature T e and 4% on the electron density n e at n e = 2.5 10 19 m -3 , per spatial element of 7.5 mm. The viewing optics enables sampling of either the full plasma diameter of 900 mm with 120 spatial channels of 7.5 mm each or a 160 mm long edge chord with 98 spatial channels of 1.7 mm each. The system, which has recently become available for physics exploration, has already been used to study the structure of m = 2 magnetic islands and the response of the plasma to off-axis electron cyclotron resonance heating. © 2006 American Institute of Physics. DOI: 10.1063/1.2219434 I. INTRODUCTION The development of TV-like detectors paved the way to the design of a relatively simple and smart setup to measure simultaneously the electron temperature T e and density n e in plasmas at many positions along a laser chord, using a single laser pulse. The multiposition Thomson scattering TS system based on such a TV-like detector was built for Princeton Large Tokamak in 1978. 1 The development of TV Thomson scattering TVTS systems got a new impulse in 1994 by the introduction of a high-resolution TVTS system on the Rijnhuizen Tokamak Project. 2 Double-pulse versions of this system were installed on the TJ-II stellarator 3 and the TEXTOR tokamak. 4 The double-pulse TVTS system at the TEXTOR toka- mak R 0 =1.75 m, a =0.46 m, B 0 2.9 T, and I p 0.8 MA operated successfully from 2000 until 2001. This TS system was based on a double-pulse ruby laser 2 12 J and two intensified charge coupled device CCD cameras for record- ing the scattered light. It was capable of measuring two T e and n e profiles during one discharge along a vertical chord of 900 mm length at R =1.84 m with 120 spatial channels of 7.5 mm each. To study the dynamics of mesoscale structures like mag- netohydrodynamic MHD islands and internal transport bar- riers in hot plasmas, one needs a repetitive system with a time resolution of 1 ms. Therefore, a TS system is devel- oped. It consists of a repetitive laser and a fast detection system. The Ioffe Institute in St. Petersburg and MultiTech a Electronic mail: [email protected] b URL: http//www.rijnh.nl c Partners in the Trilateral Euregio Cluster. FIG. 1. Schematic overview of the TEXTOR TVTS system with intracavity ruby laser. The collected scattered light is relayed to a Littrow spectrometer giving a two-dimensional 2D image , z, which is projected onto the cathode of a TV-like detector. REVIEW OF SCIENTIFIC INSTRUMENTS 77, 10E512 2006 0034-6748/2006/7710/10E512/8/$23.00 © 2006 American Institute of Physics 77, 10E512-1 Downloaded 02 Jan 2007 to 134.94.122.39. Redistribution subject to AIP license or copyright, see http://rsi.aip.org/rsi/copyright.jsp

Welcome message from author
This document is posted to help you gain knowledge. Please leave a comment to let me know what you think about it! Share it to your friends and learn new things together.
Transcript
10 kHz repetitive high-resolution TV Thomson scattering on TEXTOR:Design and performance „invited…
H. J. van der Meiden, S. K. Varshney, C. J. Barth, T. Oyevaar,R. Jaspers, and A. J. H. Donnéa�
FOM-Institute for Plasma Physics Rijnhuizen,b�, c� Association EURATOM-FOM, P.O. Box 1207,3430 BE Nieuwegein, The Netherlands
M. Yu. Kantor and D. V. KouprienkoIoffe Institute, RAS, Saint Petersburg 194021, Russia
E. Uzgel, W. Biel, A. Pospieszczyk, and TEXTOR TeamInstitut für Plasmaphysik, Forschungszentrum Jülich,c� EURATOM Association, D-52425 Jülich, Germany
�Received 2 May 2006; presented on 8 May 2006; accepted 11 June 2006;published online 4 October 2006�
In late 2003 a 10 kHz multiposition Thomson scattering diagnostic with high spatial resolutionbecame operational on the TEXTOR tokamak. In the initial phase of operation, one burst of 18pulses of 12 J each with a repetition rate of 5 kHz could be extracted from the laser system. Theinstallation of a low-dope ruby rod �spring 2005� resulted in a system, which can deliver higherpulse energy and moreover a divergence of better than 0.7 mrad, leading to a big improvement inthe detection of Thomson scattering photons. Furthermore, the number of laser pulses in one burstcould be extended to even more than 30. The achieved laser energy of more than 15 J /pulse makesit possible to measure electron temperature and density profiles with an observational error of 8%on the electron temperature �Te� and 4% on the electron density �ne� at ne=2.5�1019 m−3, perspatial element of 7.5 mm. The viewing optics enables sampling of either the full plasma diameterof 900 mm with 120 spatial channels of 7.5 mm each or a 160 mm long edge chord with 98 spatialchannels of 1.7 mm each. The system, which has recently become available for physics exploration,has already been used to study the structure of m=2 magnetic islands and the response of the plasmato off-axis electron cyclotron resonance heating. © 2006 American Institute of Physics.�DOI: 10.1063/1.2219434�
I. INTRODUCTION
The development of TV-like detectors paved the way tothe design of a relatively simple and smart setup to measuresimultaneously the electron temperature �Te� and density �ne�in plasmas at many positions along a laser chord, using asingle laser pulse. The multiposition Thomson scattering�TS� system based on such a TV-like detector was built forPrinceton Large Tokamak in 1978.1 The development of TVThomson scattering �TVTS� systems got a new impulse in1994 by the introduction of a high-resolution TVTS systemon the Rijnhuizen Tokamak Project.2 Double-pulse versionsof this system were installed on the TJ-II stellarator3 and theTEXTOR tokamak.4
The double-pulse TVTS system at the TEXTOR toka-mak �R0=1.75 m, a=0.46 m, B0�2.9 T, and Ip�0.8 MA�operated successfully from 2000 until 2001. This TS systemwas based on a double-pulse ruby laser �2�12 J� and twointensified charge coupled device �CCD� cameras for record-ing the scattered light. It was capable of measuring two Te
and ne profiles during one discharge along a vertical chord of900 mm length �at R=1.84 m� with 120 spatial channels of7.5 mm each.
To study the dynamics of mesoscale structures like mag-netohydrodynamic �MHD� islands and internal transport bar-riers in hot plasmas, one needs a repetitive system with atime resolution of �1 ms. Therefore, a TS system is devel-oped. It consists of a repetitive laser and a fast detectionsystem. The Ioffe Institute in St. Petersburg and MultiTech
a�Electronic mail: [email protected]�URL: http//www.rijnh.nlc�Partners in the Trilateral Euregio Cluster.
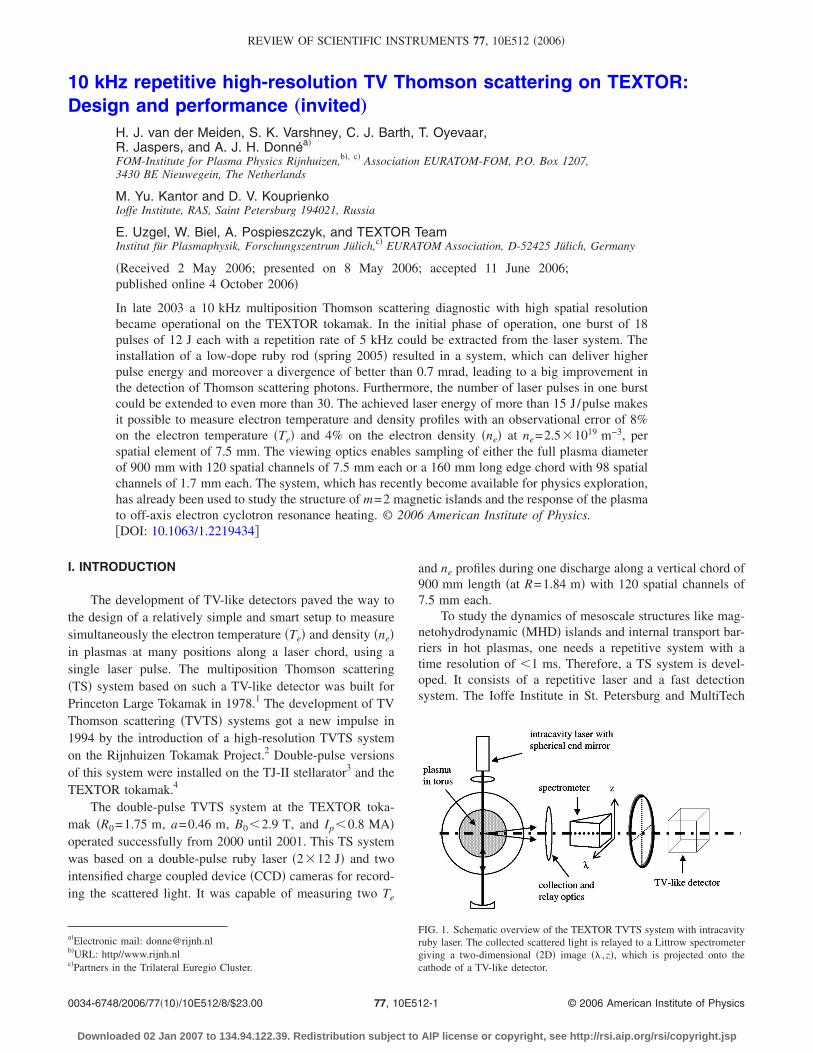
FIG. 1. Schematic overview of the TEXTOR TVTS system with intracavityruby laser. The collected scattered light is relayed to a Littrow spectrometergiving a two-dimensional �2D� image �� ,z�, which is projected onto thecathode of a TV-like detector.
REVIEW OF SCIENTIFIC INSTRUMENTS 77, 10E512 �2006�
0034-6748/2006/77�10�/10E512/8/$23.00 © 2006 American Institute of Physics77, 10E512-1
Downloaded 02 Jan 2007 to 134.94.122.39. Redistribution subject to AIP license or copyright, see http://rsi.aip.org/rsi/copyright.jsp
Ltd. designed and constructed a so-called double-pass intra-cavity laser.4,5 The system is operating like a normal laseroscillator; however, in this case the plasma is part of an 18 mlong cavity. To preserve the high spatial resolution of thediagnostic, as well as to adapt as much as possible to theexisting viewing optics, the beam path of the new laser iskept the same as that of the double-pulse laser. A state of theart detector has been constructed based on two 12 bit Phan-tom V7.0 complementary metal oxide semiconductor�CMOS� cameras and a special image intensifier stage.
In this article the design aspects of the multipulse TVTSsystem �MPTS� for TEXTOR are described in Secs. III andIV, starting with an overview of the multipulse TS system inSec. II. The achieved system performance and earlier resultsare presented in Secs. V–VIII.
II. BASIC OVERVIEW OF THE MPTS SYSTEM
The basic setup of the TEXTOR multipulse TVTS sys-tem is shown in Fig. 1. Basically, the layout of the system iscomparable to that of the previous double-pulse system. Themain difference is the use of �1� a multipulse intracavity rubylaser instead of a double-pulse conventional ruby laser and�2� an ultrafast multiframe detector instead of a combinationof two single-frame intensified CCD cameras.
In the intracavity setup the plasma is included in thelaser cavity, and the laser beam travels many times back andforth through the scattering volume, giving a higher laserefficiency than is the case for a conventional laser. Thisphoton-recycling setup enables the generation of a long trainof pulses; moreover, the energy of each individual pulse istypically higher than that produced by conventional highpower lasers.
Scattered light is collected by a multielement viewinglens and relayed to a spectrometer by coherent fiber bundles�not drawn in Fig. 1�. Either the full plasma diameter of900 mm with 120 spatial channels of 7.5 mm each or a160 mm long edge chord with 98 spatial channels of 1.7 mmeach can be sampled.
Spectral analysis is performed by a spectrometer in Lit-trow configuration, covering a spectral range of 585–800 nm�for the full chord observation�. The two-dimensional inter-mediate image �� ,z� is projected onto the highly sensitivecathode of a gated image intensifier. The amplified light isrecorded by two fast CMOS cameras �only one is drawn inFig. 1�. This camera was selected because of its high record-ing frame rate of 10 900 frames/s at an image format of512�384 pixels and a 12 bit dynamic range.
III. MULTIPULSE INTRACAVITY LASER
At the Ioffe Institute comprehensive research has beenperformed on intracavity laser systems. The collaboration be-tween this institute and FOM Rijnhuizen resulted in the de-velopment of a so-called double-pass intracavity laser with acavity length of 18 m, as shown in Fig. 2.6 Here, the laserbeam passes twice through the plasma along exactly thesame path before returning again into the lasing medium.The basic elements of the intracavity laser are similar tothoseof an established laser oscillator. Between the flat rear mirror
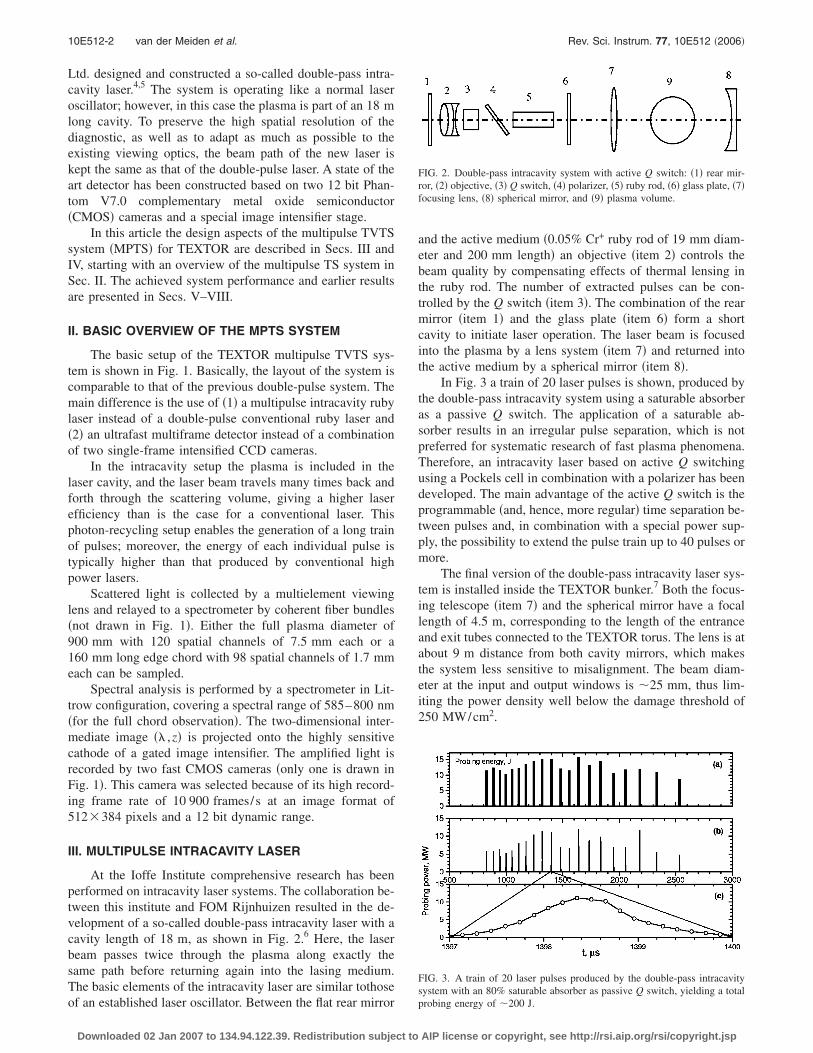
and the active medium �0.05% Cr+ ruby rod of 19 mm diam-eter and 200 mm length� an objective �item 2� controls thebeam quality by compensating effects of thermal lensing inthe ruby rod. The number of extracted pulses can be con-trolled by the Q switch �item 3�. The combination of the rearmirror �item 1� and the glass plate �item 6� form a shortcavity to initiate laser operation. The laser beam is focusedinto the plasma by a lens system �item 7� and returned intothe active medium by a spherical mirror �item 8�.
In Fig. 3 a train of 20 laser pulses is shown, produced bythe double-pass intracavity system using a saturable absorberas a passive Q switch. The application of a saturable ab-sorber results in an irregular pulse separation, which is notpreferred for systematic research of fast plasma phenomena.Therefore, an intracavity laser based on active Q switchingusing a Pockels cell in combination with a polarizer has beendeveloped. The main advantage of the active Q switch is theprogrammable �and, hence, more regular� time separation be-tween pulses and, in combination with a special power sup-ply, the possibility to extend the pulse train up to 40 pulses ormore.
The final version of the double-pass intracavity laser sys-tem is installed inside the TEXTOR bunker.7 Both the focus-ing telescope �item 7� and the spherical mirror have a focallength of 4.5 m, corresponding to the length of the entranceand exit tubes connected to the TEXTOR torus. The lens is atabout 9 m distance from both cavity mirrors, which makesthe system less sensitive to misalignment. The beam diam-eter at the input and output windows is �25 mm, thus lim-iting the power density well below the damage threshold of250 MW/cm2.
FIG. 2. Double-pass intracavity system with active Q switch: �1� rear mir-ror, �2� objective, �3� Q switch, �4� polarizer, �5� ruby rod, �6� glass plate, �7�focusing lens, �8� spherical mirror, and �9� plasma volume.
FIG. 3. A train of 20 laser pulses produced by the double-pass intracavitysystem with an 80% saturable absorber as passive Q switch, yielding a totalprobing energy of �200 J.
10E512-2 van der Meiden et al. Rev. Sci. Instrum. 77, 10E512 �2006�
Downloaded 02 Jan 2007 to 134.94.122.39. Redistribution subject to AIP license or copyright, see http://rsi.aip.org/rsi/copyright.jsp
The 0.05% Cr+ ruby rod is pumped by six flash tubes.Each lamp is supplied with �0.5 MW pumping power whichis kept constant during the burst duration of typically5–10 ms. To obtain a block wave for the pumping voltage aspecial power supply has been designed and constructed byMultiTech Ltd. in St. Petersburg.
Using an active Q switch at a repetition rate of 5 kHz, atotal probing energy of �236 J in one burst of pulses wasachieved.7 The full width at half maximum �FWHMs� of thelaser pulses are 1–1.5 �s. Taking into account the cavitylength of 18 m the laser light travels, within this time corre-sponding to the pulse width, about 23 times up and downthrough the scattering volume. In other words each laserpulse within a burst has a microstructure of smaller laserpulses each with an average energy of �0.6 J. The micro-structure is, however, not observed by the detection system,which only observes the integrated laser pulse with total en-ergy of �15 J. The word “pulse” in this article thereforerefers to the integrated laser pulse. Although high probingenergies are achievable with this setup, luminescence mea-surements at the ruby-rod cross section indicated that theamplification process in the 0.05% Cr+ ruby rod occurs pre-dominantly at the periphery. It is obvious that thermal-lensing effects will occur, preventing the laser to operatewith stable and low divergences. The same effect caused thepulse energy to decrease from 15 J for the first pulses to5–8 J for the later pulses in the burst.
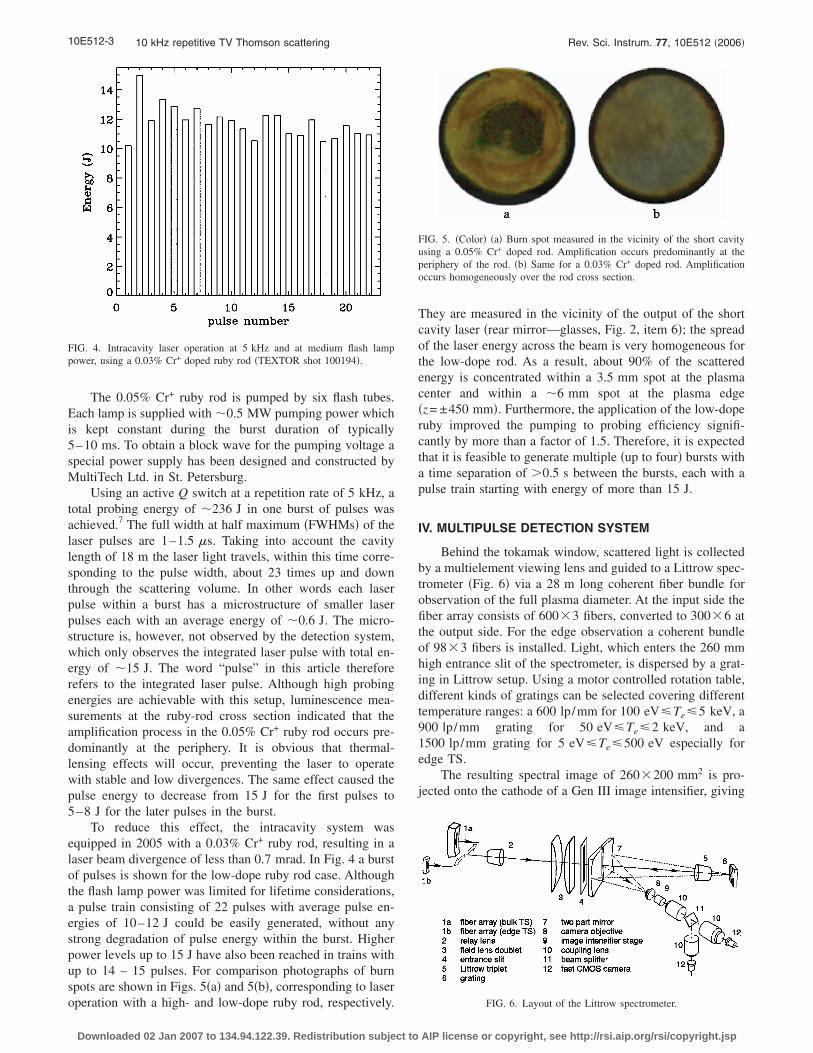
To reduce this effect, the intracavity system wasequipped in 2005 with a 0.03% Cr+ ruby rod, resulting in alaser beam divergence of less than 0.7 mrad. In Fig. 4 a burstof pulses is shown for the low-dope ruby rod case. Althoughthe flash lamp power was limited for lifetime considerations,a pulse train consisting of 22 pulses with average pulse en-ergies of 10–12 J could be easily generated, without anystrong degradation of pulse energy within the burst. Higherpower levels up to 15 J have also been reached in trains withup to 14 – 15 pulses. For comparison photographs of burnspots are shown in Figs. 5�a� and 5�b�, corresponding to laseroperation with a high- and low-dope ruby rod, respectively.
They are measured in the vicinity of the output of the shortcavity laser �rear mirror—glasses, Fig. 2, item 6�; the spreadof the laser energy across the beam is very homogeneous forthe low-dope rod. As a result, about 90% of the scatteredenergy is concentrated within a 3.5 mm spot at the plasmacenter and within a �6 mm spot at the plasma edge�z= ±450 mm�. Furthermore, the application of the low-doperuby improved the pumping to probing efficiency signifi-cantly by more than a factor of 1.5. Therefore, it is expectedthat it is feasible to generate multiple �up to four� bursts witha time separation of �0.5 s between the bursts, each with apulse train starting with energy of more than 15 J.
IV. MULTIPULSE DETECTION SYSTEM
Behind the tokamak window, scattered light is collectedby a multielement viewing lens and guided to a Littrow spec-trometer �Fig. 6� via a 28 m long coherent fiber bundle forobservation of the full plasma diameter. At the input side thefiber array consists of 600�3 fibers, converted to 300�6 atthe output side. For the edge observation a coherent bundleof 98�3 fibers is installed. Light, which enters the 260 mmhigh entrance slit of the spectrometer, is dispersed by a grat-ing in Littrow setup. Using a motor controlled rotation table,different kinds of gratings can be selected covering differenttemperature ranges: a 600 lp/mm for 100 eV�Te�5 keV, a900 lp/mm grating for 50 eV�Te�2 keV, and a1500 lp/mm grating for 5 eV�Te�500 eV especially foredge TS.
The resulting spectral image of 260�200 mm2 is pro-jected onto the cathode of a Gen III image intensifier, giving
FIG. 4. Intracavity laser operation at 5 kHz and at medium flash lamppower, using a 0.03% Cr+ doped ruby rod �TEXTOR shot 100194�.
FIG. 5. �Color� �a� Burn spot measured in the vicinity of the short cavityusing a 0.05% Cr+ doped rod. Amplification occurs predominantly at theperiphery of the rod. �b� Same for a 0.03% Cr+ doped rod. Amplificationoccurs homogeneously over the rod cross section.
FIG. 6. Layout of the Littrow spectrometer.
10E512-3 10 kHz repetitive TV Thomson scattering Rev. Sci. Instrum. 77, 10E512 �2006�
Downloaded 02 Jan 2007 to 134.94.122.39. Redistribution subject to AIP license or copyright, see http://rsi.aip.org/rsi/copyright.jsp
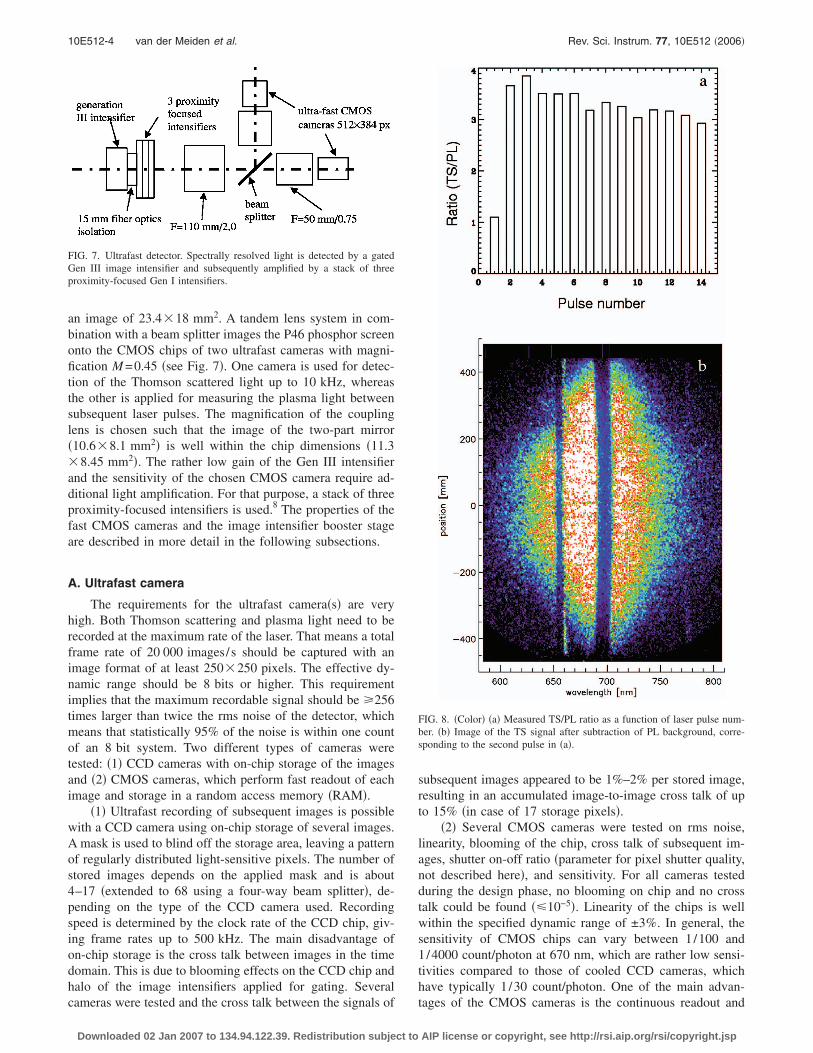
an image of 23.4�18 mm2. A tandem lens system in com-bination with a beam splitter images the P46 phosphor screenonto the CMOS chips of two ultrafast cameras with magni-fication M =0.45 �see Fig. 7�. One camera is used for detec-tion of the Thomson scattered light up to 10 kHz, whereasthe other is applied for measuring the plasma light betweensubsequent laser pulses. The magnification of the couplinglens is chosen such that the image of the two-part mirror�10.6�8.1 mm2� is well within the chip dimensions �11.3�8.45 mm2�. The rather low gain of the Gen III intensifierand the sensitivity of the chosen CMOS camera require ad-ditional light amplification. For that purpose, a stack of threeproximity-focused intensifiers is used.8 The properties of thefast CMOS cameras and the image intensifier booster stageare described in more detail in the following subsections.
A. Ultrafast camera
The requirements for the ultrafast camera�s� are veryhigh. Both Thomson scattering and plasma light need to berecorded at the maximum rate of the laser. That means a totalframe rate of 20 000 images/s should be captured with animage format of at least 250�250 pixels. The effective dy-namic range should be 8 bits or higher. This requirementimplies that the maximum recordable signal should be �256times larger than twice the rms noise of the detector, whichmeans that statistically 95% of the noise is within one countof an 8 bit system. Two different types of cameras weretested: �1� CCD cameras with on-chip storage of the imagesand �2� CMOS cameras, which perform fast readout of eachimage and storage in a random access memory �RAM�.
�1� Ultrafast recording of subsequent images is possiblewith a CCD camera using on-chip storage of several images.A mask is used to blind off the storage area, leaving a patternof regularly distributed light-sensitive pixels. The number ofstored images depends on the applied mask and is about4–17 �extended to 68 using a four-way beam splitter�, de-pending on the type of the CCD camera used. Recordingspeed is determined by the clock rate of the CCD chip, giv-ing frame rates up to 500 kHz. The main disadvantage ofon-chip storage is the cross talk between images in the timedomain. This is due to blooming effects on the CCD chip andhalo of the image intensifiers applied for gating. Severalcameras were tested and the cross talk between the signals of
subsequent images appeared to be 1%–2% per stored image,resulting in an accumulated image-to-image cross talk of upto 15% �in case of 17 storage pixels�.
�2� Several CMOS cameras were tested on rms noise,linearity, blooming of the chip, cross talk of subsequent im-ages, shutter on-off ratio �parameter for pixel shutter quality,not described here�, and sensitivity. For all cameras testedduring the design phase, no blooming on chip and no crosstalk could be found ��10−5�. Linearity of the chips is wellwithin the specified dynamic range of ±3%. In general, thesensitivity of CMOS chips can vary between 1/100 and1/4000 count/photon at 670 nm, which are rather low sensi-tivities compared to those of cooled CCD cameras, whichhave typically 1/30 count/photon. One of the main advan-tages of the CMOS cameras is the continuous readout and
FIG. 7. Ultrafast detector. Spectrally resolved light is detected by a gatedGen III image intensifier and subsequently amplified by a stack of threeproximity-focused Gen I intensifiers.
FIG. 8. �Color� �a� Measured TS/PL ratio as a function of laser pulse num-ber. �b� Image of the TS signal after subtraction of PL background, corre-sponding to the second pulse in �a�.
10E512-4 van der Meiden et al. Rev. Sci. Instrum. 77, 10E512 �2006�
Downloaded 02 Jan 2007 to 134.94.122.39. Redistribution subject to AIP license or copyright, see http://rsi.aip.org/rsi/copyright.jsp
storage of images; i.e., the number of sampled images onlydepends on the selected image format and the capacity of theavailable RAM. Of all tested cameras the specifications ofonly one, the Phantom V7, came closest to the requirements.
The Phantom V7 can store 12 bit images of 512�384 pixels �22 �m� at a frame rate up to10.9 kiloframes/s with a remarkably high sensitivity of�1/50 count/photon. It is found that the image-to-imagecross talk of the Phantom V7 camera is only then smallenough ��1.5% � when the camera is illuminated with a biaslight level, corresponding to �270 counts. In that case, thedetector noise is about 3 counts. As a result the effectivedynamic range is 9.5 bits for a noise range of 95% probabil-ity �±6 counts�. Although the Phantom V7 does not fullycomply with the requested specifications, it was the bestavailable camera at the time of purchase �2003�. In a stan-dard camera memory �3400 images of the required imageformat can be stored.
B. Image intensifier booster stage
Present technology of ITT Generation III intensifiersprovides quantum efficiencies up to �50% over a wave-length range between 580 and 850 nm, which perfectly fitsour TS application. A P46 phosphor providing a decay timeof 0.2 �s is chosen to circumvent cross talk between imagesof subsequent laser pulses, which have a minimum separa-tion time of 100 �s. However, a P46 phosphor has a 4–5times lower efficiency than the P20 phosphor used in theprevious double-pulse system. The maximum obtainablegain is 1300 at the maximum microchannel plate �MCP�voltage of 1150 V. To prevent electron depletion due to elec-tron exhaust of the Gen III MCP, a MCP voltage of 990 V isused �Gph=450�.
For the complete detector a conversion factor �Q0� isdefined as the number of counts generated by one photoelec-tron detected from the Gen III intensifier.9 The value of thisconversion factor determines the impact of the bit and therms detector noise on the observational error of the signal.The maximum value of Q0 is determined by the dynamicrange of the CMOS camera and the maximum electron den-sity ne�1�1020 m−3, at which Npe�2�104 photoelectrons�pe� are distributed over one spectrum with a height of zbinpixels �corresponding to �L�7.5 mm in the plasma�. As-suming a half-width of TS spectrum of wpixel unbinnedwavelength pixels, the amplitude of the TS spectrum of onepixel height is given by
A =NpeQ0
wpixel � zbin. �1�
For Q0=80 counts/pe, wpixel=170 �half of the usableCMOS detector width�, and zbin=4, the amplitudeA�2350 counts, which is well below the maximum of 4096counts. The photon gain needed to realize Q0=80 counts/pecan be found from the relation between Q0, the photon gainGph, the coupling lens efficiency Tcoupling, the sensitivity Sdet
�1/50 count/photon�, and the effective efficiency of the GenIII image intensifier, 1��0.25�.
TABLE I. Main parameters of the Thomson scattering system.
Energy per laser pulse E 15 JSolid angle 1.88�10−3 srScattering volume �3 pixels on CMOS chip� �L 6�10−3 mThomson scattering cross section �T 7.94�10−30 m2
Overall transmission till first photocathode �overall 0.15Effective quantum efficiency �QE=50%,noise figure=1.35�
intensifier 0.27
Transmission through spectrometer slit slit 0.85
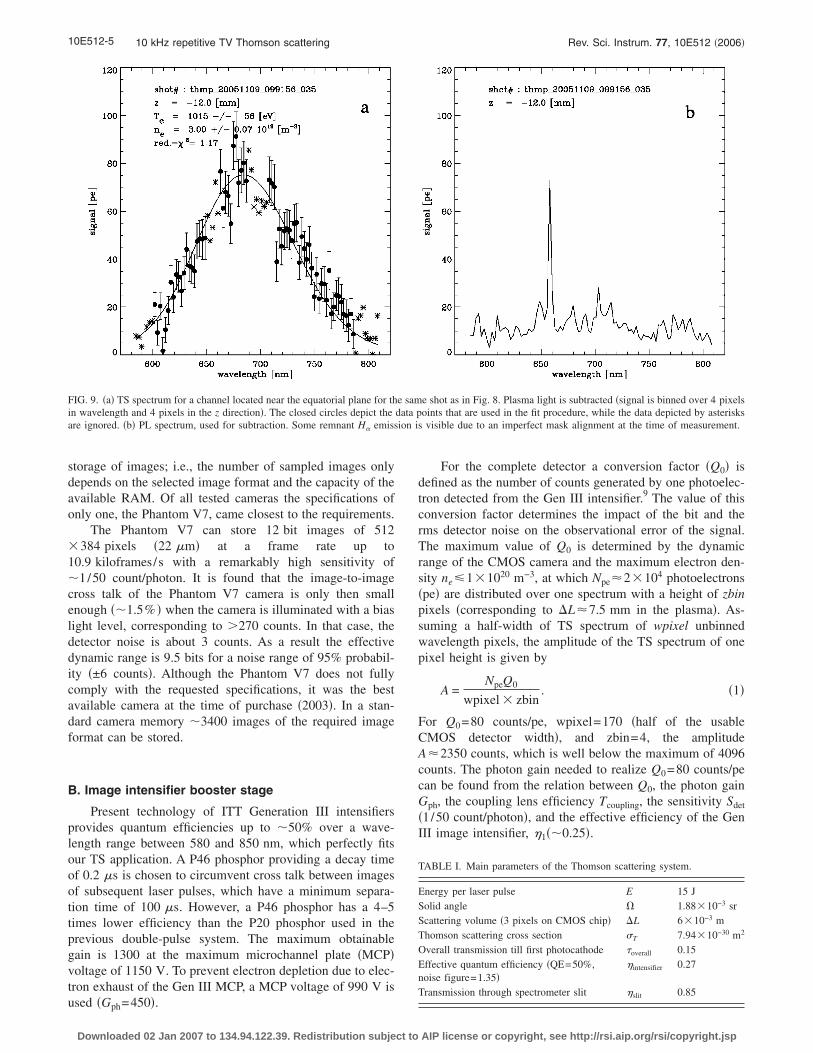
FIG. 9. �a� TS spectrum for a channel located near the equatorial plane for the same shot as in Fig. 8. Plasma light is subtracted �signal is binned over 4 pixelsin wavelength and 4 pixels in the z direction�. The closed circles depict the data points that are used in the fit procedure, while the data depicted by asterisksare ignored. �b� PL spectrum, used for subtraction. Some remnant H emission is visible due to an imperfect mask alignment at the time of measurement.
10E512-5 10 kHz repetitive TV Thomson scattering Rev. Sci. Instrum. 77, 10E512 �2006�
Downloaded 02 Jan 2007 to 134.94.122.39. Redistribution subject to AIP license or copyright, see http://rsi.aip.org/rsi/copyright.jsp
Q0 =GphTcouplingSdet
1. �2�
For the applied F/3 lens, a 50% beam splitter and a 95%transmission of the coupling lenses, Tcoupling=0.013. Insert-ing these values gives a required total photon gain ofGph�7.7�104. Since linear operation of the Generation IIIintensifier is well feasible at G1�450, a booster stage isneeded to increase the photon gain by at least another factorof �171. This gain could be realized with a stack of threeproximity-focused intensifiers equipped with S20 cathodesand P46 screens,8 operating at 12 kV and each with a gainof �5.6.
V. DATA ANALYSIS
In principle, data analysis is the same as for the previousdouble-pulse system,5 now executed multiple times, with twomain differences.
First, to capture the TS photons during the full laserpulse the image intensifier needs to be gated for 1.8 �s. Thisdiscloses one of the main critical points of this diagnostic:the competition between the plasma background light andthe TS signal. Therefore, the background is measured in ad-dition to every laser pulse to enable correction for this.
Second, the measured TS spectrum at each position isthe sum of two relativistic spectral-distribution functions,with different shapes corresponding to back- and forwardscatterings. The scattering angle along the full chord of900 mm varies between 70° and 110°. However, still a two-parameter fit �depending on Te and ne values� is used todescribe the spectrum since a fixed ratio between the forwardand backward energies can be applied.
VI. SYSTEM PERFORMANCE
The number of the detected photoelectrons can be calcu-lated from the scattering formula:
Npe =E
h�0�Lne�T�overallintensifierslit. �3�
Using this formula in combination with the TS systemparameters described in Table I results in an expectednumber of photoelectrons Npe=2190 at a density ofne=1.0�1019 m−3. To compare this value with the measurednumber of photoelectrons, the conversion factor Q0 was de-termined from statistical analysis of a CMOS image with ahomogeneous illumination, giving Q0=80 counts/pe. UsingRayleigh scattering, the system sensitivity at an energy of15 J, �L=4 pixels and Q0=80 counts/pe, was found to be1510 photoelectrons at a density of ne=1.0�1019 m−3,which is about 30% lower than the theoretical value. Thereason for this difference can be too high assumed values forthe effective quantum efficiency of the image intensifier, thelaser power, and/or the efficiency of the booster stage.
The expected number of detected TS photoelectronsis such that an observational error of �3% in ne atne=1.0�1019 m−3 is possible, if the background contribu-tion from plasma light would be negligible. Although in atokamak the plasma light background can be considerable, asimple calculation shows that very accurate measurements ofne are achievable, provided that the integrated TS signal ismore than two to three times higher than that of the plasmalight �PL� signal.
Assume that S1=TS+PL and S2=PL are the signals �innumber of photoelectrons� measured during and after the la-ser pulse, respectively. The corrected TS signal is S=S1−S2.Using Poisson statistics, one finds the error dS in S, whichcan be expressed as a function of the relative error in ne:
dS
S=
dne
ne
�1 + 2PL/TS, �4�
with dne /ne refering to the observational error in the casewhen there is no plasma light at all, PL=0. The signal ratio
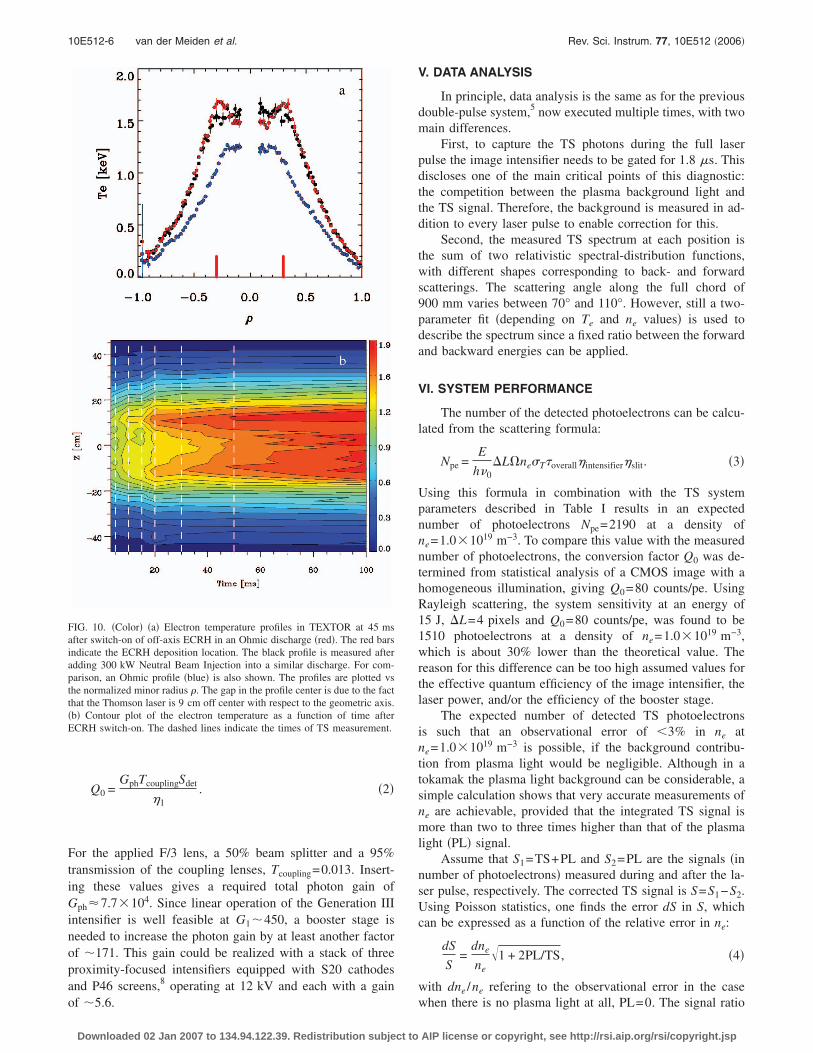
FIG. 10. �Color� �a� Electron temperature profiles in TEXTOR at 45 msafter switch-on of off-axis ECRH in an Ohmic discharge �red�. The red barsindicate the ECRH deposition location. The black profile is measured afteradding 300 kW Neutral Beam Injection into a similar discharge. For com-parison, an Ohmic profile �blue� is also shown. The profiles are plotted vsthe normalized minor radius �. The gap in the profile center is due to the factthat the Thomson laser is 9 cm off center with respect to the geometric axis.�b� Contour plot of the electron temperature as a function of time afterECRH switch-on. The dashed lines indicate the times of TS measurement.
10E512-6 van der Meiden et al. Rev. Sci. Instrum. 77, 10E512 �2006�
Downloaded 02 Jan 2007 to 134.94.122.39. Redistribution subject to AIP license or copyright, see http://rsi.aip.org/rsi/copyright.jsp
of TS and PL exceeds even a factor of 3.5 �see Fig. 8�a��,which implies that the plasma light background contributesless than 25% to the observational error in ne. The image ofthe TS signal is shown in Fig. 8�b�. The wide and narrowvertical dark bands in the image correspond to the spectralranges near the original laser wavelength �leaving the spec-trometer via the slit in the two-part mirror� and the H wave-length, which is blocked by a mask on the spectral mirror�Fig. 6, item 7�.
VII. RESULTS
The MPTS system has come into operation late 2004,and its performance has been gradually improved since then.In this section a number of typical measurement results aregiven.
A measured TS spectrum, corresponding to a locationnear the equatorial plane in the plasma is shown in Fig. 9�a�along with the plasma light spectrum in Fig. 9�b�. The solidline in Fig. 9�a� is a two-parameter spectral fit to the data.The fitted values of Te and ne are 1.015±0.056 keV and�3.00±0.07��1019 m−3, respectively. The accuracies in theTe and ne determination are �5% and �2% for the shownspectrum, and they agree reasonably well with the target ac-curacies of 8% and 4%, respectively, at 1019 m−3 and 15 Jlaser energy.
In the early operational phase of the MPTS system, us-ing the 0.05% doped Cr+ rod, the pulse energy strongly de-graded within a burst. For this reason it was not yet possibleto follow fast processes in the plasma. However, for rela-tively slowly varying or stationary plasma processes it waspossible to measure Te profiles with very high accuracy. InFig. 10�a� examples are shown of Te profiles measured inOhmic plasmas and at 45 ms after switch-on of off-axis elec-tron cyclotron resonance heating �ECRH�, in an Ohmicplasma and in a plasma with low-power neutral beam injec-tion, respectively. The data from 12 individual pulses withina single burst were summed and the equivalent laser energythat was used per profile was typically �220 J. The gap in
the profile �plotted versus normalized plasma radius �� is dueto the fact that the Thomson viewing line crosses the plasma9 cm towards the low field side of the geometric axis. So theactual plasma center is not seen. Figure 10�b� gives a contourplot of the Te profile versus time relative to off-axis ECRHswitch-on. Here the vertical axis is the position along theThomson laser chord. The times of Thomson measurements�except for one at 100 ms� are indicated by vertical dashedlines. The data have been interpolated. The very pronouncedhollow shape of the Te profile during application of off-axisECRH in an Ohmic discharge is explained by the fact thatthe Ohmic input power in the plasma core drops below thepower lost by the electrons due to collisions with ions.10,11
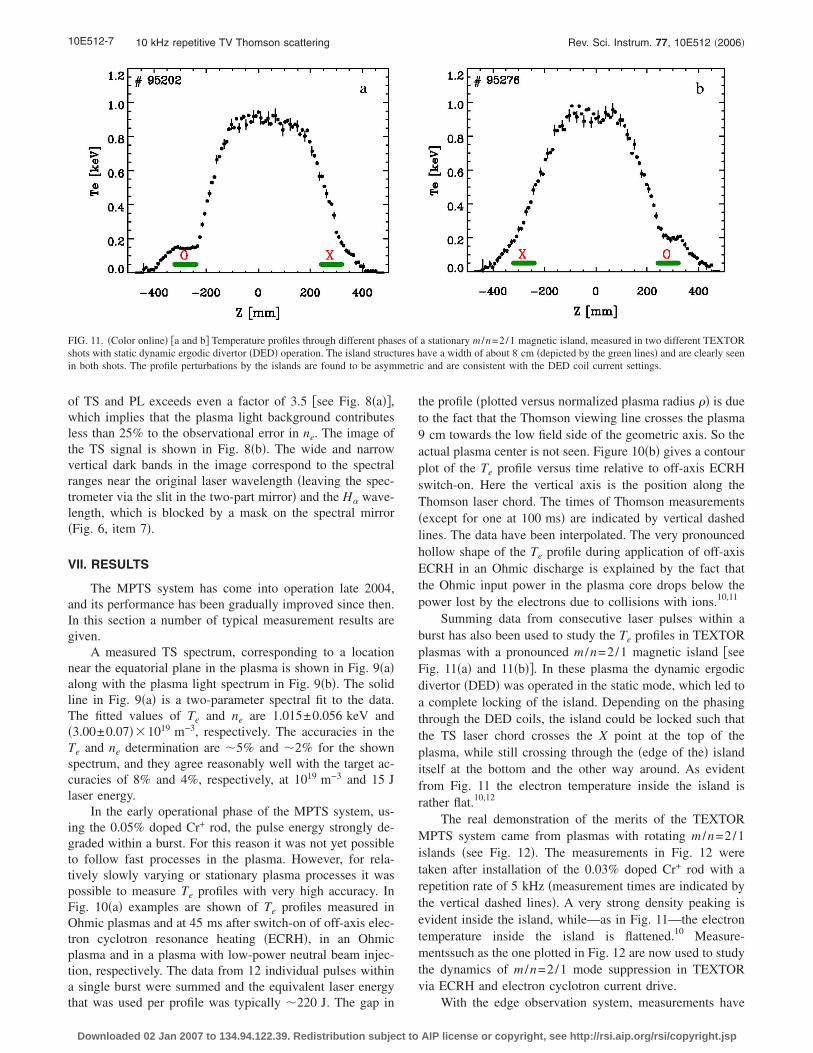
Summing data from consecutive laser pulses within aburst has also been used to study the Te profiles in TEXTORplasmas with a pronounced m /n=2/1 magnetic island �seeFig. 11�a� and 11�b��. In these plasma the dynamic ergodicdivertor �DED� was operated in the static mode, which led toa complete locking of the island. Depending on the phasingthrough the DED coils, the island could be locked such thatthe TS laser chord crosses the X point at the top of theplasma, while still crossing through the �edge of the� islanditself at the bottom and the other way around. As evidentfrom Fig. 11 the electron temperature inside the island israther flat.10,12
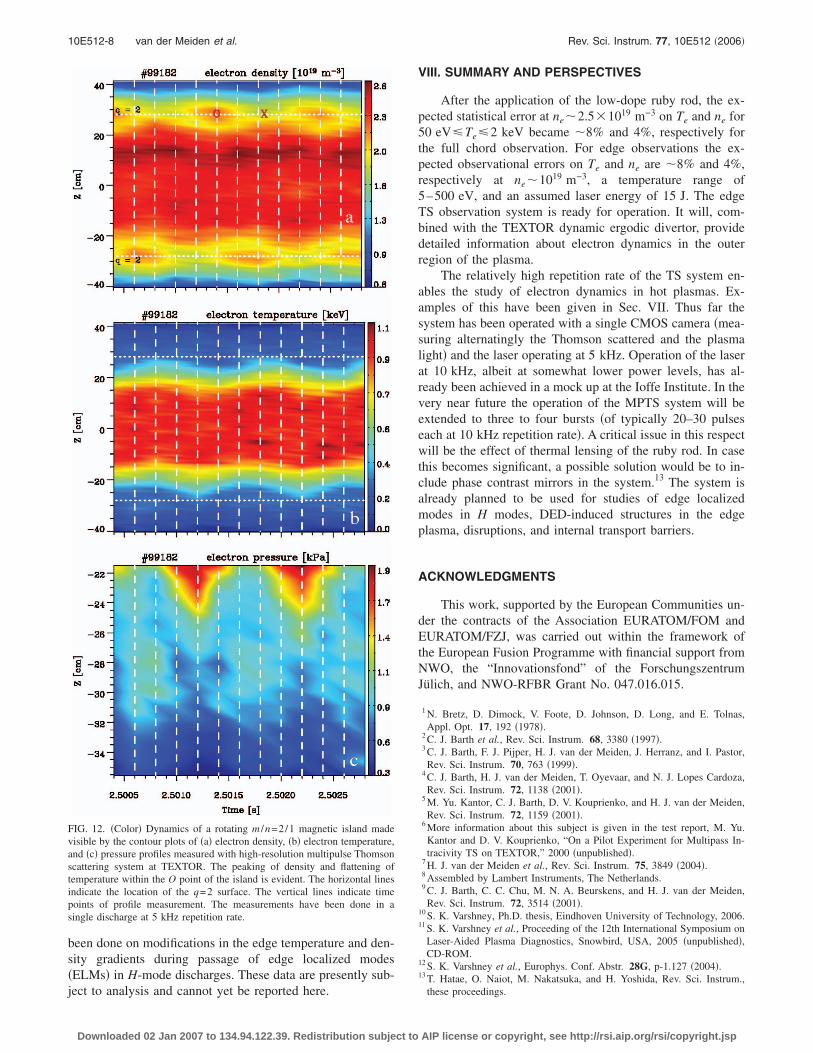
The real demonstration of the merits of the TEXTORMPTS system came from plasmas with rotating m /n=2/1islands �see Fig. 12�. The measurements in Fig. 12 weretaken after installation of the 0.03% doped Cr+ rod with arepetition rate of 5 kHz �measurement times are indicated bythe vertical dashed lines�. A very strong density peaking isevident inside the island, while—as in Fig. 11—the electrontemperature inside the island is flattened.10 Measure-mentssuch as the one plotted in Fig. 12 are now used to studythe dynamics of m /n=2/1 mode suppression in TEXTORvia ECRH and electron cyclotron current drive.
With the edge observation system, measurements have
FIG. 11. �Color online� �a and b� Temperature profiles through different phases of a stationary m /n=2/1 magnetic island, measured in two different TEXTORshots with static dynamic ergodic divertor �DED� operation. The island structures have a width of about 8 cm �depicted by the green lines� and are clearly seenin both shots. The profile perturbations by the islands are found to be asymmetric and are consistent with the DED coil current settings.
10E512-7 10 kHz repetitive TV Thomson scattering Rev. Sci. Instrum. 77, 10E512 �2006�
Downloaded 02 Jan 2007 to 134.94.122.39. Redistribution subject to AIP license or copyright, see http://rsi.aip.org/rsi/copyright.jsp
been done on modifications in the edge temperature and den-sity gradients during passage of edge localized modes�ELMs� in H-mode discharges. These data are presently sub-ject to analysis and cannot yet be reported here.
VIII. SUMMARY AND PERSPECTIVES
After the application of the low-dope ruby rod, the ex-pected statistical error at ne�2.5�1019 m−3 on Te and ne for50 eV�Te�2 keV became �8% and 4%, respectively forthe full chord observation. For edge observations the ex-pected observational errors on Te and ne are �8% and 4%,respectively at ne�1019 m−3, a temperature range of5–500 eV, and an assumed laser energy of 15 J. The edgeTS observation system is ready for operation. It will, com-bined with the TEXTOR dynamic ergodic divertor, providedetailed information about electron dynamics in the outerregion of the plasma.
The relatively high repetition rate of the TS system en-ables the study of electron dynamics in hot plasmas. Ex-amples of this have been given in Sec. VII. Thus far thesystem has been operated with a single CMOS camera �mea-suring alternatingly the Thomson scattered and the plasmalight� and the laser operating at 5 kHz. Operation of the laserat 10 kHz, albeit at somewhat lower power levels, has al-ready been achieved in a mock up at the Ioffe Institute. In thevery near future the operation of the MPTS system will beextended to three to four bursts �of typically 20–30 pulseseach at 10 kHz repetition rate�. A critical issue in this respectwill be the effect of thermal lensing of the ruby rod. In casethis becomes significant, a possible solution would be to in-clude phase contrast mirrors in the system.13 The system isalready planned to be used for studies of edge localizedmodes in H modes, DED-induced structures in the edgeplasma, disruptions, and internal transport barriers.
ACKNOWLEDGMENTS
This work, supported by the European Communities un-der the contracts of the Association EURATOM/FOM andEURATOM/FZJ, was carried out within the framework ofthe European Fusion Programme with financial support fromNWO, the “Innovationsfond” of the ForschungszentrumJülich, and NWO-RFBR Grant No. 047.016.015.
1 N. Bretz, D. Dimock, V. Foote, D. Johnson, D. Long, and E. Tolnas,Appl. Opt. 17, 192 �1978�.
2 C. J. Barth et al., Rev. Sci. Instrum. 68, 3380 �1997�.3 C. J. Barth, F. J. Pijper, H. J. van der Meiden, J. Herranz, and I. Pastor,Rev. Sci. Instrum. 70, 763 �1999�.
4 C. J. Barth, H. J. van der Meiden, T. Oyevaar, and N. J. Lopes Cardoza,Rev. Sci. Instrum. 72, 1138 �2001�.
5 M. Yu. Kantor, C. J. Barth, D. V. Kouprienko, and H. J. van der Meiden,Rev. Sci. Instrum. 72, 1159 �2001�.
6 More information about this subject is given in the test report, M. Yu.Kantor and D. V. Kouprienko, “On a Pilot Experiment for Multipass In-tracivity TS on TEXTOR,” 2000 �unpublished�.
7 H. J. van der Meiden et al., Rev. Sci. Instrum. 75, 3849 �2004�.8 Assembled by Lambert Instruments, The Netherlands.9 C. J. Barth, C. C. Chu, M. N. A. Beurskens, and H. J. van der Meiden,Rev. Sci. Instrum. 72, 3514 �2001�.
10 S. K. Varshney, Ph.D. thesis, Eindhoven University of Technology, 2006.11 S. K. Varshney et al., Proceeding of the 12th International Symposium on
Laser-Aided Plasma Diagnostics, Snowbird, USA, 2005 �unpublished�,CD-ROM.
12 S. K. Varshney et al., Europhys. Conf. Abstr. 28G, p-1.127 �2004�.13 T. Hatae, O. Naiot, M. Nakatsuka, and H. Yoshida, Rev. Sci. Instrum.,
these proceedings.
FIG. 12. �Color� Dynamics of a rotating m /n=2/1 magnetic island madevisible by the contour plots of �a� electron density, �b� electron temperature,and �c� pressure profiles measured with high-resolution multipulse Thomsonscattering system at TEXTOR. The peaking of density and flattening oftemperature within the O point of the island is evident. The horizontal linesindicate the location of the q=2 surface. The vertical lines indicate timepoints of profile measurement. The measurements have been done in asingle discharge at 5 kHz repetition rate.
10E512-8 van der Meiden et al. Rev. Sci. Instrum. 77, 10E512 �2006�
Downloaded 02 Jan 2007 to 134.94.122.39. Redistribution subject to AIP license or copyright, see http://rsi.aip.org/rsi/copyright.jsp
Related Documents