CHANGE MONITORING SYSTEM (CMS) Professor Nicholas Mascie-Taylor & Dr Rie Goto October 2013 Abstract Monitoring the changes in Socio-Economic & Nutritional status of extreme poor households between March 2010 and March 2013; results from the eight panel surveys

10 - CMS 3 Report October 2013
Mar 25, 2016
Â
Welcome message from author
This document is posted to help you gain knowledge. Please leave a comment to let me know what you think about it! Share it to your friends and learn new things together.
Transcript
CHANGE MONITORING SYSTEM (CMS)
Professor Nicholas Mascie-Taylor & Dr Rie Goto
October 2013
Abstract Monitoring the changes in Socio-Economic & Nutritional status of extreme poor households
between March 2010 and March 2013; results from the eight panel surveys

i
Executive Summary
1. Background: The six Scale Fund Round One, Phase One projects are
working with a total of 82,850 extreme poor households. In March 2010, 64 households from each of the six Scale Funds were randomly selected for regular follow-up. This report provides information on changes in socio-economic and nutritional status of the same households studied eight times between March 2010 and March 2013 and determines whether households have exited from extreme poverty, or graduated.
2. Attrition: 272 households took part in all eight surveys conducted in March, July and October 2010, March, July and November 2011, March 2012 and March 2013. There was greater attrition in the urban sample (58%) than in the rural areas (23%). Information was collected on 951 individuals of whom 539 were adults, 263 children aged between 5 and 15 years and 149 children under 5 years of age.
3. Male and female headed households and family size: In the total sample 39.0% of households were female headed and mean family size increased significantly from 3.23 in survey 1 to 3.53 in survey 7 before falling to 3.39 in survey 8. Female headed households were smaller by, on average, 1.3 family members.
4. Schooling: Only just under 20.0% of heads of households had attended school more so in male (23.5%) than female headed households (14.3%). Between surveys 1 and 8 school attendance by school-aged children increased significantly by 12.3% in male headed households and 17.7% in female headed households. In survey 1 about 76% of school-aged children attended school increasing to 86%, 87% and 90% in surveys 4, 7 and 8, respectively.
5. Chronic illness: Chronic illness fell significantly between surveys 1 (15.3%) and 4 (3.2%), rose slightly in survey 7 (3.6%) and then fell to 2.1% in survey 8.
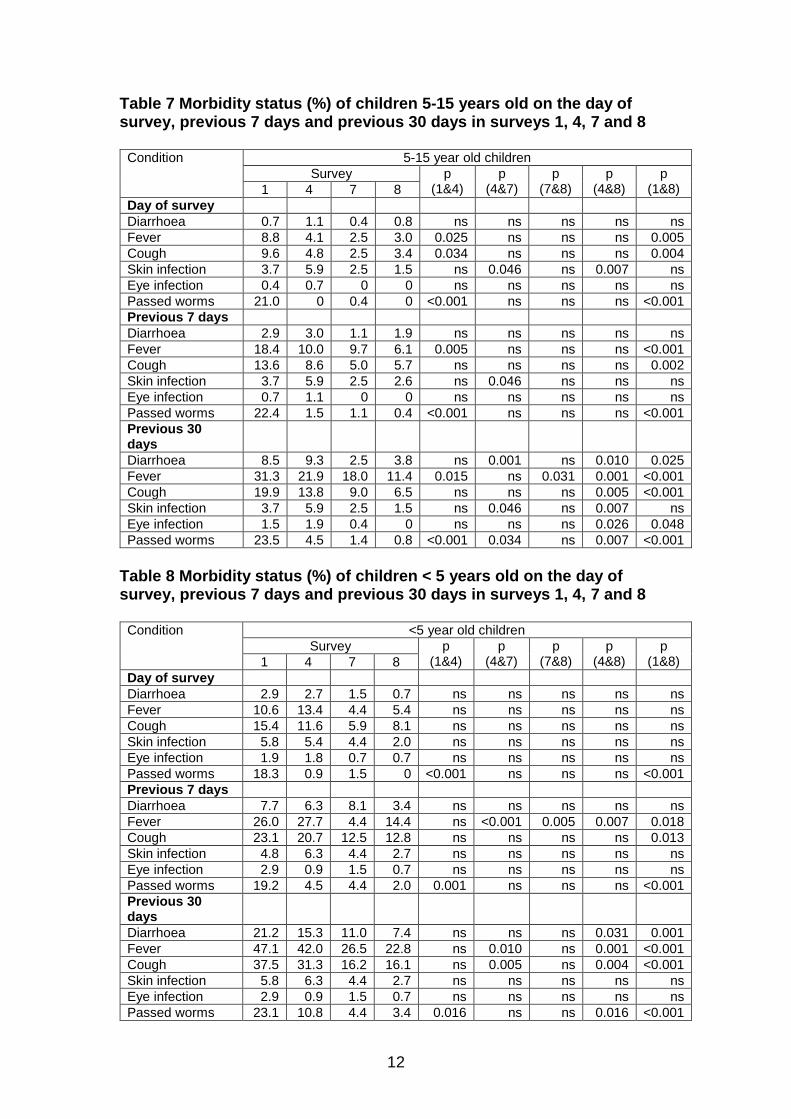
6. Morbidity status: The health status of family members was determined on the day of the survey and over the previous 7 and 30 days. Generally the morbidity reduced in all household members between surveys 1 and 8. For all adults, diarrhoea prevalence fell from 15.3% to 7.2% between surveys 1 and 8, fever from 36.7% to 16.1% and eye infection from 17.5% to 1.5%. In children 5 to 15 years of age the prevalence of fever and cough both fell between surveys 1 and 8 from 47.1% to 22.8% and 37.5% to 16.1%, respectively. In under 5 year old children there were reductions in fever and cough from 31.3% to 11.4% and 19.9% to 6.5%, respectively between surveys 1 and 8 and passing of worms fell from 23.5% to 0.8% over the same period.
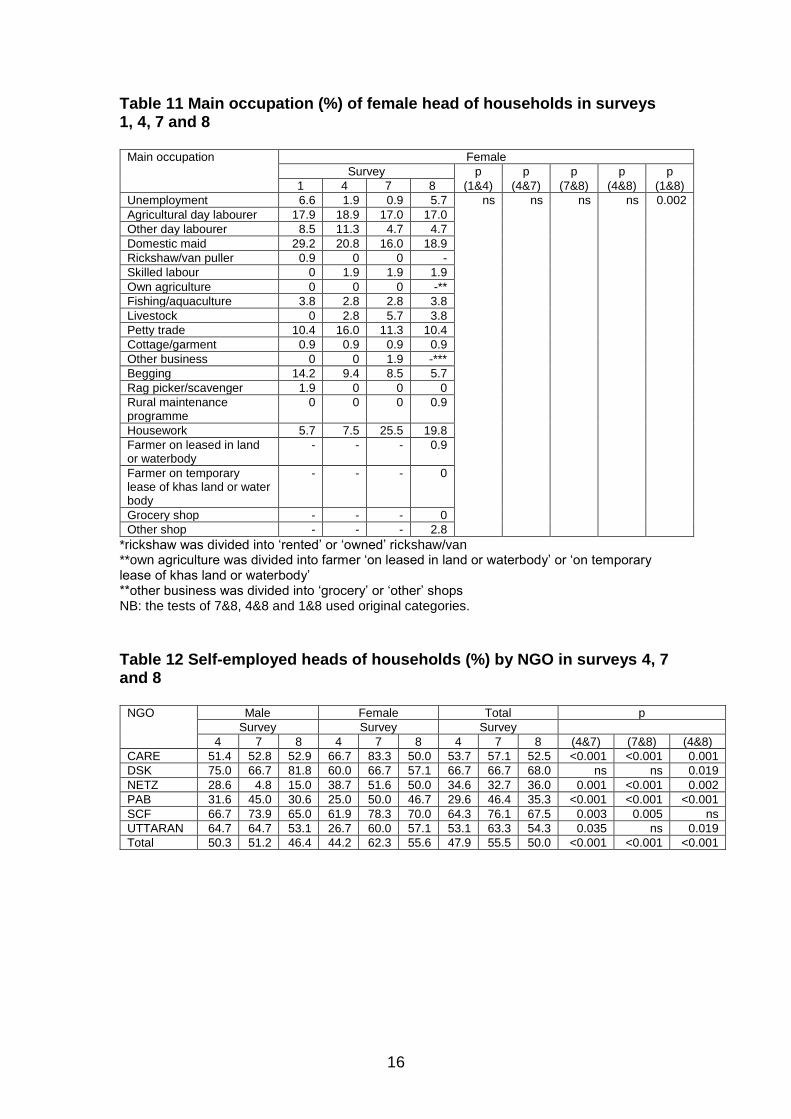
7. Employment: There were significant changes in the main occupation of both male and female headed households between surveys and primarily between surveys 1 and 8. Generally those employed in service and other business occupations increased in male headed households while in female headed households begging decreased significantly from 14.2% to 5.7% between surveys 1 and 8 but unemployment rose from 0.9% in survey 7 to 5.7% in survey 8. The self-employed fell by about 4% in male headed households but increased by about 10% in female head households between surveys
ii
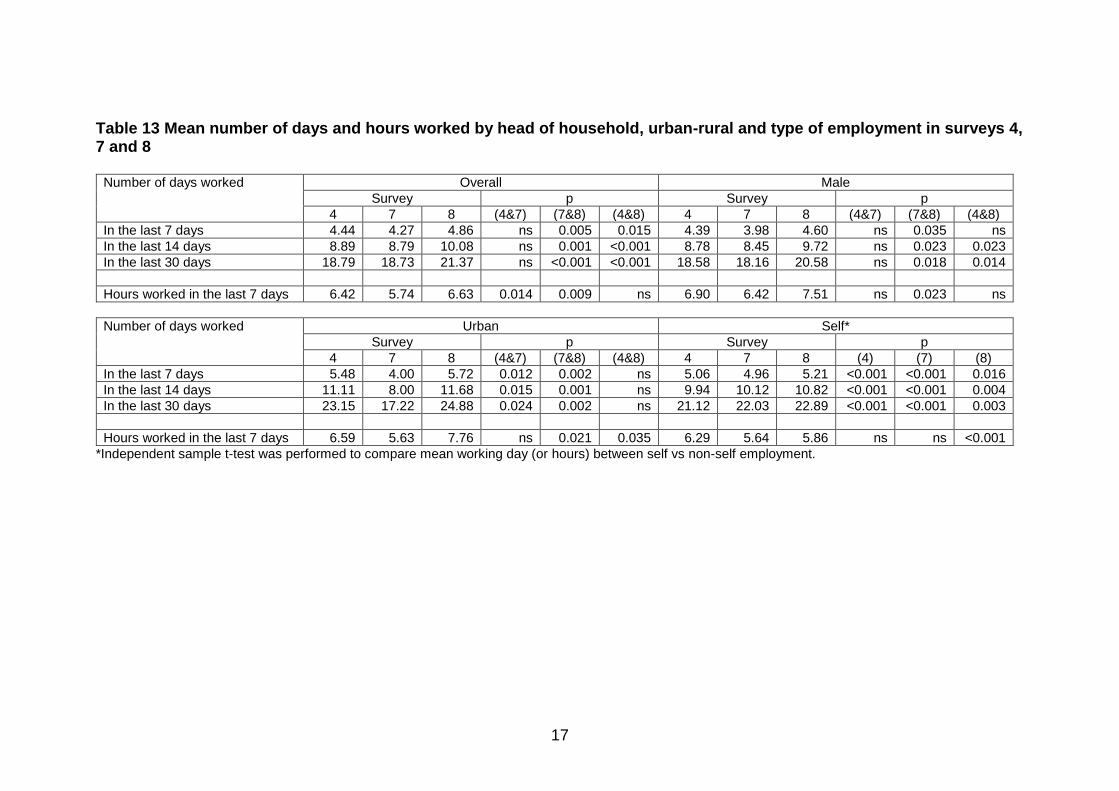
4 and 8. There was a significant increase in the number of days worked in the last 7, 14 and 30 days overall between surveys 7 and 8 as well as between surveys 4 and 8. Male head of households also increased their mean working days particularly between surveys 7 and 8. The self-employed worked more days in all surveys. Advanced sale of labour fell between surveys 4 and 7 and stayed at a similar low level in survey 8.
8. Land ownership: The percentage of households owning land increased very significantly from 14.7% in survey 1 to 27.2% in survey 4 and by a further 3.3% to 30.5% in survey 7 but then fell significantly to 21.3% in survey 8. The pattern of land ownership over the four surveys was very similar in male and female headed households.
9. Household ownership, size and structure: The percentage of households owning their own house increased significantly from 75.4% to 82.4% between surveys 1 and 4 and then fell slightly to 81.3% and 79.4% in surveys 7 and 8, respectively. The mean reported size of houses increased significantly from 13.5sqm in survey 1 to 15.6sqm in survey 8. Male headed houses were about 3.5sqm larger than female headed households but female houses continued to increase in size from just over 12sqm to over 13.5sqm between surveys 1 and 8, whereas male headed households did not show much change in size from survey 4 onwards. There was no significant change in materials used in house construction over the four surveys; walls were primarily made of grass etc, mud or tin sheet, roofs of tin sheet and floors of mud. Nearly 60% of households reported that their home was above the flood level but there was significant variation between NGOs; only 33.9% of PAB homes were reported as being above the flood level compared with 73.8% of CARE homes.
10. Electricity, water supply and defecation practices: There was a significant improvement in mains electrical supply in the rural areas over the surveys but even so over 86% did not have a mains supply in survey 8. All urban households had access to mains electricity in survey 8. There were highly significant changes in defecation practices in the rural areas with open defecation falling from 37.1% in survey 1 to 15.1% in survey 8. However households attaining the sanitation MDG fell significantly between surveys 7 and 8 from 75.1% to 60.8% mainly due to increase in pit latrine usage. There was increased usage of piped water between surveys 1 and 8 and reduction in use of pond water. In survey 8 nearly all urban households obtained their water from a piped supply or a tubewell, while over 80% of rural households obtained their water from a tubewell. In survey 8 nearly 70% of households had soap/ash close to the water supply or latrine, more so in SCF (89.1%) and UTTARAN (87.8%) households compared with 48.1% and 51.9% in DSK and NETZ households, respectively. Nearly 90% of households in survey 8 reported that all family members wear sandals.
11. Loans and cash savings: There was evidence of an increase in loans from survey 6 onwards up from a mean of 2973 Taka/household to 5483 Taka/household in survey 8. The percentage of households with savings increased from 35% in survey 1 to 84% in survey 5 and then fell slightly to 81% in surveys 6 and 7 and to 78% in survey 8. The mean savings reached a peak in survey 6 (6980 Taka/household) and fell to 3102 Taka/household in survey 7 and 2601 Taka/household in survey 8.

iii
12. Number and value of assets: There were highly significant increases in animal ownership between surveys 1 and 4 in both male and female headed households, particularly for cattle, goat and poultry but no significant changes thereafter except for ownership of calves which increased from 0.7% in survey 1 to 12.1% in survey 8. Overall there was a sixteen fold increase in the value of animals between March 2010 (mean 396 Taka) and March 2013 (mean 6689 Taka). There were significant increases in working equipment ownership in both male and female headed households particularly on rickshaws, and in male headed households on nets and agricultural equipment between surveys 1 and 4; only agricultural equipment showed an improvement between surveys 4 and 7 and 7 to 8. The total value of working equipment increased significantly between surveys 1, 4 and 7 (up from 269 Taka to 1722 Taka) but fell to 1400 Taka in survey 8. There was increased ownership of all household items especially mobile phone, wooden box, mattress and chair. The number of household belongings increased from a mean of 3.2 (maximum 13) in survey 1 to 4.9 in survey 8. Male headed household belongings were worth significantly more than female headed households in all four surveys and the gap reduced slightly between surveys 7 and 8 to about 1500 Taka. Total assets (excluding shops) increased substantially in both male and female headed households across the four surveys from 2,340 Taka in survey 1 to 13,472 Taka in survey 8. With the inclusion of shops, male headed households mean assets were over 18,000 Taka about 3500 Taka more than female headed households in survey 8.
13. Productive assets: Productive assets were defined as any animals (cattle, calf, goat, poultry and pigs), fishing net, rickshaw, boat, sewing machine, mobile phone and bicycle owned by the household. In survey 8 a mobile phone was owned by over 40% of households, while poultry and cattle were owned by about one third of households. Ownership of pigs, boat and sewing machine were all very low. Female headed households were more likely to own cattle, goats, poultry and a sewing machine, while male headed households were more likely to own a calf, pigs, fishing net, rickshaw, boat, mobile phone and a bicycle. Joint male and female ownership was apparent for all assets except for pigs and sewing machine. At least one productive asset was owned solely by 40.4% of adult female household members.
14. Users of productive assets: Female heads were more likely to look after animals and use a sewing machine, while male heads operated rickshaw, fishing net, boat and used a mobile phone and rode a bicycle. Joint usage by males and females was reported for all productive assets except for sewing machine and bicycle. At least one productive asset was operated solely by 40.1% of adult female household members; 51.5% of females do not own or use productive assets, 32% were both owners and users, 8.5% were owners but not users and the remaining 8.1% were users but not owners.
15. Income: Over the eight surveys the mean per capita income in both urban and rural areas peaked in survey 8 at 60.9 Taka pppd and 33.1 Taka pppd, respectively. The mean income in urban areas was significantly higher than in the rural areas and male headed households per capita income was significantly higher than in female headed households and the difference was apparent in all eight

iv
surveys. In-kind income contributed about 20% of total income over the more recent surveys.
16. Expenditure: Mean food per capita expenditure did not show a consistent pattern over the eight surveys but was highest in survey 8 in both male and female headed households. Spending on household items was much higher in the urban areas and it rose from about 14 Taka pppd in survey 1 to about 25 Taka in surveys 7 and 8. Work related per capita expenditure increase very slightly from 0.25 Taka pppd in survey 1 to about 1 Taka pppd in survey 8. Total per capita expenditure increased significantly over the eight surveys from a low in survey 2 of 19.4 Taka pppd up to the highest in survey 8 of 28.4 Taka pppd. There were no significant differences in mean expenditure between male and female headed households. Overall the urban areas had the greatest mean expenditure and the gap between urban and rural households increased from about 20 Taka pppd in survey 6 to 26 Taka pppd in survey 8.
17. Difference between income and expenditure: The difference between household income and expenditure (credit/debit balance) was calculated for each household and the pattern of credit/debit over the eight surveys revealed that, on average, households went from debit in surveys 1 to 3 (-514, -18, -52 Taka/month respectively) to increasing credit in surveys 4 to 8 (+590, +882, +1116, 1134 and +1283 Taka/month, respectively. Male headed households were significantly more in credit than female headed households over the 8 surveys by, on average, 400 Taka/month.
18. Household food intake and security: Households were asked how often family members had eaten 13 food items in the 7 days prior to the study. Rice was eaten by nearly all households in all eight surveys and there was a general increase in consumption of poultry and meat while eggs consumption doubled from 28.7% in survey 1 to 57.7% in survey 8. In the total sample the mean number of foods consumed in the last 7 days increased significantly from 5.9 in survey 1 to 7.6 in survey 5 and then fell to 7.1 in survey 8. Overall food diversity rose from 4.3 in survey 1 to 5.3 in survey 5 and fell slightly to 5.2 for surveys 6 to 8.
19. Household food coping strategies: The households were asked about the coping strategies used as a result of financial hardship in the seven days prior to the survey. There were significant improvements in all 10 strategies between surveys 1 and 8. The percentage of households reporting eating smaller portions of food fell between March 2010 and March 2013 from 83.8% to 15.4%; eating less than 3 meals a day (down from 69.9% to 5.9%), eating food of less quality (down from 62.5% to 13.2%). Borrowing money to buy food fell from 19.7% to 2.3% and buying food on credit fell from 29.0% to 4.4%. There was significant improvement (reduction) in food coping strategies with a fall in mean from 3.5 in survey 1 to 0.4 in survey 7 followed by a slight worsening in survey 8 to 0.6.
20. Social empowerment: In survey 8 a wider range of questions were asked to male and female household heads and to female spouses. The most significant change was the 25% decline in knowledge about government programmes designed for the poor between surveys 1 and 4 in both males and females. For females feeling frightened about moving alone outside the village nearly halved between survey 1

v
(39.8%) and survey 8 (22.0%). In survey 8 about two thirds of males reporting feeling comfortable speaking and participating in community groups, addressing UP chairmen and undertaking some household work while the comparable percentages for females were significantly lower at under 50%. About 1 in 7 households would marry off there daughter if they had income constraints and about a third of males and females were members of a social or community group. Nearly half of the men (49.6%) and just over a third (38.2%) of women reported that decision making roles in their households had changed since joining the shiree programme. For females there were significant improvements in all areas of household decision making while males reported improvements in four areas, children’s education, buying and selling large assets, taking or repaying a loan and important family matters.
21. Adult nutritional status: Mean BMI increased significantly by about 0.3 kgm-2 between surveys 1 and 8 but the percentages with CED remained the same in surveys 1 and 8. Mean haemoglobin did not show any significant change over the four surveys but the prevalence of anaemia rose in males by 2.4% and by 5.8% in females between surveys 1 and 8.
22. Child nutritional status: There were no significant changes in mean height-for-age, weight-for-age or weight-for-height across the four surveys, but there was a highly significant improvement in haemoglobin concentration up to survey 7 and a small decline in survey 8. The percentage of children who were stunted fell from close to 50% in surveys 1 and 4 to 40% in survey 7 but worsened slightly to 41.8% in survey 8; underweight worsened from 47.3% in survey 1 to 50.9% in survey 8 while weight-for-height was the same in surveys 1 and 8 at 18.2%. Only childhood anaemia showed a significant improvement reducing from 56.4% in survey 1 to 29.1% in survey 8.
vi
List of Contents Executive Summary .......................................................................................... i List of Tables.................................................................................................. vii List of Figures ................................................................................................ iix
1. Background .................................................................................................. 1
2. Aims of the annual surveys .......................................................................... 3
3. Study design ................................................................................................ 3
4. Fieldwork...................................................................................................... 4
5. Survey results .............................................................................................. 6
5.1 Basic socio-demographic characteristics of the sample ......................... 6
5.2 Schooling ................................................................................................ 7
5.3 Chronic illness within the household ...................................................... 8
5.4 Morbidity status ...................................................................................... 9
5.5 Employment ......................................................................................... 13
5.6 Access to land ...................................................................................... 18
5.7 Housing, water access, sanitation and electricity ................................. 19
5.7.1 Home ownership ............................................................................ 19
5.7.2 Size of house ................................................................................. 19
5.7.3. House construction ....................................................................... 21
5.7.4 Source of drinking water ................................................................ 21
5.7.5 Electricity supply ............................................................................ 22
5.7.6 Defecation practices ...................................................................... 22
5.8 Cash loans and savings ....................................................................... 25
5.8.1 Cash loans ..................................................................................... 25
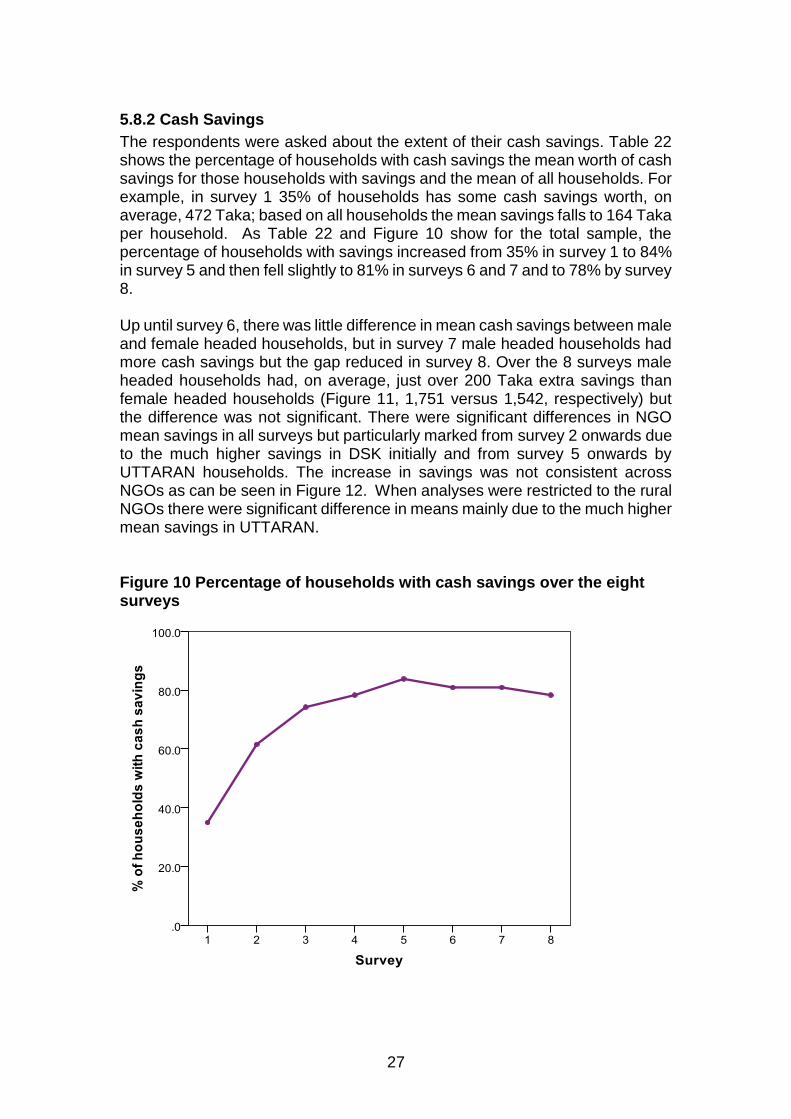
5.8.2 Cash Savings ................................................................................. 27
5.9 Household assets ................................................................................. 30
5.9.1 Animals .......................................................................................... 30
5.9.2 Working equipment ........................................................................ 30
5.9.3 Household belongings ................................................................... 30
5.9.4 Total household assets .................................................................. 31
5.9.5 Ownership of productive assets ..................................................... 31
5.10 Household income .............................................................................. 49
5.11 Expenditure ........................................................................................ 54
5.12 Difference between household income and expenditure .................... 60
5.13 Household food intake ........................................................................ 62
5.14 Household food security ..................................................................... 67
5.15 Social empowerment .......................................................................... 70
5.16 Nutritional status ................................................................................. 74
5.16.1 Head of Household ...................................................................... 74
5.16.2 Under 5 year old children ............................................................. 77
vii
List of Tables
Table 1 Location of the 6 Scale Fund Round One, Phase One NGOs and
number of households ...................................................................... 2
Table 2 Number of household participated in the eight surveys ...................... 6
Table 3 Attrition (%) between surveys 1 and 8 by NGO and Female headed households (%) by NGO ................................................................... 6
Table 4 Prevalence (%) of chronic illness in surveys 1, 4, 7 and 8 .................. 8
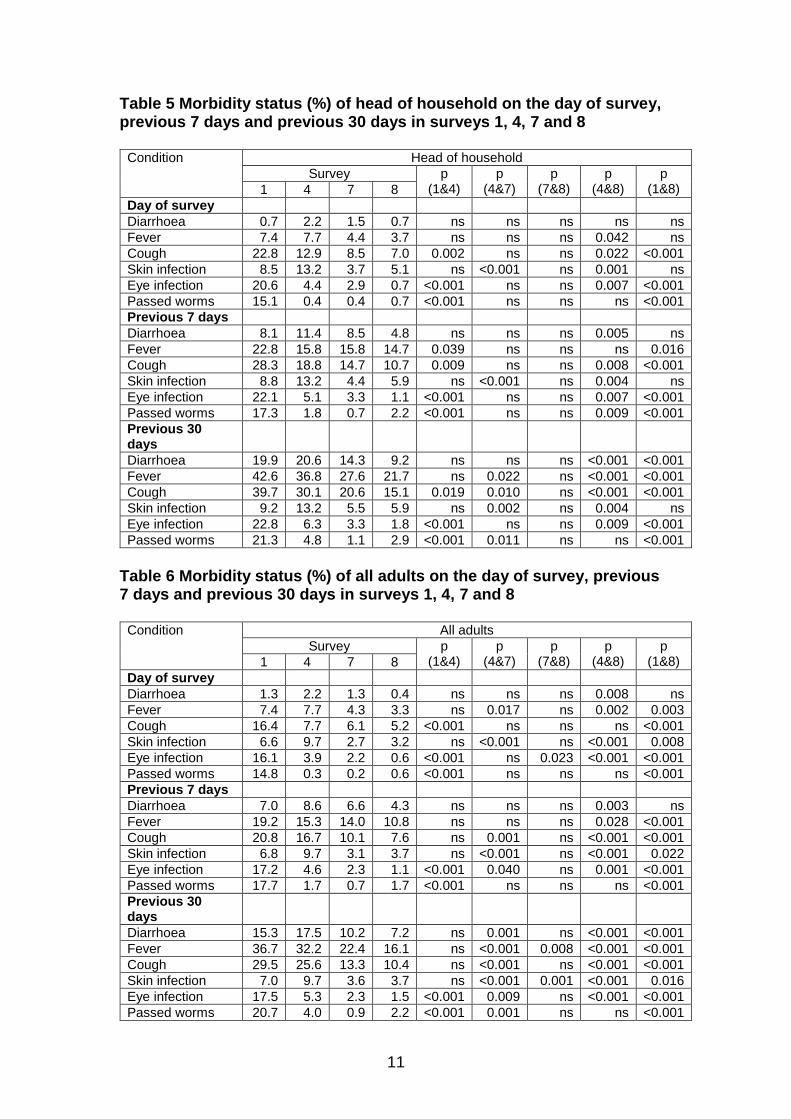
Table 5 Morbidity status (%) of head of household on the day of survey, previous 7 days and previous 30 days in surveys 1, 4, 7 and 8 ..... 11
Table 6 Morbidity status (%) of all adults on the day of survey, previous 7 days and previous 30 days in surveys 1, 4, 7 and 8 ............................... 11
Table 7 Morbidity status (%) of children 5-15 years old on the day of survey, previous 7 days and previous 30 days in surveys 1, 4, 7 and 8 ..... 12
Table 8 Morbidity status (%) of children < 5 years old on the day of survey, previous 7 days and previous 30 days in surveys 1, 4, 7 and 8 ..... 12
Table 9 Morbidity status (%) of all household members on the day of survey, previous 7 days and previous 30 days in surveys 1, 4, 7 and 8 ..... 13
Table 10 Main occupation (%) of male head of households in surveys 1, 4, 7 and 8 .............................................................................................. 15
Table 11 Main occupation (%) of female head of households in surveys 1, 4, 7 and 8 .............................................................................................. 16
Table 12 Self-employed heads of households (%) by NGO in surveys 4, 7 and 8 ..................................................................................................... 16
Table 13 Mean number of days and hours worked by head of household, urban-rural and type of employment in surveys 4, 7 and 8 ............. 17
Table 14 Land ownership and access (%) by head of household in surveys 1, 4, 7 and 8 ....................................................................................... 18
Table 15 Access to land (%) by NGO in surveys 1, 4, 7 and 8 ...................... 18
Table 16 Home ownership (%) in surveys 1, 4, 7 and 8 ................................. 19
Table 17 Materials used in house construction in surveys 1, 4, 7 and 8 ........ 21
Table 18 Source of drinking water in surveys 1, 4, 7 and 8 ........................... 21
Table 19 Electrical supply (%) by urban/rural in surveys 1, 4, 7 and 8 ........... 24
Table 20 Defecation practices (%) by urban/rural in surveys 1, 4, 7 and 8 .... 24
Table 21 Number of loans, average amount of loan over the 8 surveys ........ 26
Table 22 Cash savings by NGO over the 8 surveys ...................................... 29
Table 23 Ownership (%) of specific animals in surveys 1, 4, 7 and 8 by head of household ................................................................................... 33
Table 24 Ownership (%) of any animal by NGO and head of household in surveys 1, 4, 7 and 8 ...................................................................... 34
Table 25 Ownership (%) of specific working equipment in surveys 1, 4, 7 and 8 ..................................................................................................... 37
Table 26 Ownership (%) of working equipment by NGO and head of household in surveys 1, 4, 7 and 8 ................................................. 38
Table 27 Ownership (%) of specific household belongings (%) by head of household in surveys 1, 4, 7 and 8 ................................................. 41
Table 28 Average amount (Taka) spent on assets by head of household in surveys 1, 4, 7 and 8 ...................................................................... 47
Table 29 Average amount (Taka) spent on assets by NGO and head of household in surveys 1, 4, 7 and 8 ................................................. 47
Table 30 Owners of productive assets (%) in survey 8 .................................. 48
Table 31 Users of productive assets (%) in survey 8 ..................................... 48
viii
Table 32 Mean income per capita (Taka per person per day) by head of household over the eight surveys (using HIES criteria which do not include in-kind income) ................................................................... 50
Table 33 In-kind income as a percentage of total income by NGO over the eight surveys .................................................................................. 50
Table 34 Mean expenditure per capita (HIES Taka per person per day) by head of household over the eight surveys ...................................... 55
Table 35 Number of days (%) in the last week that household members consumed foodstuffs over the eight surveys .................................. 64
Table 36 Food coping strategies over the eight surveys ................................ 68
Table 37 Social empowerment (%, male replies) in surveys 1, 4, 7 and 8 ..... 70
Table 38 Social empowerment (%, female replies) in surveys 1, 4, 7 and 8 .. 70
Table 39 Additional empowerment questions asked only in survey 8 ............ 71
Table 40 Influence on decisions in your household (male replies, survey 8 only) ................................................................................................ 71
Table 41 Influence on decisions in your household (female replies, survey 8 only) ................................................................................................ 71
Table 42 Decision making (%) before and after joining the shiree programme (male replies, survey 8 only) ........................................................... 73
Table 43 Decision making (%) before and after joining the shiree programme (female replies, survey 8 only) ........................................................ 73
Table 44 Nutritional status by head of household in surveys 1, 4, 7 and 8 .... 75
Table 45 Changes in nutritional status of children in surveys 1, 4, 7 and 8 ... 77
ix
List of Figures
Figure 1 Design of annual panel socio-economic and nutritional survey in
CMS3 (including 10% estimated attrition each year) ........................ 3
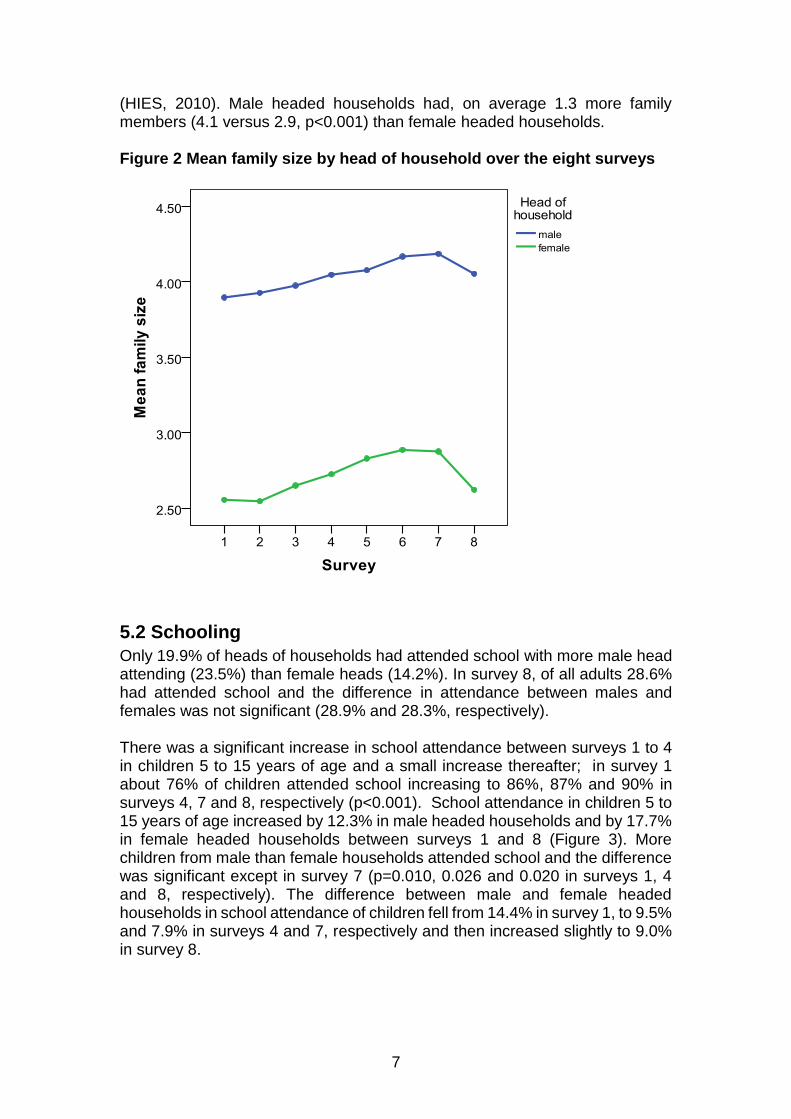
Figure 2 Mean family size by head of household over the eight surveys ......... 7
Figure 3 School attendance (%) by head of household in surveys 1, 4, 7 and 8 ......................................................................................................... 8
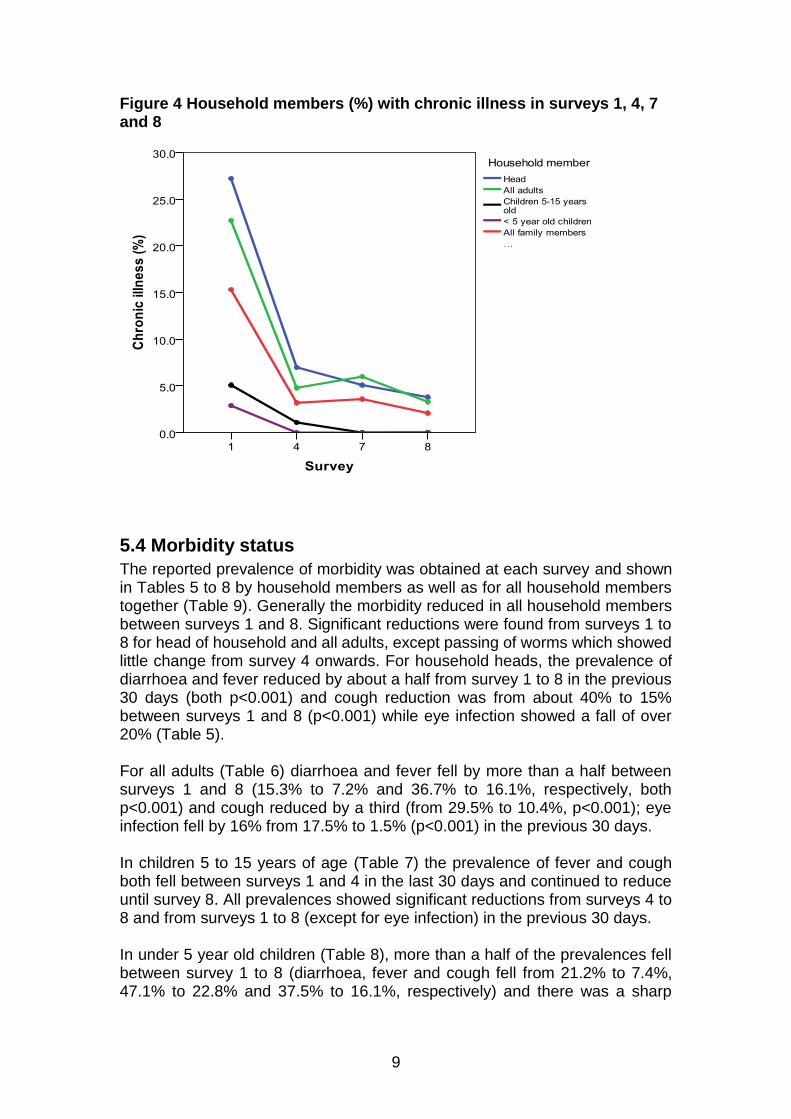
Figure 4 Household members (%) with chronic illness in surveys 1, 4, 7 and 8 ......................................................................................................... 9
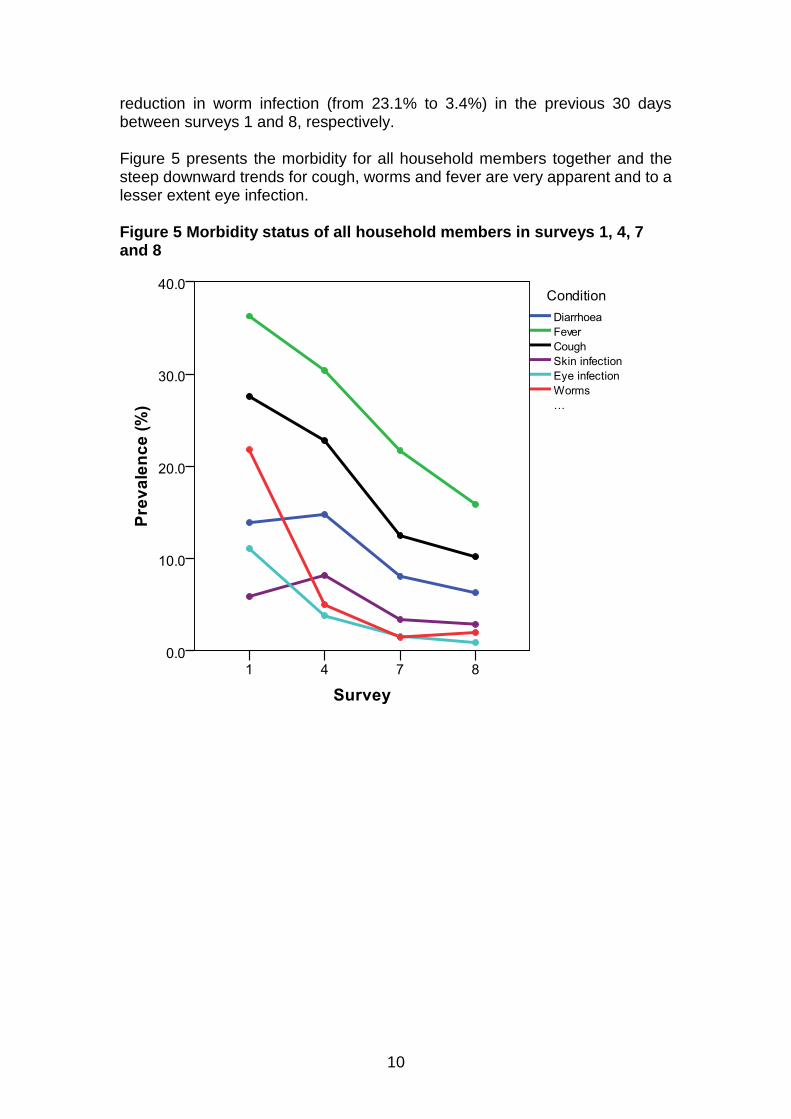
Figure 5 Morbidity status of all household members in surveys 1, 4, 7 and 8 10
Figure 6 Mean household size by head of household in surveys 1, 4, 7 and 8 ....................................................................................................... 20
Figure 7 Mean household size by NGO in surveys 1, 4, 7 and 8 ................... 20
Figure 8 Reduction in households with no mains electrical supply and using open defecation in rural areas in surveys 1, 4, 7 and 8 .................. 22
Figure 9 Mean household loans (Taka) over the eight surveys ..................... 25
Figure 10 Percentage of households with cash savings over the eight surveys ....................................................................................................... 27
Figure 11 Mean cash savings by head of household over the eight surveys . 28
Figure 12 Mean cash savings by NGO over the eight surveys ...................... 28
Figure 13 Ownership (%) of animals in surveys 1, 4, 7 and 8 ........................ 35
Figure 14 Ownership (%) of any animals by NGO in surveys 1, 4, 7 and 8 ... 35
Figure 15 Mean value of animals by head of household in surveys 1, 4, 7 and 8 ..................................................................................................... 36
Figure 16 Mean value of animals by NGO in surveys 1, 4, 7 and 8 ............... 36
Figure 17 Ownership (%) of equipment by head of household in surveys 1, 4, 7 and 8 ........................................................................................... 39
Figure 18 Ownership (%) of equipment by NGO in surveys 1, 4, 7 and 8 ...... 39
Figure 19 Mean value of equipment by head of household in surveys 1, 4, 7 and 8 .............................................................................................. 40
Figure 20 Mean value of equipment by NGO in surveys 1, 4, 7 and 8 ........... 40
Figure 21 Mean number of household goods owned by head of household in surveys 1, 4, 7 and 8 ...................................................................... 42
Figure 22 Mean number of household goods owned by NGO over surveys 1, 4, 7 and 8 ....................................................................................... 42
Figure 23 Mean value of household goods by head of household in surveys 1, 4, 7 and 8 ....................................................................................... 43
Figure 24 Mean value of household goods including shop by head of household in surveys 1, 4, 7 and 8 ................................................. 43
Figure 25 Mean value of household goods by NGO in surveys 1, 4, 7 and 8 44
Figure 26 Mean value of household goods including shop by NGO in surveys 1, 4, 7 and 8 ................................................................................... 44
Figure 27 Mean value of total assets by head of household in surveys 1, 4, 7 and 8 .............................................................................................. 45
Figure 28 Mean value of total assets including shops by head of household in surveys 1, 4, 7 and 8 ...................................................................... 45
Figure 29 Mean value of total assets by NGO in surveys 1, 4, 7 and 8 ......... 46
Figure 30 Mean value of total assets including shops by NGO in surveys 1, 4, 7 and 8 ........................................................................................... 46
Figure 31 Mean Taka income pppd by head of household over the eight surveys ........................................................................................... 51
Figure 32 Mean Taka income pppd by NGO over the eight surveys.............. 51
x
Figure 33 Mean in-kind income as a percentage of total income by head of household over the eight surveys ................................................... 52
Figure 34 Mean in-kind income by percentage of total income by NGO over the eight surveys ............................................................................ 52
Figure 35 Mean in-kind income by head of household over the eight surveys ....................................................................................................... 53
Figure 36 Mean in-kind income by NGO over the eight surveys .................... 53
Figure 37 Mean food expenditure Taka pppd by head of household over the eight surveys .................................................................................. 56
Figure 38 Mean food expenditure Taka pppd by NGO over the eight surveys ....................................................................................................... 56
Figure 39 Mean household expenditure pppd by head of households over the eight surveys .................................................................................. 57
Figure 40 Mean household expenditure pppd by NGO over the eight surveys ....................................................................................................... 57
Figure 41 Mean work-related expenditure pppd by head of household over the eight surveys .................................................................................. 58
Figure 42 Mean work-related expenditure pppd by NGO over the eight surveys ........................................................................................... 58
Figure 43 Mean total expenditure pppd by head of household over the eight surveys ........................................................................................... 59
Figure 44 Mean total expenditure pppd by NGO over the eight surveys ........ 59
Figure 45 Mean monthly net income by head of household over the eight surveys ........................................................................................... 61
Figure 46 Mean monthly net income by NGOs over the eight surveys .......... 61
Figure 47 Poultry and meat consumption (%) in the 7 previous days over the eight surveys .................................................................................. 62
Figure 48 Mean number of food types consumed by head of household over the eight surveys ............................................................................ 65
Figure 49 Mean number of food types consumed by NGO over the eight surveys ........................................................................................... 65
Figure 50 Mean food diversity by head of household over the eight surveys . 66
Figure 51 Mean food diversity by NGO over the eight surveys ...................... 66
Figure 52 Mean food coping strategy by head of household over the eight surveys ........................................................................................... 69
Figure 53 Mean food coping strategy by NGO over the eight surveys ........... 69
Figure 54 Mean weight by head of household in surveys 1, 4, 7 and 8 ......... 76
Figure 55 Mean BMI by head of household in surveys 1, 4, 7 and 8 ............. 76
Figure 56 Mean haemoglobin by head of household in surveys 1, 4, 7 and 8 77
Figure 57 Prevalence (%) of stunting, underweight, wasting and anaemia in children in surveys 1, 4, 7 and 8 ..................................................... 78
1
1. Background EEP/shiree (www.shiree.org) is a challenge fund supported by UKAid from the Department for International Development (DFID) in partnership with the Government of Bangladesh (GoB) to lift 1 million people out of extreme poverty by 2015. Harewelle International Ltd (now part of the Ecorys group) and PMTC Bangladesh Ltd manage the fund in consultation with EEP/shiree consortium partners including the Centre for Development Studies (CDS) at Bath University, the British Council and Unnayan Shamannay. Professor Nicholas Mascie-Taylor and Dr Rie Goto from The Division of Biological Anthropology, University of Cambridge, helped design the panel surveys and have been responsible for the data analyses and report writing on CMS3. EEP/shiree is one in DFID’s portfolio of projects designed to reduce extreme poverty and vulnerability in Bangladesh.
The EEP/shiree Challenge Fund is worth £65 million (around USD$100M) and is being disbursed over a period of 8 years (2008-2015). It is also referred to as shiree (the Bengali word for steps and an acronym for "Stimulating Household Improvements Resulting in Economic Empowerment") reflecting the aim of providing households ways out of extreme poverty. EEP/shiree also supports high-quality research and disseminates lessons learned and key findings from the programme’s experience with the aim of transforming the way in which extreme poverty is approached by government, donors, NGOs and the public. It seeks to increase the knowledge base on the distinct experiences of extreme poverty in Bangladesh, and to raise awareness of extreme poverty in an international context. Shiree has developed, and will continue to develop and enhance, the Change Monitoring System (CMS). A brief summary of the five CMS tools currently being used are:- CMS 1: The Household Profile Purpose: to provide a detailed assessment of the status of all shiree households before significant project interventions have taken place. To provide the baseline from which to monitor change over time. CMS 2: Monthly Snapshot Purpose: to enable an assessment of trends: what has changed at the household level? And what has happened (both project and non project events) that may have contributed to changes? CMS 3: Socio-economic and Anthropometric Surveys Purpose: to provide in depth socio-economic and nutritional data allowing an assessment of longer term change and the impact of project interventions. CMS 4: Participatory review and project analysis Purpose: to provide a forum for beneficiaries to explain changes in their lives and the reasons for these changes, as well as creating a platform for Innovation

2
Fund NGOs to adapt and improve their innovations according to the needs of beneficiaries. CMS 5: Tracking studies Purpose: to provide quality longitudinal tracking studies documenting the dynamics of extreme poverty as it is experienced and changes in beneficiaries’ lives as a result of project interventions. CMS3 for the Scale Fund NGOs commenced in October 2009 with a pilot study and the longitudinal study of the same households commenced in March 2010. On an annual basis the survey is enhanced to include anthropometric data (Body Mass Index, Haemoglobin level). The panel survey is administered with a statistically significant sub-sample of beneficiary households. This report provides information on the changes in socio-demographic and economic characteristics of households (including household assets, income and expenditure and social empowerment) and the nutritional status of parents and their < 5 year old children between March 2010 and March 2013 for Round One Phase One NGOs only; CARE, Dushtha Shasthya Kendra (DSK), NETZ, Practical Action Bangladesh (PAB), Save the Children (SCF), UTTARAN. Three additional Round 2 Scale Fund NGOs (Concern, Oxfam, Caritas) commenced work in 2012 and it will be reported separately. Under Round One Phase One shiree has been working with 6 NGOs. Of which 2 NGOs (CARE and PAB) are working in the far north-west of Bangladesh, NETZ in the north-west, DSK in two urban slums in Dhaka and SCF and UTTARAN in the south-west (Table 1). The total number of households that the 6 NGOs are working with is 82,850. Table 1 Location of the 6 Scale Fund Round One, Phase One NGOs and number of households
NGO Location Number of Households
CARE DSK NETZ PAB SCF UTTARAN
Gaibandha, Nilphamari, Rangpur, Lalmonirhat Dhaka slums Naogaon Gaibandha, Nilphamari, Rangpur, Lalmonirhat Khulna, Bagerhat Satkira, Khulna
20,000 10,000
9,000 16,850 15,000 12,000
3
2. Aims of the annual surveys Through the annual surveys the project aims to determine:-
a) household annual change in socio-economic and empowerment status as a result of the shiree programme
b) intra-individual (primarily mother and <5 year old children) annual change in nutritional status
c) differences in nutritional, socio-economic status and empowerment between new and old recruits within the same NGO, and in the longer term
d) differences in nutrition, socio-economic status and empowerment between participants from different NGOs
e) differences between rural and urban cohorts f) whether households have exited from extreme poverty or graduated
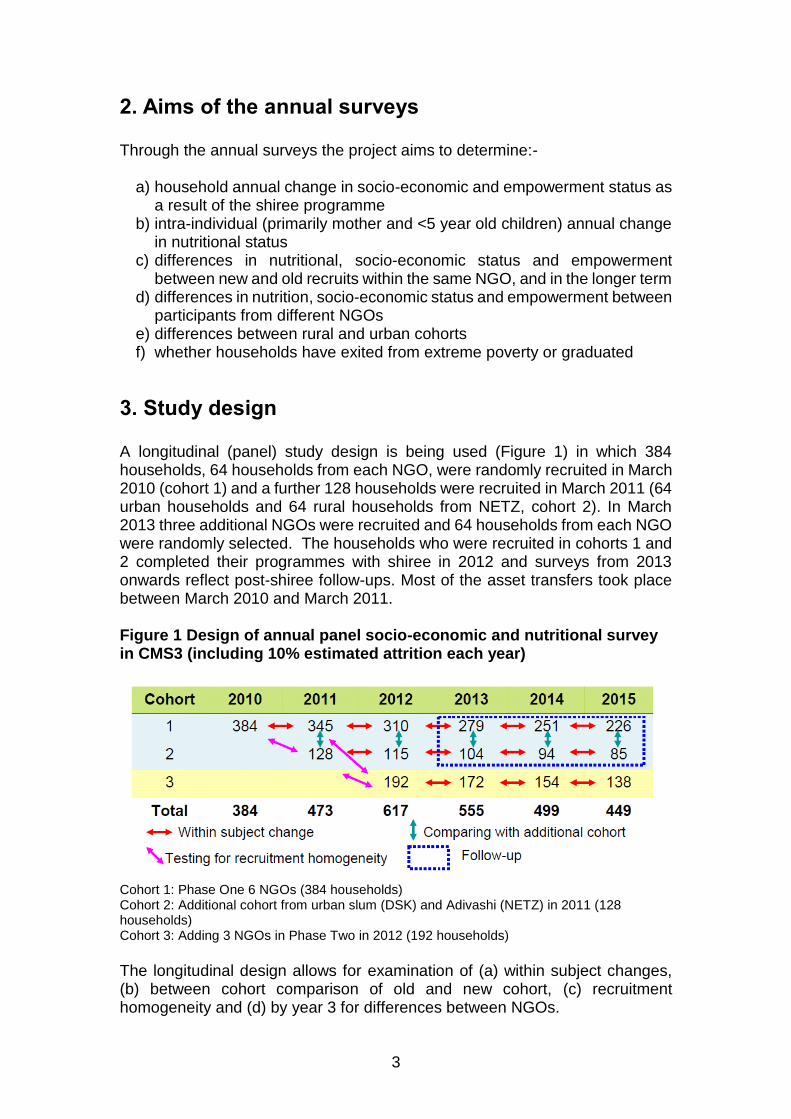
3. Study design A longitudinal (panel) study design is being used (Figure 1) in which 384 households, 64 households from each NGO, were randomly recruited in March 2010 (cohort 1) and a further 128 households were recruited in March 2011 (64 urban households and 64 rural households from NETZ, cohort 2). In March 2013 three additional NGOs were recruited and 64 households from each NGO were randomly selected. The households who were recruited in cohorts 1 and 2 completed their programmes with shiree in 2012 and surveys from 2013 onwards reflect post-shiree follow-ups. Most of the asset transfers took place between March 2010 and March 2011. Figure 1 Design of annual panel socio-economic and nutritional survey in CMS3 (including 10% estimated attrition each year)
Cohort 1: Phase One 6 NGOs (384 households) Cohort 2: Additional cohort from urban slum (DSK) and Adivashi (NETZ) in 2011 (128 households) Cohort 3: Adding 3 NGOs in Phase Two in 2012 (192 households)
The longitudinal design allows for examination of (a) within subject changes, (b) between cohort comparison of old and new cohort, (c) recruitment homogeneity and (d) by year 3 for differences between NGOs.
4
In March 2010, 64 representative households were selected from each of the 6 NGOs on the basis of the variables provided by the NGOs, usually the reported monthly income, educational level of the head of household, presence of under five year old in the household, age of the household head, household size and sex of household head. A representative back-up list was also generated in case households were absent on the day of the survey. A similar exercise was undertaken in the selection of the additional 128 households in March 2011. The survey of Phase Two 3 NGOs (192 households) commenced in March 2012 (cohort 3). The report describes differences between NGOs but as the interventions and asset transfer programmes varied between NGOs any statistical differences reflect a combination of variation in programmes, geographical location as well as social heterogeneity including gender disparities. The cut-off for significance is usually p< 0.05 i.e. a ‘significant’ result would occur 1 in 20 times by chance. As the p value becomes smaller (i.e. towards 0) the likelihood of a result being significant by chance becomes less likely, e.g. p =0.01, indicates that 1 in hundred times this result would be significant by chance alone, while p =0.001, only 1 in a thousand times significant by chance alone. A non-significant result is indicated by p ns.
4. Fieldwork The field work for CMS3 in 2013 covered 9 NGOs; 1) Scale Fund Round I (6 NGOs) and 2) Scale Fund Round II (3 NGOs).
The survey was completed in 41 days commencing on 23 February 2013 and finishing on 5 April 2013 including 12 days for training (information from 32 households in Oxfam was collected on 18 April separately in order to avoid unrest due to the political situation). The survey was conducted along with a nutrition survey of Infant and Young Children Feeding (IYCF) as part of a Scale Fund Nutrition programme. A total of 46 people were involved in conducting the survey comprising 1 Researcher from Cambridge University, 4 shiree CMS3 staff (3 staff members from the Management Information Unit and 1 staff member from the Nutrition Unit), 9 Research Assistants from the NGOs, 8 Measurers and 24 Enumerators. A flexible survey team structure was used mainly involving 2 sub-teams. Each team was organised into two groups, comprising 8 members (6 enumerators who were responsible for the questionnaire and 2 measurers who were responsible for taking anthropometric measurements and haemoglobin levels) with supervisors (Researcher, shiree staff, Research Assistants) to supervise the questionnaire and nutrition data collection. During the time the 6 enumerators were completing the questionnaires, the 2 measurers took the nutrition data in each household. In one day 16 households were visited by each team (32 households in total), hence it took 2 days usually to survey each

5
NGO, except NETZ (3 days) and DSK (4 days) because of the additional households. The timetable allowed for some slippage as well as movement from 1 NGO to the next. A trained Bengali enumerator asked a series of pre-tested questions to the head of household (or if the male head was absent, his spouse). The structured questionnaire covered 9 key areas:-
a) socio-demographic characteristics b) disability, chronic illness and health status of all household members c) household land ownership d) housing size and structure, water, sanitation and electricity e) cash loans f) household assets g) household income and expenditure h) household food intake and food security i) gender and empowerment issues
The interview usually lasted about 1 hour. At the same time the interviews were being carried out, the height, weight and haemoglobin levels of the mother and father, if available, and all children < 5 years of age were measured (some of follow-up children became more than 5 years of age). Adult height data were carefully checked by the supervisors with previous data collected in March 2011 and 2012.
6
5. Survey results
5.1 Basic socio-demographic characteristics of the sample
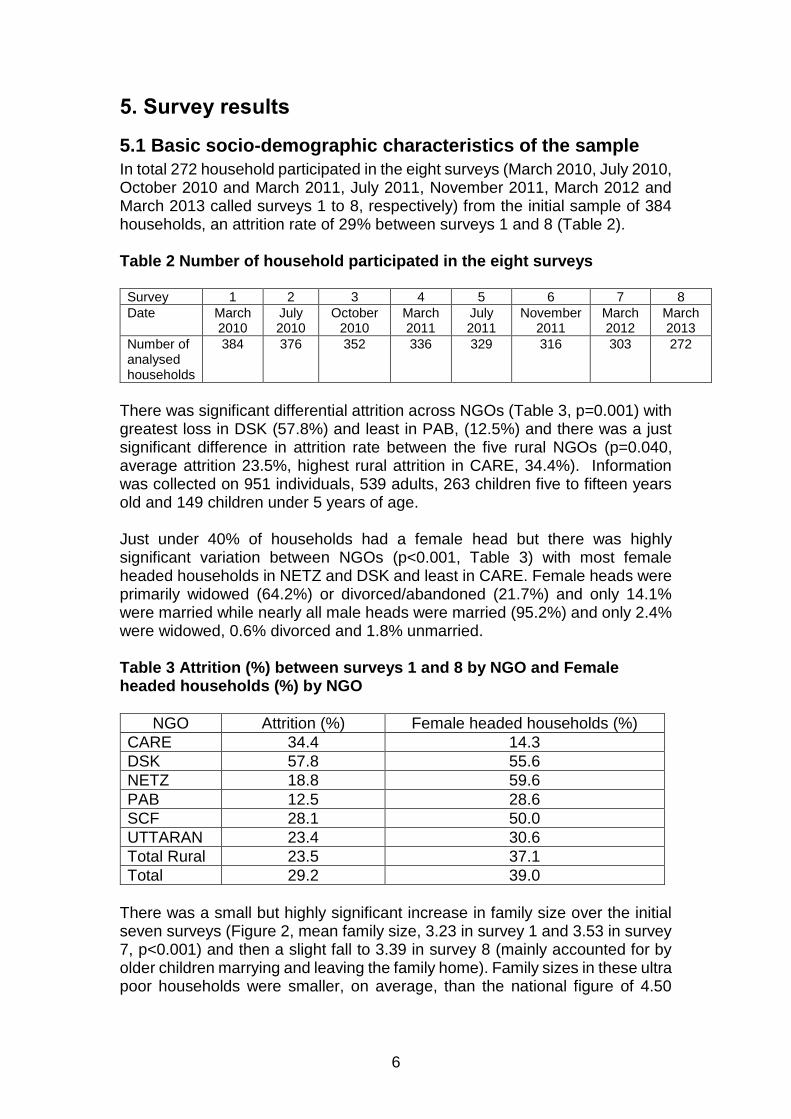
In total 272 household participated in the eight surveys (March 2010, July 2010, October 2010 and March 2011, July 2011, November 2011, March 2012 and March 2013 called surveys 1 to 8, respectively) from the initial sample of 384 households, an attrition rate of 29% between surveys 1 and 8 (Table 2). Table 2 Number of household participated in the eight surveys
Survey 1 2 3 4 5 6 7 8
Date March 2010
July 2010
October 2010
March 2011
July 2011
November 2011
March 2012
March 2013
Number of analysed households
384 376 352 336 329 316 303 272
There was significant differential attrition across NGOs (Table 3, p=0.001) with greatest loss in DSK (57.8%) and least in PAB, (12.5%) and there was a just significant difference in attrition rate between the five rural NGOs (p=0.040, average attrition 23.5%, highest rural attrition in CARE, 34.4%). Information was collected on 951 individuals, 539 adults, 263 children five to fifteen years old and 149 children under 5 years of age. Just under 40% of households had a female head but there was highly significant variation between NGOs (p<0.001, Table 3) with most female headed households in NETZ and DSK and least in CARE. Female heads were primarily widowed (64.2%) or divorced/abandoned (21.7%) and only 14.1% were married while nearly all male heads were married (95.2%) and only 2.4% were widowed, 0.6% divorced and 1.8% unmarried. Table 3 Attrition (%) between surveys 1 and 8 by NGO and Female headed households (%) by NGO
NGO Attrition (%) Female headed households (%)
CARE 34.4 14.3
DSK 57.8 55.6
NETZ 18.8 59.6
PAB 12.5 28.6
SCF 28.1 50.0
UTTARAN 23.4 30.6
Total Rural 23.5 37.1
Total 29.2 39.0
There was a small but highly significant increase in family size over the initial seven surveys (Figure 2, mean family size, 3.23 in survey 1 and 3.53 in survey 7, p<0.001) and then a slight fall to 3.39 in survey 8 (mainly accounted for by older children marrying and leaving the family home). Family sizes in these ultra poor households were smaller, on average, than the national figure of 4.50
7
(HIES, 2010). Male headed households had, on average 1.3 more family members (4.1 versus 2.9, p<0.001) than female headed households. Figure 2 Mean family size by head of household over the eight surveys
5.2 Schooling
Only 19.9% of heads of households had attended school with more male head attending (23.5%) than female heads (14.2%). In survey 8, of all adults 28.6% had attended school and the difference in attendance between males and females was not significant (28.9% and 28.3%, respectively). There was a significant increase in school attendance between surveys 1 to 4 in children 5 to 15 years of age and a small increase thereafter; in survey 1 about 76% of children attended school increasing to 86%, 87% and 90% in surveys 4, 7 and 8, respectively (p<0.001). School attendance in children 5 to 15 years of age increased by 12.3% in male headed households and by 17.7% in female headed households between surveys 1 and 8 (Figure 3). More children from male than female households attended school and the difference was significant except in survey 7 (p=0.010, 0.026 and 0.020 in surveys 1, 4 and 8, respectively). The difference between male and female headed households in school attendance of children fell from 14.4% in survey 1, to 9.5% and 7.9% in surveys 4 and 7, respectively and then increased slightly to 9.0% in survey 8.

8
Figure 3 School attendance (%) by head of household in surveys 1, 4, 7 and 8
5.3 Chronic illness within the household
Generally the prevalence of chronic illness reduced from survey 1 to 4 and the low prevalence continued until survey 8 (Table 4 and Figure 4, survey 1 versus 8 all p<0.001 except under 5 years of age (p=ns). Small but significant reductions in chronic illness were found in all adults and total members of the household from survey 7 to 8 (from 6.0% to 3.3% and 3.6% to 2.1%, respectively). Table 4 Prevalence (%) of chronic illness in surveys 1, 4, 7 and 8
Household member
Chronic Illness
Survey p p p p p
1 4 7 8 (1&4) (4&7) (7&8) (4&8) (1&8)
Head 27.2 7.0 5.1 3.8 <0.001 ns ns ns <0.001
All adults 22.7 4.8 6.0 3.3 <0.001 ns 0.036 ns <0.001
Children 5-15 5.1 1.1 0.01 0.01 0.007 ns ns ns 0.001
<5 children 2.9 0.01 0 0.01 ns ns ns ns ns
Total 15.3 3.2 3.6 2.1 <0.001 ns 0.044 ns <0.001
9
Figure 4 Household members (%) with chronic illness in surveys 1, 4, 7 and 8
5.4 Morbidity status
The reported prevalence of morbidity was obtained at each survey and shown in Tables 5 to 8 by household members as well as for all household members together (Table 9). Generally the morbidity reduced in all household members between surveys 1 and 8. Significant reductions were found from surveys 1 to 8 for head of household and all adults, except passing of worms which showed little change from survey 4 onwards. For household heads, the prevalence of diarrhoea and fever reduced by about a half from survey 1 to 8 in the previous 30 days (both p<0.001) and cough reduction was from about 40% to 15% between surveys 1 and 8 (p<0.001) while eye infection showed a fall of over 20% (Table 5). For all adults (Table 6) diarrhoea and fever fell by more than a half between surveys 1 and 8 (15.3% to 7.2% and 36.7% to 16.1%, respectively, both p<0.001) and cough reduced by a third (from 29.5% to 10.4%, p<0.001); eye infection fell by 16% from 17.5% to 1.5% (p<0.001) in the previous 30 days. In children 5 to 15 years of age (Table 7) the prevalence of fever and cough both fell between surveys 1 and 4 in the last 30 days and continued to reduce until survey 8. All prevalences showed significant reductions from surveys 4 to 8 and from surveys 1 to 8 (except for eye infection) in the previous 30 days. In under 5 year old children (Table 8), more than a half of the prevalences fell between survey 1 to 8 (diarrhoea, fever and cough fell from 21.2% to 7.4%, 47.1% to 22.8% and 37.5% to 16.1%, respectively) and there was a sharp
10
reduction in worm infection (from 23.1% to 3.4%) in the previous 30 days between surveys 1 and 8, respectively. Figure 5 presents the morbidity for all household members together and the steep downward trends for cough, worms and fever are very apparent and to a lesser extent eye infection. Figure 5 Morbidity status of all household members in surveys 1, 4, 7 and 8
11
Table 5 Morbidity status (%) of head of household on the day of survey, previous 7 days and previous 30 days in surveys 1, 4, 7 and 8
Condition Head of household
Survey p (1&4)
p (4&7)
p (7&8)
p (4&8)
p (1&8) 1 4 7 8
Day of survey
Diarrhoea 0.7 2.2 1.5 0.7 ns ns ns ns ns
Fever 7.4 7.7 4.4 3.7 ns ns ns 0.042 ns
Cough 22.8 12.9 8.5 7.0 0.002 ns ns 0.022 <0.001
Skin infection 8.5 13.2 3.7 5.1 ns <0.001 ns 0.001 ns
Eye infection 20.6 4.4 2.9 0.7 <0.001 ns ns 0.007 <0.001
Passed worms 15.1 0.4 0.4 0.7 <0.001 ns ns ns <0.001
Previous 7 days
Diarrhoea 8.1 11.4 8.5 4.8 ns ns ns 0.005 ns
Fever 22.8 15.8 15.8 14.7 0.039 ns ns ns 0.016
Cough 28.3 18.8 14.7 10.7 0.009 ns ns 0.008 <0.001
Skin infection 8.8 13.2 4.4 5.9 ns <0.001 ns 0.004 ns
Eye infection 22.1 5.1 3.3 1.1 <0.001 ns ns 0.007 <0.001
Passed worms 17.3 1.8 0.7 2.2 <0.001 ns ns 0.009 <0.001
Previous 30 days
Diarrhoea 19.9 20.6 14.3 9.2 ns ns ns <0.001 <0.001
Fever 42.6 36.8 27.6 21.7 ns 0.022 ns <0.001 <0.001
Cough 39.7 30.1 20.6 15.1 0.019 0.010 ns <0.001 <0.001
Skin infection 9.2 13.2 5.5 5.9 ns 0.002 ns 0.004 ns
Eye infection 22.8 6.3 3.3 1.8 <0.001 ns ns 0.009 <0.001
Passed worms 21.3 4.8 1.1 2.9 <0.001 0.011 ns ns <0.001
Table 6 Morbidity status (%) of all adults on the day of survey, previous 7 days and previous 30 days in surveys 1, 4, 7 and 8
Condition All adults
Survey p (1&4)
p (4&7)
p (7&8)
p (4&8)
p (1&8) 1 4 7 8
Day of survey
Diarrhoea 1.3 2.2 1.3 0.4 ns ns ns 0.008 ns
Fever 7.4 7.7 4.3 3.3 ns 0.017 ns 0.002 0.003
Cough 16.4 7.7 6.1 5.2 <0.001 ns ns ns <0.001
Skin infection 6.6 9.7 2.7 3.2 ns <0.001 ns <0.001 0.008
Eye infection 16.1 3.9 2.2 0.6 <0.001 ns 0.023 <0.001 <0.001
Passed worms 14.8 0.3 0.2 0.6 <0.001 ns ns ns <0.001
Previous 7 days
Diarrhoea 7.0 8.6 6.6 4.3 ns ns ns 0.003 ns
Fever 19.2 15.3 14.0 10.8 ns ns ns 0.028 <0.001
Cough 20.8 16.7 10.1 7.6 ns 0.001 ns <0.001 <0.001
Skin infection 6.8 9.7 3.1 3.7 ns <0.001 ns <0.001 0.022
Eye infection 17.2 4.6 2.3 1.1 <0.001 0.040 ns 0.001 <0.001
Passed worms 17.7 1.7 0.7 1.7 <0.001 ns ns ns <0.001
Previous 30 days
Diarrhoea 15.3 17.5 10.2 7.2 ns 0.001 ns <0.001 <0.001
Fever 36.7 32.2 22.4 16.1 ns <0.001 0.008 <0.001 <0.001
Cough 29.5 25.6 13.3 10.4 ns <0.001 ns <0.001 <0.001
Skin infection 7.0 9.7 3.6 3.7 ns <0.001 0.001 <0.001 0.016
Eye infection 17.5 5.3 2.3 1.5 <0.001 0.009 ns <0.001 <0.001
Passed worms 20.7 4.0 0.9 2.2 <0.001 0.001 ns ns <0.001
12
Table 7 Morbidity status (%) of children 5-15 years old on the day of survey, previous 7 days and previous 30 days in surveys 1, 4, 7 and 8
Condition 5-15 year old children
Survey p (1&4)
p (4&7)
p (7&8)
p (4&8)
p (1&8) 1 4 7 8
Day of survey
Diarrhoea 0.7 1.1 0.4 0.8 ns ns ns ns ns
Fever 8.8 4.1 2.5 3.0 0.025 ns ns ns 0.005
Cough 9.6 4.8 2.5 3.4 0.034 ns ns ns 0.004
Skin infection 3.7 5.9 2.5 1.5 ns 0.046 ns 0.007 ns
Eye infection 0.4 0.7 0 0 ns ns ns ns ns
Passed worms 21.0 0 0.4 0 <0.001 ns ns ns <0.001
Previous 7 days
Diarrhoea 2.9 3.0 1.1 1.9 ns ns ns ns ns
Fever 18.4 10.0 9.7 6.1 0.005 ns ns ns <0.001
Cough 13.6 8.6 5.0 5.7 ns ns ns ns 0.002
Skin infection 3.7 5.9 2.5 2.6 ns 0.046 ns ns ns
Eye infection 0.7 1.1 0 0 ns ns ns ns ns
Passed worms 22.4 1.5 1.1 0.4 <0.001 ns ns ns <0.001
Previous 30 days
Diarrhoea 8.5 9.3 2.5 3.8 ns 0.001 ns 0.010 0.025
Fever 31.3 21.9 18.0 11.4 0.015 ns 0.031 0.001 <0.001
Cough 19.9 13.8 9.0 6.5 ns ns ns 0.005 <0.001
Skin infection 3.7 5.9 2.5 1.5 ns 0.046 ns 0.007 ns
Eye infection 1.5 1.9 0.4 0 ns ns ns 0.026 0.048
Passed worms 23.5 4.5 1.4 0.8 <0.001 0.034 ns 0.007 <0.001
Table 8 Morbidity status (%) of children < 5 years old on the day of survey, previous 7 days and previous 30 days in surveys 1, 4, 7 and 8
Condition <5 year old children
Survey p (1&4)
p (4&7)
p (7&8)
p (4&8)
p (1&8) 1 4 7 8
Day of survey
Diarrhoea 2.9 2.7 1.5 0.7 ns ns ns ns ns
Fever 10.6 13.4 4.4 5.4 ns ns ns ns ns
Cough 15.4 11.6 5.9 8.1 ns ns ns ns ns
Skin infection 5.8 5.4 4.4 2.0 ns ns ns ns ns
Eye infection 1.9 1.8 0.7 0.7 ns ns ns ns ns
Passed worms 18.3 0.9 1.5 0 <0.001 ns ns ns <0.001
Previous 7 days
Diarrhoea 7.7 6.3 8.1 3.4 ns ns ns ns ns
Fever 26.0 27.7 4.4 14.4 ns <0.001 0.005 0.007 0.018
Cough 23.1 20.7 12.5 12.8 ns ns ns ns 0.013
Skin infection 4.8 6.3 4.4 2.7 ns ns ns ns ns
Eye infection 2.9 0.9 1.5 0.7 ns ns ns ns ns
Passed worms 19.2 4.5 4.4 2.0 0.001 ns ns ns <0.001
Previous 30 days
Diarrhoea 21.2 15.3 11.0 7.4 ns ns ns 0.031 0.001
Fever 47.1 42.0 26.5 22.8 ns 0.010 ns 0.001 <0.001
Cough 37.5 31.3 16.2 16.1 ns 0.005 ns 0.004 <0.001
Skin infection 5.8 6.3 4.4 2.7 ns ns ns ns ns
Eye infection 2.9 0.9 1.5 0.7 ns ns ns ns ns
Passed worms 23.1 10.8 4.4 3.4 0.016 ns ns 0.016 <0.001

13
Table 9 Morbidity status (%) of all household members on the day of survey, previous 7 days and previous 30 days in surveys 1, 4, 7 and 8
Condition All household
Survey p (1&4)
p (4&7)
p (7&8)
p (4&8)
p (1&8) 1 4 7 8
Day of survey
Diarrhoea 1.3 2.0 1.0 0.5 ns ns ns 0.005 ns
Fever 8.2 7.4 3.8 3.6 ns 0.001 ns <0.001 <0.001
Cough 14.3 7.4 5.0 5.2 <0.001 0.027 ns 0.030 <0.001
Skin infection 5.7 8.1 2.9 2.5 0.039 <0.001 ns <0.001 0.001
Eye infection 9.8 2.7 1.3 0.4 <0.001 0.034 0.032 <0.001 <0.001
Passed worms 17.0 0.3 0.4 0.3 <0.001 ns ns ns <0.001
Previous 7 days
Diarrhoea 5.9 6.7 5.3 3.5 ns ns ns 0.001 0.013
Fever 19.7 15.2 11.4 10.0 0.011 0.015 ns 0.001 <0.001
Cough 19.0 14.8 9.0 7.9 0.018 <0.001 ns <0.001 <0.001
Skin infection 5.7 8.2 3.1 2.9 0.031 <0.001 ns <0.001 0.004
Eye infection 10.7 3.1 1.5 0.7 <0.001 0.021 ns <0.001 <0.001
Passed worms 19.3 1.9 1.3 1.4 <0.001 ns ns ns <0.001
Previous 30 days
Diarrhoea 13.9 14.8 8.1 6.3 ns <0.001 ns <0.001 <0.001
Fever 36.3 30.4 21.7 15.9 0.007 <0.001 0.001 <0.001 <0.001
Cough 27.6 22.8 12.5 10.2 0.019 <0.001 ns <0.001 <0.001
Skin infection 5.9 8.2 3.4 2.9 ns <0.001 ns <0.001 0.002
Eye infection 11.1 3.8 1.6 0.9 <0.001 0.004 ns <0.001 <0.001
Passed worms 21.8 5.0 1.5 2.0 <0.001 <0.001 ns <0.001 <0.001
5.5 Employment
There were significant changes in the main occupation of both male and female headed households between surveys 1, 4, 7 and 8 (Tables 10 and 11) primarily between surveys 1 and 8. Generally (except surveys between 4 and 7) service and other business in male headed households significantly increased (between surveys 1 to 4, p=0.009; survey 1 to 8 p<0.001). In female headed households, begging decreased significantly from 14.2% to 5.7% (p=0.002) between surveys 1 and 8 but unemployment rose from 0.9% to 5.7% between surveys 7 and 8. Self employment reduced by about 4% in male headed households but increased by about 10% in female headed households (Table 12). Information on the number of days worked in the last 7, 14 and 30 days and hours worked in the last 7 days was collected from survey 4 onwards (Table 13). There was a significant increase in the number of days worked in the last 7, 14 and 30 days overall between surveys 7 and 8 as well as between survey 4 and 8. Male headed households also increased their mean working days particularly between surveys 7 and 8. The self employed worked more days in all surveys. Questions on advanced sale of labour were asked from survey 4 onwards and the analyses showed that the percentage paid in advance generally fell between surveys 4 and 7 and stayed as a similar low level in survey 8.

14

15
Table 10 Main occupation (%) of male head of households in surveys 1, 4, 7 and 8
Main occupation Male
Survey p p p p p
1 4 7 8 (1&4) (4&7) (7&8) (4&8) (1&8)
Unemployment 6.0 3.6 3.6 4.2 0.009 ns ns ns <0.001
Agricultural day labourer 37.3 28.3 29.5 31.9
Other day labourer 17.5 9.0 12.7 7.8
Domestic maid 1.2 1.8 0.6 0.6
Rickshaw/van puller 16.9 19.3 15.7 -*
Skilled labour 3.6 4.8 2.4 2.4
Own agriculture 0 0 2.4 -**
Fishing/aquaculture 4.2 5.4 6.0 5.4
Livestock 0 0 1.8 0
Petty trade 8.4 15.1 15.1 10.2
Cottage/garment 0.6 0.6 0.6 0.6
Other business 0.6 6.0 3.6 -***
Service 0 0.6 1.8 4.2
Transport worker 0.6 0 0.6 1.2
Begging 3.0 1.8 0.6 1.2
Rag picker/scavenger 0 1.2 0 0
Housework 0 0 0 0.6
Rented rickshaw/van - - - 4.2
Owned rickshaw/van - - - 13.3
Farmer on leased in land or waterbody
- - - 1.2
Farmer on temporary lease of khas land or water body
- - - 0.6
Grocery shop - - - 4.8
Other shop - - - 3.6
16
Table 11 Main occupation (%) of female head of households in surveys 1, 4, 7 and 8
Main occupation Female
Survey p p p p p
1 4 7 8 (1&4) (4&7) (7&8) (4&8) (1&8)
Unemployment 6.6 1.9 0.9 5.7 ns ns ns ns 0.002
Agricultural day labourer 17.9 18.9 17.0 17.0
Other day labourer 8.5 11.3 4.7 4.7
Domestic maid 29.2 20.8 16.0 18.9
Rickshaw/van puller 0.9 0 0 -
Skilled labour 0 1.9 1.9 1.9
Own agriculture 0 0 0 -**
Fishing/aquaculture 3.8 2.8 2.8 3.8
Livestock 0 2.8 5.7 3.8
Petty trade 10.4 16.0 11.3 10.4
Cottage/garment 0.9 0.9 0.9 0.9
Other business 0 0 1.9 -***
Begging 14.2 9.4 8.5 5.7
Rag picker/scavenger 1.9 0 0 0
Rural maintenance programme
0 0 0 0.9
Housework 5.7 7.5 25.5 19.8
Farmer on leased in land or waterbody
- - - 0.9
Farmer on temporary lease of khas land or water body
- - - 0
Grocery shop - - - 0
Other shop - - - 2.8
*rickshaw was divided into ‘rented’ or ‘owned’ rickshaw/van **own agriculture was divided into farmer ‘on leased in land or waterbody’ or ‘on temporary lease of khas land or waterbody’ **other business was divided into ‘grocery’ or ‘other’ shops NB: the tests of 7&8, 4&8 and 1&8 used original categories.
Table 12 Self-employed heads of households (%) by NGO in surveys 4, 7 and 8
NGO Male Female Total p
Survey Survey Survey
4 7 8 4 7 8 4 7 8 (4&7) (7&8) (4&8)
CARE 51.4 52.8 52.9 66.7 83.3 50.0 53.7 57.1 52.5 <0.001 <0.001 0.001
DSK 75.0 66.7 81.8 60.0 66.7 57.1 66.7 66.7 68.0 ns ns 0.019
NETZ 28.6 4.8 15.0 38.7 51.6 50.0 34.6 32.7 36.0 0.001 <0.001 0.002
PAB 31.6 45.0 30.6 25.0 50.0 46.7 29.6 46.4 35.3 <0.001 <0.001 <0.001
SCF 66.7 73.9 65.0 61.9 78.3 70.0 64.3 76.1 67.5 0.003 0.005 ns
UTTARAN 64.7 64.7 53.1 26.7 60.0 57.1 53.1 63.3 54.3 0.035 ns 0.019
Total 50.3 51.2 46.4 44.2 62.3 55.6 47.9 55.5 50.0 <0.001 <0.001 <0.001
17
Table 13 Mean number of days and hours worked by head of household, urban-rural and type of employment in surveys 4, 7 and 8
Number of days worked Overall Male
Survey p Survey p
4 7 8 (4&7) (7&8) (4&8) 4 7 8 (4&7) (7&8) (4&8)
In the last 7 days 4.44 4.27 4.86 ns 0.005 0.015 4.39 3.98 4.60 ns 0.035 ns
In the last 14 days 8.89 8.79 10.08 ns 0.001 <0.001 8.78 8.45 9.72 ns 0.023 0.023
In the last 30 days 18.79 18.73 21.37 ns <0.001 <0.001 18.58 18.16 20.58 ns 0.018 0.014
Hours worked in the last 7 days 6.42 5.74 6.63 0.014 0.009 ns 6.90 6.42 7.51 ns 0.023 ns
Number of days worked Urban Self*
Survey p Survey p
4 7 8 (4&7) (7&8) (4&8) 4 7 8 (4) (7) (8)
In the last 7 days 5.48 4.00 5.72 0.012 0.002 ns 5.06 4.96 5.21 <0.001 <0.001 0.016
In the last 14 days 11.11 8.00 11.68 0.015 0.001 ns 9.94 10.12 10.82 <0.001 <0.001 0.004
In the last 30 days 23.15 17.22 24.88 0.024 0.002 ns 21.12 22.03 22.89 <0.001 <0.001 0.003
Hours worked in the last 7 days 6.59 5.63 7.76 ns 0.021 0.035 6.29 5.64 5.86 ns ns <0.001
*Independent sample t-test was performed to compare mean working day (or hours) between self vs non-self employment.
18
5.6 Access to land
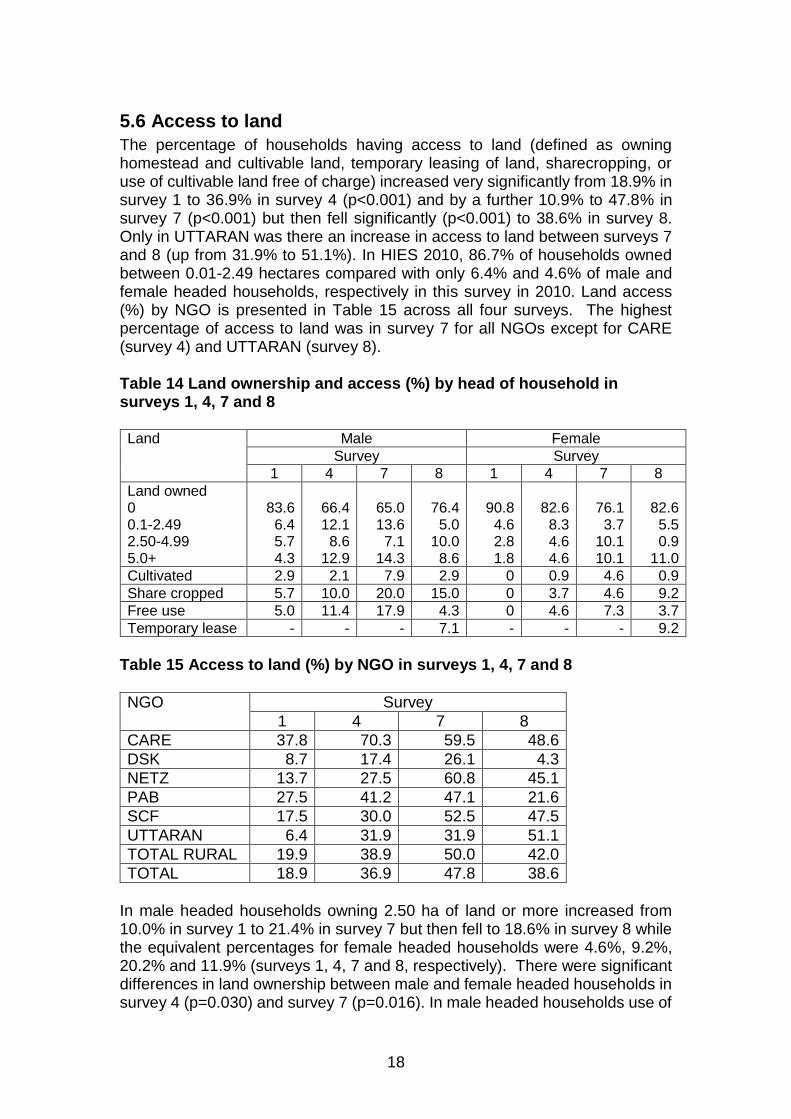
The percentage of households having access to land (defined as owning homestead and cultivable land, temporary leasing of land, sharecropping, or use of cultivable land free of charge) increased very significantly from 18.9% in survey 1 to 36.9% in survey 4 (p<0.001) and by a further 10.9% to 47.8% in survey 7 (p<0.001) but then fell significantly (p<0.001) to 38.6% in survey 8. Only in UTTARAN was there an increase in access to land between surveys 7 and 8 (up from 31.9% to 51.1%). In HIES 2010, 86.7% of households owned between 0.01-2.49 hectares compared with only 6.4% and 4.6% of male and female headed households, respectively in this survey in 2010. Land access (%) by NGO is presented in Table 15 across all four surveys. The highest percentage of access to land was in survey 7 for all NGOs except for CARE (survey 4) and UTTARAN (survey 8). Table 14 Land ownership and access (%) by head of household in surveys 1, 4, 7 and 8 Land Male Female
Survey Survey 1 4 7 8 1 4 7 8
Land owned 0 0.1-2.49 2.50-4.99 5.0+
83.6 6.4 5.7 4.3
66.4 12.1 8.6
12.9
65.0 13.6 7.1
14.3
76.4 5.0
10.0 8.6
90.8 4.6 2.8 1.8
82.6 8.3 4.6 4.6
76.1 3.7
10.1 10.1
82.6 5.5 0.9
11.0
Cultivated 2.9 2.1 7.9 2.9 0 0.9 4.6 0.9
Share cropped 5.7 10.0 20.0 15.0 0 3.7 4.6 9.2
Free use 5.0 11.4 17.9 4.3 0 4.6 7.3 3.7
Temporary lease - - - 7.1 - - - 9.2
Table 15 Access to land (%) by NGO in surveys 1, 4, 7 and 8
NGO Survey
1 4 7 8
CARE 37.8 70.3 59.5 48.6
DSK 8.7 17.4 26.1 4.3
NETZ 13.7 27.5 60.8 45.1
PAB 27.5 41.2 47.1 21.6
SCF 17.5 30.0 52.5 47.5
UTTARAN 6.4 31.9 31.9 51.1
TOTAL RURAL 19.9 38.9 50.0 42.0
TOTAL 18.9 36.9 47.8 38.6
In male headed households owning 2.50 ha of land or more increased from 10.0% in survey 1 to 21.4% in survey 7 but then fell to 18.6% in survey 8 while the equivalent percentages for female headed households were 4.6%, 9.2%, 20.2% and 11.9% (surveys 1, 4, 7 and 8, respectively). There were significant differences in land ownership between male and female headed households in survey 4 (p=0.030) and survey 7 (p=0.016). In male headed households use of
19
cultivated land increased from 2.9% in surveys 1 and 4 to 7.9% in survey 7 but fell to 2.9% in survey 8. A similar pattern was found in female headed households increasing from 0% in survey 1 and 0.9% in survey 4 to 4.6% in survey 7 before falling back to 0.9% in survey 8. Share cropping, however, increased between the first and last surveys in both male and female headed households up from 5.7% in survey 1 to 15.0% (male) and from 0% to 9.2% (female). Free use of land reached a peak in survey 7 in both male and female headed households. Information on temporary leased land was collected in survey 8 only and there was no significant difference between male and female headed households (7.1% and 9.2%, respectively).
5.7 Housing, water access, sanitation and electricity
5.7.1 Home ownership
The percentage of households owning their own house increased significantly from 75.4% to 82.4% (Table 16) between surveys 1 and 4 and then fell slightly to 81.3% and 79.4% in surveys 7 and 8, respectively. Table 16 Home ownership (%) in surveys 1, 4, 7 and 8 Home ownership Survey
1 4 7 8 Own 26.0 24.3 26.1 20.2 Rent 11.2 10.7 10.7 12.9 Live with parent 2.6 0.7 1.5 2.6 Live with parent-in-law 0.7 0 0 1.7 Rent free with family 4.8 4.4 5.5 3.6 Rent free non-family 5.2 1.8 1.1 0.7 Own house on khas land or someone else’s land 49.4 58.1 55.2 59.2
5.7.2 Size of house
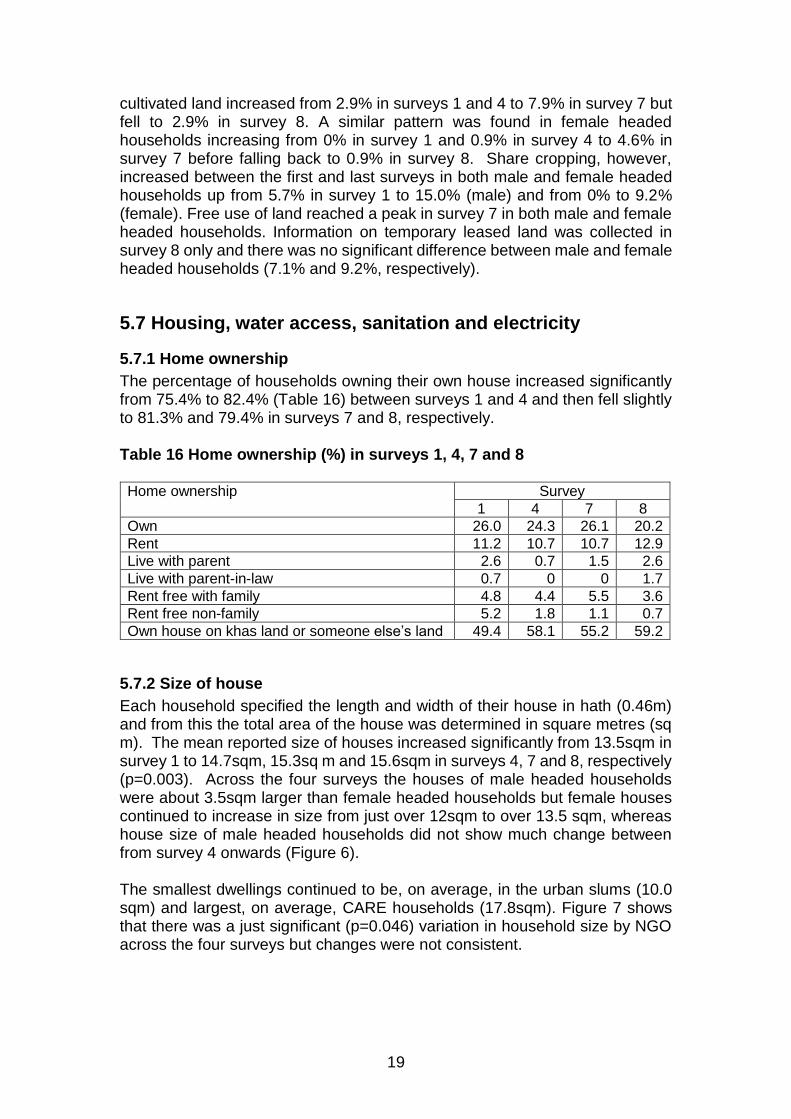
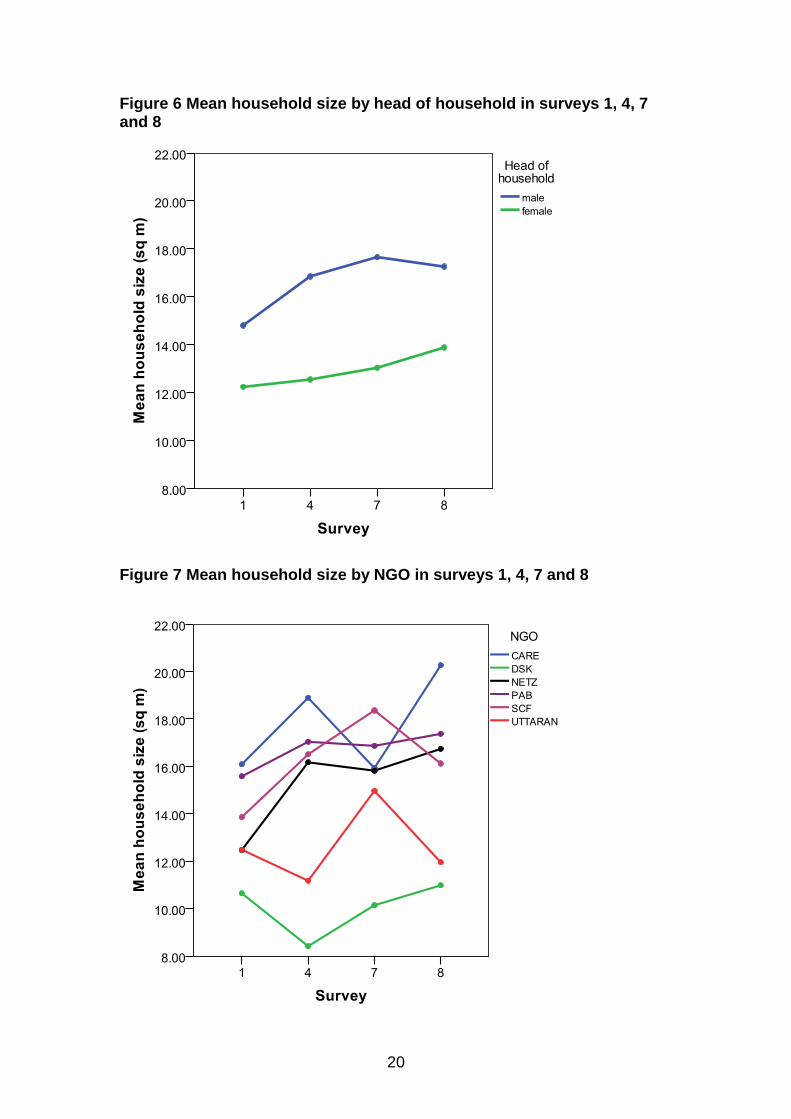
Each household specified the length and width of their house in hath (0.46m) and from this the total area of the house was determined in square metres (sq m). The mean reported size of houses increased significantly from 13.5sqm in survey 1 to 14.7sqm, 15.3sq m and 15.6sqm in surveys 4, 7 and 8, respectively (p=0.003). Across the four surveys the houses of male headed households were about 3.5sqm larger than female headed households but female houses continued to increase in size from just over 12sqm to over 13.5 sqm, whereas house size of male headed households did not show much change between from survey 4 onwards (Figure 6). The smallest dwellings continued to be, on average, in the urban slums (10.0 sqm) and largest, on average, CARE households (17.8sqm). Figure 7 shows that there was a just significant (p=0.046) variation in household size by NGO across the four surveys but changes were not consistent.
20
Figure 6 Mean household size by head of household in surveys 1, 4, 7 and 8
Figure 7 Mean household size by NGO in surveys 1, 4, 7 and 8
21
5.7.3. House construction
There were no significant changes in the materials used in house construction between surveys 1, 4, 7 and 8 (Table 17) although there was an increase in roofs and walls constructed of tin sheet; walls were primarily made of grass etc., mud or tin sheet, roofs of tin sheet and floors of mud. Compared with HIES 2010 where 19.29% of walls were constructed of grass and bamboo, the percentages in these surveys ranged between 30.9% and 47.2%; 9.46% of roofs were constructed of cement/brick in HIES 2010 compared with between only 0.4 and 2.2% in this survey. Table 17 Materials used in house construction in surveys 1, 4, 7 and 8
Material Wall Roof Floor
Survey Survey Survey
1 4 7 8 1 4 7 8 1 4 7 8
Grass etc. 29.0 25.4 28.3 22.8 23.4 21.0 16.5 15.1 0.7 4.0 2.9 0.4
Bamboo 18.2 10.3 9.9 8.1 0.7 - - - 4.8 - - -
Mud 28.3 26.5 26.1 24.3 0.7 - - - 90.3 90.4 88.2 90.4
Tiles - - - - 3.0 4.8 3.7 4.0 - - - 1.9
Tin sheet 23.4 32.4 32.7 41.1 71.0 73.9 79.4 78.7 - - 0.7 -
Cement/brick 1.1 1.5 2.9 3.7 0.7 0.4 0.4 2.2 4.1 5.5 8.1 7.4
In survey 8, information was obtained about homes being above the known flood level. Overall 59.2% reported that there home was above the flood level but there was significant variation between NGOs (p<0.001) with nearly three-quarters of CARE households, but only one third of PAB households, above the flood level. There was no significant difference between male and female headed households (60.8% and 56.6%, respectively) above the flood level.
5.7.4 Source of drinking water
There were significant changes in the source of drinking water across the four surveys (p=0.015) with increased usage of piped water between surveys 1 and 8 and reduction in use of pond water (Table 18). Nearly all urban households obtained their water from a piped supply or a tubewell, while over 80% of rural households obtained their water from a tubewell; between 1 in 6 and 1 in 13 households obtained their water from a pond or river. In HIES 2010 only 4.01% used pond/river for their potable water (between 7.7% and 15.4%, in this study) while 85.37% used a tubewell (range 77.6% to 84.1% in this study). Table 18 Source of drinking water in surveys 1, 4, 7 and 8
Water source Survey
1 4 7 8
Pipe 5.9 7.0 8.1 12.5
Tubewell 77.6 84.1 83.9 79.8
Open well 0.7 0.7 0.4 -
Pond/river 15.4 8.1 9.6 7.7
Rain water - - - -
Purchased 0.4 - - -
22
5.7.5 Electricity supply
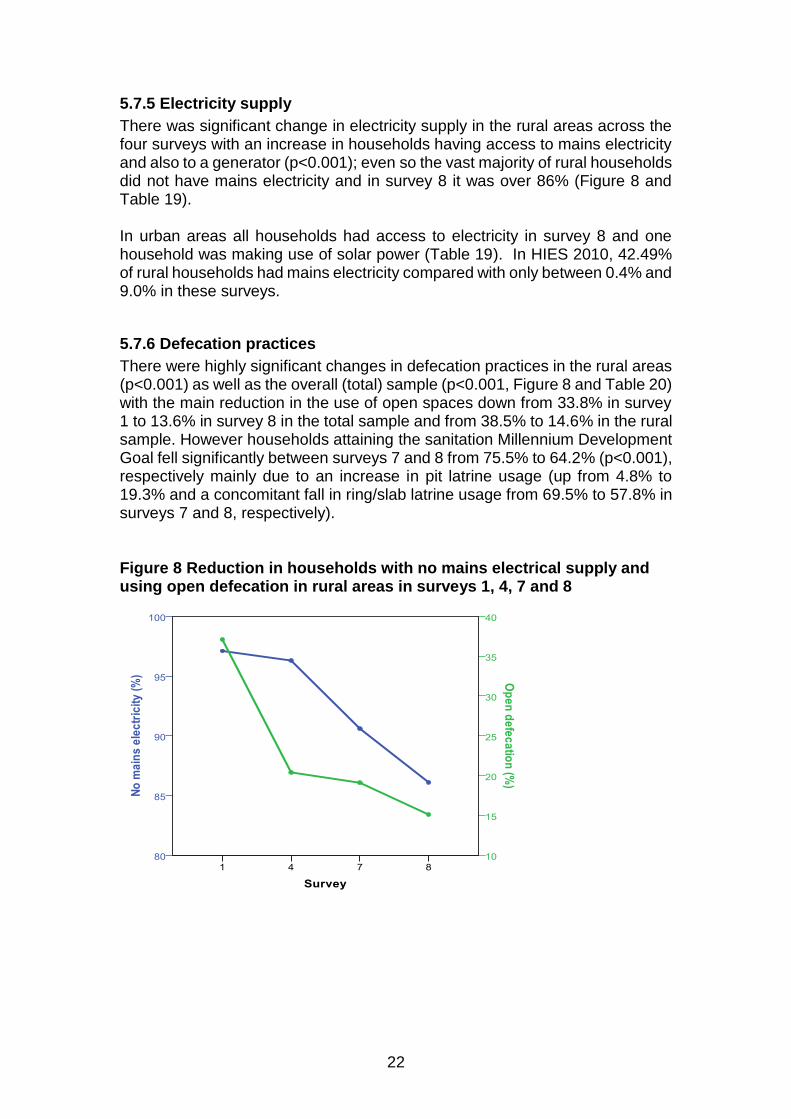
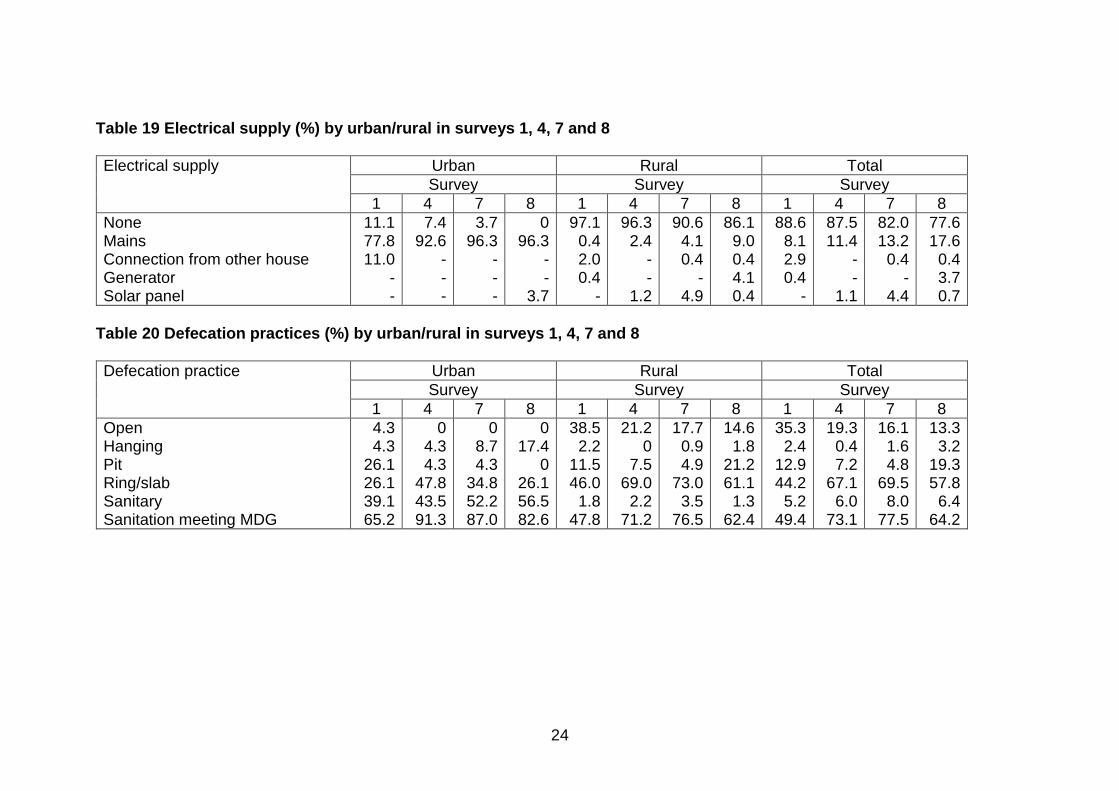
There was significant change in electricity supply in the rural areas across the four surveys with an increase in households having access to mains electricity and also to a generator (p<0.001); even so the vast majority of rural households did not have mains electricity and in survey 8 it was over 86% (Figure 8 and Table 19). In urban areas all households had access to electricity in survey 8 and one household was making use of solar power (Table 19). In HIES 2010, 42.49% of rural households had mains electricity compared with only between 0.4% and 9.0% in these surveys.
5.7.6 Defecation practices
There were highly significant changes in defecation practices in the rural areas (p<0.001) as well as the overall (total) sample (p<0.001, Figure 8 and Table 20) with the main reduction in the use of open spaces down from 33.8% in survey 1 to 13.6% in survey 8 in the total sample and from 38.5% to 14.6% in the rural sample. However households attaining the sanitation Millennium Development Goal fell significantly between surveys 7 and 8 from 75.5% to 64.2% (p<0.001), respectively mainly due to an increase in pit latrine usage (up from 4.8% to 19.3% and a concomitant fall in ring/slab latrine usage from 69.5% to 57.8% in surveys 7 and 8, respectively). Figure 8 Reduction in households with no mains electrical supply and using open defecation in rural areas in surveys 1, 4, 7 and 8
23
In survey 8 information was collected on availability of soap/ash near to water point or latrine. Overall 69.5% of households were found to have soap/ash available but there was significant variation between NGOs with highest percentages in SCF (89.1%) and UTTARAN (87.8%) and least in DSK (48.1%) and NETZ (51.9%). More male headed households had soap/ash available than female headed and the difference was marginally significant (72.9% and 64.2%, respectively, p=0.053). Households were also asked in survey 8 about whether all the family members wore shoes or not and overall 89.3% reported doing so. There was no significant variation between NGOs or between male and female headed households.
24
Table 19 Electrical supply (%) by urban/rural in surveys 1, 4, 7 and 8
Electrical supply Urban Rural Total
Survey Survey Survey
1 4 7 8 1 4 7 8 1 4 7 8
None Mains Connection from other house Generator Solar panel
11.1 77.8 11.0
- -
7.4 92.6
- - -
3.7 96.3
- - -
0 96.3
- -
3.7
97.1 0.4 2.0 0.4
-
96.3 2.4
- -
1.2
90.6 4.1 0.4
- 4.9
86.1 9.0 0.4 4.1 0.4
88.6 8.1 2.9 0.4
-
87.5 11.4
- -
1.1
82.0 13.2
0.4 -
4.4
77.6 17.6
0.4 3.7 0.7
Table 20 Defecation practices (%) by urban/rural in surveys 1, 4, 7 and 8
Defecation practice Urban Rural Total
Survey Survey Survey
1 4 7 8 1 4 7 8 1 4 7 8
Open Hanging Pit Ring/slab Sanitary Sanitation meeting MDG
4.3 4.3
26.1 26.1 39.1 65.2
0 4.3 4.3
47.8 43.5 91.3
0 8.7 4.3
34.8 52.2 87.0
0 17.4
0 26.1 56.5 82.6
38.5 2.2
11.5 46.0
1.8 47.8
21.2 0
7.5 69.0
2.2 71.2
17.7 0.9 4.9
73.0 3.5
76.5
14.6 1.8
21.2 61.1
1.3 62.4
35.3 2.4
12.9 44.2
5.2 49.4
19.3 0.4 7.2
67.1 6.0
73.1
16.1 1.6 4.8
69.5 8.0
77.5
13.3 3.2
19.3 57.8
6.4 64.2
25
5.8 Cash loans and savings
5.8.1 Cash loans
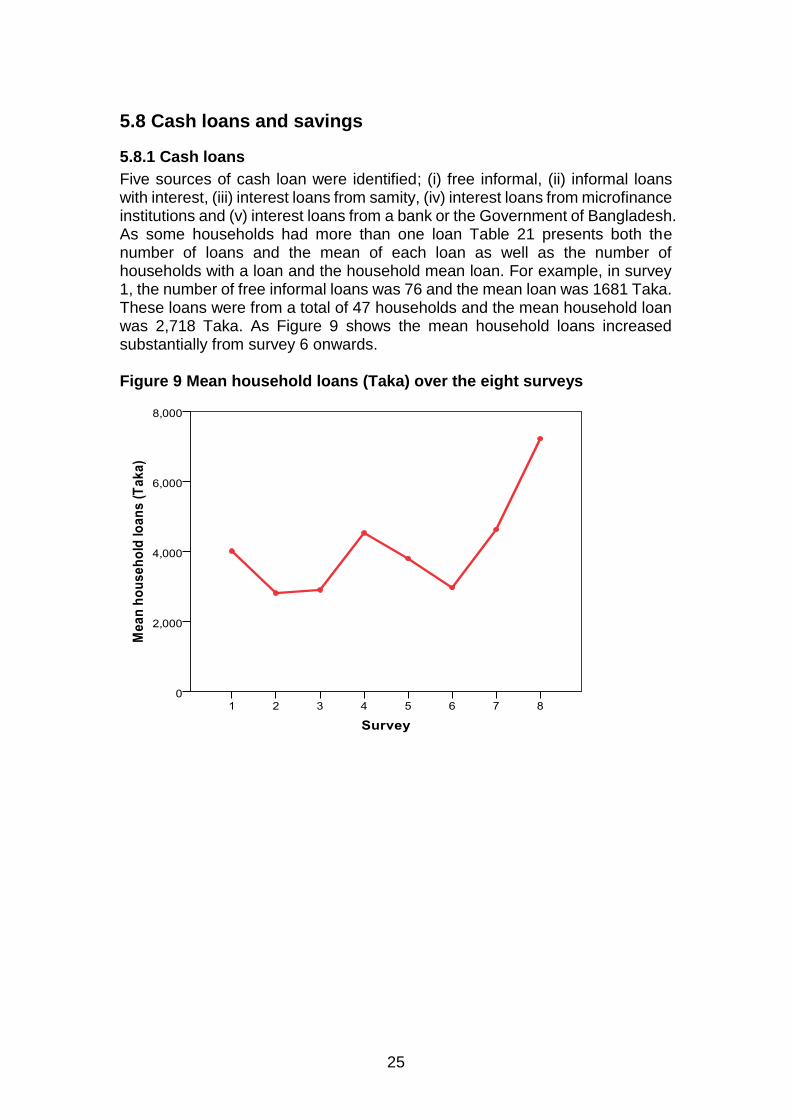
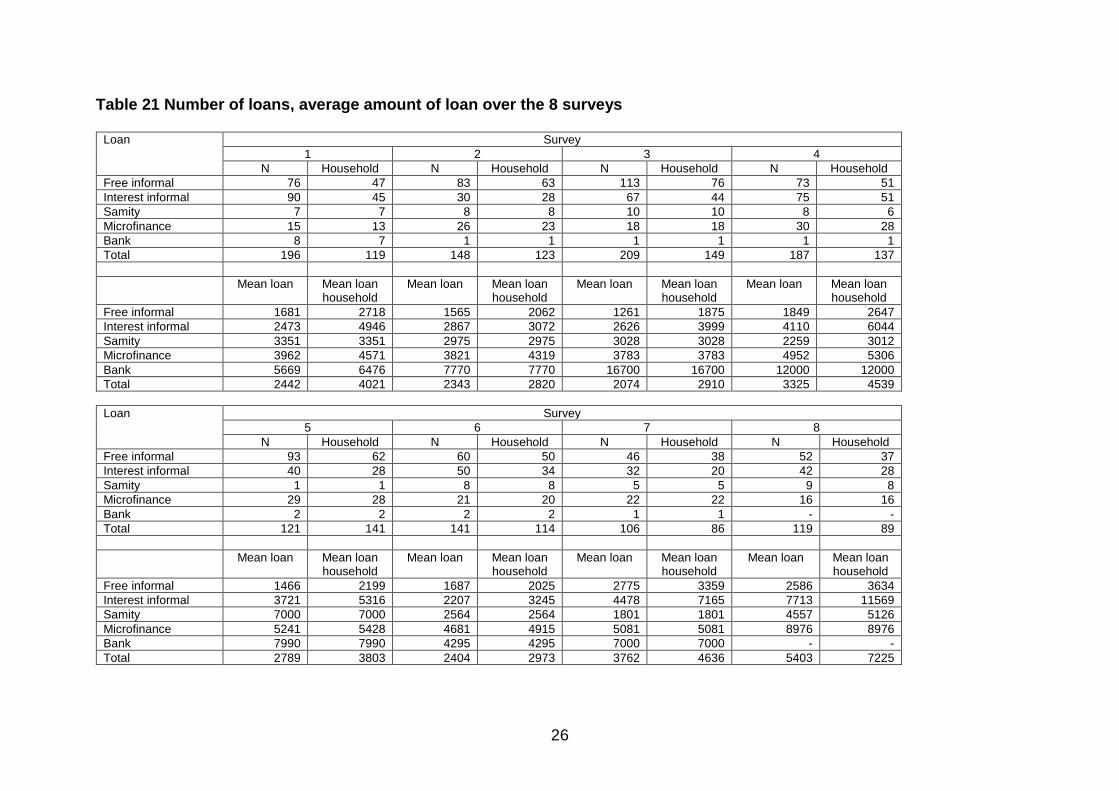
Five sources of cash loan were identified; (i) free informal, (ii) informal loans with interest, (iii) interest loans from samity, (iv) interest loans from microfinance institutions and (v) interest loans from a bank or the Government of Bangladesh. As some households had more than one loan Table 21 presents both the number of loans and the mean of each loan as well as the number of households with a loan and the household mean loan. For example, in survey 1, the number of free informal loans was 76 and the mean loan was 1681 Taka. These loans were from a total of 47 households and the mean household loan was 2,718 Taka. As Figure 9 shows the mean household loans increased substantially from survey 6 onwards. Figure 9 Mean household loans (Taka) over the eight surveys
26
Table 21 Number of loans, average amount of loan over the 8 surveys
Loan Survey
1 2 3 4
N Household N Household N Household N Household
Free informal 76 47 83 63 113 76 73 51
Interest informal 90 45 30 28 67 44 75 51
Samity 7 7 8 8 10 10 8 6
Microfinance 15 13 26 23 18 18 30 28
Bank 8 7 1 1 1 1 1 1
Total 196 119 148 123 209 149 187 137
Mean loan Mean loan household
Mean loan Mean loan household
Mean loan Mean loan household
Mean loan Mean loan household
Free informal 1681 2718 1565 2062 1261 1875 1849 2647
Interest informal 2473 4946 2867 3072 2626 3999 4110 6044
Samity 3351 3351 2975 2975 3028 3028 2259 3012
Microfinance 3962 4571 3821 4319 3783 3783 4952 5306
Bank 5669 6476 7770 7770 16700 16700 12000 12000
Total 2442 4021 2343 2820 2074 2910 3325 4539
Loan Survey
5 6 7 8
N Household N Household N Household N Household
Free informal 93 62 60 50 46 38 52 37
Interest informal 40 28 50 34 32 20 42 28
Samity 1 1 8 8 5 5 9 8
Microfinance 29 28 21 20 22 22 16 16
Bank 2 2 2 2 1 1 - -
Total 121 141 141 114 106 86 119 89
Mean loan Mean loan household
Mean loan Mean loan household
Mean loan Mean loan household
Mean loan Mean loan household
Free informal 1466 2199 1687 2025 2775 3359 2586 3634
Interest informal 3721 5316 2207 3245 4478 7165 7713 11569
Samity 7000 7000 2564 2564 1801 1801 4557 5126
Microfinance 5241 5428 4681 4915 5081 5081 8976 8976
Bank 7990 7990 4295 4295 7000 7000 - -
Total 2789 3803 2404 2973 3762 4636 5403 7225
27
5.8.2 Cash Savings
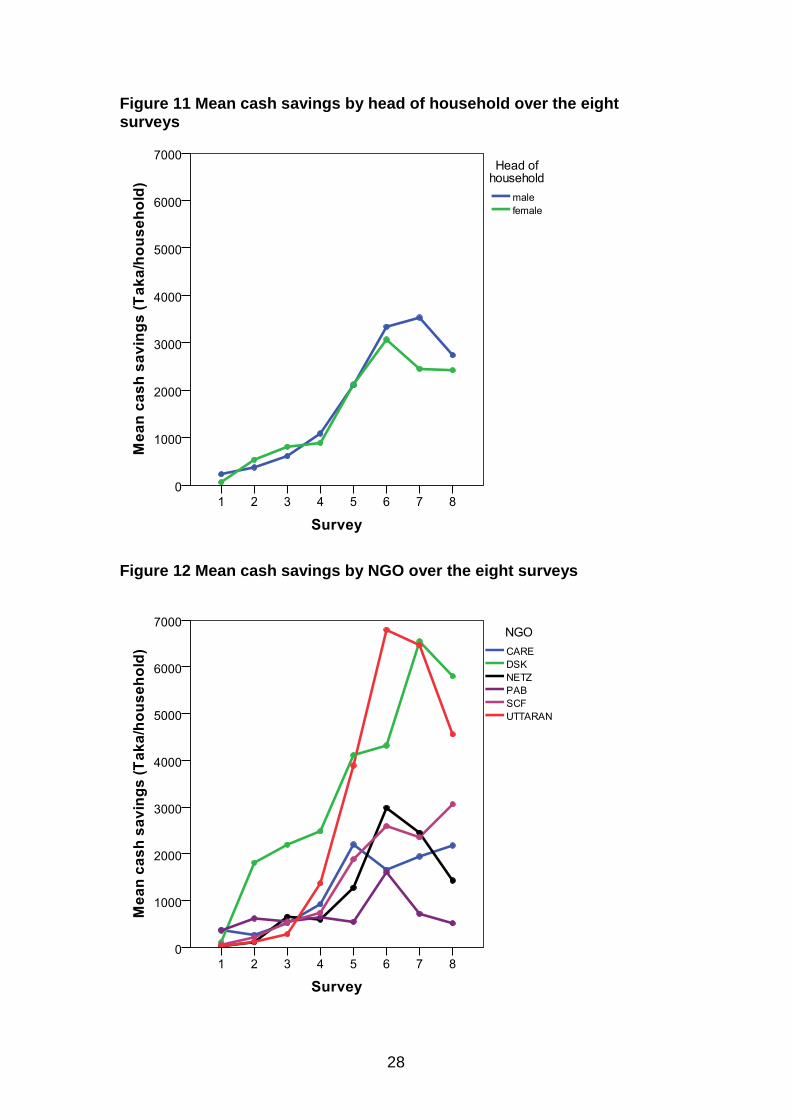
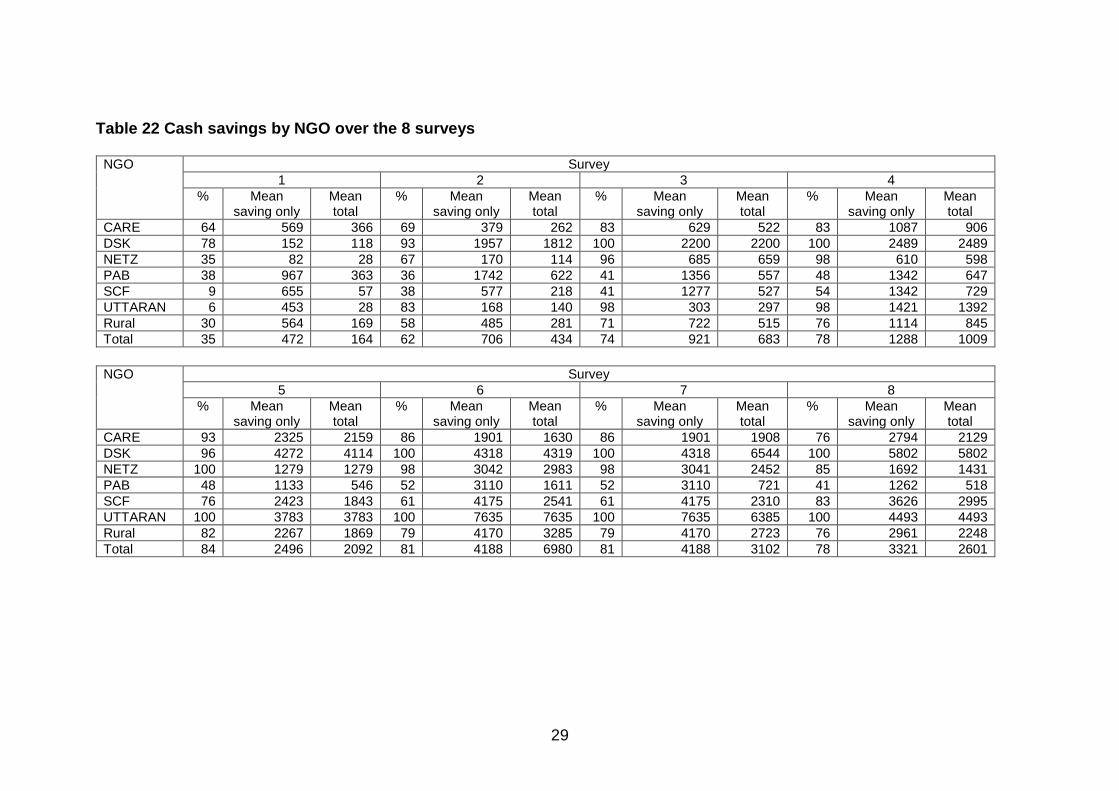
The respondents were asked about the extent of their cash savings. Table 22 shows the percentage of households with cash savings the mean worth of cash savings for those households with savings and the mean of all households. For example, in survey 1 35% of households has some cash savings worth, on average, 472 Taka; based on all households the mean savings falls to 164 Taka per household. As Table 22 and Figure 10 show for the total sample, the percentage of households with savings increased from 35% in survey 1 to 84% in survey 5 and then fell slightly to 81% in surveys 6 and 7 and to 78% by survey 8. Up until survey 6, there was little difference in mean cash savings between male and female headed households, but in survey 7 male headed households had more cash savings but the gap reduced in survey 8. Over the 8 surveys male headed households had, on average, just over 200 Taka extra savings than female headed households (Figure 11, 1,751 versus 1,542, respectively) but the difference was not significant. There were significant differences in NGO mean savings in all surveys but particularly marked from survey 2 onwards due to the much higher savings in DSK initially and from survey 5 onwards by UTTARAN households. The increase in savings was not consistent across NGOs as can be seen in Figure 12. When analyses were restricted to the rural NGOs there were significant difference in means mainly due to the much higher mean savings in UTTARAN. Figure 10 Percentage of households with cash savings over the eight surveys
28
Figure 11 Mean cash savings by head of household over the eight surveys
Figure 12 Mean cash savings by NGO over the eight surveys
29
Table 22 Cash savings by NGO over the 8 surveys
NGO Survey
1 2 3 4
% Mean saving only
Mean total
% Mean saving only
Mean total
% Mean saving only
Mean total
% Mean saving only
Mean total
CARE 64 569 366 69 379 262 83 629 522 83 1087 906
DSK 78 152 118 93 1957 1812 100 2200 2200 100 2489 2489
NETZ 35 82 28 67 170 114 96 685 659 98 610 598
PAB 38 967 363 36 1742 622 41 1356 557 48 1342 647
SCF 9 655 57 38 577 218 41 1277 527 54 1342 729
UTTARAN 6 453 28 83 168 140 98 303 297 98 1421 1392
Rural 30 564 169 58 485 281 71 722 515 76 1114 845
Total 35 472 164 62 706 434 74 921 683 78 1288 1009
NGO Survey
5 6 7 8
% Mean saving only
Mean total
% Mean saving only
Mean total
% Mean saving only
Mean total
% Mean saving only
Mean total
CARE 93 2325 2159 86 1901 1630 86 1901 1908 76 2794 2129
DSK 96 4272 4114 100 4318 4319 100 4318 6544 100 5802 5802
NETZ 100 1279 1279 98 3042 2983 98 3041 2452 85 1692 1431
PAB 48 1133 546 52 3110 1611 52 3110 721 41 1262 518
SCF 76 2423 1843 61 4175 2541 61 4175 2310 83 3626 2995
UTTARAN 100 3783 3783 100 7635 7635 100 7635 6385 100 4493 4493
Rural 82 2267 1869 79 4170 3285 79 4170 2723 76 2961 2248
Total 84 2496 2092 81 4188 6980 81 4188 3102 78 3321 2601
30
5.9 Household assets
5.9.1 Animals
There were highly significant increases in animal ownership in both male and female headed households, particularly for cattle, goat and poultry (Table 23) between surveys 1 and 4 but no significant changes between surveys 4, 7 and 8 (Figure 13) except for ownership of calves which increased from 0.7% in survey 1 to 12.1% in survey 8. Animal ownership in both male and female headed households was very similar from March 2011 onwards at just over 60%. Animal ownership increased in all rural NGOs between surveys 1 and 4 and fell slightly between surveys 7 and 8 (Table 24 and Figure 14). There were highly significant increases in the value of animals between the four surveys in both male and female headed households. Overall there was a sixteen fold increase the value of animals between March 2010 (mean 396 Taka) and March 2013 (mean 6,689 Taka). In March 2011 the value of animals was higher in female than male headed households (5,923 Taka versus 3,494 Taka, respectively, p<0.005) but in March 2012 and 2013 there were no significant difference. Figures 15 and 16 present the results of the repeated measures analysis in which all household have been analysed. Figure 15 shows that from survey 4 onwards the value of animals in male headed households was slightly less than female headed households while Figure 16 shows that the mean value of animals in NETZ households was nearly 10,000 Taka more than the other rural NGOs in survey 8.
5.9.2 Working equipment
There were significant increases in working equipment ownership in both male and female headed households particularly on rickshaws, and in male headed households on nets and agricultural equipment (Table 25) between surveys 1 and 4 but only agricultural equipment showed an improvement between surveys 4 and 7 and 7 to 8. Ownership in male headed households was between 15-20% higher than female headed (Figure 17) across the four surveys. When all working equipment was analysed together there was a significant increase in ownership from 56.6% in survey 1, to 76.5% in survey 4, 86.0% in survey 7 and then a fall to 76.8% in survey 8 and the decline between surveys 7 and 8 was apparent in all rural NGOs (Table 26 and Figure 18). The total amount spent on working equipment increased significantly between surveys 1, 4 and 7 (up from 269 Taka to 1,722 Taka) but fell to 1,400 Taka in survey 8. Figure 19 shows that the gap in value of working equipment increased between male and female headed households over the four surveys. UTTARAN had the highest mean value of working equipment (Figure 20).
5.9.3 Household belongings
There was increased ownership of all household items between the surveys with the exception of blankets/quilts and there were large increases in
31
ownership of a mobile phone, wooden box, mattress and chair (Table 27). The number of household belongings increased from a mean of 3.2 (maximum 13) in survey 1 to 4.0 in survey 4, 4.7 in survey 7 and 4.9 in survey 8. There was greater ownership of household goods in male headed households (Figure 21) while ownership varied between NGOs with NETZ have consistently the lowest household ownership (Figure 22). Male household belongings were worth significantly more than female headed households in all four surveys (Figure 23) and the gap had reduced slightly between surveys 7 and 8 to about 1,500 Taka. When the value of shops were included the gap between male and female headed households increased to about 3,500 Taka in survey 8 (Figure 24). DSK and UTTARAN had, on average, the highest mean value of household belongings (Figure 25) and when the value of shops were included UTTARAN households had the highest mean (Figure 26) while NETZ households had the lowest mean across all four surveys.
5.9.4 Total household assets
Total assets (excluding shop) increased substantially in both male and female headed households across the four surveys (Table 28) from 2,340 Taka in survey 1 to 13,472 Taka in survey 8. The gap between the value of assets increased between male and female headed households (Figure 27) to about 1500 Taka. With the inclusion of shops, male headed households mean assets were over 18,000 Taka about 3,500 Taka more than female headed households (p ns) in survey 8 (Figure 28). Mean value of total assets (without shops, Figure 29) indicated that NETZ households had the highest mean, but when shops were included NETZ, UTTARAN and SCF had similar means in survey 8 (Tables 29 and 30 and Figure 30).
5.9.5 Ownership of productive assets
Productive assets were defined as any animals (cattle, calf, goat, poultry and pigs), fishing net, rickshaw, boat, sewing machine, mobile phone and bicycle owned by the household. In survey 8 the ownership of each productive asset was determined as well as the user. Table 30 presents a breakdown of ownership for the eleven productive assets. A mobile phone was owned by over 40% of households, while poultry and cattle were owned by about one third of households. Ownership of pigs, boat and sewing machine was very low. Female headed households were more likely to own cattle, goats, poultry and a sewing machine, while male headed households were more likely to own a calf, pigs, fishing net, rickshaw, boat, mobile phone and a bicycle. Joint male and female ownership was apparent for all assets except for pigs and sewing machine. At least one productive asset was owned solely by 40.4% of adult female household members. Information on users of productive assets is shown in Table 31. Female heads were more likely to look after animals and use a sewing machine, while male heads operated rickshaw, fishing net, boat and used mobile phone and bicycle. Joint usage of males and females was reported for all productive assets except
32
for sewing machine and bicycle. At least one productive asset was operated solely by 40.1% of adult female household members. 51.5% of females do not own or use productive assets, 32% were both owners and users, 8.5% were owners but not users and the remaining 8.1% were users but not owners.
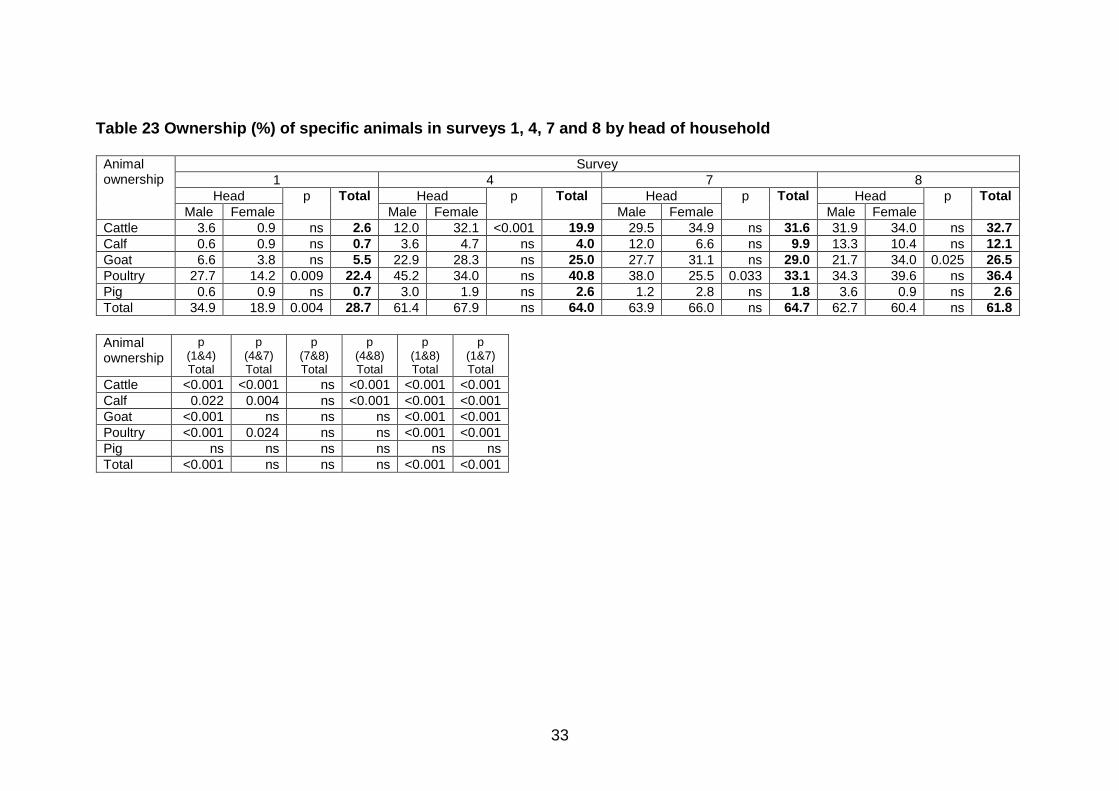
33
Table 23 Ownership (%) of specific animals in surveys 1, 4, 7 and 8 by head of household
Animal ownership
Survey
1 4 7 8
Head p Total Head p Total Head p Total Head p Total
Male Female Male Female Male Female Male Female
Cattle 3.6 0.9 ns 2.6 12.0 32.1 <0.001 19.9 29.5 34.9 ns 31.6 31.9 34.0 ns 32.7
Calf 0.6 0.9 ns 0.7 3.6 4.7 ns 4.0 12.0 6.6 ns 9.9 13.3 10.4 ns 12.1
Goat 6.6 3.8 ns 5.5 22.9 28.3 ns 25.0 27.7 31.1 ns 29.0 21.7 34.0 0.025 26.5
Poultry 27.7 14.2 0.009 22.4 45.2 34.0 ns 40.8 38.0 25.5 0.033 33.1 34.3 39.6 ns 36.4
Pig 0.6 0.9 ns 0.7 3.0 1.9 ns 2.6 1.2 2.8 ns 1.8 3.6 0.9 ns 2.6
Total 34.9 18.9 0.004 28.7 61.4 67.9 ns 64.0 63.9 66.0 ns 64.7 62.7 60.4 ns 61.8
Animal ownership
p (1&4) Total
p (4&7) Total
p (7&8) Total
p (4&8) Total
p (1&8) Total
p (1&7) Total
Cattle <0.001 <0.001 ns <0.001 <0.001 <0.001
Calf 0.022 0.004 ns <0.001 <0.001 <0.001
Goat <0.001 ns ns ns <0.001 <0.001
Poultry <0.001 0.024 ns ns <0.001 <0.001
Pig ns ns ns ns ns ns
Total <0.001 ns ns ns <0.001 <0.001
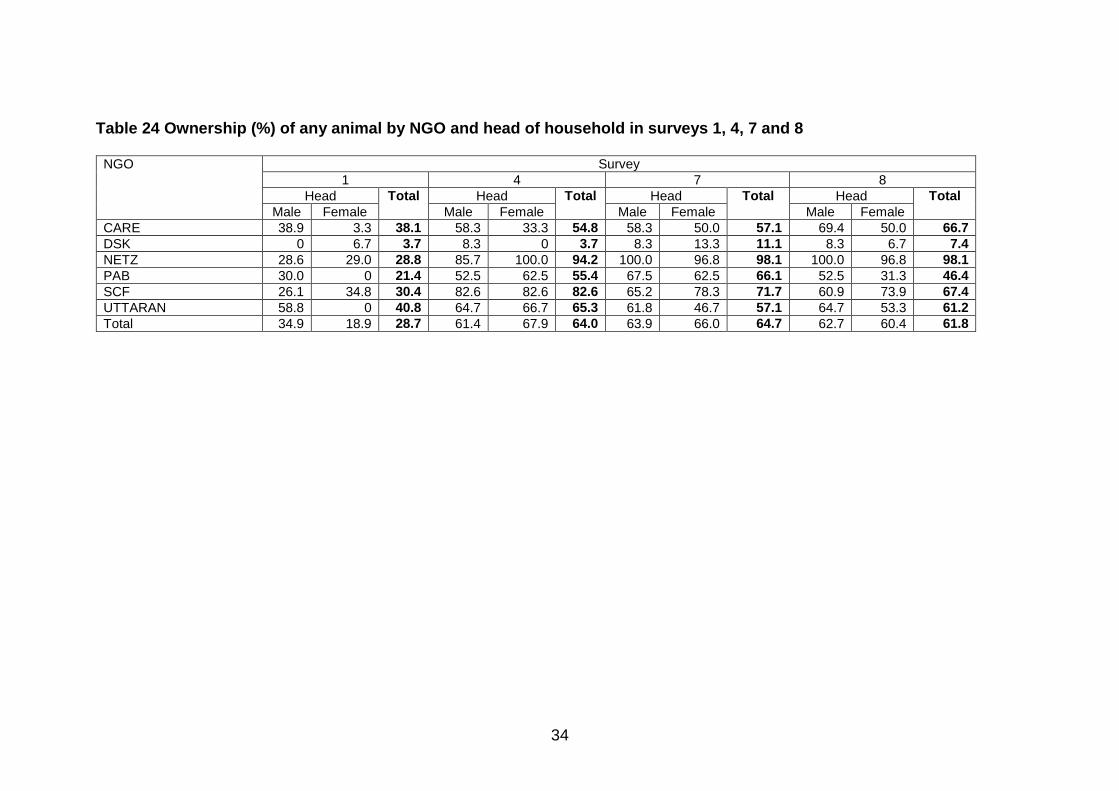
34
Table 24 Ownership (%) of any animal by NGO and head of household in surveys 1, 4, 7 and 8
NGO Survey
1 4 7 8
Head Total Head Total Head Total
Head Total
Male Female Male Female Male Female Male Female
CARE 38.9 3.3 38.1 58.3 33.3 54.8 58.3 50.0 57.1 69.4 50.0 66.7
DSK 0 6.7 3.7 8.3 0 3.7 8.3 13.3 11.1 8.3 6.7 7.4
NETZ 28.6 29.0 28.8 85.7 100.0 94.2 100.0 96.8 98.1 100.0 96.8 98.1
PAB 30.0 0 21.4 52.5 62.5 55.4 67.5 62.5 66.1 52.5 31.3 46.4
SCF 26.1 34.8 30.4 82.6 82.6 82.6 65.2 78.3 71.7 60.9 73.9 67.4
UTTARAN 58.8 0 40.8 64.7 66.7 65.3 61.8 46.7 57.1 64.7 53.3 61.2
Total 34.9 18.9 28.7 61.4 67.9 64.0 63.9 66.0 64.7 62.7 60.4 61.8
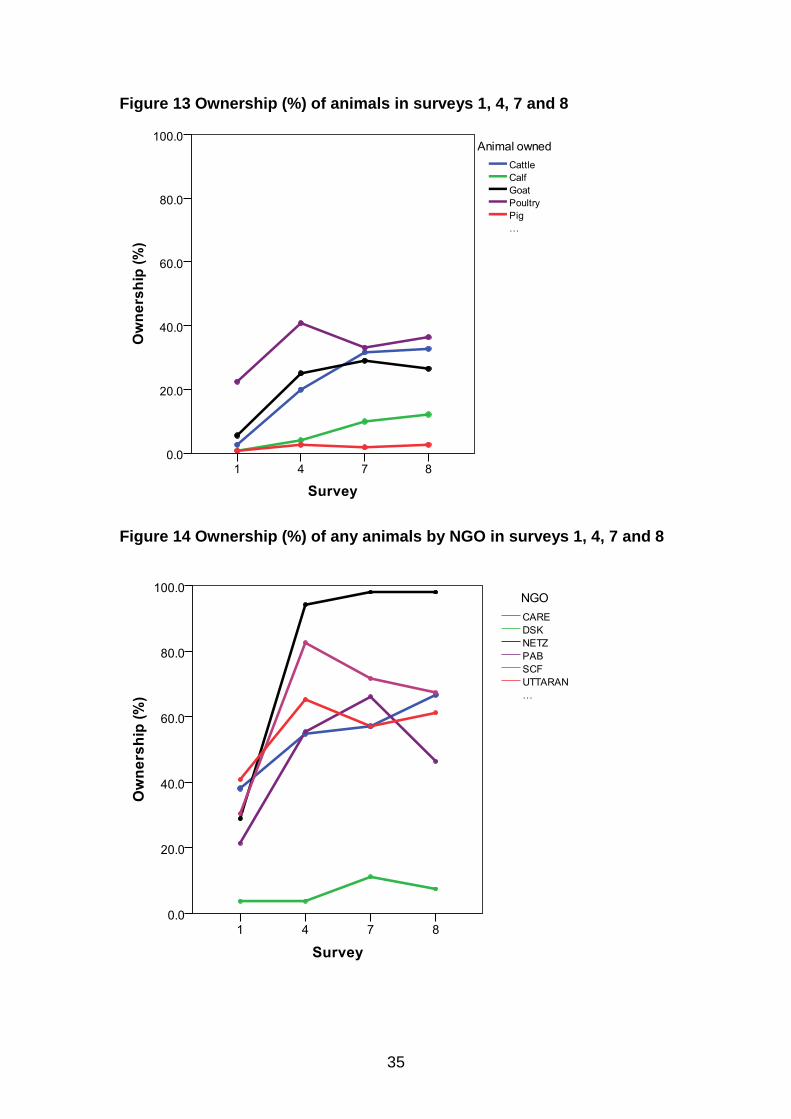
35
Figure 13 Ownership (%) of animals in surveys 1, 4, 7 and 8
Figure 14 Ownership (%) of any animals by NGO in surveys 1, 4, 7 and 8
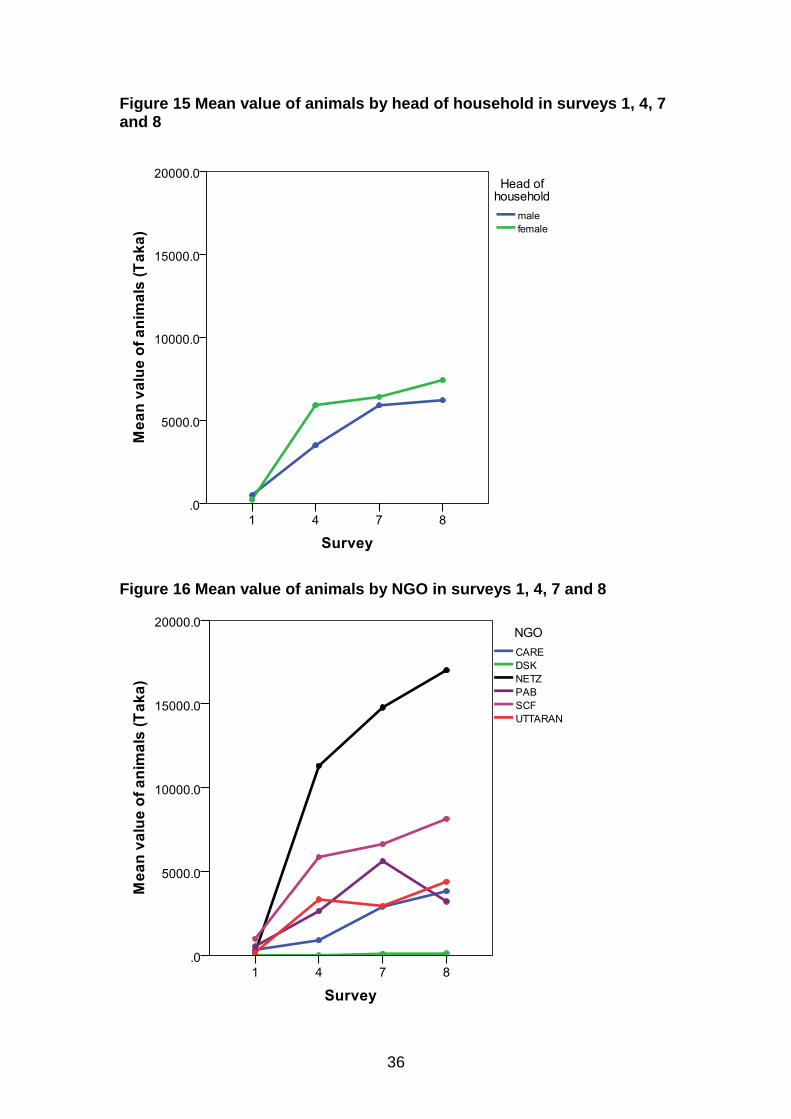
36
Figure 15 Mean value of animals by head of household in surveys 1, 4, 7 and 8
Figure 16 Mean value of animals by NGO in surveys 1, 4, 7 and 8
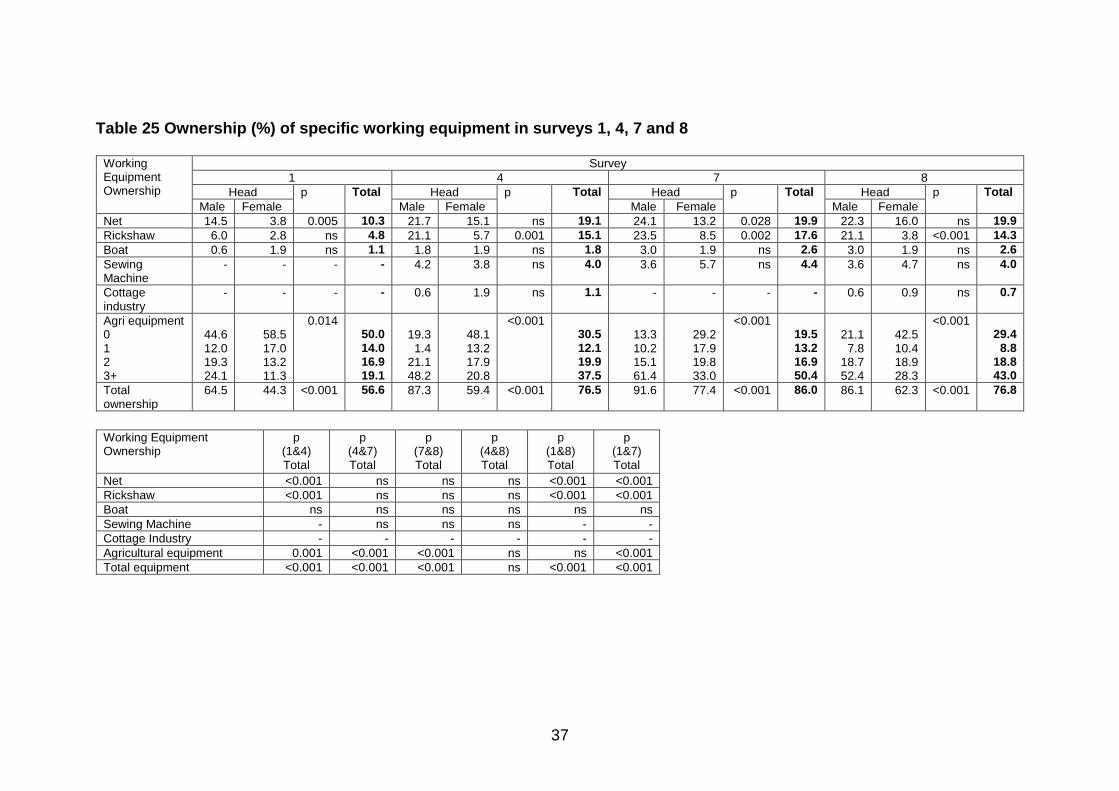
37
Table 25 Ownership (%) of specific working equipment in surveys 1, 4, 7 and 8
Working Equipment Ownership
Survey
1 4 7 8
Head p Total Head p Total Head p Total Head p Total
Male Female Male Female Male Female Male Female
Net 14.5 3.8 0.005 10.3 21.7 15.1 ns 19.1 24.1 13.2 0.028 19.9 22.3 16.0 ns 19.9
Rickshaw 6.0 2.8 ns 4.8 21.1 5.7 0.001 15.1 23.5 8.5 0.002 17.6 21.1 3.8 <0.001 14.3
Boat 0.6 1.9 ns 1.1 1.8 1.9 ns 1.8 3.0 1.9 ns 2.6 3.0 1.9 ns 2.6
Sewing Machine
- - - - 4.2 3.8 ns 4.0 3.6 5.7 ns 4.4 3.6 4.7 ns 4.0
Cottage industry
- - - - 0.6 1.9 ns 1.1 - - - - 0.6 0.9 ns 0.7
Agri equipment 0 1 2 3+
44.6 12.0 19.3 24.1
58.5 17.0 13.2 11.3
0.014 50.0 14.0 16.9 19.1
19.3
1.4 21.1 48.2
48.1 13.2 17.9 20.8
<0.001 30.5 12.1 19.9 37.5
13.3 10.2 15.1 61.4
29.2 17.9 19.8 33.0
<0.001 19.5 13.2 16.9 50.4
21.1
7.8 18.7 52.4
42.5 10.4 18.9 28.3
<0.001 29.4
8.8 18.8 43.0
Total ownership
64.5 44.3 <0.001 56.6 87.3 59.4 <0.001 76.5 91.6 77.4 <0.001 86.0 86.1 62.3 <0.001 76.8
Working Equipment Ownership
p (1&4) Total
p (4&7) Total
p (7&8) Total
p (4&8) Total
p (1&8) Total
p (1&7) Total
Net <0.001 ns ns ns <0.001 <0.001
Rickshaw <0.001 ns ns ns <0.001 <0.001
Boat ns ns ns ns ns ns
Sewing Machine - ns ns ns - -
Cottage Industry - - - - - -
Agricultural equipment 0.001 <0.001 <0.001 ns ns <0.001
Total equipment <0.001 <0.001 <0.001 ns <0.001 <0.001
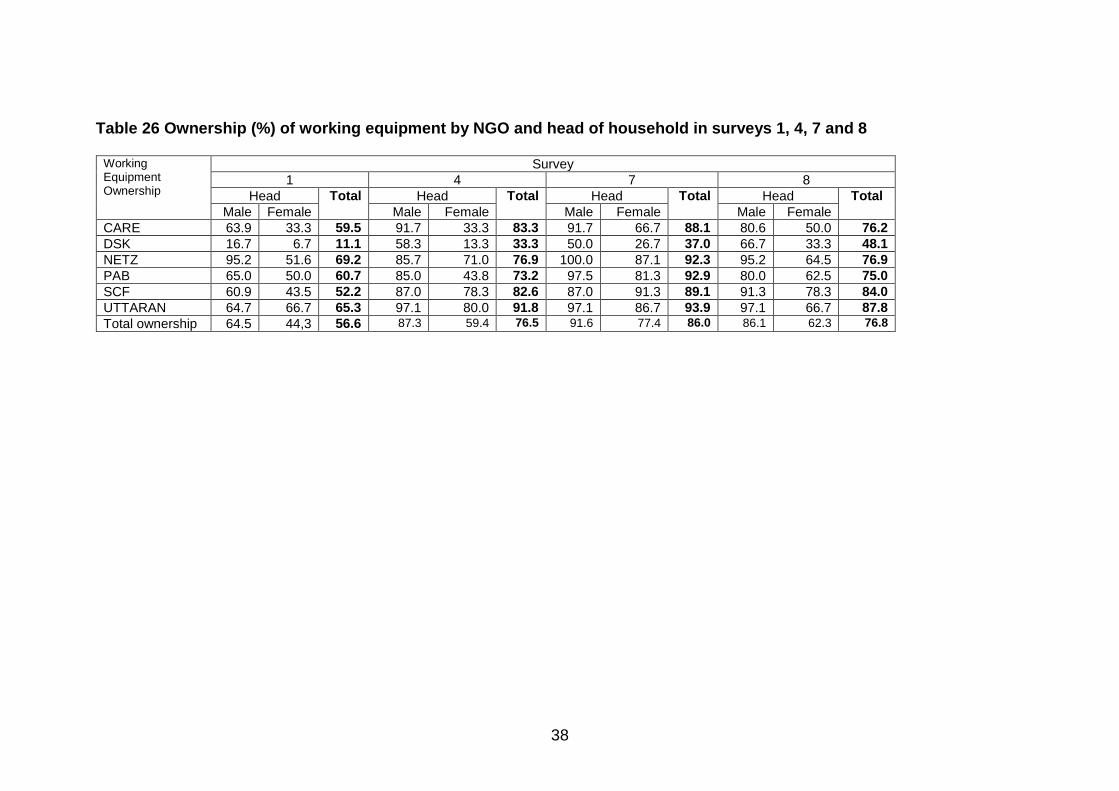
38
Table 26 Ownership (%) of working equipment by NGO and head of household in surveys 1, 4, 7 and 8
Working Equipment Ownership
Survey
1 4 7 8
Head Total Head Total Head Total Head Total
Male Female Male Female Male Female Male Female
CARE 63.9 33.3 59.5 91.7 33.3 83.3 91.7 66.7 88.1 80.6 50.0 76.2
DSK 16.7 6.7 11.1 58.3 13.3 33.3 50.0 26.7 37.0 66.7 33.3 48.1
NETZ 95.2 51.6 69.2 85.7 71.0 76.9 100.0 87.1 92.3 95.2 64.5 76.9
PAB 65.0 50.0 60.7 85.0 43.8 73.2 97.5 81.3 92.9 80.0 62.5 75.0
SCF 60.9 43.5 52.2 87.0 78.3 82.6 87.0 91.3 89.1 91.3 78.3 84.0
UTTARAN 64.7 66.7 65.3 97.1 80.0 91.8 97.1 86.7 93.9 97.1 66.7 87.8
Total ownership 64.5 44,3 56.6 87.3 59.4 76.5 91.6 77.4 86.0 86.1 62.3 76.8
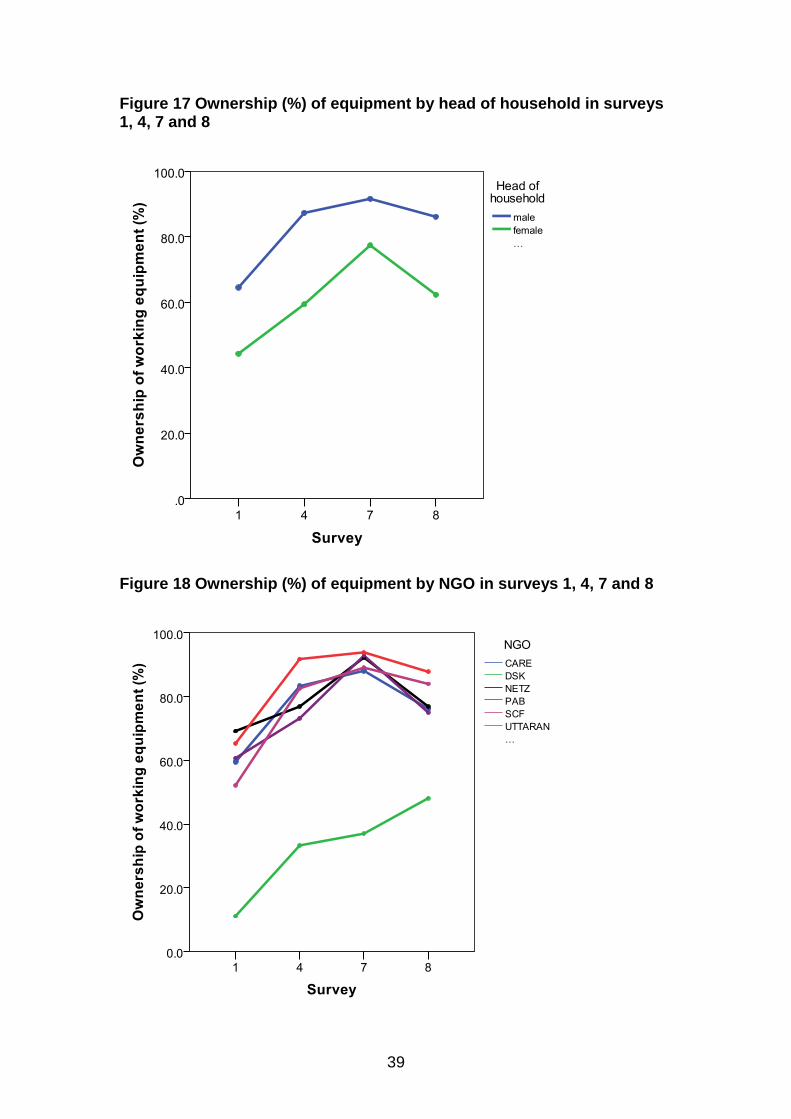
39
Figure 17 Ownership (%) of equipment by head of household in surveys 1, 4, 7 and 8
Figure 18 Ownership (%) of equipment by NGO in surveys 1, 4, 7 and 8

40
Figure 19 Mean value of equipment by head of household in surveys 1, 4, 7 and 8
Figure 20 Mean value of equipment by NGO in surveys 1, 4, 7 and 8
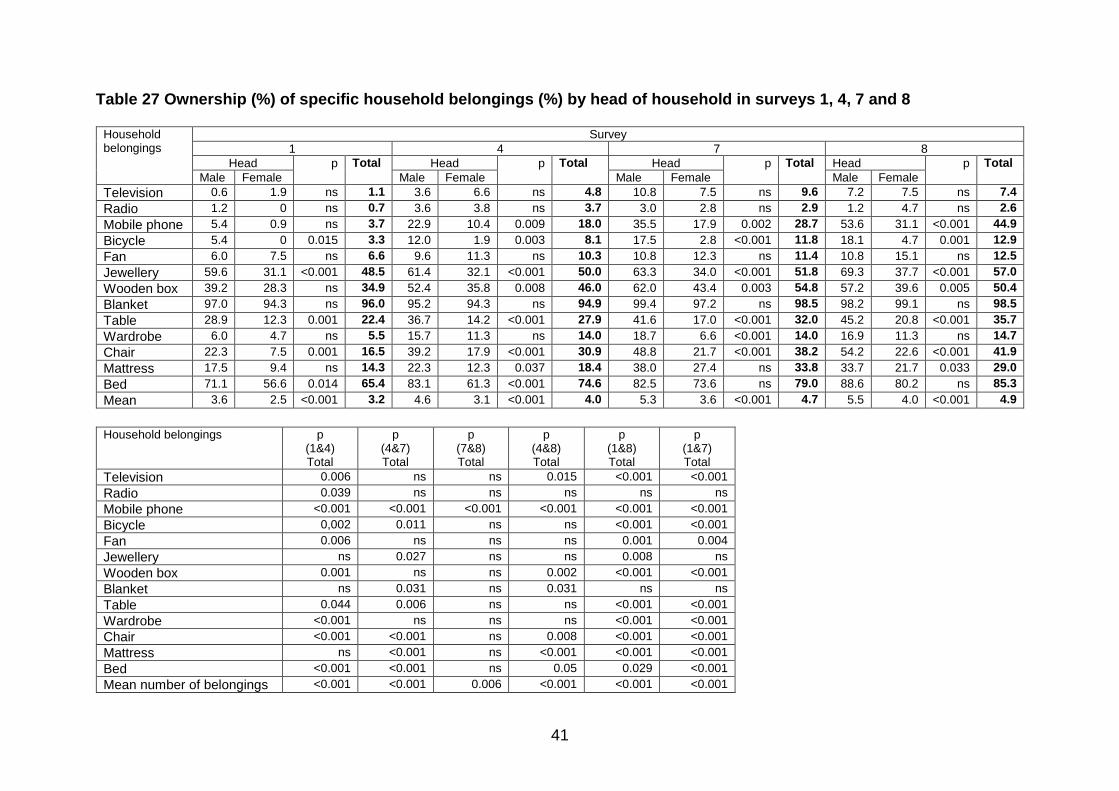
41
Table 27 Ownership (%) of specific household belongings (%) by head of household in surveys 1, 4, 7 and 8
Household belongings
Survey
1 4 7 8
Head p Total Head p Total Head p Total Head p Total
Male Female Male Female Male Female Male Female
Television 0.6 1.9 ns 1.1 3.6 6.6 ns 4.8 10.8 7.5 ns 9.6 7.2 7.5 ns 7.4
Radio 1.2 0 ns 0.7 3.6 3.8 ns 3.7 3.0 2.8 ns 2.9 1.2 4.7 ns 2.6
Mobile phone 5.4 0.9 ns 3.7 22.9 10.4 0.009 18.0 35.5 17.9 0.002 28.7 53.6 31.1 <0.001 44.9
Bicycle 5.4 0 0.015 3.3 12.0 1.9 0.003 8.1 17.5 2.8 <0.001 11.8 18.1 4.7 0.001 12.9
Fan 6.0 7.5 ns 6.6 9.6 11.3 ns 10.3 10.8 12.3 ns 11.4 10.8 15.1 ns 12.5
Jewellery 59.6 31.1 <0.001 48.5 61.4 32.1 <0.001 50.0 63.3 34.0 <0.001 51.8 69.3 37.7 <0.001 57.0
Wooden box 39.2 28.3 ns 34.9 52.4 35.8 0.008 46.0 62.0 43.4 0.003 54.8 57.2 39.6 0.005 50.4
Blanket 97.0 94.3 ns 96.0 95.2 94.3 ns 94.9 99.4 97.2 ns 98.5 98.2 99.1 ns 98.5
Table 28.9 12.3 0.001 22.4 36.7 14.2 <0.001 27.9 41.6 17.0 <0.001 32.0 45.2 20.8 <0.001 35.7
Wardrobe 6.0 4.7 ns 5.5 15.7 11.3 ns 14.0 18.7 6.6 <0.001 14.0 16.9 11.3 ns 14.7
Chair 22.3 7.5 0.001 16.5 39.2 17.9 <0.001 30.9 48.8 21.7 <0.001 38.2 54.2 22.6 <0.001 41.9
Mattress 17.5 9.4 ns 14.3 22.3 12.3 0.037 18.4 38.0 27.4 ns 33.8 33.7 21.7 0.033 29.0
Bed 71.1 56.6 0.014 65.4 83.1 61.3 <0.001 74.6 82.5 73.6 ns 79.0 88.6 80.2 ns 85.3
Mean 3.6 2.5 <0.001 3.2 4.6 3.1 <0.001 4.0 5.3 3.6 <0.001 4.7 5.5 4.0 <0.001 4.9
Household belongings p
(1&4) Total
p (4&7) Total
p (7&8) Total
p (4&8) Total
p (1&8) Total
p (1&7) Total
Television 0.006 ns ns 0.015 <0.001 <0.001
Radio 0.039 ns ns ns ns ns
Mobile phone <0.001 <0.001 <0.001 <0.001 <0.001 <0.001
Bicycle 0,002 0.011 ns ns <0.001 <0.001
Fan 0.006 ns ns ns 0.001 0.004
Jewellery ns 0.027 ns ns 0.008 ns
Wooden box 0.001 ns ns 0.002 <0.001 <0.001
Blanket ns 0.031 ns 0.031 ns ns
Table 0.044 0.006 ns ns <0.001 <0.001
Wardrobe <0.001 ns ns ns <0.001 <0.001
Chair <0.001 <0.001 ns 0.008 <0.001 <0.001
Mattress ns <0.001 ns <0.001 <0.001 <0.001
Bed <0.001 <0.001 ns 0.05 0.029 <0.001
Mean number of belongings <0.001 <0.001 0.006 <0.001 <0.001 <0.001
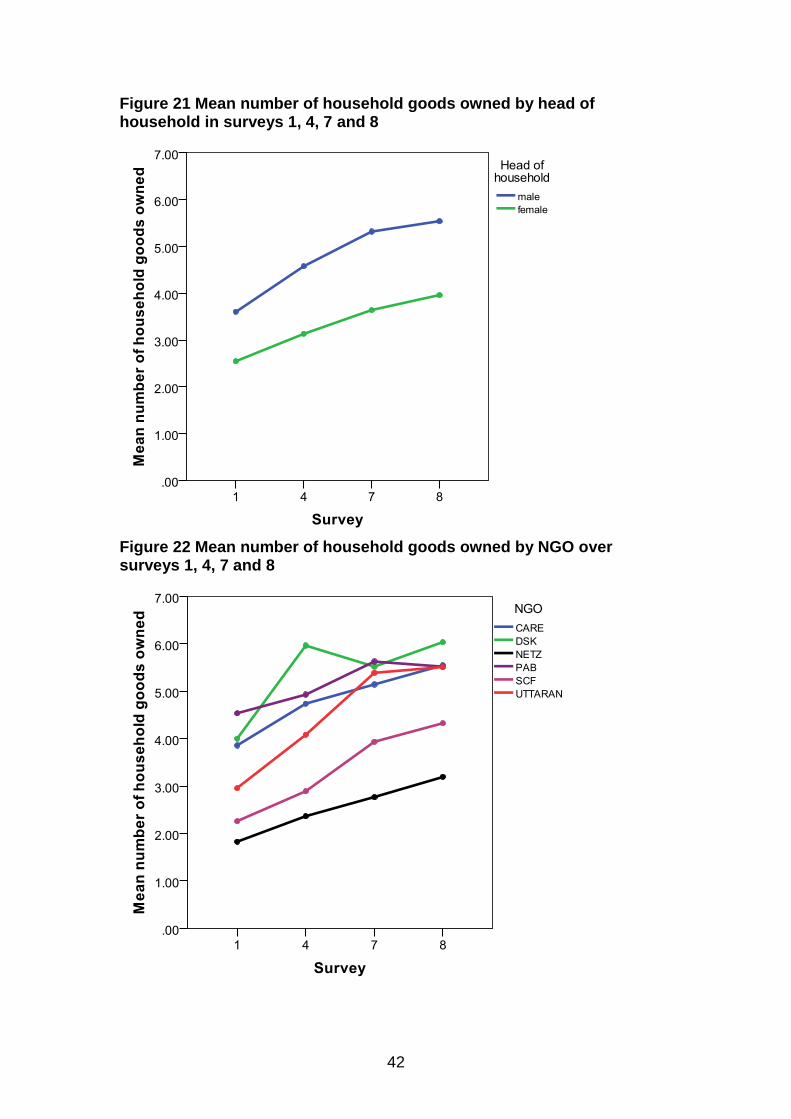
42
Figure 21 Mean number of household goods owned by head of household in surveys 1, 4, 7 and 8
Figure 22 Mean number of household goods owned by NGO over surveys 1, 4, 7 and 8
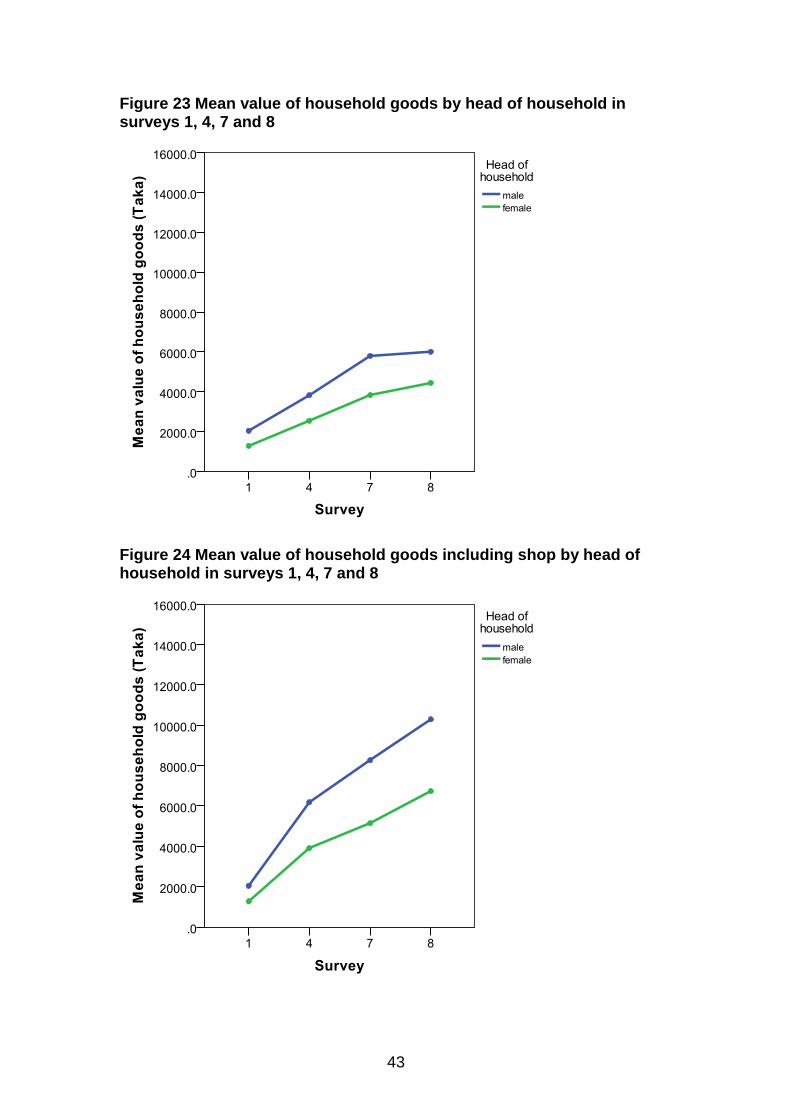
43
Figure 23 Mean value of household goods by head of household in surveys 1, 4, 7 and 8
Figure 24 Mean value of household goods including shop by head of household in surveys 1, 4, 7 and 8
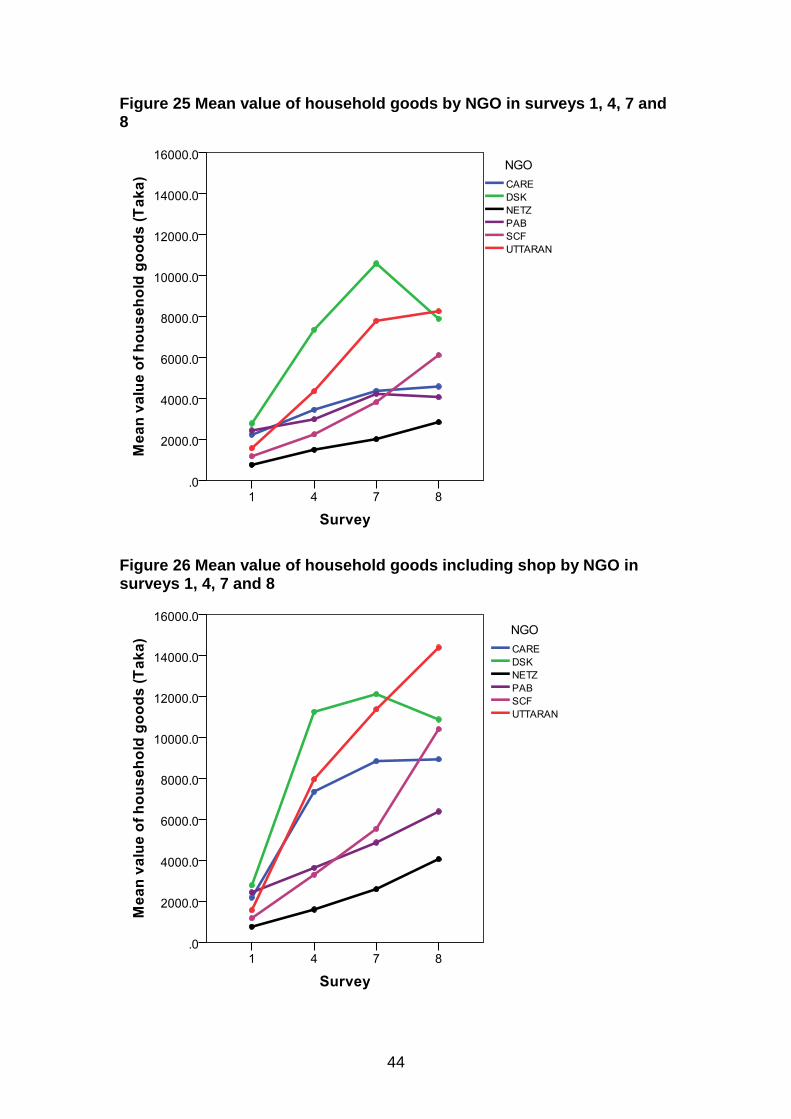
44
Figure 25 Mean value of household goods by NGO in surveys 1, 4, 7 and 8
Figure 26 Mean value of household goods including shop by NGO in surveys 1, 4, 7 and 8
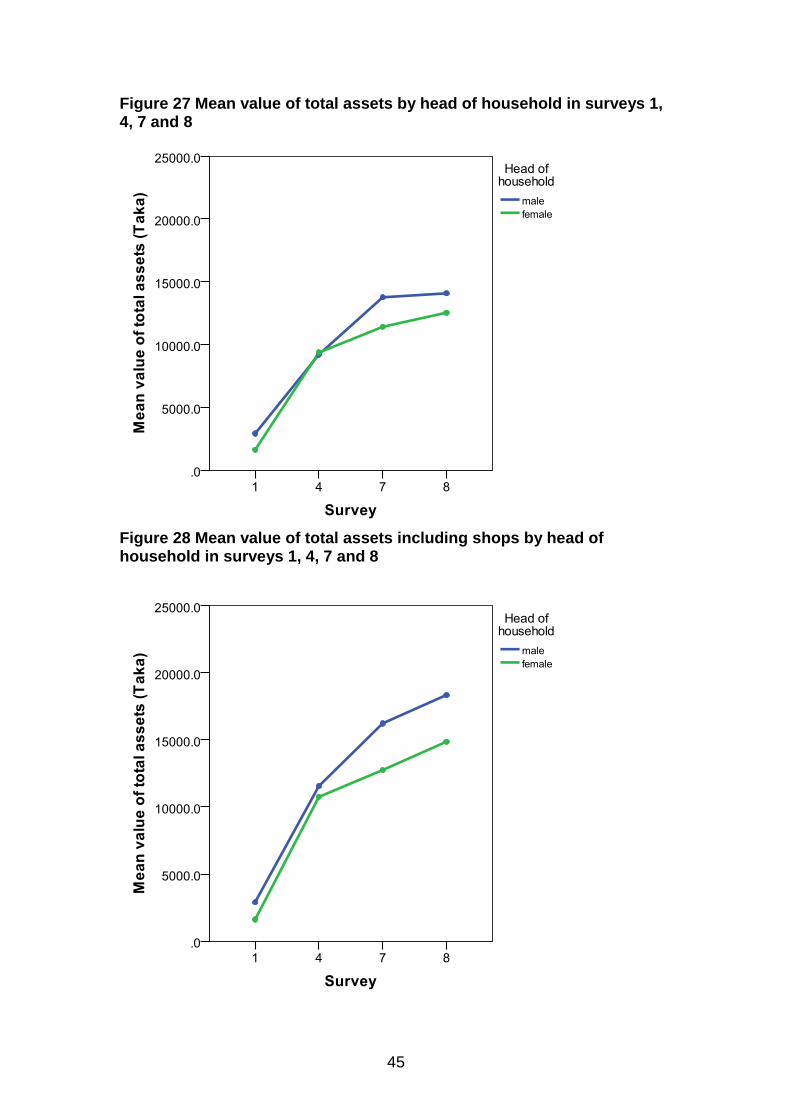
45
Figure 27 Mean value of total assets by head of household in surveys 1, 4, 7 and 8
Figure 28 Mean value of total assets including shops by head of household in surveys 1, 4, 7 and 8
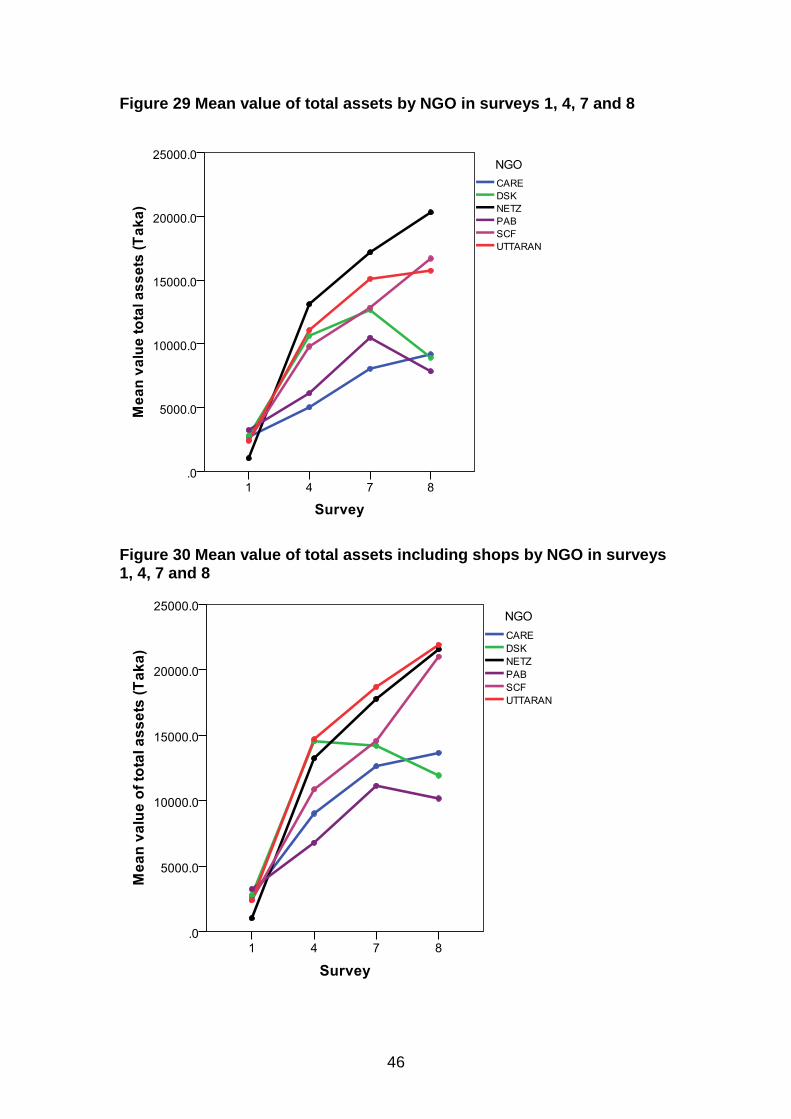
46
Figure 29 Mean value of total assets by NGO in surveys 1, 4, 7 and 8
Figure 30 Mean value of total assets including shops by NGO in surveys 1, 4, 7 and 8
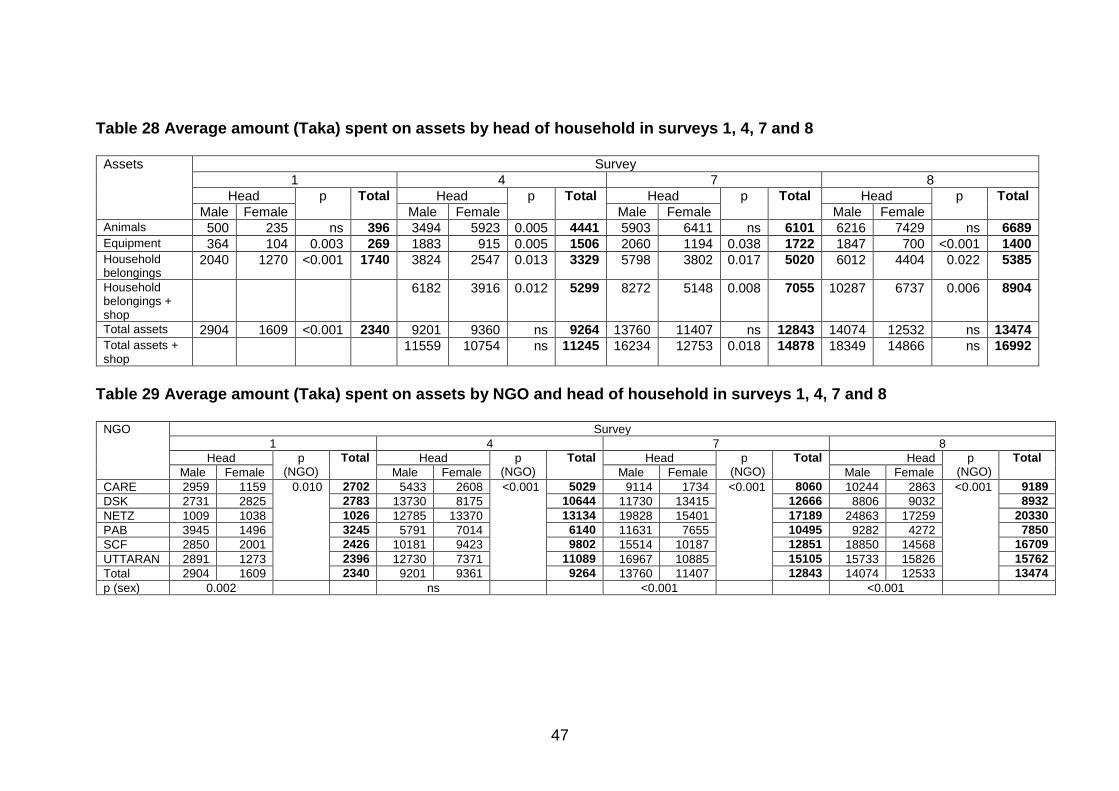
47
Table 28 Average amount (Taka) spent on assets by head of household in surveys 1, 4, 7 and 8
Assets Survey
1 4 7 8
Head p Total Head p Total Head p Total Head p Total
Male Female Male Female Male Female Male Female Animals 500 235 ns 396 3494 5923 0.005 4441 5903 6411 ns 6101 6216 7429 ns 6689 Equipment 364 104 0.003 269 1883 915 0.005 1506 2060 1194 0.038 1722 1847 700 <0.001 1400 Household belongings
2040 1270 <0.001 1740 3824 2547 0.013 3329 5798 3802 0.017 5020 6012 4404 0.022 5385
Household belongings + shop
6182 3916 0.012 5299 8272 5148 0.008 7055 10287 6737 0.006 8904
Total assets 2904 1609 <0.001 2340 9201 9360 ns 9264 13760 11407 ns 12843 14074 12532 ns 13474 Total assets + shop
11559 10754 ns 11245 16234 12753 0.018 14878 18349 14866 ns 16992
Table 29 Average amount (Taka) spent on assets by NGO and head of household in surveys 1, 4, 7 and 8
NGO Survey
1 4 7 8
Head p (NGO)
Total Head p (NGO)
Total Head p (NGO)
Total Head p (NGO)
Total
Male Female Male Female Male Female Male Female
CARE 2959 1159 0.010 2702 5433 2608 <0.001 5029 9114 1734 <0.001 8060 10244 2863 <0.001 9189
DSK 2731 2825 2783 13730 8175 10644 11730 13415 12666 8806 9032 8932
NETZ 1009 1038 1026 12785 13370 13134 19828 15401 17189 24863 17259 20330
PAB 3945 1496 3245 5791 7014 6140 11631 7655 10495 9282 4272 7850
SCF 2850 2001 2426 10181 9423 9802 15514 10187 12851 18850 14568 16709
UTTARAN 2891 1273 2396 12730 7371 11089 16967 10885 15105 15733 15826 15762
Total 2904 1609 2340 9201 9361 9264 13760 11407 12843 14074 12533 13474
p (sex) 0.002 ns <0.001 <0.001
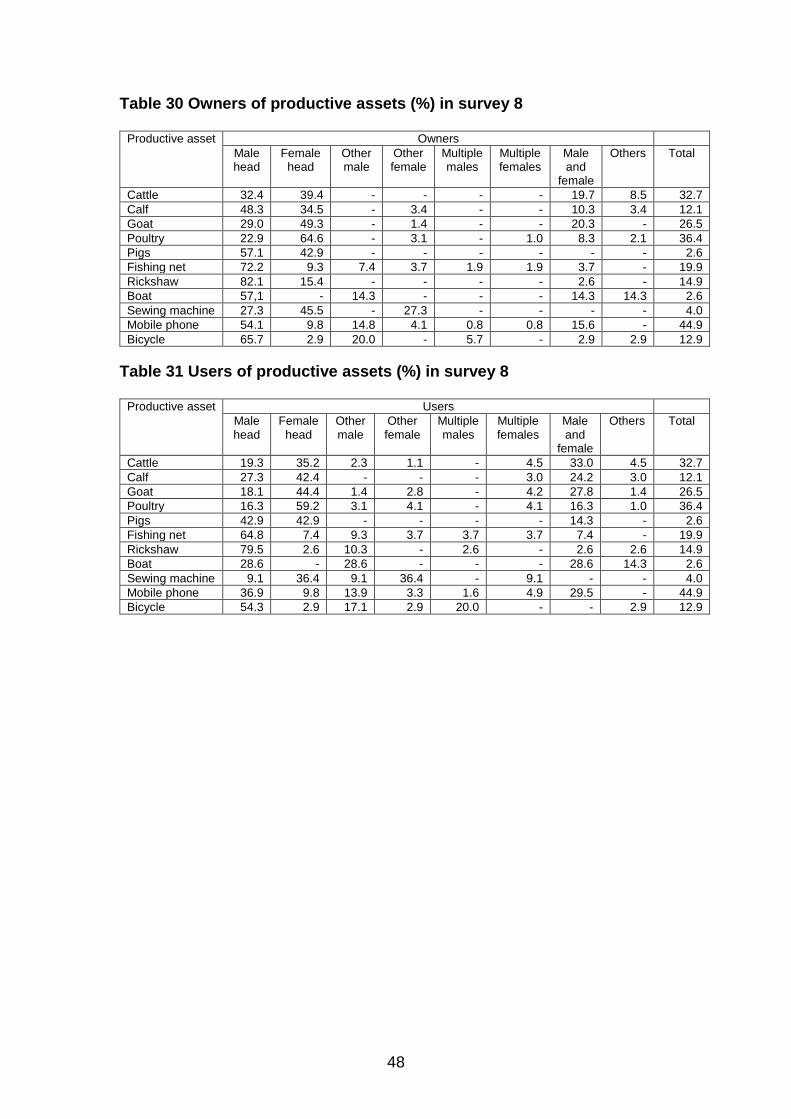
48
Table 30 Owners of productive assets (%) in survey 8
Productive asset Owners
Male head
Female head
Other male
Other female
Multiple males
Multiple females
Male and
female
Others Total
Cattle 32.4 39.4 - - - - 19.7 8.5 32.7
Calf 48.3 34.5 - 3.4 - - 10.3 3.4 12.1
Goat 29.0 49.3 - 1.4 - - 20.3 - 26.5
Poultry 22.9 64.6 - 3.1 - 1.0 8.3 2.1 36.4
Pigs 57.1 42.9 - - - - - - 2.6
Fishing net 72.2 9.3 7.4 3.7 1.9 1.9 3.7 - 19.9
Rickshaw 82.1 15.4 - - - - 2.6 - 14.9
Boat 57,1 - 14.3 - - - 14.3 14.3 2.6
Sewing machine 27.3 45.5 - 27.3 - - - - 4.0
Mobile phone 54.1 9.8 14.8 4.1 0.8 0.8 15.6 - 44.9
Bicycle 65.7 2.9 20.0 - 5.7 - 2.9 2.9 12.9
Table 31 Users of productive assets (%) in survey 8
Productive asset Users
Male head
Female head
Other male
Other female
Multiple males
Multiple females
Male and
female
Others Total
Cattle 19.3 35.2 2.3 1.1 - 4.5 33.0 4.5 32.7
Calf 27.3 42.4 - - - 3.0 24.2 3.0 12.1
Goat 18.1 44.4 1.4 2.8 - 4.2 27.8 1.4 26.5
Poultry 16.3 59.2 3.1 4.1 - 4.1 16.3 1.0 36.4
Pigs 42.9 42.9 - - - - 14.3 - 2.6
Fishing net 64.8 7.4 9.3 3.7 3.7 3.7 7.4 - 19.9
Rickshaw 79.5 2.6 10.3 - 2.6 - 2.6 2.6 14.9
Boat 28.6 - 28.6 - - - 28.6 14.3 2.6
Sewing machine 9.1 36.4 9.1 36.4 - 9.1 - - 4.0
Mobile phone 36.9 9.8 13.9 3.3 1.6 4.9 29.5 - 44.9
Bicycle 54.3 2.9 17.1 2.9 20.0 - - 2.9 12.9
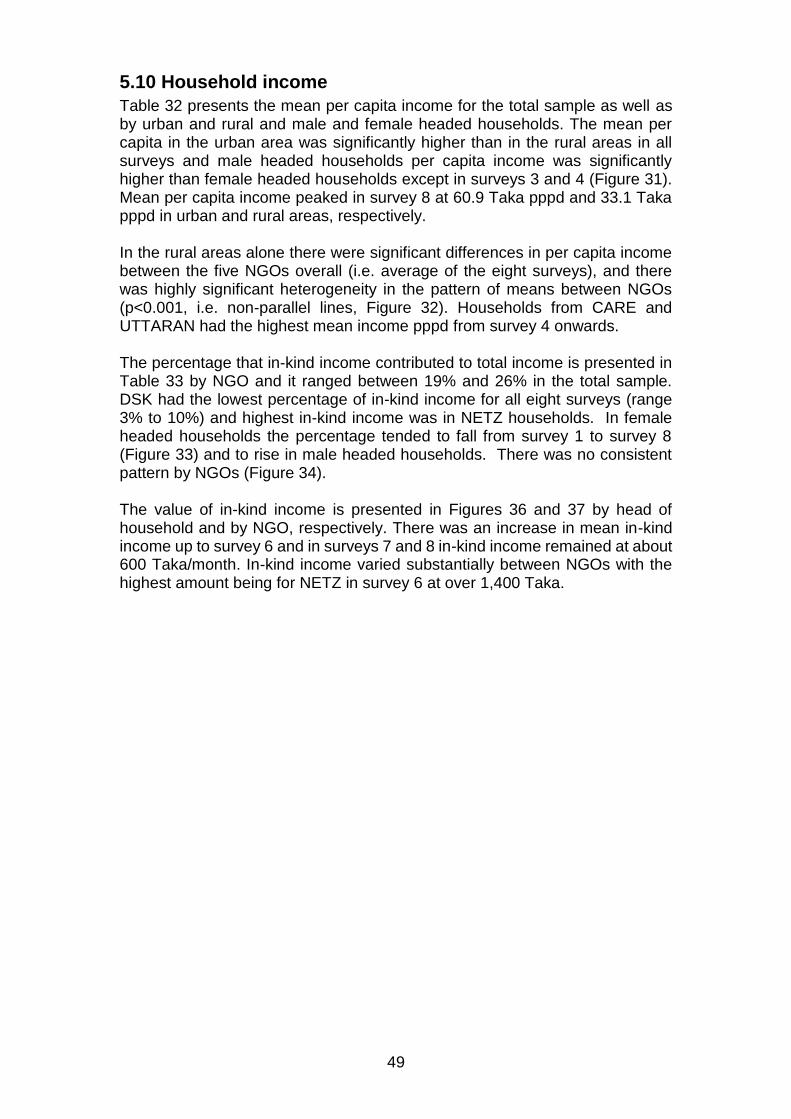
49
5.10 Household income
Table 32 presents the mean per capita income for the total sample as well as by urban and rural and male and female headed households. The mean per capita in the urban area was significantly higher than in the rural areas in all surveys and male headed households per capita income was significantly higher than female headed households except in surveys 3 and 4 (Figure 31). Mean per capita income peaked in survey 8 at 60.9 Taka pppd and 33.1 Taka pppd in urban and rural areas, respectively. In the rural areas alone there were significant differences in per capita income between the five NGOs overall (i.e. average of the eight surveys), and there was highly significant heterogeneity in the pattern of means between NGOs (p<0.001, i.e. non-parallel lines, Figure 32). Households from CARE and UTTARAN had the highest mean income pppd from survey 4 onwards. The percentage that in-kind income contributed to total income is presented in Table 33 by NGO and it ranged between 19% and 26% in the total sample. DSK had the lowest percentage of in-kind income for all eight surveys (range 3% to 10%) and highest in-kind income was in NETZ households. In female headed households the percentage tended to fall from survey 1 to survey 8 (Figure 33) and to rise in male headed households. There was no consistent pattern by NGOs (Figure 34). The value of in-kind income is presented in Figures 36 and 37 by head of household and by NGO, respectively. There was an increase in mean in-kind income up to survey 6 and in surveys 7 and 8 in-kind income remained at about 600 Taka/month. In-kind income varied substantially between NGOs with the highest amount being for NETZ in survey 6 at over 1,400 Taka.

50
Table 32 Mean income per capita (Taka per person per day) by head of household over the eight surveys (using HIES criteria which do not include in-kind income)
Survey Urban Rural Total
Male Female P Total Male Female p Total Male Female p Total
1 25.6 25.6 ns 25.6 19.8 12.1 <0.001 17.0 20.3 14.0 <0.001 17.8
2 38.2 36.5 ns 37.3 18.6 12.4 <0.001 16.4 20.1 15.9 0.039 18.5
3 48.8 42.8 ns 45.6 15.9 13.3 ns 14.9 18.3 17.2 ns 17.9
4 55.8 50.1 ns 52.6 26.0 18.9 0.001 23.4 28.2 23.3 ns 26.3
5 56.0 33.2 0.036 43.3 29.8 19.5 0.001 26.0 31.7 21.4 0.001 27.7
6 48.5 34.3 ns 40.6 30.9 22.3 0.010 27.7 32.1 24.0 0.010 29.0
7 55.8 42.9 ns 48.6 31.0 24.0 0.027 28.4 32.8 26.7 0.049 30.4
8 72.4 51.8 ns 60.9 36.0 28.4 0.028 33.1 38.6 31.7 0.050 35.9
Table 33 In-kind income as a percentage of total income by NGO over the eight surveys
NGO Survey
1 2 3 4 5 6 7 8
CARE 15 16 18 12 16 21 16 17
DSK 5 3 7 5 8 10 9 7
NETZ 18 32 38 25 31 38 34 25
PAB 16 22 29 24 17 23 21 18
SCF 25 11 22 21 14 21 17 16
UTTARAN 21 22 22 20 13 15 14 17
Total 18 19 24 19 18 23 20 18
Rural 19 21 26 21 19 24 21 19
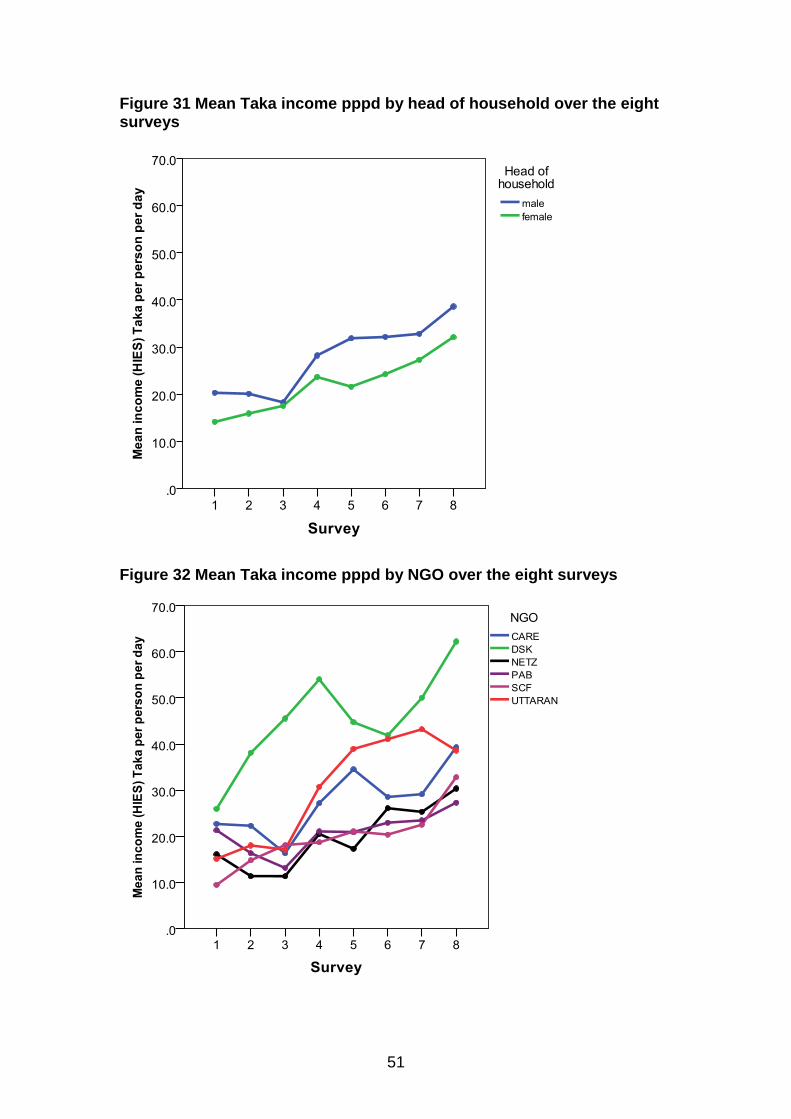
51
Figure 31 Mean Taka income pppd by head of household over the eight surveys
Figure 32 Mean Taka income pppd by NGO over the eight surveys
52
Figure 33 Mean in-kind income as a percentage of total income by head of household over the eight surveys
Figure 34 Mean in-kind income by percentage of total income by NGO over the eight surveys
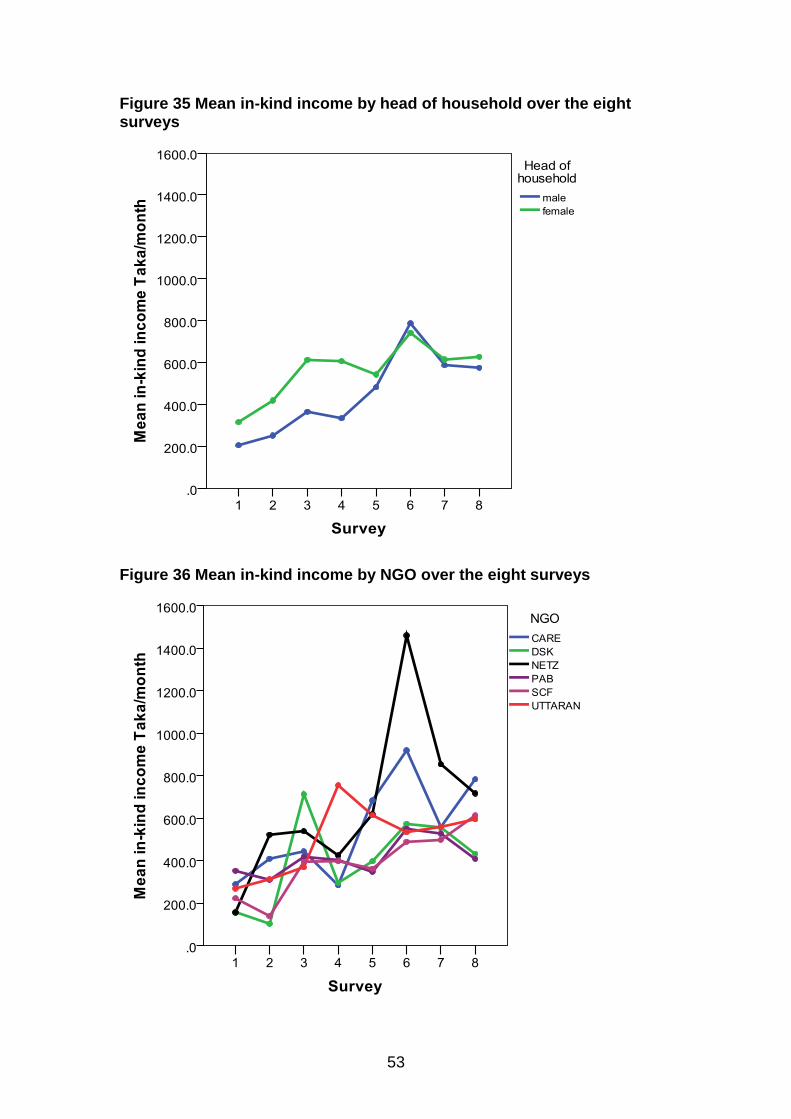
53
Figure 35 Mean in-kind income by head of household over the eight surveys
Figure 36 Mean in-kind income by NGO over the eight surveys
54
5.11 Expenditure
Total expenditure has been captured under three headings of food, household and work-related. Expenditure used HIES criteria and omitted irregular expenditures such as wedding expenses. Mean food per capita expenditure did not show a consistent pattern over the eight surveys and was highest in survey 8 in both male and female headed households (Figure 37). On average, male headed households showed higher food expenditure than female headed household over the eight surveys by about 2 Taka pppd. The urban area had the highest mean food expenditure (Figure 38) across all eight surveys and the gap widened in survey 8 to about 5 Taka pppd. The pattern of food per capita expenditure varied significantly (p<0.001) between rural NGOs across surveys and UTTARAN moved from having close to the lowest mean food expenditure of any rural NGO in survey 1 to having the highest mean food expenditure of the rural NGOs from survey 5 onwards (Figure 38). Household per capita expenditure increased very slightly over the eight surveys from around 5 Taka pppd to 7-8 Taka pppd but there was no significant difference between male and female headed means (Figure 39). Spending on household items was much higher in the urban areas (Figure 40) and it rose from about 14 Taka pppd in survey 1 to about 25 Taka in surveys 7 and 8. There was no significant differences between the overall rural means and expenditure ranged between 3 and 10 Taka pppd over the eight surveys. Work related per capita expenditure increase very slightly from 0.25 Taka pppd in survey 1 to about 1 Taka pppd in survey 8. Male headed households spent about 0.5 Taka pppd more than female headed households over the eight surveys (Figure 41). There was some variation in work related expenditure between NGOs with higher expenditure in DSK in all eight surveys and increased expenditure by CARE households in surveys 7 and 8 (Figure 42). Total per capita expenditure increased significantly over the eight surveys from a low in survey 2 of 19.4 Taka pppd up to the highest in survey 8 of 28.4 Taka pppd (Table 34). There were no significant differences in means between male and female headed households (Figure 43). Overall the urban areas had the greatest mean expenditure (Figure 44) and the gap between urban and rural households increased from about 20 Taka pppd in survey 6 to 26 Taka pppd in survey 8. The rural analyses indicated no significant differences in overall means between rural NGOs over the eight surveys.
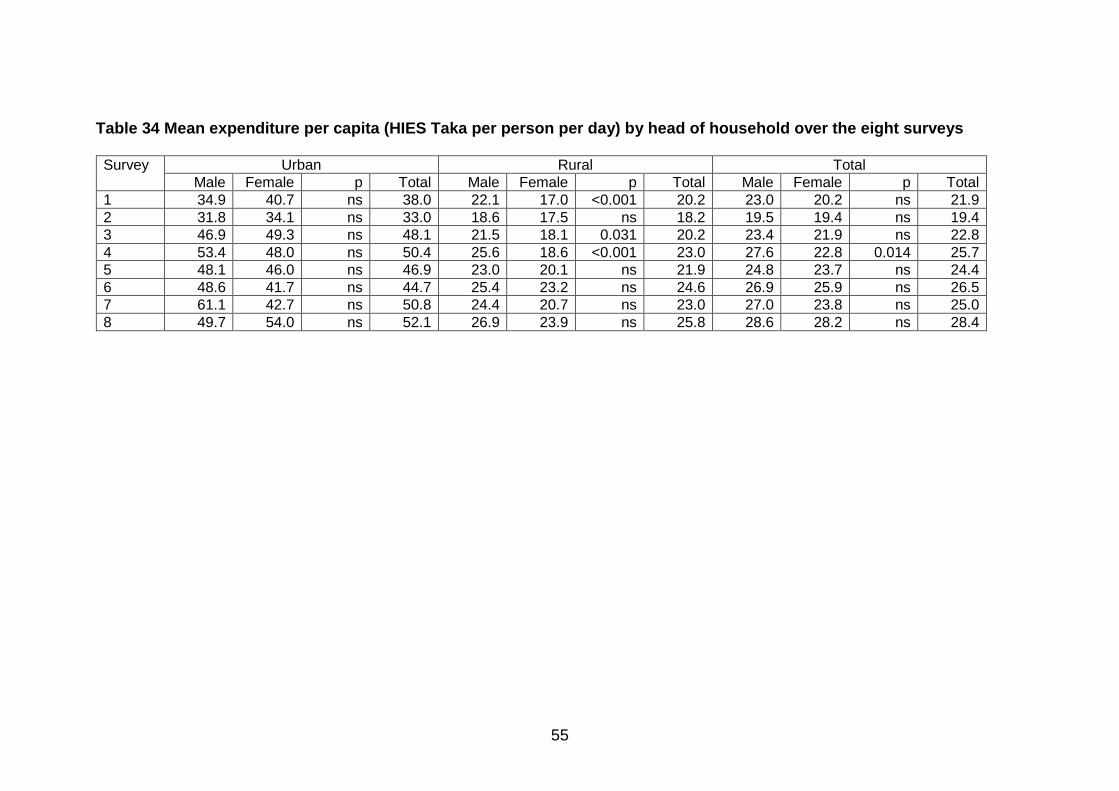
55
Table 34 Mean expenditure per capita (HIES Taka per person per day) by head of household over the eight surveys Survey Urban Rural Total
Male Female p Total Male Female p Total Male Female p Total 1 34.9 40.7 ns 38.0 22.1 17.0 <0.001 20.2 23.0 20.2 ns 21.9 2 31.8 34.1 ns 33.0 18.6 17.5 ns 18.2 19.5 19.4 ns 19.4 3 46.9 49.3 ns 48.1 21.5 18.1 0.031 20.2 23.4 21.9 ns 22.8 4 53.4 48.0 ns 50.4 25.6 18.6 <0.001 23.0 27.6 22.8 0.014 25.7 5 48.1 46.0 ns 46.9 23.0 20.1 ns 21.9 24.8 23.7 ns 24.4 6 48.6 41.7 ns 44.7 25.4 23.2 ns 24.6 26.9 25.9 ns 26.5 7 61.1 42.7 ns 50.8 24.4 20.7 ns 23.0 27.0 23.8 ns 25.0 8 49.7 54.0 ns 52.1 26.9 23.9 ns 25.8 28.6 28.2 ns 28.4
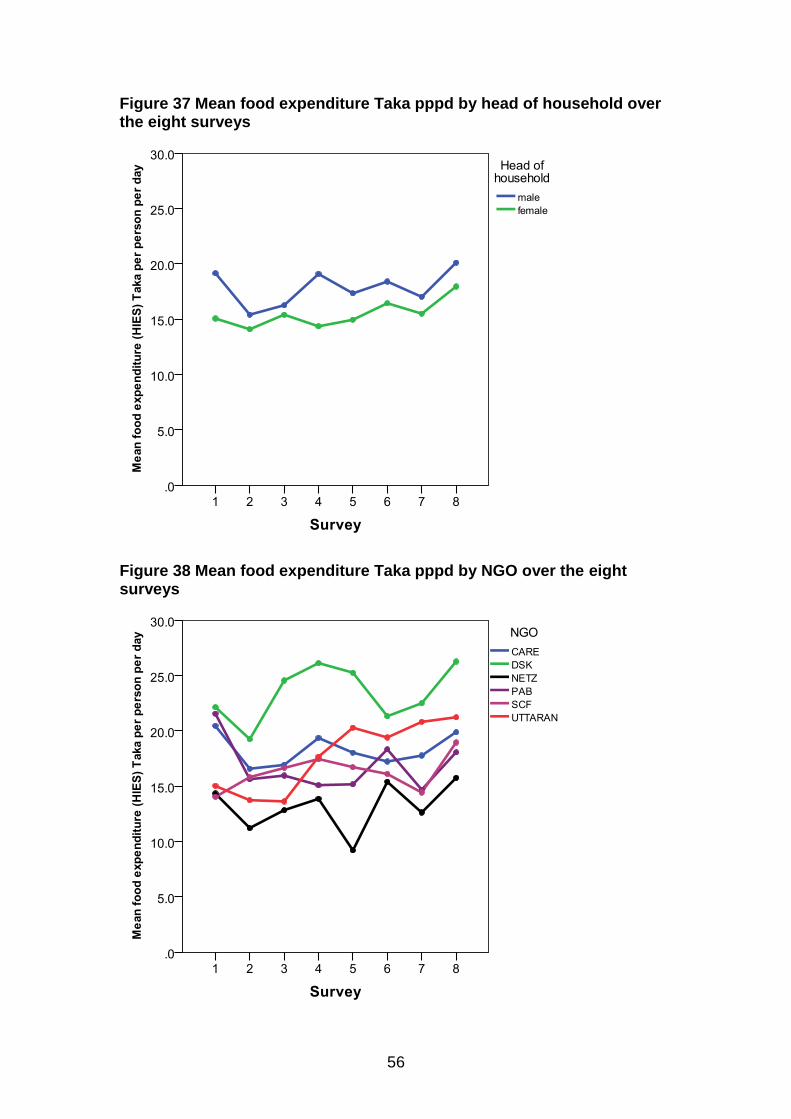
56
Figure 37 Mean food expenditure Taka pppd by head of household over the eight surveys
Figure 38 Mean food expenditure Taka pppd by NGO over the eight surveys
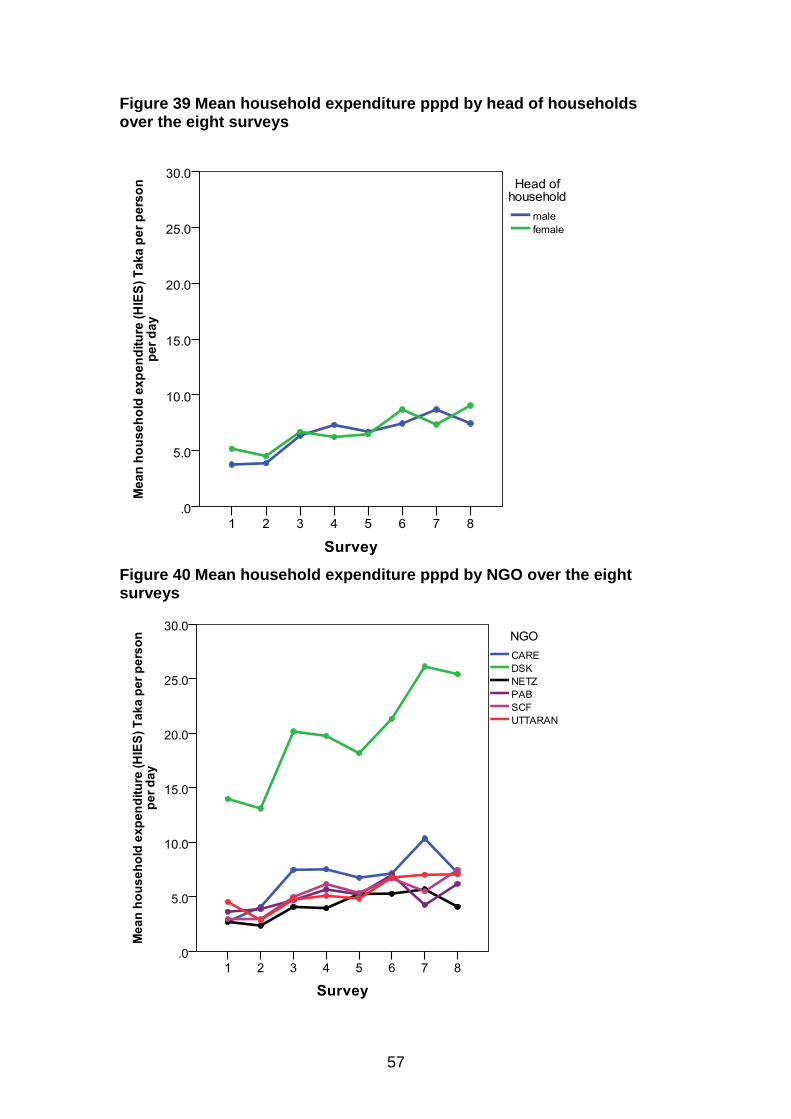
57
Figure 39 Mean household expenditure pppd by head of households over the eight surveys
Figure 40 Mean household expenditure pppd by NGO over the eight surveys
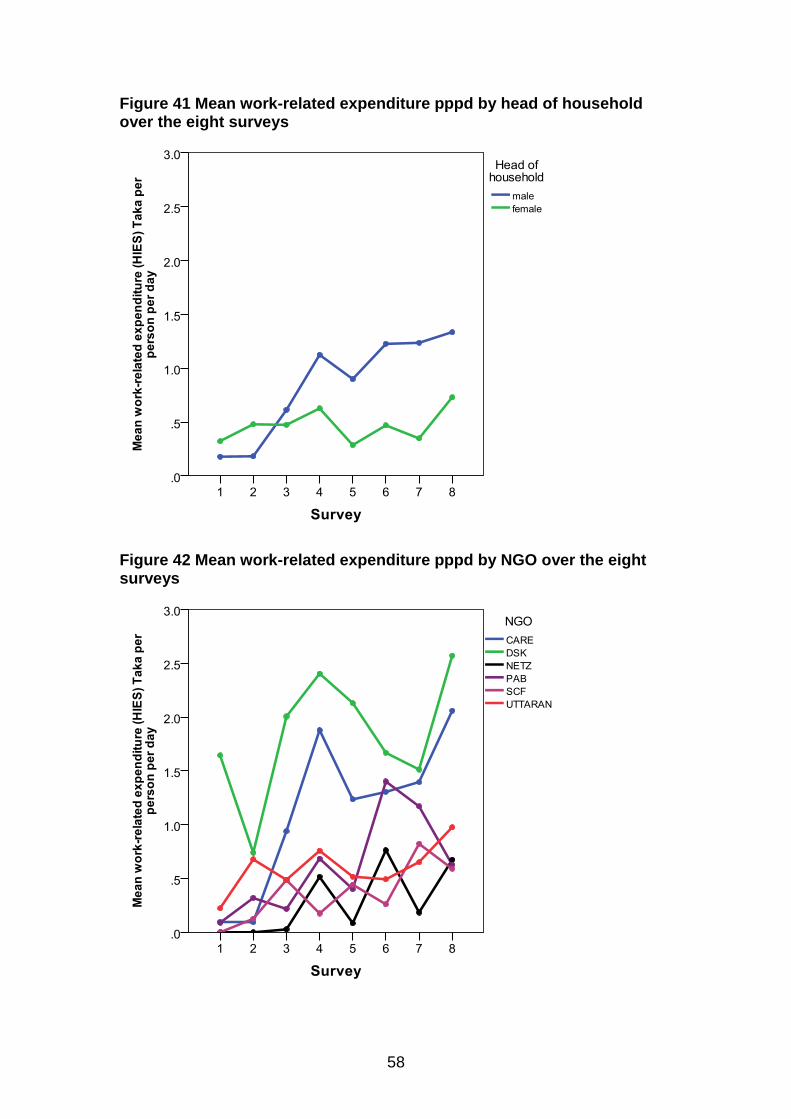
58
Figure 41 Mean work-related expenditure pppd by head of household over the eight surveys
Figure 42 Mean work-related expenditure pppd by NGO over the eight surveys
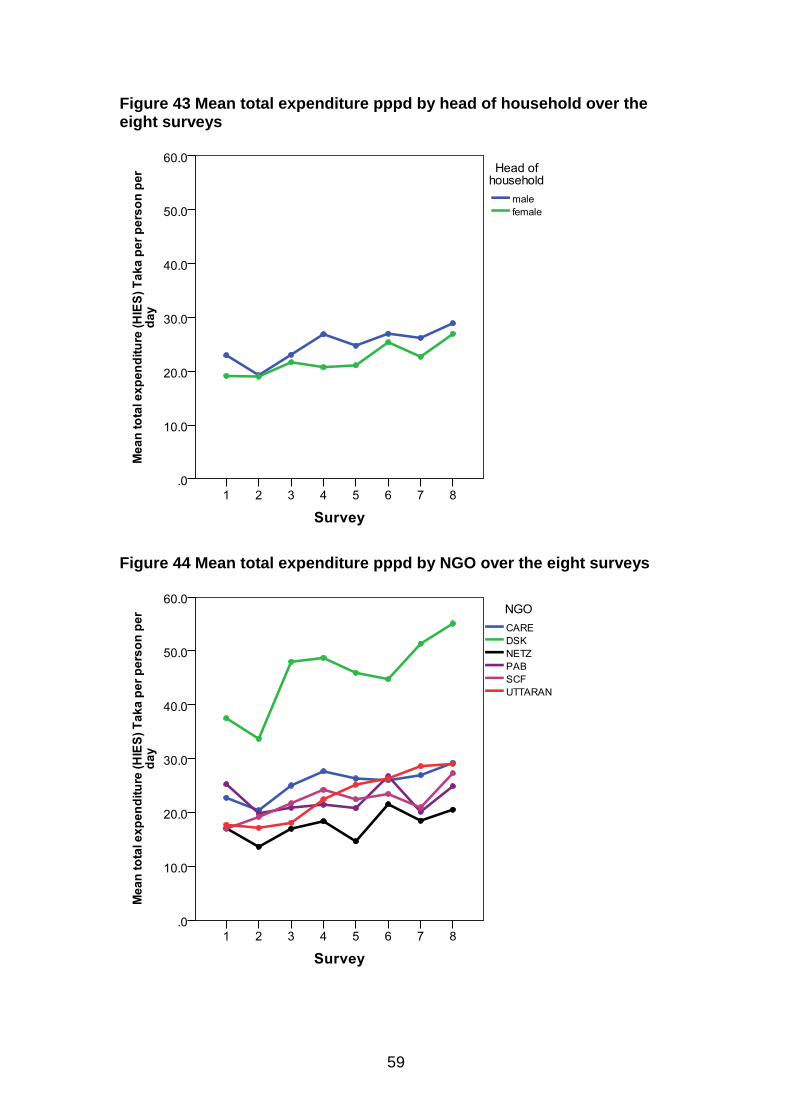
59
Figure 43 Mean total expenditure pppd by head of household over the eight surveys
Figure 44 Mean total expenditure pppd by NGO over the eight surveys
60
5.12 Difference between household income and expenditure
The difference between household income and expenditure based on HIES criteria of income minus expenditure (positive sign indicates credit and negative sign debit) was calculated for each household at each survey. Repeated measures analysis of variance was used to examine the pattern of credit/debit over the eight surveys and on average households went from a debit in surveys 1 to 3 (-514, -18, -52 Taka/month respectively) to increasing credit in surveys 4 to 8 (+590, +882, +1,116, +1,134 and +1,283 Taka/month, respectively. Male headed households were significantly more in credit than female headed households over the 8 surveys by on average 400 Taka/month (Figure 45). When the average of the eight surveys was calculated all NGOs were in credit ranging from 156 Taka/month (SCF) to 1,147 Taka/month (UTTARAN, Figure 46).
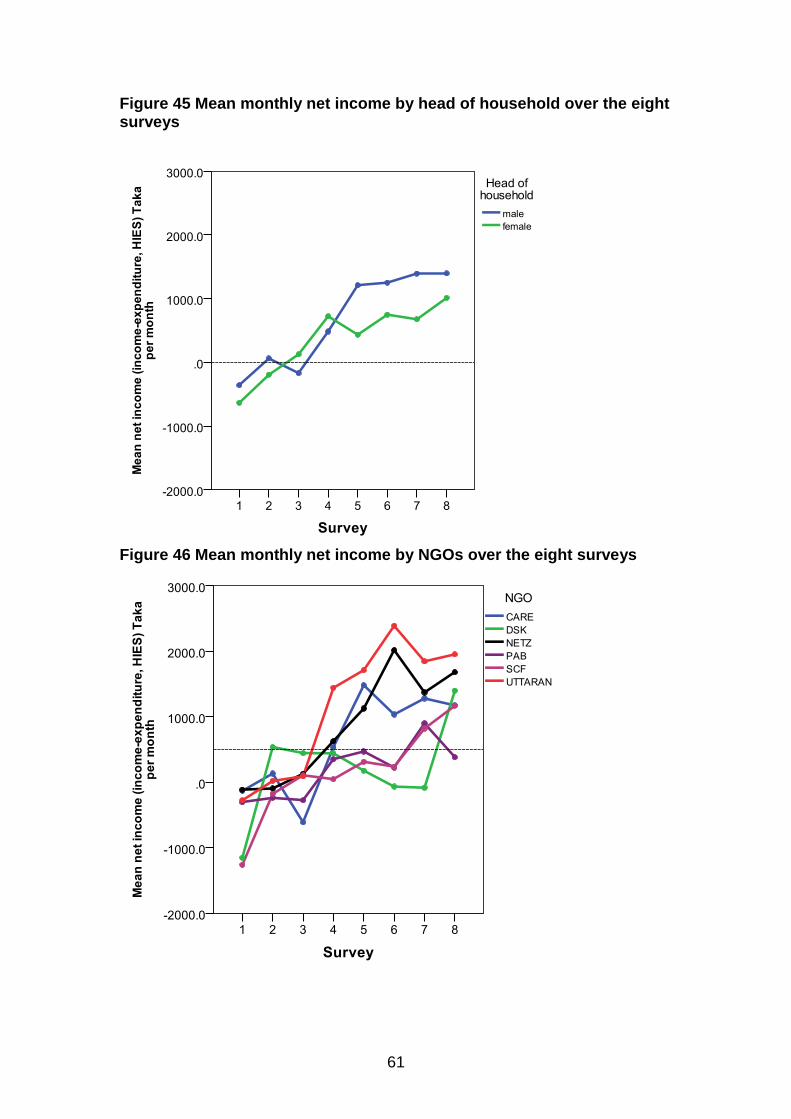
61
Figure 45 Mean monthly net income by head of household over the eight surveys
Figure 46 Mean monthly net income by NGOs over the eight surveys
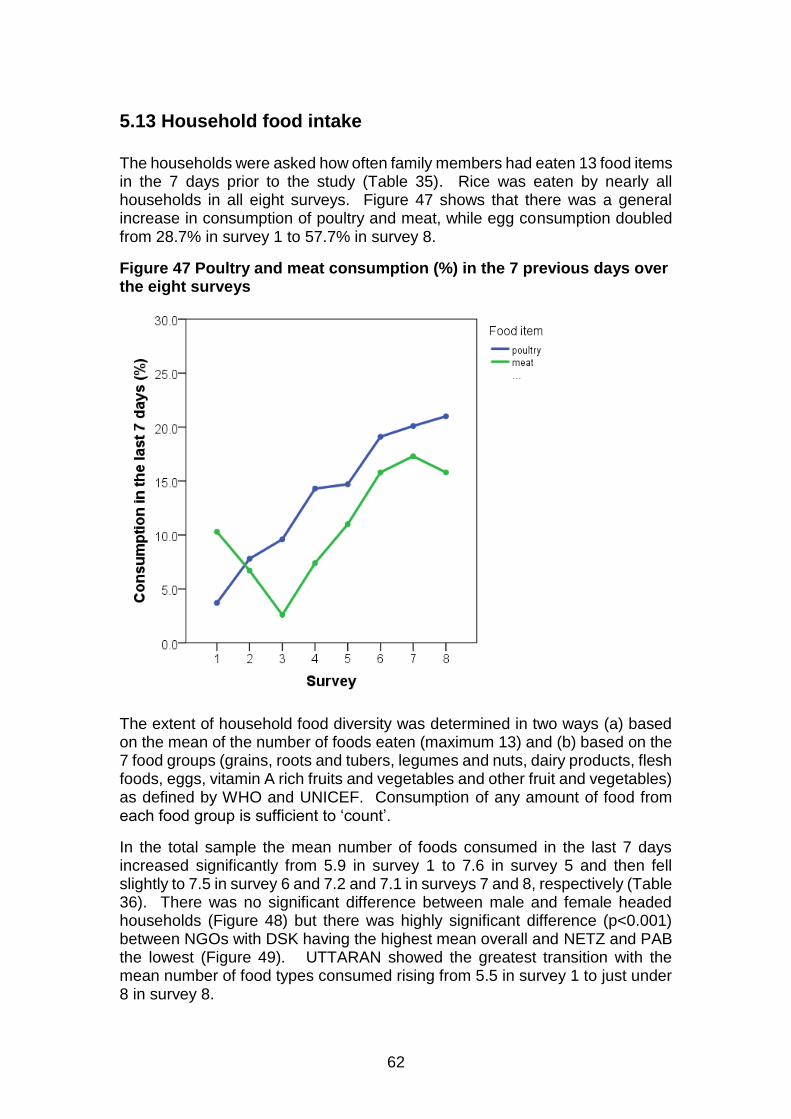
62
5.13 Household food intake
The households were asked how often family members had eaten 13 food items in the 7 days prior to the study (Table 35). Rice was eaten by nearly all households in all eight surveys. Figure 47 shows that there was a general increase in consumption of poultry and meat, while egg consumption doubled from 28.7% in survey 1 to 57.7% in survey 8.
Figure 47 Poultry and meat consumption (%) in the 7 previous days over the eight surveys
The extent of household food diversity was determined in two ways (a) based on the mean of the number of foods eaten (maximum 13) and (b) based on the 7 food groups (grains, roots and tubers, legumes and nuts, dairy products, flesh foods, eggs, vitamin A rich fruits and vegetables and other fruit and vegetables) as defined by WHO and UNICEF. Consumption of any amount of food from each food group is sufficient to ‘count’.
In the total sample the mean number of foods consumed in the last 7 days increased significantly from 5.9 in survey 1 to 7.6 in survey 5 and then fell slightly to 7.5 in survey 6 and 7.2 and 7.1 in surveys 7 and 8, respectively (Table 36). There was no significant difference between male and female headed households (Figure 48) but there was highly significant difference (p<0.001) between NGOs with DSK having the highest mean overall and NETZ and PAB the lowest (Figure 49). UTTARAN showed the greatest transition with the mean number of food types consumed rising from 5.5 in survey 1 to just under 8 in survey 8.
63
Overall food diversity rose from 4.3 in survey 1 to 5.3 in survey 5 and fell slightly to 5.2 for surveys 6 to 8. There was no significant difference between male and female headed household food diversity means (Figure 50). DSK had the highest mean diversity over the eight surveys (5.6) and PAB the least (4.6, p<0.001, Figure 51). UTTARAN increased from 4.2 in survey 1 to 5.6 in survey 8.

64
Table 35 Number of days (%) in the last week that household members consumed foodstuffs over the eight surveys
Number of days food consumed
Survey p
1 2 3 4 5 6 7 8
Rice 0 1 2 3+
0 0 0
100
0 0 0
100
0
0.4 0
99.6
0 0 0
100
0.4 0.4
0 99.3
0 0 0
100
0 0 0
100
0 0 0
100
-
Flour 0 1 2 3+
71.0 12.1 7.4 9.6
63.9 16.4 11.5 8.2
65.8 16.9 11.8 5.5
77.9 7.4 7.4 7.4
68.4 11.0 10.3 10.3
63.6 12.5 11.0 12.9
77.9 9.6 5.9 6.6
77.6 8.5 6.6 7.4
<0.001
Pulse 0 1 2 3+
62.5 23.2 8.8 5.5
37.2 33.1 21.2 8.6
36.4 26.5 23.9 13.2
55.9 23.9 14.0 6.3
38.2 22.8 21.0 18.0
48.2 15.1 21.3 15.4
44.9 21.0 21.0 13.2
34.9 32.0 19.9 13.2
<0.001
Potato 0 1 2 3+
1.8 1.5 5.9
90.8
2.6 3.0
10.0 84.4
9.2 8.1
14.0 68.8
0.7
0 0
99.3
1.5 2.2 5.9
90.4
5.1 1.8 7.0
86.0
0.7 1.1 1.5
96.7
0.7 0.4 1.5
97.4
<0.001
Green vegetables 0 1 2 3+
16.9 17.3 29.4 36.4
5.9
11.9 25.7 56.5
5.1
14.7 28.7 51.5
13.2 22.8 31.6 32.4
4.0 9.6
28.7 57.7
4.8
14.3 28.3 52.6
7.0
15.8 37.1 40.1
7.4
20.6 31.3 40.8
<0.001
Other vegetables 0 1 2 3+
5.9 4.0
24,6 65.4
5.6 6.3
21.6 66.5
18.0 9.2
19.1 53.7
9.6
11.0 18.4 61.0
5.9
11.0 16.9 66.2
1.8 3.7 8.1
86.4
2.9 4.8
20.6 71.7
2.6 4.4
15.1 77.9
<0.001
Fruits 0 1 2 3+
91.9 5.9 0.7 1.5
56.1 27.9 7.4 8.6
57.0 17.6 14.0 11.4
75.7 8.5
11.0 4.8
34.2 25.0 20.2 20.6
57.0 16.5 12.5 14.0
71.0 11.0 10.7 7.4
74.6 12.9 7.7 4.8
<0.001
Milk 0 1 2 3+
92.6 4.4 1.1 1.8
84.8 8.6 4.1 2.6
86.0 5.1 4.4 4.4
84.9 9.2 1.5 4.4
77.2 9.2 4.0 9.6
75.4 11.0 4.4 9.2
80.9 6.3 4.8 8.1
84.6 6.3 1.8 7.4
0.007
Eggs 0 1 2 3+
71.3 22.4 3.7 2.6
54.3 31.2 10.4 4.1
57.0 21.7 16.9 4.4
41.2 25.7 18.8 14.3
40.4 29.8 15.4 14.3
37.9 22.4 20.6 19.1
35.3 28.7 21.3 14.7
42.3 30.1 18.0 9.6
<0.001
Fresh fish 0 1 2 3+
37.1 34.9 16.9 11.0
20.1 35.7 21.2 23.0
9.9
24.6 26.8 38.6
24.3 27.6 22.4 25.7
18.0 24.6 18.0 39.3
12.1 13.2 21.0 53.7
15.8 21.7 19.1 43.4
19.5 27.9 22.4 30.1
<0.001
Dried fish 0 1 2 3+
75.4 9.6 8.1 7.0
80.3 9.7 5.2 4.8
80.9 7.0 3.7 8.5
80.5 7.0 5.5 7.0
77.2 5.1 7.0
10.7
77.6 6.6 8.5 7.4
77.6 5.9 8.5 8.1
82.4 7.4 3.7 6.6
ns
Poultry 0 1 2 3+
96.3 2.6 0.4 0.7
92.2 7.1
0 0.7
90.4 8.8 0.4 0.4
85.7 11.0 2.6 0.7
85.3 9.9 3.7 1.1
80.9 13.6 4.4 1.1
79.9 13.2 4.8 2.2
79.0 18.4 1.1 1.5
<0.001
Meat 0 1 2 3+
89.7 7.7 1.8 0.7
93.3 4.8 0.4 1.5
97.4 1.1 0.4 1.1
92.6 6.3 0.7 0.4
89.0 8.5 2.2 0.4
84.2 10.7 2.2 2.9
82.7 11.8 4.4 1.1
84.2 12.5 2.9 0.4
<0.001
Mean foods eaten 5.9 7.0 6.9 6.6 7.6 7.5 7.2 7.1 <0.001
Mean food diversity
4.3 4.9 4.9 4.8 5.3 5.2 5.2 5.2 <0.001

65
Figure 48 Mean number of food types consumed by head of household over the eight surveys
Figure 49 Mean number of food types consumed by NGO over the eight surveys
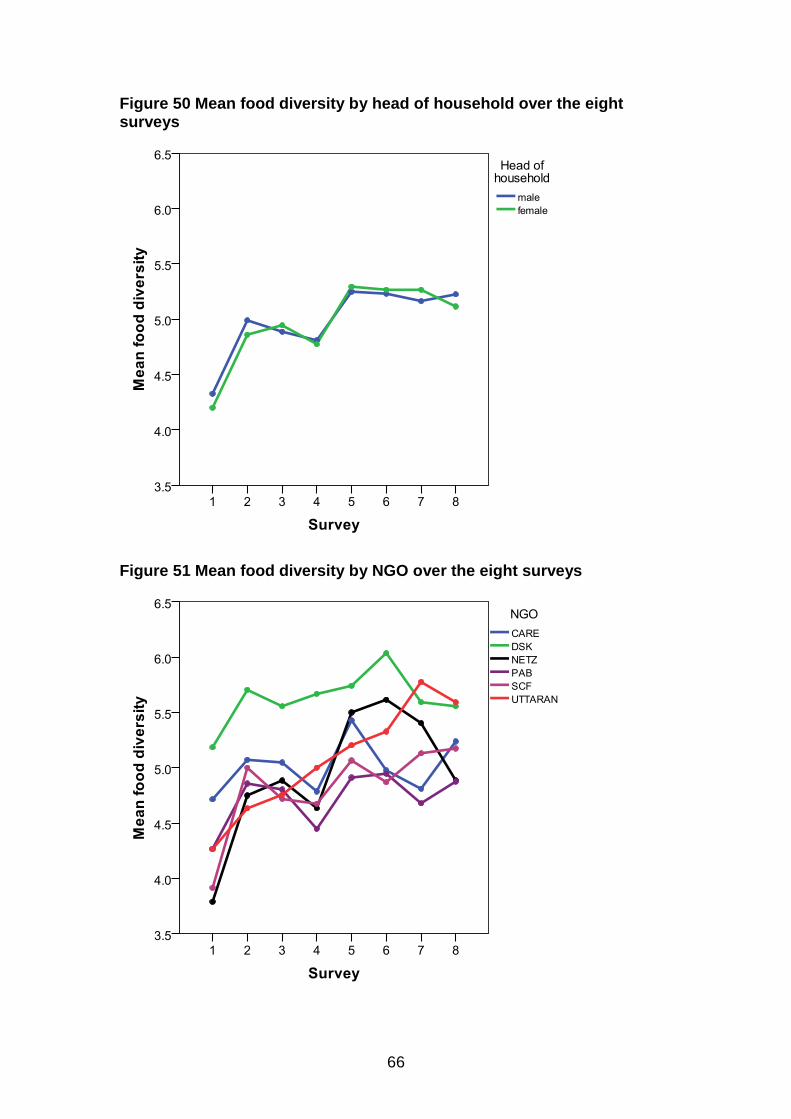
66
Figure 50 Mean food diversity by head of household over the eight surveys
Figure 51 Mean food diversity by NGO over the eight surveys
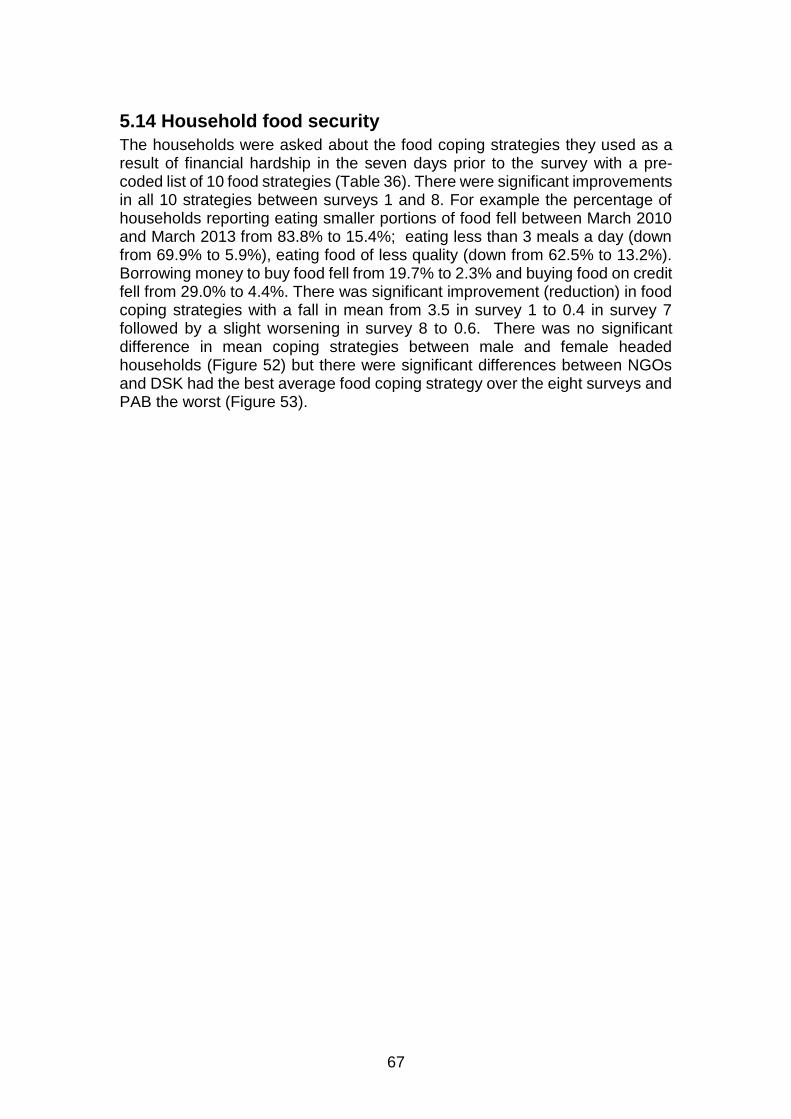
67
5.14 Household food security
The households were asked about the food coping strategies they used as a result of financial hardship in the seven days prior to the survey with a pre-coded list of 10 food strategies (Table 36). There were significant improvements in all 10 strategies between surveys 1 and 8. For example the percentage of households reporting eating smaller portions of food fell between March 2010 and March 2013 from 83.8% to 15.4%; eating less than 3 meals a day (down from 69.9% to 5.9%), eating food of less quality (down from 62.5% to 13.2%). Borrowing money to buy food fell from 19.7% to 2.3% and buying food on credit fell from 29.0% to 4.4%. There was significant improvement (reduction) in food coping strategies with a fall in mean from 3.5 in survey 1 to 0.4 in survey 7 followed by a slight worsening in survey 8 to 0.6. There was no significant difference in mean coping strategies between male and female headed households (Figure 52) but there were significant differences between NGOs and DSK had the best average food coping strategy over the eight surveys and PAB the worst (Figure 53).
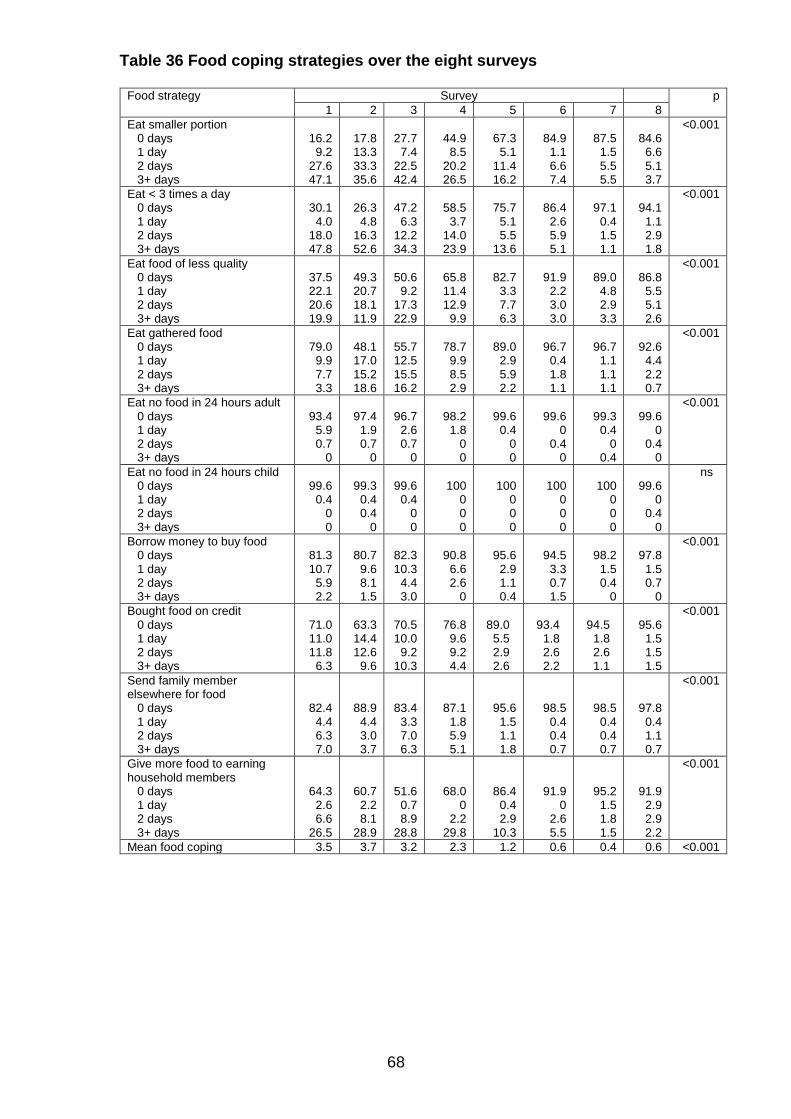
68
Table 36 Food coping strategies over the eight surveys
Food strategy Survey p
1 2 3 4 5 6 7 8
Eat smaller portion 0 days 1 day 2 days 3+ days
16.2
9.2 27.6 47.1
17.8 13.3 33.3 35.6
27.7
7.4 22.5 42.4
44.9
8.5 20.2 26.5
67.3
5.1 11.4 16.2
84.9
1.1 6.6 7.4
87.5
1.5 5.5 5.5
84.6
6.6 5.1 3.7
<0.001
Eat < 3 times a day 0 days 1 day 2 days 3+ days
30.1
4.0 18.0 47.8
26.3
4.8 16.3 52.6
47.2
6.3 12.2 34.3
58.5
3.7 14.0 23.9
75.7
5.1 5.5
13.6
86.4
2.6 5.9 5.1
97.1
0.4 1.5 1.1
94.1
1.1 2.9 1.8
<0.001
Eat food of less quality 0 days 1 day 2 days 3+ days
37.5 22.1 20.6 19.9
49.3 20.7 18.1 11.9
50.6
9.2 17.3 22.9
65.8 11.4 12.9
9.9
82.7
3.3 7.7 6.3
91.9
2.2 3.0 3.0
89.0
4.8 2.9 3.3
86.8
5.5 5.1 2.6
<0.001
Eat gathered food 0 days 1 day 2 days 3+ days
79.0
9.9 7.7 3.3
48.1 17.0 15.2 18.6
55.7 12.5 15.5 16.2
78.7
9.9 8.5 2.9
89.0
2.9 5.9 2.2
96.7
0.4 1.8 1.1
96.7
1.1 1.1 1.1
92.6
4.4 2.2 0.7
<0.001
Eat no food in 24 hours adult 0 days 1 day 2 days 3+ days
93.4
5.9 0.7
0
97.4
1.9 0.7
0
96.7
2.6 0.7
0
98.2
1.8 0 0
99.6
0.4 0 0
99.6
0 0.4
0
99.3
0.4 0
0.4
99.6
0 0.4
0
<0.001
Eat no food in 24 hours child 0 days 1 day 2 days 3+ days
99.6
0.4 0 0
99.3
0.4 0.4
0
99.6
0.4 0 0
100
0 0 0
100
0 0 0
100
0 0 0
100
0 0 0
99.6
0 0.4
0
ns
Borrow money to buy food 0 days 1 day 2 days 3+ days
81.3 10.7
5.9 2.2
80.7
9.6 8.1 1.5
82.3 10.3
4.4 3.0
90.8
6.6 2.6
0
95.6
2.9 1.1 0.4
94.5
3.3 0.7 1.5
98.2
1.5 0.4
0
97.8
1.5 0.7
0
<0.001
Bought food on credit 0 days 1 day 2 days 3+ days
71.0 11.0 11.8
6.3
63.3 14.4 12.6
9.6
70.5 10.0
9.2 10.3
76.8
9.6 9.2 4.4
89.0
5.5 2.9 2.6
93.4
1.8 2.6 2.2
94.5
1.8 2.6 1.1
95.6
1.5 1.5 1.5
<0.001
Send family member elsewhere for food 0 days 1 day 2 days 3+ days
82.4 4.4 6.3 7.0
88.9 4.4 3.0 3.7
83.4 3.3 7.0 6.3
87.1 1.8 5.9 5.1
95.6 1.5 1.1 1.8
98.5 0.4 0.4 0.7
98.5 0.4 0.4 0.7
97.8 0.4 1.1 0.7
<0.001
Give more food to earning household members 0 days 1 day 2 days 3+ days
64.3 2.6 6.6
26.5
60.7 2.2 8.1
28.9
51.6 0.7 8.9
28.8
68.0 0
2.2 29.8
86.4 0.4 2.9
10.3
91.9 0
2.6 5.5
95.2 1.5 1.8 1.5
91.9 2.9 2.9 2.2
<0.001
Mean food coping 3.5 3.7 3.2 2.3 1.2 0.6 0.4 0.6 <0.001
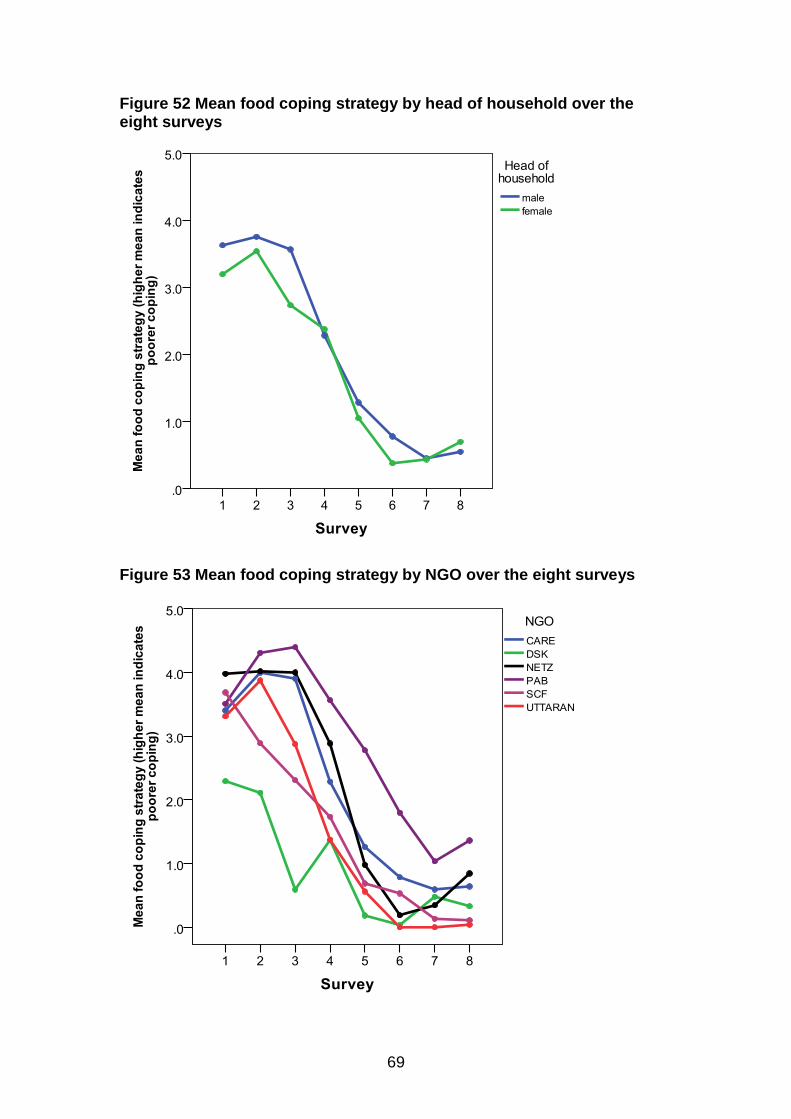
69
Figure 52 Mean food coping strategy by head of household over the eight surveys
Figure 53 Mean food coping strategy by NGO over the eight surveys
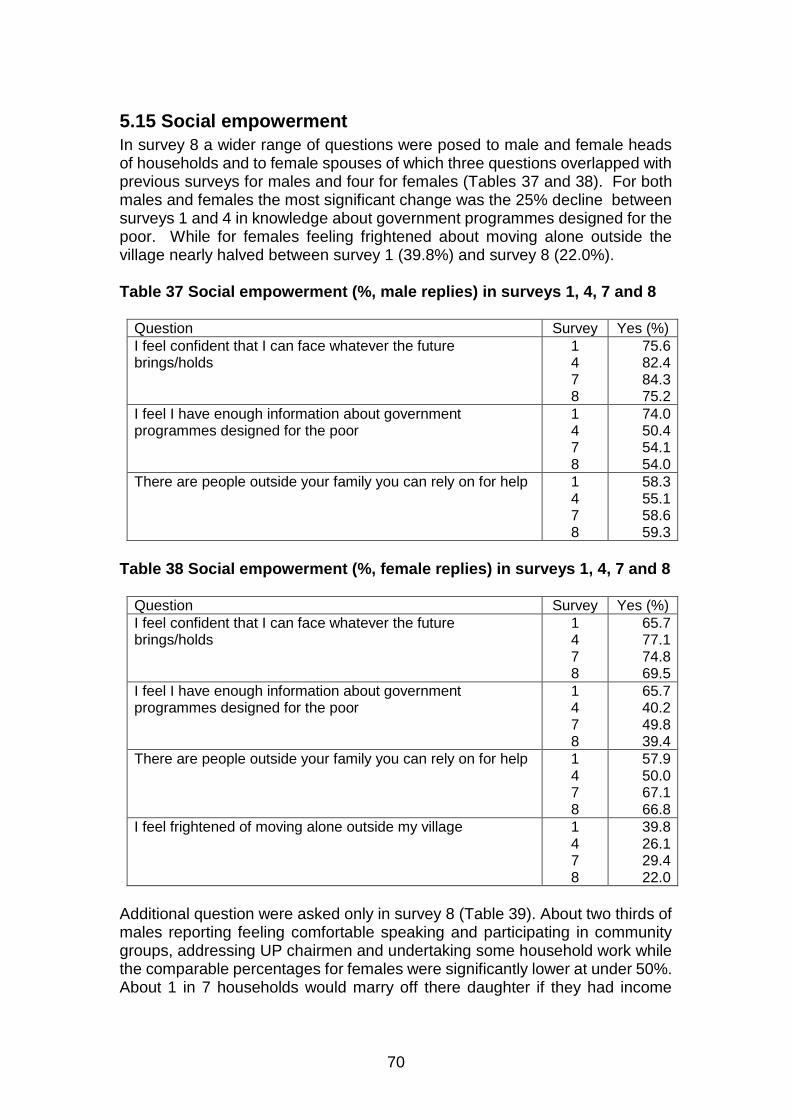
70
5.15 Social empowerment
In survey 8 a wider range of questions were posed to male and female heads of households and to female spouses of which three questions overlapped with previous surveys for males and four for females (Tables 37 and 38). For both males and females the most significant change was the 25% decline between surveys 1 and 4 in knowledge about government programmes designed for the poor. While for females feeling frightened about moving alone outside the village nearly halved between survey 1 (39.8%) and survey 8 (22.0%). Table 37 Social empowerment (%, male replies) in surveys 1, 4, 7 and 8
Question Survey Yes (%) I feel confident that I can face whatever the future brings/holds
1 4 7 8
75.6 82.4 84.3 75.2
I feel I have enough information about government programmes designed for the poor
1 4 7 8
74.0 50.4 54.1 54.0
There are people outside your family you can rely on for help 1 4 7 8
58.3 55.1 58.6 59.3
Table 38 Social empowerment (%, female replies) in surveys 1, 4, 7 and 8
Question Survey Yes (%) I feel confident that I can face whatever the future brings/holds
1 4 7 8
65.7 77.1 74.8 69.5
I feel I have enough information about government programmes designed for the poor
1 4 7 8
65.7 40.2 49.8 39.4
There are people outside your family you can rely on for help 1 4 7 8
57.9 50.0 67.1 66.8
I feel frightened of moving alone outside my village 1 4 7 8
39.8 26.1 29.4 22.0
Additional question were asked only in survey 8 (Table 39). About two thirds of males reporting feeling comfortable speaking and participating in community groups, addressing UP chairmen and undertaking some household work while the comparable percentages for females were significantly lower at under 50%. About 1 in 7 households would marry off there daughter if they had income
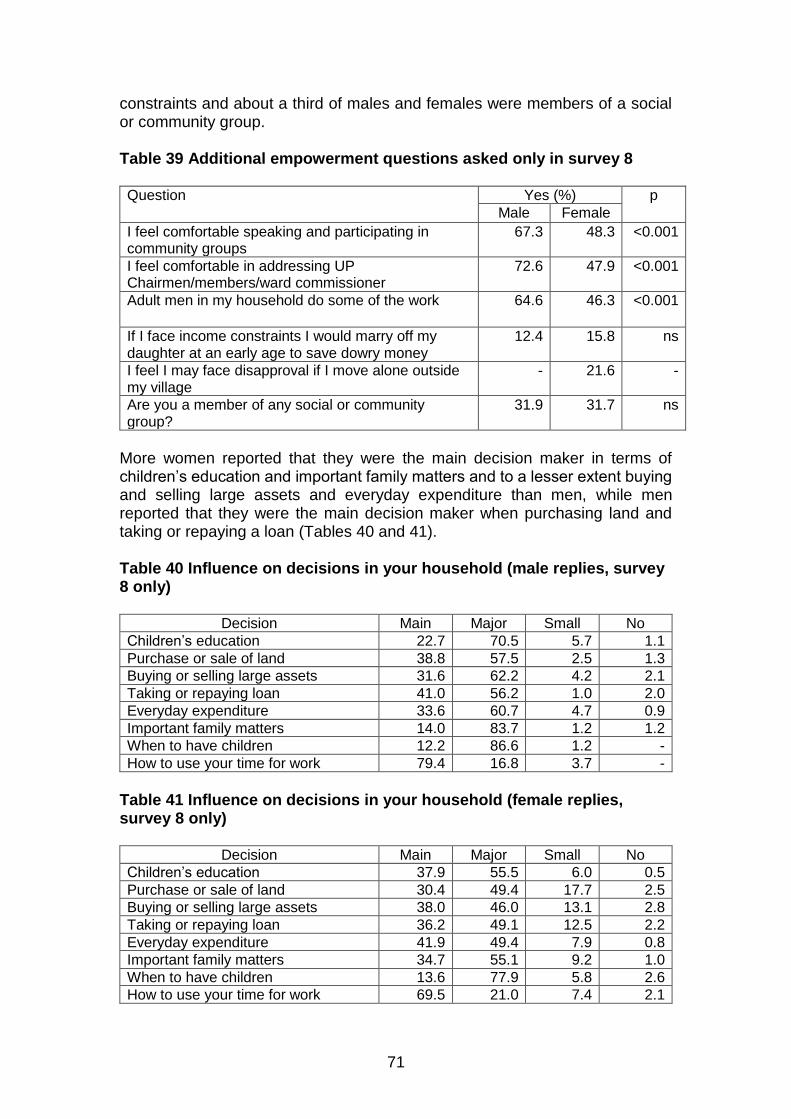
71
constraints and about a third of males and females were members of a social or community group. Table 39 Additional empowerment questions asked only in survey 8 Question Yes (%) p
Male Female I feel comfortable speaking and participating in community groups
67.3 48.3 <0.001
I feel comfortable in addressing UP Chairmen/members/ward commissioner
72.6 47.9 <0.001
Adult men in my household do some of the work
64.6 46.3 <0.001
If I face income constraints I would marry off my daughter at an early age to save dowry money
12.4 15.8 ns
I feel I may face disapproval if I move alone outside my village
- 21.6 -
Are you a member of any social or community group?
31.9 31.7 ns
More women reported that they were the main decision maker in terms of children’s education and important family matters and to a lesser extent buying and selling large assets and everyday expenditure than men, while men reported that they were the main decision maker when purchasing land and taking or repaying a loan (Tables 40 and 41). Table 40 Influence on decisions in your household (male replies, survey 8 only)
Decision Main Major Small No Children’s education 22.7 70.5 5.7 1.1 Purchase or sale of land 38.8 57.5 2.5 1.3 Buying or selling large assets 31.6 62.2 4.2 2.1 Taking or repaying loan 41.0 56.2 1.0 2.0 Everyday expenditure 33.6 60.7 4.7 0.9 Important family matters 14.0 83.7 1.2 1.2 When to have children 12.2 86.6 1.2 - How to use your time for work 79.4 16.8 3.7 -
Table 41 Influence on decisions in your household (female replies, survey 8 only)
Decision Main Major Small No Children’s education 37.9 55.5 6.0 0.5 Purchase or sale of land 30.4 49.4 17.7 2.5 Buying or selling large assets 38.0 46.0 13.1 2.8 Taking or repaying loan 36.2 49.1 12.5 2.2 Everyday expenditure 41.9 49.4 7.9 0.8 Important family matters 34.7 55.1 9.2 1.0 When to have children 13.6 77.9 5.8 2.6 How to use your time for work 69.5 21.0 7.4 2.1
72
Nearly half of the men (49.6%) and just over a third (38.2%) of women reported that decision making roles in their households had changed since joining the shiree programme. These men and women when then asked to report on decision making patterns prior to joining the shiree programme and Tables 42 and 43 summaries the percentages before and after joining the programme. For males there were significant changes in four areas, children’s education, buying and selling large assets, taking or repaying a loan and important family matters with a reduction in main decision maker and an increase in major decision maker. Females reported significant changes in all areas with reductions in no influence and small influence and greater percentages of major and main decision making.
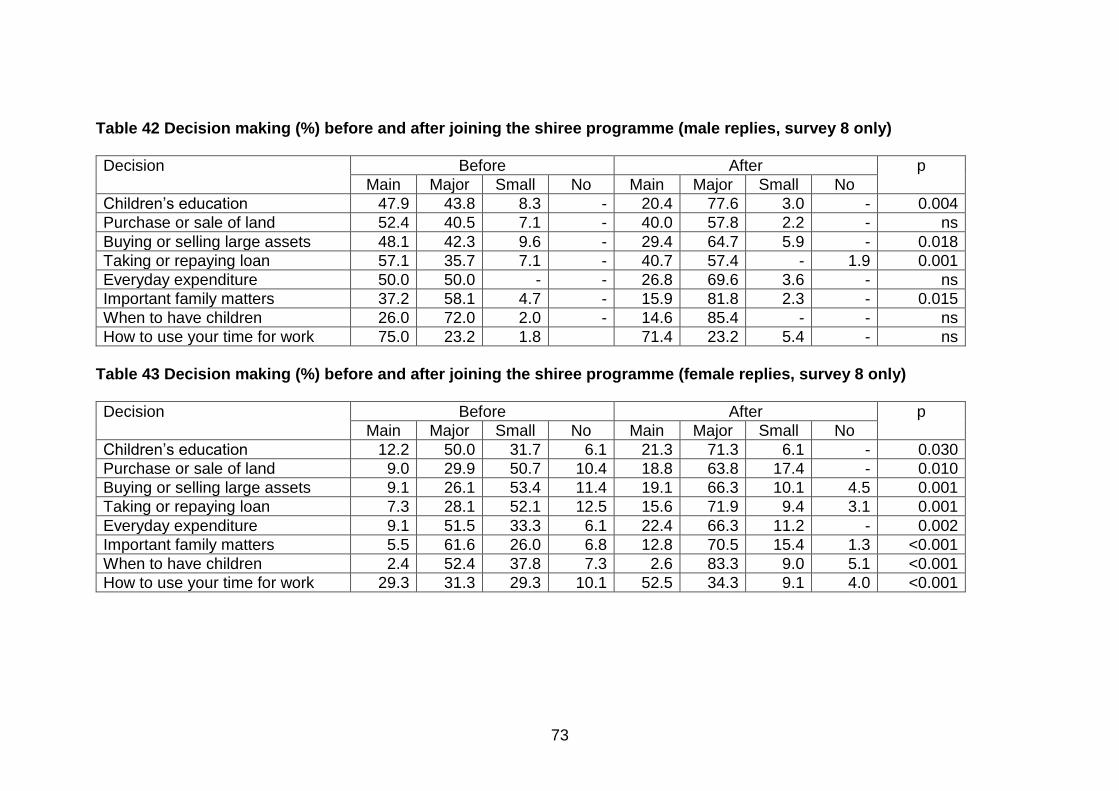
73
Table 42 Decision making (%) before and after joining the shiree programme (male replies, survey 8 only)
Decision Before After p
Main Major Small No Main Major Small No
Children’s education 47.9 43.8 8.3 - 20.4 77.6 3.0 - 0.004
Purchase or sale of land 52.4 40.5 7.1 - 40.0 57.8 2.2 - ns
Buying or selling large assets 48.1 42.3 9.6 - 29.4 64.7 5.9 - 0.018
Taking or repaying loan 57.1 35.7 7.1 - 40.7 57.4 - 1.9 0.001
Everyday expenditure 50.0 50.0 - - 26.8 69.6 3.6 - ns
Important family matters 37.2 58.1 4.7 - 15.9 81.8 2.3 - 0.015
When to have children 26.0 72.0 2.0 - 14.6 85.4 - - ns
How to use your time for work 75.0 23.2 1.8 71.4 23.2 5.4 - ns
Table 43 Decision making (%) before and after joining the shiree programme (female replies, survey 8 only)
Decision Before After p
Main Major Small No Main Major Small No
Children’s education 12.2 50.0 31.7 6.1 21.3 71.3 6.1 - 0.030
Purchase or sale of land 9.0 29.9 50.7 10.4 18.8 63.8 17.4 - 0.010
Buying or selling large assets 9.1 26.1 53.4 11.4 19.1 66.3 10.1 4.5 0.001
Taking or repaying loan 7.3 28.1 52.1 12.5 15.6 71.9 9.4 3.1 0.001
Everyday expenditure 9.1 51.5 33.3 6.1 22.4 66.3 11.2 - 0.002
Important family matters 5.5 61.6 26.0 6.8 12.8 70.5 15.4 1.3 <0.001
When to have children 2.4 52.4 37.8 7.3 2.6 83.3 9.0 5.1 <0.001
How to use your time for work 29.3 31.3 29.3 10.1 52.5 34.3 9.1 4.0 <0.001
74
5.16 Nutritional status
5.16.1 Head of Household
In total 71 male and 100 female heads of household had their weight, height and haemoglobin measured on all four occasions. Body Mass Index (BMI, weight (kg)/height (m)2) was calculated and adults were placed into one of two categories, either suffering from Chronic Energy Deficiency (BMI <18.5) or normal (BMI ≥ 18.5). Haemoglobin (Hb) level was obtained from a finger prick of blood using a portable haemoglobin analyser (HemoCue, HomoCue Ltd., Sweden). Haemoglobin levels were categorised as severe anaemia <70 (g/l), anaemia 70 - 129.9 in males and 70 - 119.9 in females and normal as ≥130 in males and ≥120 in females. Repeated measures analysis of variance revealed that the mean weights did not change significantly over the four surveys (Table 44, Figure 54). However mean BMI increased significantly across the four surveys (Table 37, Figures 55, linear trend p=0.016) by about 0.3 kgm-2 between surveys 1 and 8. The percentages with CED remained the same in surveys 1 and 8. Mean haemoglobin did not show any significant change over the four surveys although the trend was downward (worse) in both sexes (Figure 56) and the percentage who were anaemic rose in males by 2.4% and in females by 5.8% between surveys 1 and 8 (both p ns).
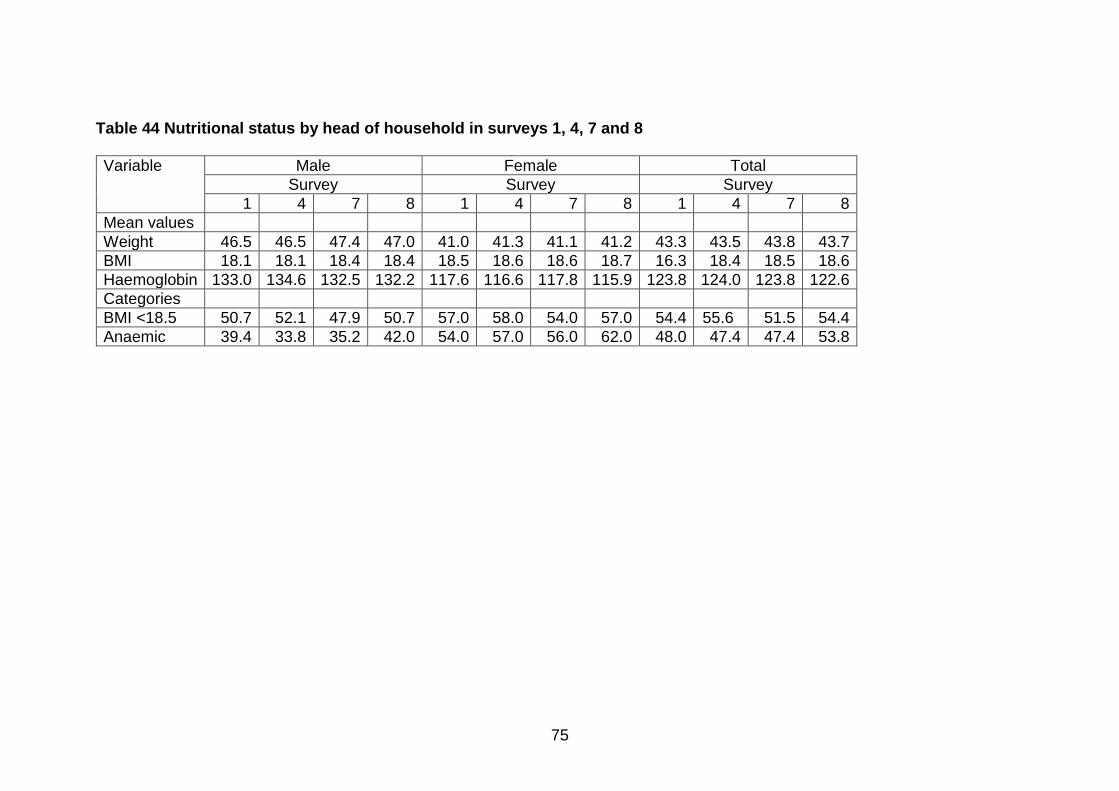
75
Table 44 Nutritional status by head of household in surveys 1, 4, 7 and 8
Variable Male Female Total
Survey Survey Survey
1 4 7 8 1 4 7 8 1 4 7 8
Mean values
Weight 46.5 46.5 47.4 47.0 41.0 41.3 41.1 41.2 43.3 43.5 43.8 43.7
BMI 18.1 18.1 18.4 18.4 18.5 18.6 18.6 18.7 16.3 18.4 18.5 18.6
Haemoglobin 133.0 134.6 132.5 132.2 117.6 116.6 117.8 115.9 123.8 124.0 123.8 122.6
Categories
BMI <18.5 50.7 52.1 47.9 50.7 57.0 58.0 54.0 57.0 54.4 55.6 51.5 54.4
Anaemic 39.4 33.8 35.2 42.0 54.0 57.0 56.0 62.0 48.0 47.4 47.4 53.8
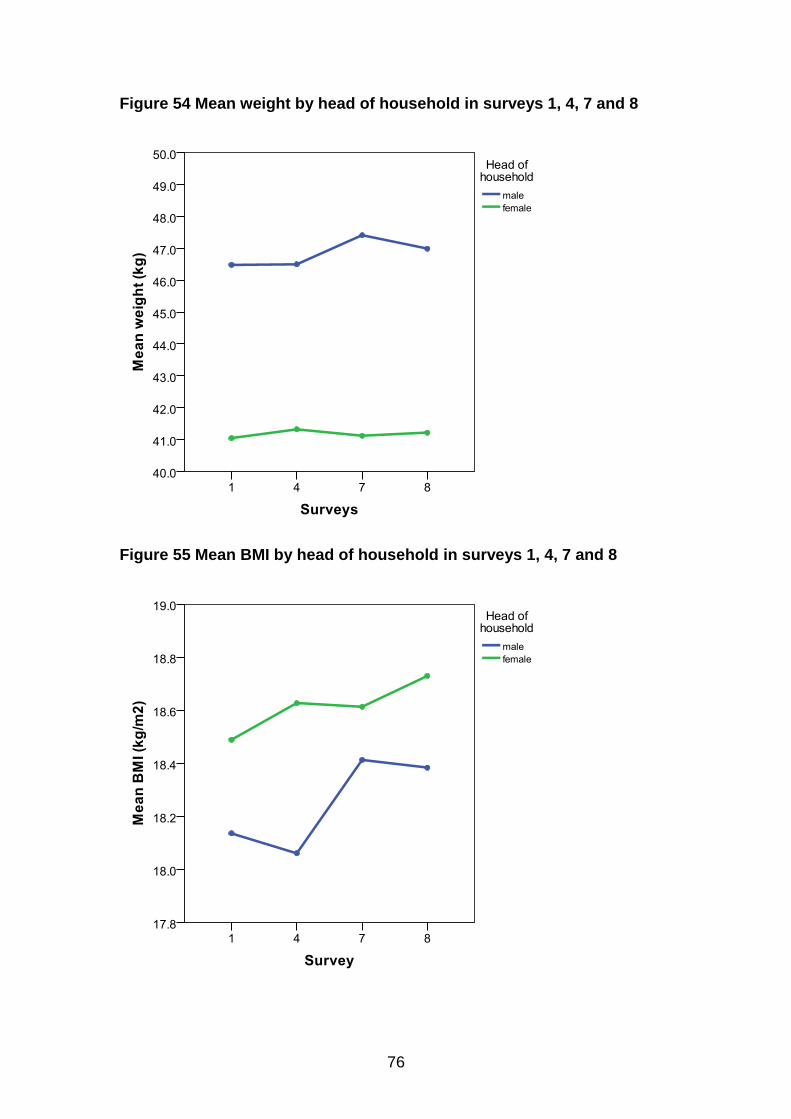
76
Figure 54 Mean weight by head of household in surveys 1, 4, 7 and 8
Figure 55 Mean BMI by head of household in surveys 1, 4, 7 and 8
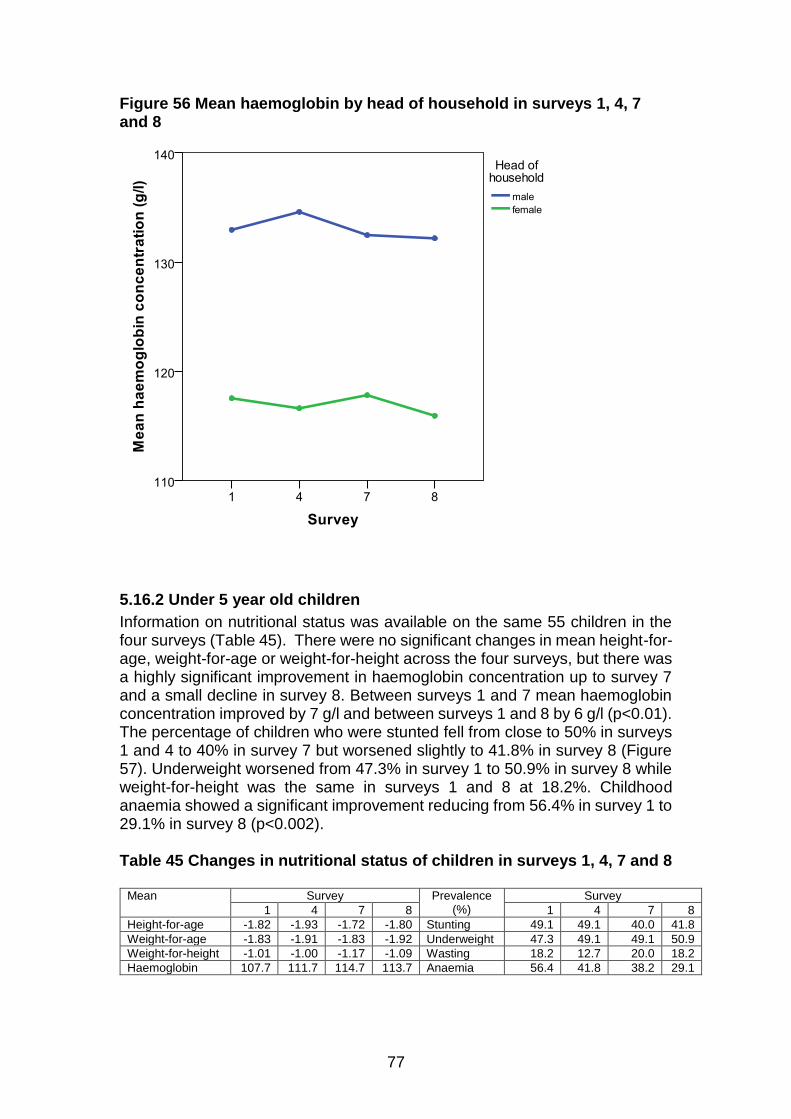
77
Figure 56 Mean haemoglobin by head of household in surveys 1, 4, 7 and 8
5.16.2 Under 5 year old children
Information on nutritional status was available on the same 55 children in the four surveys (Table 45). There were no significant changes in mean height-for-age, weight-for-age or weight-for-height across the four surveys, but there was a highly significant improvement in haemoglobin concentration up to survey 7 and a small decline in survey 8. Between surveys 1 and 7 mean haemoglobin concentration improved by 7 g/l and between surveys 1 and 8 by 6 g/l (p<0.01). The percentage of children who were stunted fell from close to 50% in surveys 1 and 4 to 40% in survey 7 but worsened slightly to 41.8% in survey 8 (Figure 57). Underweight worsened from 47.3% in survey 1 to 50.9% in survey 8 while weight-for-height was the same in surveys 1 and 8 at 18.2%. Childhood anaemia showed a significant improvement reducing from 56.4% in survey 1 to 29.1% in survey 8 (p<0.002). Table 45 Changes in nutritional status of children in surveys 1, 4, 7 and 8
Mean Survey Prevalence (%)
Survey
1 4 7 8 1 4 7 8
Height-for-age -1.82 -1.93 -1.72 -1.80 Stunting 49.1 49.1 40.0 41.8
Weight-for-age -1.83 -1.91 -1.83 -1.92 Underweight 47.3 49.1 49.1 50.9
Weight-for-height -1.01 -1.00 -1.17 -1.09 Wasting 18.2 12.7 20.0 18.2
Haemoglobin 107.7 111.7 114.7 113.7 Anaemia 56.4 41.8 38.2 29.1

78
Figure 57 Prevalence (%) of stunting, underweight, wasting and anaemia in children in surveys 1, 4, 7 and 8
Related Documents