Pavement Performance

Welcome message from author
This document is posted to help you gain knowledge. Please leave a comment to let me know what you think about it! Share it to your friends and learn new things together.
Transcript

Pavement Performance

AASHO Road Test
Source: Highway Research Board Special Report 732

AASHO Road Test
Source: WSDOT Pavement Guide Interactive CD-ROM 3

AASHO Road Test
Source: http://www.fhwa.dot.gov 4

AASHO Road Test
Source: WSDOT Pavement Guide Interactive CD-ROM 5

AASHO Road Test
Source: WSDOT Pavement Guide Interactive CD-ROM 6

AASHO Road Test
Source: WSDOT Pavement Guide Interactive CD-ROM 7

AASHO Road Test
Source: WSDOT Pavement Guide Interactive CD-ROM 8

AASHO Road Test
Source: WSDOT Pavement Guide Interactive CD-ROM 9

Present Serviceability Rating
“The judgment of an observer as to the current ability of a pavement to serve the traffic it is meant to serve”
10

Present Serviceability Rating
11
Acceptable Ride Quality
PSR Acceptable?
3.0 88%
2.5 45%
2.0 15%
12

Measuring Roughness
Straightedge
Slope Profilometer
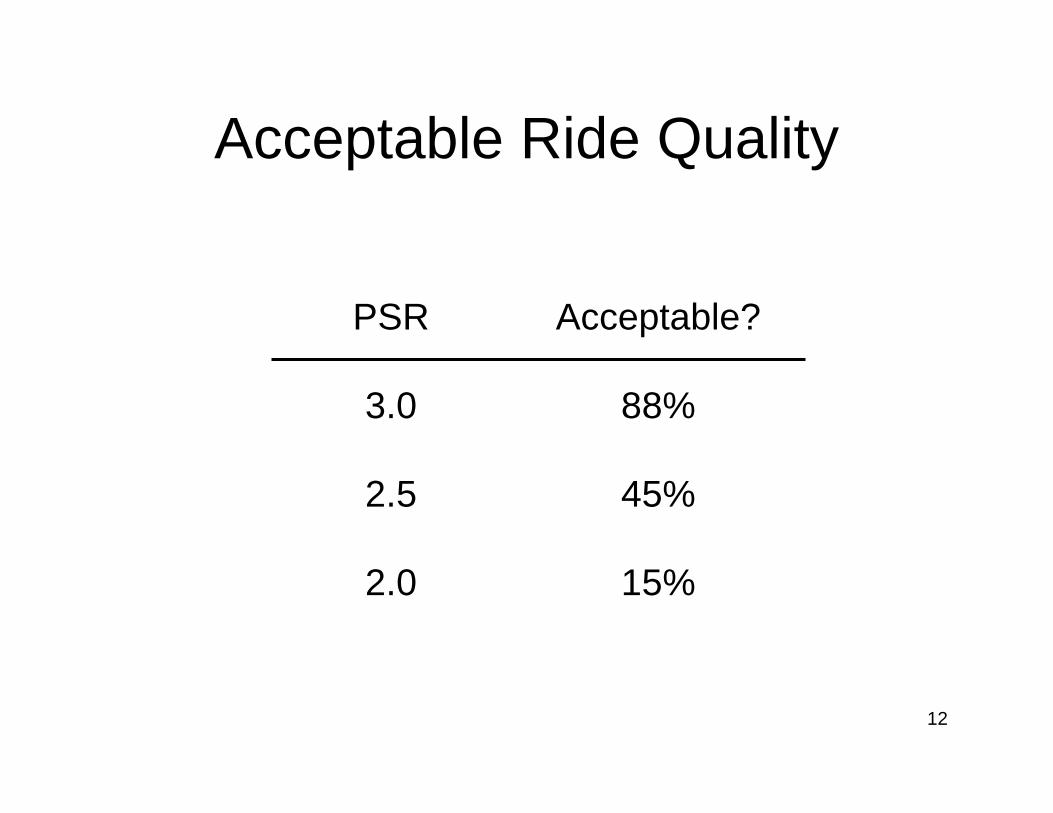
CHLOE Profilometer
13
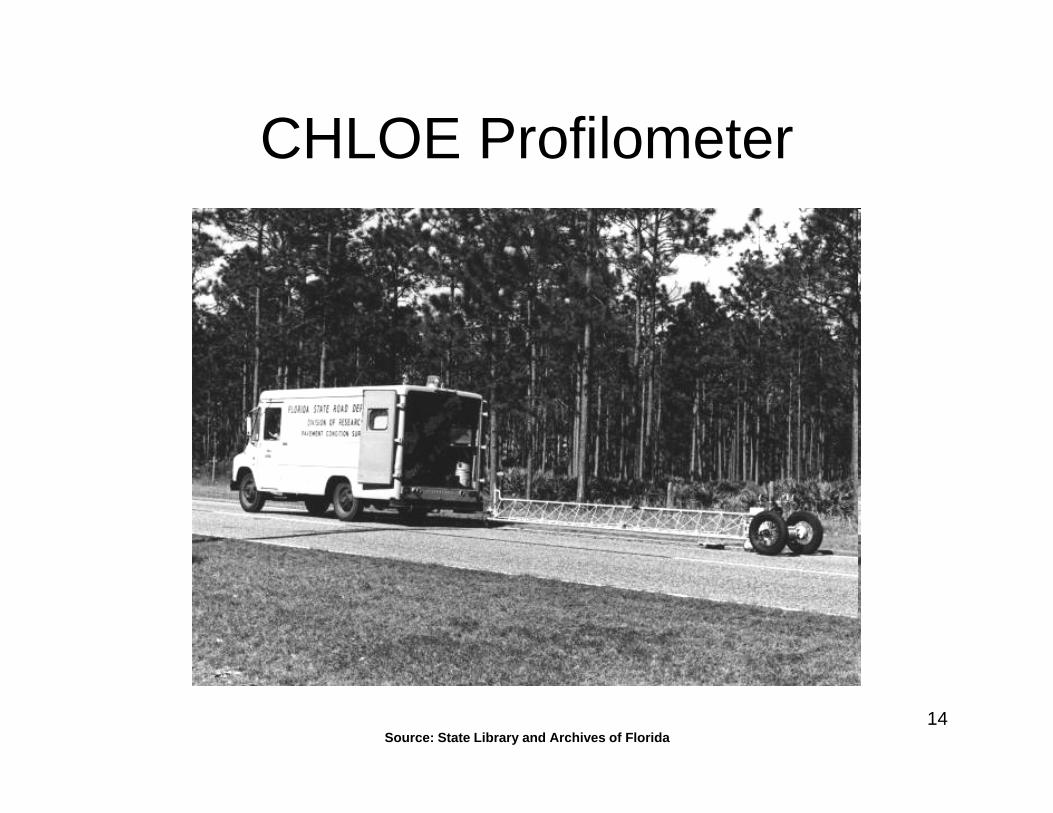
CHLOE Profilometer
Source: State Library and Archives of Florida14

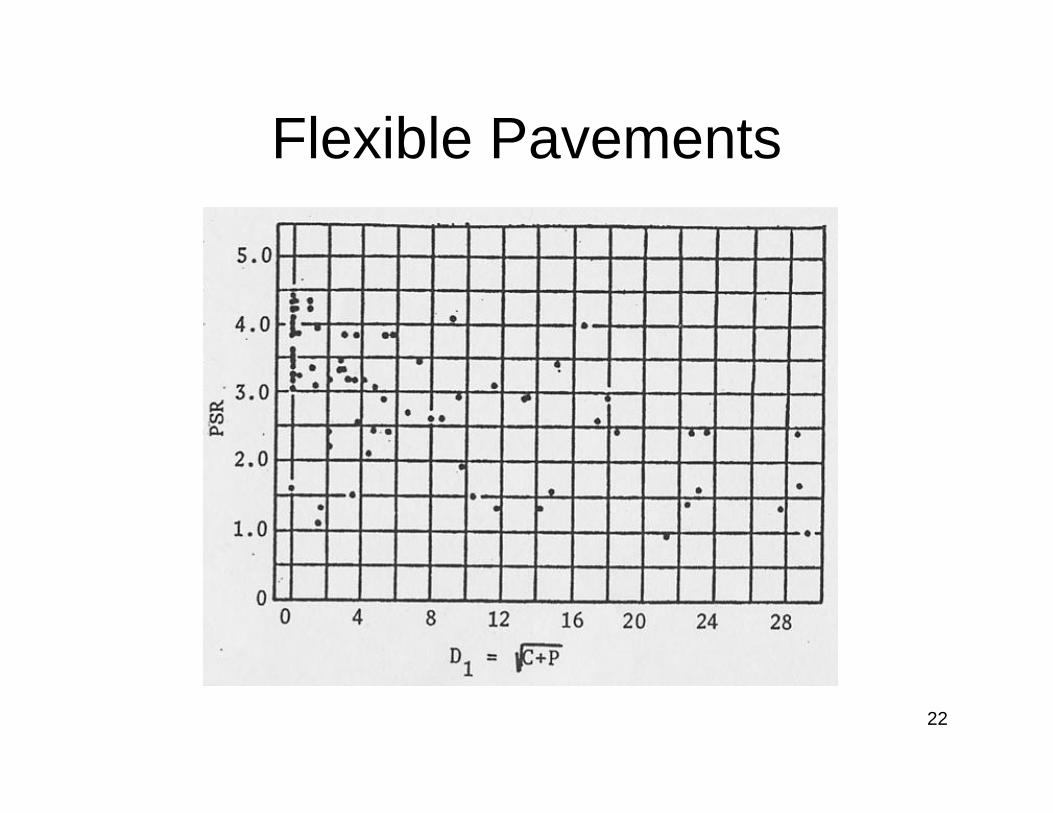
Slope Variance
22
6
1S SnSV 10
n 1
S = slope (radians)
15

Flexible Pavements
16

Rigid Pavements
17

Rut Depth
Source: www.halifax.ca/Works/AsphaltDefectGuide.html18

Flexible Pavements
19

Cracking
Source: www.asphaltrescue.com20

Patching
Source: www.asphaltrescue.com21
Flexible Pavements
22

Rigid Pavements
23

Present Serviceability Index
PC01.0RD38.1SV1log9.103.5PSI 2
PC09.0SV1log8.141.5PSI
Flexible Pavements
Rigid Pavements
24

Pavement Performance
Very good
Good
Fair
Poor
Very poor
5
4
3
2
1
0
PSI
ESALS (log scale)
Limit for Low-Volume Roads
Limit for High-Volume Roads
25

Pavement Performance
5
4
3
2
1
0
PSI
ESALS (log scale)
Acceptability Limit
75% Time
40%Drop
40%Drop
12% Time
Each $1 spent onmaintenance here
Ends up costing $4if delayed to here
26
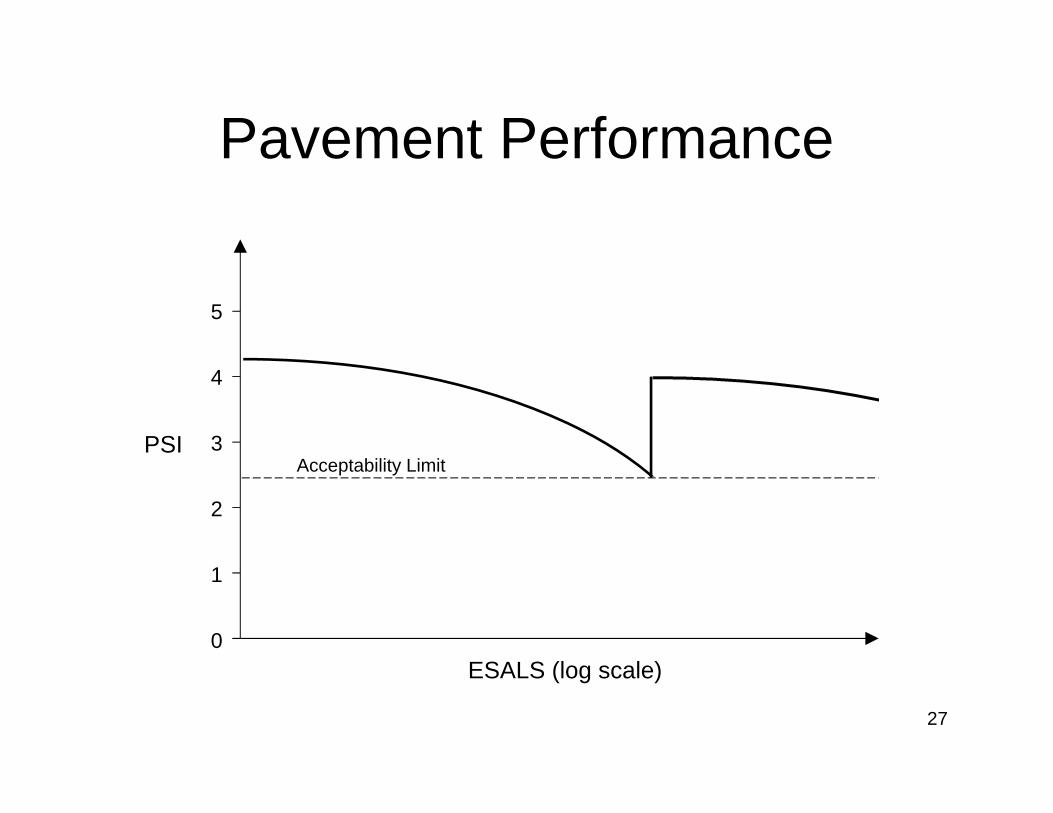
Pavement Performance
5
4
3
2
1
0
PSI
ESALS (log scale)
Acceptability Limit
27

AASHTO Design Equation
(Flexible Pavements)

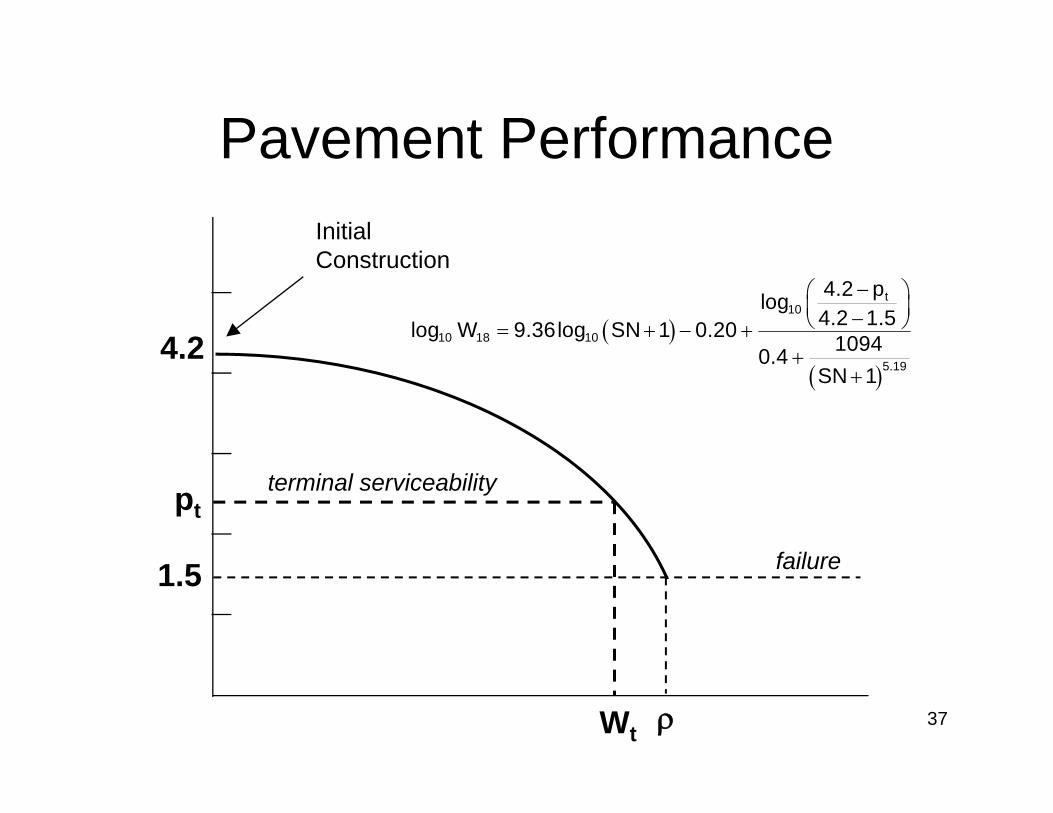
Pavement Performance
Wp 4.2 4.2 1.5
InitialConstruction
failure
4.2
1.5
W 29
p

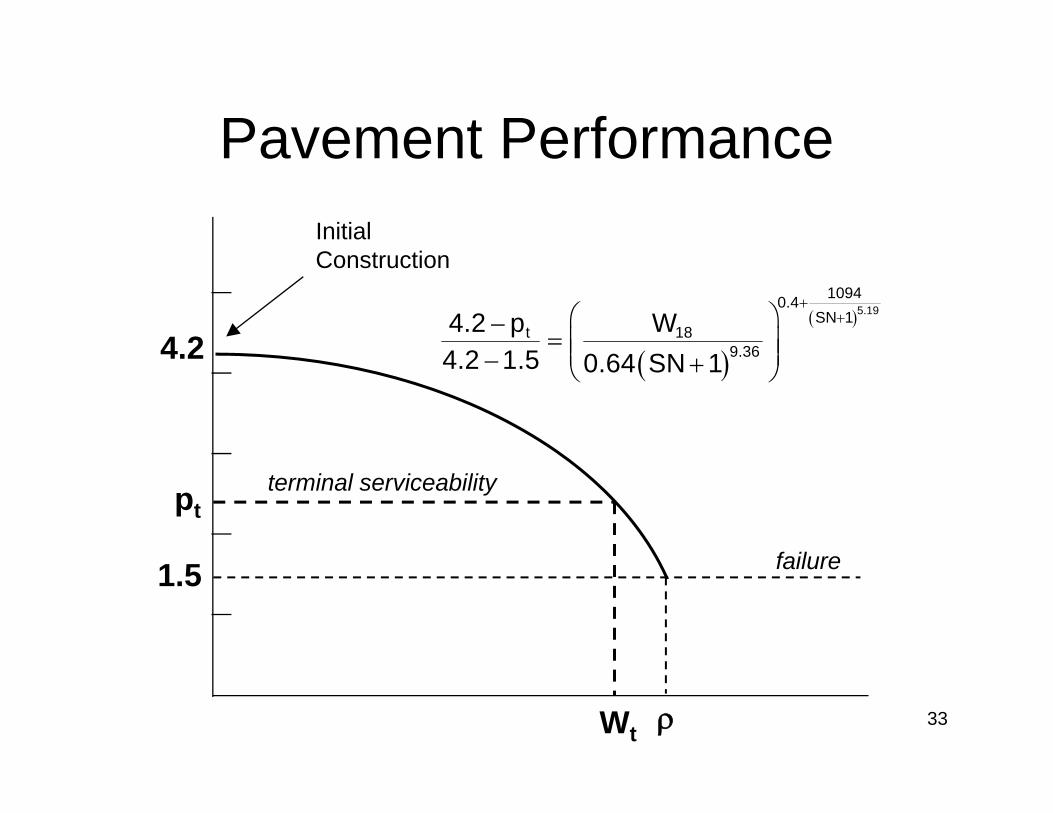
Pavement Performance
Wt
terminal serviceability
tt 4.2 4.2 1.5 Wp
pt
InitialConstruction
failure
4.2
1.5
30

Flexible Performance
9.365.93 4.33
9.364.7918
10 1 1 0.64 118 1
SN SN
3.23
5.19 518 .193.23
0.081 18 1 10940.4 0.41 1 1
SN SN
31

Pavement Performance
Wt
terminal serviceabilitypt
InitialConstruction
failure
4.2
1.5
5.1910940.4
SN 118
9.t 36Wp 4
0..2
64.2 1.5
4 SN 1
32
Pavement Performance
Wt
terminal serviceabilitypt
InitialConstruction
failure
4.2
1.5
5.19
10940.4SN 1
t 189.36
4.2 p W4.2 1.5 0.64 SN 1
33

Pavement Performance
Wt
terminal serviceabilitypt
InitialConstruction
failure
4.2
1.5
t 18
10 105.19 9.364.2 p 1094 Wlog 0.4 log4.2 1.5 SN 1 0.64 SN 1
34
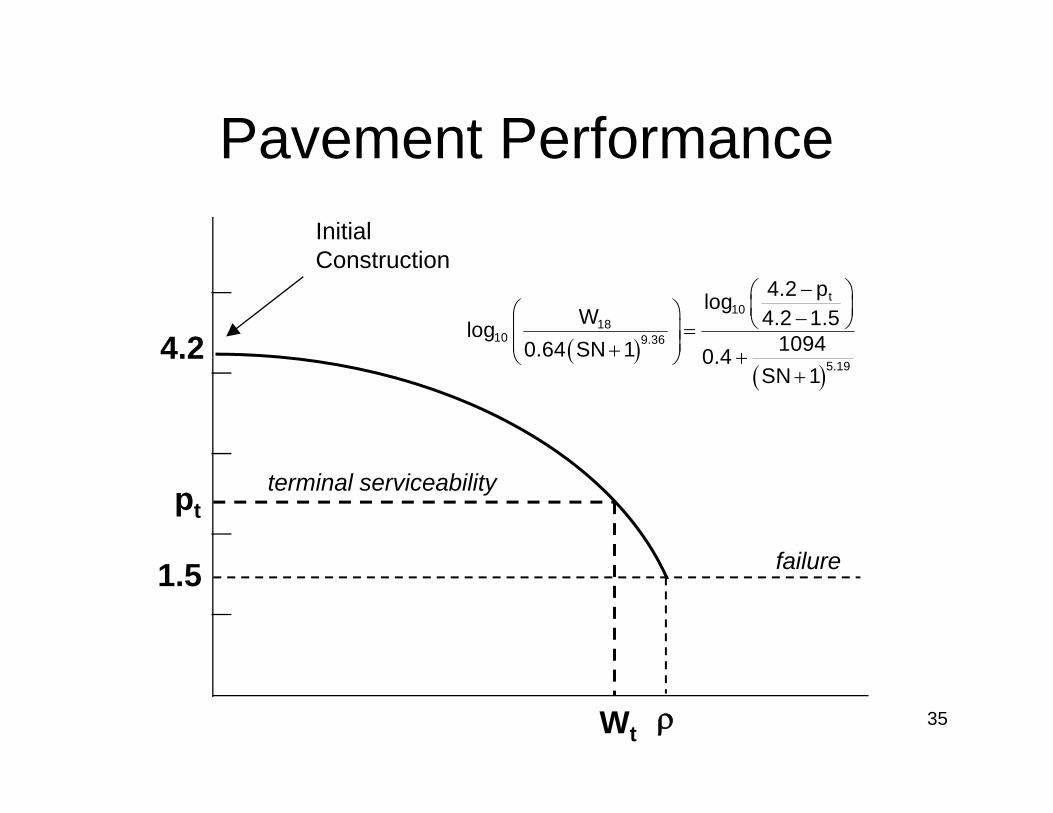
Pavement Performance
Wt
terminal serviceabilitypt
InitialConstruction
failure
4.2
1.5
t10
1810 9.36
5.19
4.2 plogW 4.2 1.5log 10940.64 SN 1 0.4
SN 1
35

Pavement Performance
Wt
terminal serviceabilitypt
InitialConstruction
failure
4.2
1.5
t10
9.3610 18 10
5.19
4.2 plog4.2 1.5log W log 0.64 SN 1 10940.4SN 1
36
Pavement Performance
Wt
terminal serviceabilitypt
InitialConstruction
failure
4.2
1.5
t10
10 18 10
5.19
4.2 plog4.2 1.5log W 9.36log SN 1 0.20 10940.4SN 1
37

Flexible Performance
t10
10 18 10
5.19
4.2 plog4.2 1.5log W 9.36log SN 1 0.20 10940.4SN 1
1966
38

AASHO Road Test
Average Mean Temperature (July) 24.5°C (76oF)
Average Mean Temperature (January) -2.8°C (27oF)
Annual Average Rainfall 837 mm (34 in)
Average Depth of Frost (for fine-grained soil) 711 mm (28 in)
Climate
39

AASHO Road Test
Soil Classification A-6
Percent Passing a #200 Sieve 82%
Liquid Limit 31%
Plasticity Index 16%
Average Degree of Saturation 85%
Average CBR 2.9
Subgrade
40

Flexible Performance
1972
t
10
10 18 10
5
i
.19
4.2 plog4.2 1.5log W 9.36log SN 1 0.20 10940.
1log 0.372 S 3.
S 1
0R4
N
41
SubgradeSupportFactor
RegionalClimateFactor

Regional Factor
42
Condition R value
Roadbed materials frozen to a depth of 5 in. or more (winter)
Roadbed materials dry (summer and fall)
Roadbed materials wet (spring thaw)
0.2 – 1.0
0.5 – 1.5
4.0 – 5.0
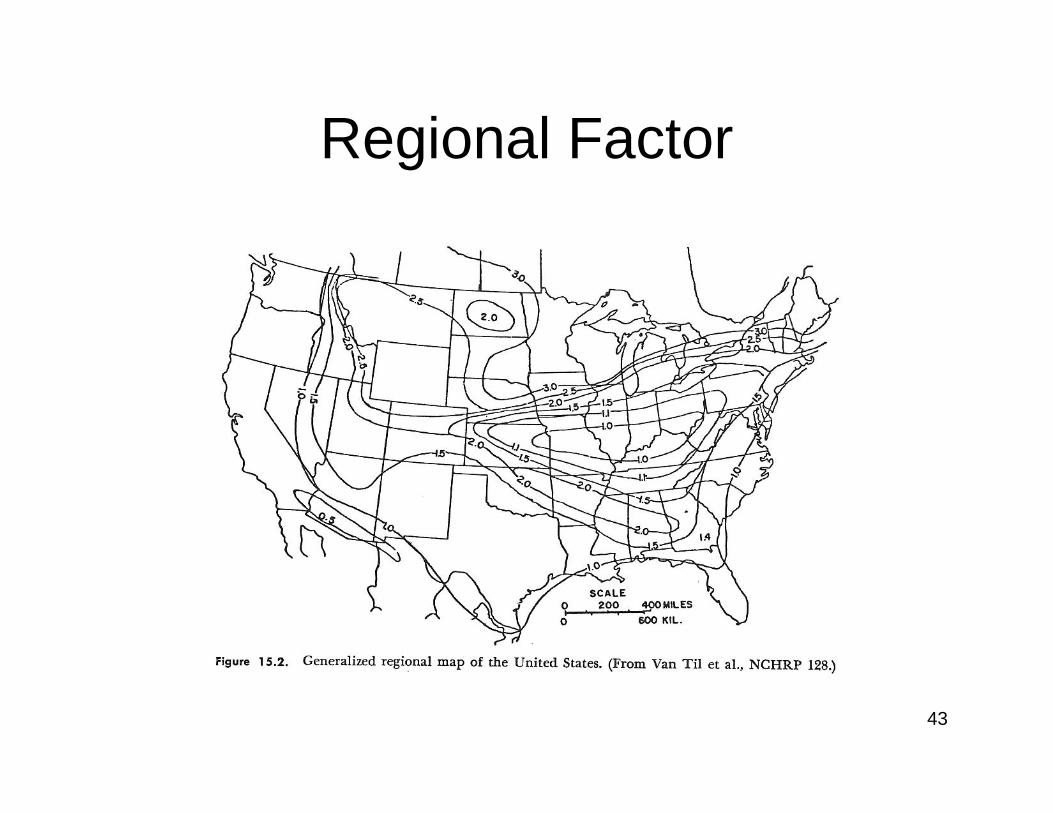
Regional Factor
43

Soil Support Value
44

Flexible Performance
1986
10
t10
10 18 10
5.19
R
4.2 plog4.2 1.5log W 9.36log SN 1 0.20 10940.4S
2.32log M 8.07
N 1
45
SeasonallyAdjustedResilientModulus

Design Equation
18 TW w
PredictedTrafficLevels
PredictedPavement
Life
46

Design Equation
810 101log log TW w
PredictedTrafficLevels
PredictedPavement
Life
47
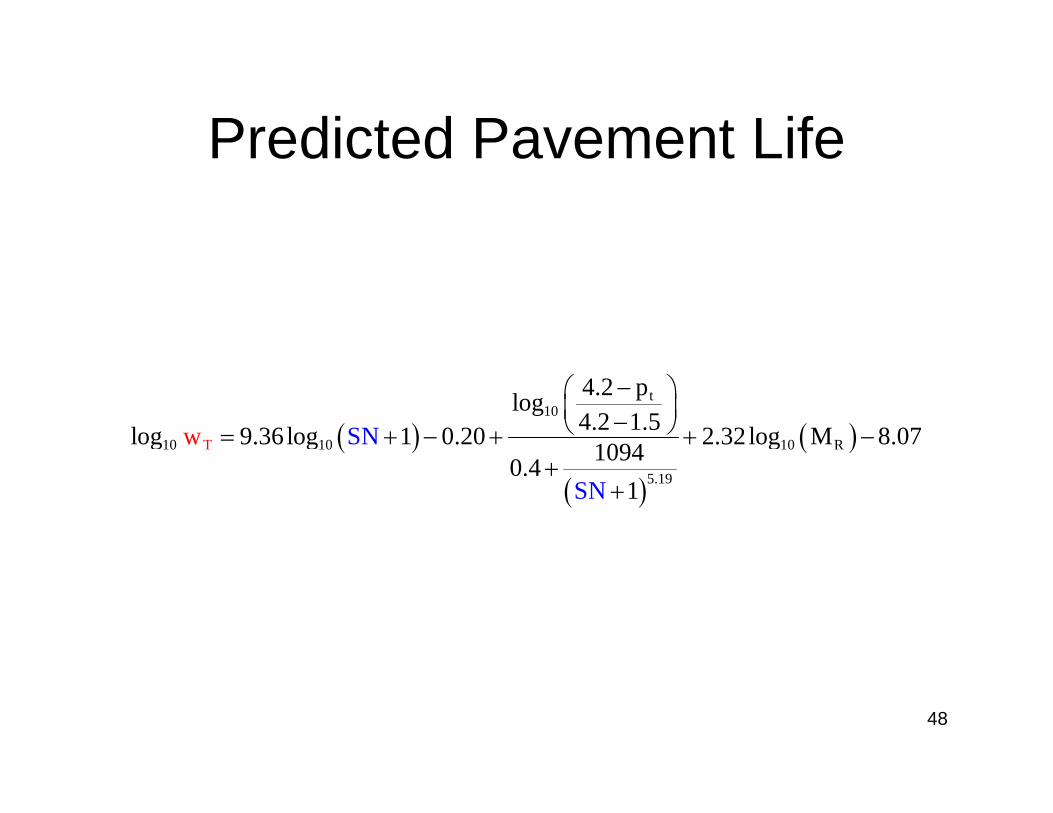
Predicted Pavement Life
t
10
10 10 10 R
5.19
T
4.2 plog4.2 1.5log 9.36log 1 0.20 2.32log M 8.071S 0940.4
1
N
SN
w
48

Reliability
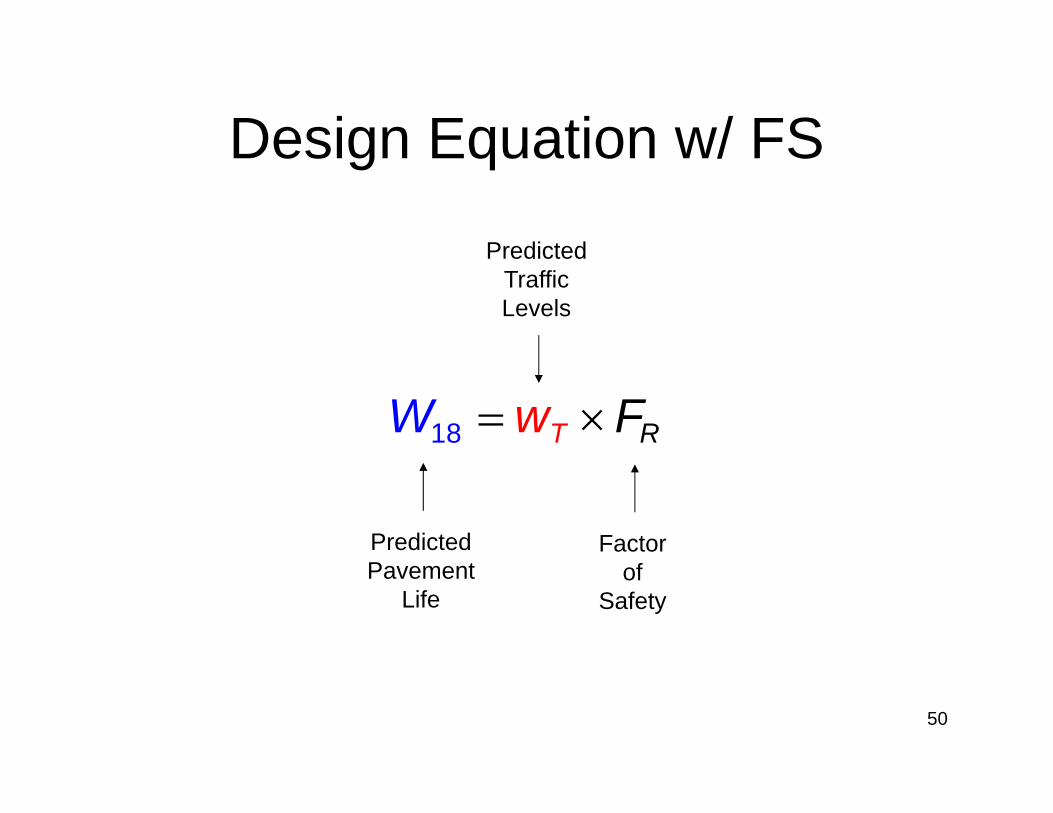
Design Equation w/ FS
18 RTw FW
PredictedTrafficLevels
PredictedPavement
Life
Factorof
Safety
50

Design Equation w/ FS
10 10 10log log logTt RW w F
PredictedTrafficLevels
PredictedPavement
Life
Factorof
Safety
51

Reliability
wT Wt
PredictedTrafficLevels
PredictedPavement
Life
log10FR
52

Reliability
wT Wt
PredictedTrafficLevels
PredictedPavement
Life
log10FR
53

Reliability
wT Wt
PredictedTrafficLevels
PredictedPavement
Life
log10FR
54
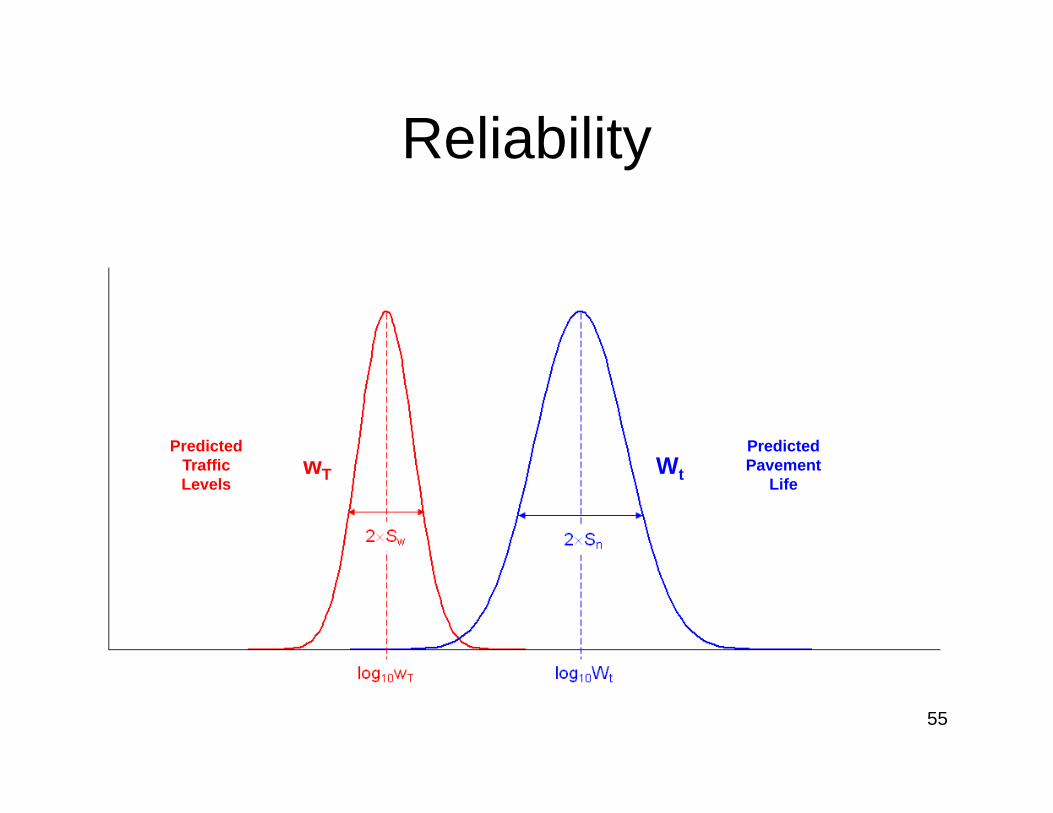
Reliability
wT Wt
PredictedTrafficLevels
PredictedPavement
Life
55
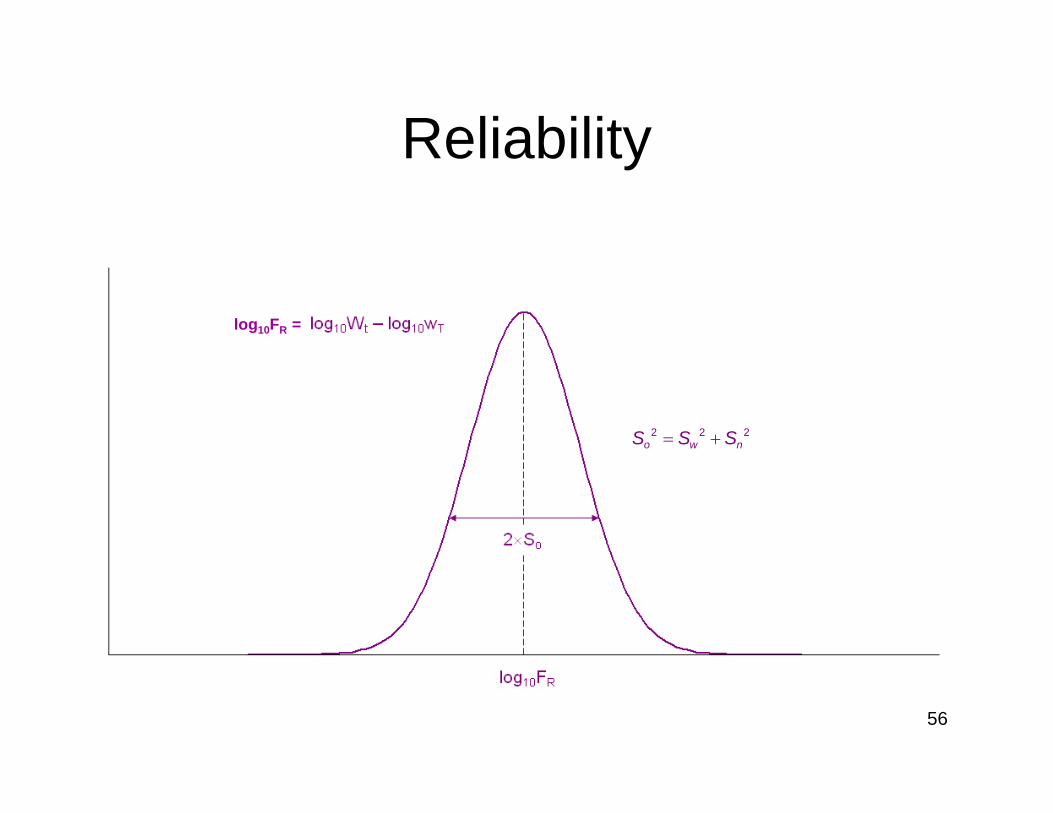
Reliability
2 2 2o w nS S S
log10FR =
56

Reliability
2 2 2o w nS S S
P(fail)
log10FR =
57

Reliability
wT Wt
ZRSo
P(fail)
PredictedTrafficLevels
PredictedPavement
Life
log10Wt log10Wt 58

Design Equation
R 0
10
10 18 10 10 R
5.19
4.2 plog4.2 1.5log W 9.36log SN 1 0.20 2.32log M 8.0710940.SN 1
Z S4
1993
59
Reliability
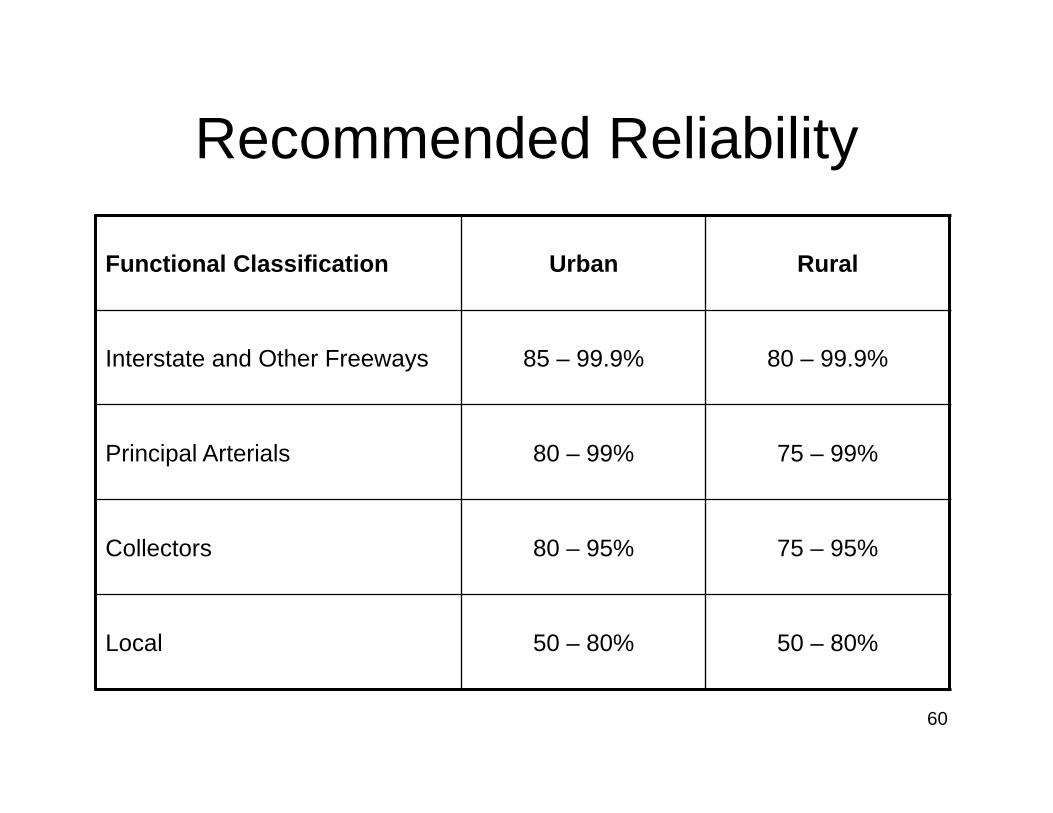
Recommended Reliability
Functional Classification Urban Rural
Interstate and Other Freeways 85 – 99.9% 80 – 99.9%
Principal Arterials 80 – 99% 75 – 99%
Collectors 80 – 95% 75 – 95%
Local 50 – 80% 50 – 80%
60

ReliabilityReliability
(%) ZRReliability
(%) ZR
50 -0.000 93 -1.476
60 -0.253 94 -1.555
70 -0.524 95 -1.645
75 -0.674 96 -1.751
80 -0.841 97 -1.881
85 -1.037 98 -2.054
90 -1.282 99 -2.327
91 -1.340 99.9 -3.090
92 -1.405 99.99 -3.75061

Standard Deviations
Source Flexible Rigid
AASHO Road Test Sn 0.35 0.25
AASHO Road Test So 0.45 0.35
Typical Range for So 0.40 – 0.50 0.35 – 0.40
62
Related Documents