ECONOMICS THE DETERMINANTS OF LABOUR FORCE STATUS AMONG INDIGENOUS AUSTRALIANS by Benjamin J. Stephens The University of Western Australia DISCUSSION PAPER 10.11

Welcome message from author
This document is posted to help you gain knowledge. Please leave a comment to let me know what you think about it! Share it to your friends and learn new things together.
Transcript

ECONOMICS
THE DETERMINANTS OF LABOUR FORCE STATUS AMONG INDIGENOUS AUSTRALIANS
by
Benjamin J. Stephens The University of Western Australia
DISCUSSION PAPER 10.11

The Determinants of Labour Force Status among
Indigenous Australians
Benjamin J. Stephens
The University of Western Australia

Abstract It is well established that Indigenous Australians are heavily over-represented among Australia’s most disadvantaged citizens. An important component of this disadvantage is the limited and often unsuccessful engagement of Indigenous people with the labour market. To better understand this reality, the present paper explores the forces which influence the labour market status of Indigenous people. For this purpose, multinomial logit regression analysis is used to model labour force status as a function of factors relating to geography, demographic characteristics, education, health, culture, crime and housing issues. The analysis is conducted utilising the 2002 National Aboriginal and Torres Strait Islander Social Survey (NATSISS). Particular attention is given to geographic issues, revealing significant variations between the determinants of labour force status in non-remote and remote areas. The results also demonstrate the relevance of a wide range of factors in determining labour force status among Indigenous people, highlighting the complex array of issues which should be considered in attempts to increase employment.
Acknowledgements
I am particularly indebted to Paul Miller for his insightful suggestions and patient advice on many drafts of this paper. I also thank Elisa Birch, Tom Stephens and Ian Davidson for their valued comments and careful editing assistance. Finally, I would like to note the generosity of the Business School of the University of Western Australia in supporting the preparation of this publication through an Honours Research Scholarship.

1
1. Introduction
It is well established that the Aboriginal and Torres Strait Islander (Indigenous)
people of Australia fare poorly against standard indicators of wellbeing and are
heavily over-represented among Australia’s most disadvantaged citizens. A
significant component of this disadvantage is the economic and social consequences
of relatively weak labour market engagement among the Indigenous community.
Indeed, many Indigenous leaders contend that limited and unsuccessful participation
in the labour market is intrinsic to the perpetuation of poor socioeconomic outcomes
endured by many Indigenous Australians (Ah Kit, 2002; Pearson, 2008). Given this,
a clear understanding of the determinants of Indigenous labour market outcomes is
of fundamental importance to government attempts to successfully enhance the
wellbeing of Australia’s Indigenous community.
The present study provides a comprehensive analysis of the determinants of labour
market status among Indigenous Australians. This investigation is conducted using
multinomial logit regression analysis, in which labour force status is modelled as a
function of factors relating to geography, demographic characteristics, education,
health, culture, crime and housing issues.
The analysis reveals that labour force status is strongly influenced by a diverse
range of factors. Indeed, while the role of factors like education are often premised
as the ‘answer’ to increasing employment, the marginal effects on employment
probability associated with variables such as the presence of four or more
dependants, poor health, living in an ethnically mixed household and recent arrest
are at least three times stronger than the effects of completing year 12 studies
relative to having only a year 10 education. While this is not to refute the importance
of education, it highlights the reality that employment status is affected by a wide
range of socio-cultural factors, many of which should be considered in attempts to
increase Indigenous employment, such as the Federal Government’s ongoing
‘Closing the Gap’ initiative.
A particular focus of the present study is the variations in labour market outcomes
between geographic regions and the causes of these variations. This is an important
focus given the significant cultural, social, historical and economic heterogeneity of
the Indigenous population across regions, differences which are particularly

2
significant between non-remote and remote areas. In particular, remote areas are
known to have significantly worse outcomes in relation to the labour market and
many of the determinants used in this paper, a reality which has increasingly
become a topic of academic and policy focus (Hughes, 2007; Hunter, 2007). This
focus is continued in the present paper by the disaggregation of its analysis between
non-remote and remote areas. This approach demonstrates that the marginal effects
associated with education, health and recent arrests are systematically weaker in
remote areas, implying that there is a lower return to human capital in remote areas.
These low returns may be indicative of conditions described by the Segmented
Labour Market (SLM) theory. Further, the analysis reveals strong similarities
between the determinants of unemployment and participation in the Community
Development and Employment Program (CDEP) in non-remote and remote areas,
respectively – a conclusion which indicates that unemployment may increase
significantly as the CDEP is scaled back under current policy initiatives.
It is also of note that the survey on which this study is based, the 2002 National
Aboriginal and Torres Strait Islander Social Survey (NATSISS), is soon to be
followed by the 2008 NATSISS – expected to become publicly available during 2010.
In light of this, it is hoped that the present paper will provide a useful summary of
previous research and a suitable base for future analysis of the 2008 NATSISS and
other data sources. We turn now to Section 2, which contains a review of previous
research on the factors associated with labour force status among Indigenous
Australians. This is followed by Section 3 which outlines the data issues and
methodology for the empirical analysis, the results of which are presented in Section
4. The implications of these results are then considered in Section 5, with the
discussion concluded in Section 6.
2. Literature Review
Previous analyses of labour market outcomes among Indigenous Australians tend to
explicitly or implicitly utilise the dominant neoclassical human capital framework. In
this framework, employment and labour supply are expected to respond positively to
increased human capital, such as education. In contrast, SLM theory contends that
human capital has only a limited role in determining an individual’s labour force
status relative to the dominant effect of socio-cultural or institutional factors (Cain,

3
1976: 1222). As SLM theory has its roots in diagnosing the employment outcomes of
disadvantaged minorities who operate in “ghetto labour markets [in which] the factors
conventionally associated with ‘productivity’ – like years of schooling and vocational
training – had almost no influence on employment prospects” (Gordon, 1972: 44),
this paper adopts the SLM framework as a logical counterpoint to the dominant
neoclassical human capital model for it analysis of the Indigenous labour market.
At the outset of this review, it is also necessary to briefly consider the labour market
implications of the CDEP scheme. The CDEP was established in 1977 to provide
community managed incomes for remote Indigenous communities with weak local
labour markets. It since spread to most areas with significant Indigenous populations
and in 2002-03 covered 12.7 per cent of Indigenous people aged 15 to 64 (Altman et
al., 2005: 6). At this time, CDEP participants were remunerated for work in roles
ranging from health and teaching assistants, to activities traditionally outside
employment, in some instances including housework or attending funerals (Hudson,
2008: 2). This diversity of activities reflects the CDEP’s disparate objectives, which
included: supplementing scarce opportunities for work; supporting community
development and cultural activities; delivering income assistance and building work
readiness (Altman and Sanders, 2008: 4). An important issue relating to the CDEP is
its heavy concentration in remote and very remote areas, where it covered 16.9 and
42.2 per cent of working age Indigenous people respectively in 2002-03, compared
to only 4.7 per cent of this group in non-remote areas (Gray and Chapman, 2006:
117). This highlights that, as a government program in which participation is not
driven by typical market forces, determinants of CDEP participation differ
significantly from those of mainstream employment prospects – a reality which can
complicate standard analysis. Accordingly, many studies include CDEP participation
as a fourth labour force category, distinct from mainstream employment (henceforth
simply ‘employment’)1, a precedent to which this paper adheres.
Geography
Living in remote and very remote areas has been shown to have a significant
negative effect on employment (Borland and Hunter, 2000; Hunter and Gray, 2001;
Ross, 2006a; Hunter, 1997, 2002b). One study finds that, relative to a reference
1Separating CDEP from mainstream employment should not be interpreted as a normative statement on the relative merits of the CDEP scheme. For relevant discussion see Altman and Sanders (2008) or Hudson (2008).
4
group which ‘lives in an urban area but not in a capital city’, living in a remote area
had a negative marginal effect on employment of 11.6 and 6.7 percentage points for
men and women respectively (Hunter and Gray, 2001: 122-3). Significantly,
however, remoteness is not associated with a fall in participation and is actually
accompanied by a decrease in unemployment. This seemingly paradoxical result is
driven by the role of CDEP, which, relative to the same reference group, increased
by 23.3 percentage points in association with living in remote areas (Hunter and
Gray, 2001: 122-3).
The most commonly noted cause of low employment in remote areas is the relatively
weak labour markets in these regions. However, there are a number of other factors
thought to contribute to employment disparities between Indigenous people living in
remote and non-remote areas. In particular, education levels and other elements of
human capital are typically lower in remote areas; remote populations generally have
stronger attachment to traditional cultures and lifestyles and relatively weak and
more recently established relationships with non-Indigenous society and institutions
(Gray and Chapman, 2006: 117). While studies, such as Hunter and Gray (2001),
have been able to control for some of these variables, data limitations preclude
controlling for all such variables. This limitation leads to some ambiguity in explaining
the significance of labour market weakness relative to other factors, as explored in
subsequent sections.
In addition, the ‘easy’ access to CDEP positions in remote areas, and the ‘easy
money’ it provides, is thought by some to further weaken the tenuous connection of
remote Indigenous people to the mainstream labour market. As Hughes (2007)
states: in some remote areas the “CDEP scheme has distorted labour supply,
making it difficult for men and women to contemplate mainstream work” (Hughes
2007: 72). This complex interaction again points to the need for careful separate
analysis of the determinants of employment and CDEP participation.
In considering the impact of geography, Biddle and Webster (2007) explore the
potential effect of the local labour market on labour market status among Indigenous
Australians. By controlling for the local employment to population ratio and the
unemployment rate, this analysis revealed that those in high unemployment or low
employment areas were themselves more likely to be labour force non-participants

5
or unemployed, even after controlling for their personal characteristics (Biddle and
Webster, 2007: 39). Importantly, after these area level labour market characteristics
were considered, the effect of living in a remote area on labour supply and
unemployment declined significantly, confirming the salience of weak labour markets
in creating poor employment outcomes.
Age
Age is included as a determinant in many models of labour force status in order to
capture the role of life-cycle effects on labour supply and to act as a proxy for labour
market experience. However, given the relatively weak labour market attachment of
the Indigenous population, it is likely that the raw variable of age will tend to
overstate labour market experience and thus some doubt has been cast on the
relevance of age as a proxy for experience (Daly, 1994: 8; Gray and Chapman,
2006: 120). This concern notwithstanding, studies of the Indigenous labour market
report results consistent with standard expectations. That is, the marginal effect of
age on employment and participation is consistently found to be positive, at least
until a critical point, typically around 45 years of age (Biddle and Webster, 2007;
Hunter, 1997; Hunter and Gray, 2001). Notably, the labour supply of Indigenous
youth appears particularly constrained (Hunter, 2004: 43). This group also
experiences particularly high unemployment, which has long been an area of policy
concern and subject of research interest (Miller, 1989, 1991).
Family characteristics
Standard models of labour supply suggest that a number of family characteristics,
such as marital status and the presence and number of dependants, will impact on
the individual’s labour force status (Killingsworth, 1983). Differing conclusions have
been reached regarding the labour market implications of marriage among
Indigenous people. Some studies (Daly, 1993, 1995; Hunter and Gray, 2001) found
that marriage is associated with decreased employment among women, but with an
increase for males. However, other papers show a positive marginal effect of
marriage on the employment probability among both males and females (Biddle and
Webster, 2007; Borland and Hunter, 2000; Hunter, 2002b; Ross, 2006a), which
contrasts with Gray and Hunter (1999), who find a negative effect for both males and
females. Despite this incongruity, these studies consistently find that the marginal

6
effect of marriage is more positive, or less negative, for males than for females.
These effects can be better understood by noting that participation increases with
marriage among Indigenous males, but declines significantly among married
Indigenous females, who are also less likely to be unemployed than their unmarried
counterparts (Hunter and Gray, 2002: 6). This may indicate that the increased
financial security and domestic responsibility associated with marriage increases the
reservation wage of women, therefore encouraging them, particularly those with poor
employment prospects, to leave the labour market, thus reducing female labour
supply and unemployment. This is largely consistent with standard expectations and
research on different populations (Hill, 1979).
Using the 1994 National Aboriginal and Torres Strait Islander Survey (NATSIS),
Hunter and Gray (2002) find having dependants leads to a fall in employment among
both males and females. This effect is strongest for females and increases for more
children, with a negative marginal effect of over 20 percentage points for women with
four or more children (Hunter and Gray, 2001: 23). For females, the decline in
employment is also associated with declines in the unemployment rate and CDEP
participation. This is consistent with traditional models of labour supply, given that
the presence of children increases the shadow wage and therefore reduces female
participation (Smith, 2003: 20). The key features of these findings are similar to other
studies of Indigenous people which used the same data (Hunter, 1997; Borland and
Hunter, 2000) and those utilising Census data2 (Daly et al., 1993; Daly, 1993, 1995).
Education
As a key determinant of human capital, it is unsurprising that virtually all studies have
found increased education to be associated with a statistically significant positive
effect on participation and employment rates among Indigenous people (Biddle and
Webster, 2007; Borland and Hunter, 2000; Daly, 1995; Gray and Hunter, 2005;
Hunter and Daly, 2008; Hunter and Gray, 2001; Jones, 1991; Ross, 2006a). The
positive effects of education were found to extend to both school and non-school
qualifications. For example, studies which used ‘left school between years 6 and 9’
as the reference group found that the marginal effect on the probability of
2Hunter and Daly (2008) utilise the more recent 2002 NATSISS to investigate the effect of lifetime fertility, rather than current dependants, on labour supply among Indigenous females. They find that, after controlling for other factors, female fertility rates are not correlated with any particular labour market outcome.

7
employment of completing year 12 schooling was between 10 and 25 percentage
points, while a non-school qualification was associated with marginal effects up to
25.5 percentage points (Borland and Hunter, 2000:136; Hunter and Gray, 2001: 122-
3; Hunter, 1997: 181).
A variable for ‘difficulty in English’ is often considered and is typically found to have a
negative marginal effect on the probability of employment, ranging from 6.4 to 16.4
percentage points (Borland and Hunter, 2000; Hunter and Gray, 2001).
Several studies find that education and English difficulty generally have a stronger
effect on the probability of employment among Indigenous females relative to males,
a pattern which holds for all educational increments, except for non-tertiary non-
school qualifications (Hunter, 2002a, 2002b; Hunter and Gray, 2001; Daly, 1995). It
is also of interest that most education variables have the opposite effect on CDEP
participation compared with employment (Hunter and Gray, 2001: 122-3; Biddle and
Webster, 2007: 36).
Using the 2001 Census, Hunter (2004) examines the inter-regional variations in the
effect of educational attainment on the probability of employment. In general, it is
found that education has a stronger effect in remote areas than in metropolitan areas
(Hunter, 2004: 71). It is suggested that this difference is driven by the stronger effect
of ‘signalling’ in remote areas, were education levels are generally lower, meaning
that those who have more qualifications send a strong positive signal to potential
employers regarding their ability and motivation (Hunter, 2004: 70).
Health
Within the human capital framework, an individual’s health affects their labour force
status through its implications for their labour market productivity (Grossman, 1972).
Two main measures of Indigenous health, ‘self-assessed health status’ (SAHS) and
disability status, are available in the relevant data sets and are analysed by several
studies (Hunter, 1997, 2002b; Borland and Hunter, 2000; Hunter and Daly, 2008;
Hunter and Gray, 2001; Ross, 2006a). While there is some concern regarding the
consistency of information relating to SAHS among Indigenous Australians (see
Booth and Carroll 2005; Crossley and Kennedy 2002; Sibthorpe et al. 2001; Ross,
2006b), the data on this topic is considered sufficiently reliable for use in technical

8
analyses (Ross, 2006a: 68). After controlling for variables which interact with health
and disability status, Ross (2006a) finds that SAHS and disability status continue to
have the expected coefficients in relation to labour force status. In particular, the
probability of employment is shown to unambiguously decline in association with fair
or poor SAHS compared to a reference group with excellent health, and for a major
disability3 (Ross 2006a: 76-8). These findings are congruent with both the
predictions of human capital models and prior studies of Indigenous labour force
status (Borland and Hunter, 2000; Hunter, 1997; Hunter and Gray, 2001).
Despite the widely cited adverse effects on the Indigenous community of alcohol
abuse, the labour market implications of this factor have so far received little
systematic analysis. An exception is Hunter and Daly (2008), who show that,
compared with a reference group who ‘never drank alcohol’, participation among
Indigenous females declined by 10 percentage points in association with ‘high-risk’
alcohol use, but increased by 12.3 percentage points for having ‘ever drank alcohol’
(Hunter and Daly, 2008, 7). The positive effect associated with moderate alcohol use
is consistent with studies of non-Indigenous populations (MacDonald and Shields,
2004; Terza, 2002) and may reflect the difficulty of acquiring alcohol for those
without jobs or, invoking the human capital framework, the health benefits associated
with moderate alcohol use relative to abstention or heavy drinking (Barrett, 2002:
79).
Culture
The labour market implications of ‘cultural attachment’ among Indigenous people
have also been considered in a number of studies. A commonly used proxy for
cultural attachment is the incidence of speaking an Indigenous language. This
variable is generally found to be negatively correlated with employment, with one
study finding a negative marginal effect of approximately 8 and 2.3 percentage
points respectively for males and females (Hunter and Gray, 2001: 121-2). Speaking
an Indigenous language is also associated with a decrease in the probability of
unemployment, but a statistically significant increase in CDEP participation and
being not in the labour force (Hunter and Gray, 2001: 121-2). That is, connection
with the mainstream labour market, as either employed or unemployed, falls and is
3Ross (2006a) does not provide information on marginal effects; however, using the same data Biddle and Webster find that the probability of employment falls by 14.8 percentage points for a disability (2007: 36).

9
offset by a corresponding decline in participation and increase in CDEP employment.
This may reflect a stronger preference for traditional activities outside the
mainstream labour market, and the more limited employment opportunities, available
to more traditional people (Altman et al., 2005: 21). However, as proficiency in an
Indigenous language is more prevalent in very-remote areas, the statistical
association between labour market status and speaking an Indigenous language
may simply be driven by the low rates of employment in very remote areas. Hunter
and Gray (2001) note that this relationship may also contribute to the positive
association between speaking an Indigenous language and CDEP participation,
reflecting the CDEP’s strong presence in very remote areas (Hunter and Gray, 2001:
126). This issue is not easily resolved since available data are not disaggregated
between remote and very remote areas, a limitation with implications discussed
further in subsequent analysis.
Living in an ‘ethnically mixed household’, a household which includes a non-
Indigenous occupant, is associated with a significant effect on labour force status.
For example, one study finds this variable to be associated with a positive effect on
the probability of employment of 21 and 14 percentage points for males and females,
respectively – a large effect roughly equivalent to that associated with completing
year 12, relative to leaving school between years 6 and 9 (Borland and Hunter, 2000:
136). These marginal effects may incorporate the positive labour market implications
of greater exposure, interaction and integration with non-Indigenous society and
culture. As such, the mixed household variable may be a proxy for the positive
labour force implications of not living in a culturally or geographically isolated urban
‘ghetto’ or remote community (Hughes, 2007). In addition, as non-Indigenous people
are more likely to be employed than Indigenous people, the effect of living in a mixed
household may reflect the documented correlation between the labour force statuses
of partners4 (Miller and Volker, 1987; Miller, 1989, 1997). Therefore, there are a
number of mechanisms through which living in a mixed household may be more
conducive to employment for Indigenous people. However, as the number of mixed
families is known to be inversely related with remoteness (Riley, 1994; Ross, 1999),
failing to disaggregate between remote and very remote areas, due to data
4 It should be noted that the association of living in an ethnically mixed household with increased probability of
employment may also reflect a higher propensity for ‘out marriage’ among Indigenous people in employment.
That is, reverse causality is also a distinct prospect.

10
limitations, again means the marginal effects on employment and CDEP participation
of living in a mixed household may be overstated.
Identifying as of TSI heritage, relative to identifying as Aboriginal, and having been
removed from one’s natural family are generally found to have negligible implications
for labour force status (Biddle and Webster, 2007: 36; Hunter and Gray, 2001: 121).
This notwithstanding, Hunter and Borland (1997) find that removal from one’s family
is associated with an increased probability of arrest and, thus, has an indirect
negative effect on the probability of employment (Hunter and Borland, 1997: 24).
Interestingly, while the results of most papers point to some tension between most
measures of cultural attachment and mainstream employment, Dockery (2009)
presents a more nuanced conclusion, suggesting that strong cultural attachment
could even be associated with higher rates of employment.
Crime
Several studies have investigated the implications of interaction with the criminal
justice system on labour force status. Without exception these studies find that the
incidence of arrest in the last 5 years is associated with a strong negative marginal
effect on the probability of employment, ranging from approximately 10 to 20
percentage points, and is considerably stronger for males (Biddle and Webster,
2007: 39; Borland and Hunter, 2000: 136; Hunter and Gray, 2001: 122-3). Arrest is
also associated with a large increase in the incidence of unemployment; a moderate
rise in CDEP participation; but only a weak negative effect on participation (Biddle
and Webster, 2007: 36; Hunter and Gray, 2001: 122-3). These results indicate that
arrest does not reduce the desire for labour market participation (labour supply), but
significantly reduces the prospects of finding employment (labour demand)5.
Housing issues
The poor housing conditions experienced by a significant portion of the Indigenous
population, particularly in remote areas, has also been widely cited as negatively
interacting with employment outcomes (Hunter, 2004; Hunter and Daly, 2008; Gray
and Hunter, 1999; Biddle and Hunter, 2006b; SCRGSP, 2009). Taylor (2008) notes:
5 There is, however, some ambiguity relating to this interpretation: Borland and Hunter (2000) reach the opposite
conclusion, suggesting “the effect of arrest on employment may represent a supply-side rather than demand-side phenomenon” (Borland and Hunter, 2000: 140).

11
...the set of supply-side issues that may mitigate against successful Indigenous [labour market]
participation are more wide-ranging than just the skill-set brought to the labour market. Indeed,
they include... key points of intersection between Indigenous peoples and government policy...
[such as] housing... (p. 2).
However, this effect has not been demonstrated by any systematic labour market
study. Further, the mechanism for this effect is not articulated beyond the conclusion
that limited access to sufficient housing has “negative consequences for population
characteristics that directly impinge on labour supply and economic participation,
notably health status and educational performance” (Taylor, 2008: 53).

12
Table 1 – The Effect of Selected Variables on the Probability of Employment
Determinants Marginal Effect on Probability of Employment Referenced from
Geography
Living in Remote Areas
Highly significant, strong negative marginal effect ranging between -6 and -14 percentage points*
Biddle and Webster, 2007; Borland and Hunter, 2000; Hunter and Gray, 2001; Ross, 2006a; Hunter, 1997, 2002b
Family Characteristics
Dependants
Highly significant, strong negative marginal effect of up to -20.5 percentage points for females with four or more dependants
Hunter and Gray, 2001; Hunter, 1997; Borland and Hunter, 2000; Daly et al., 1993; Daly, 1993, 1995
Marital Status Ambiguous
Education
Leaving school before Yr 10
Highly significant, strong negative marginal effect ranging from -2.2 to -9.4 percentage points*
Borland and Hunter, 2000; Hunter, 2002b; Hunter and Gray, 2001; Hunter, 1997
Completing Yr 12
Highly significant, strong positive marginal effect ranging from 9.8 to 28.6 percentage points*
Biddle and Webster, 2007; Borland and Hunter, 2000; Hunter, 2002b; Hunter and Gray, 2001
Non-school
Highly significant, strong positive marginal effect, ranging from 14.8 to 39.3 percentage points*
Biddle and Webster, 2007; Borland and Hunter, 2000; Hunter, 2002b; Hunter and Gray, 2001; Hunter, 1997
English Difficulty
Highly significant, strong negative marginal effect ranging from -6.4 to -16.4 percentage points
Borland and Hunter, 2000; Hunter, 2002b; Hunter and Gray, 2001
Health
Disability
Highly significant, strong negative marginal effect of 14.8 percentage points
Biddle and Webster, 2007
Fair/ Poor SAHS Highly significant, no marginal effect available Ross, 2006a
Cultural
Mixed Household
Highly significant, strong positive marginal effect ranging from 9.5 to 21 percentage points
Borland and Hunter, 2000; Hunter and Gray, 2001
Indigenous language
Highly significant, strong negative marginal effect ranging from -2.3 to -18 percentage points
Biddle and Webster, 2007; Hunter and Gray, 2001
Crime
Arrest
Highly significant, strong negative marginal effect ranging from -10 to -20.7 percentage points
Biddle and Webster, 2007; Borland and Hunter, 2000; Hunter and Gray, 2001
*Results differ significantly depending on choice of reference group
The above discussion has identified the influence of a number of important factors
on labour market status. In response to changes in these factors, employment and
participation typically move in the same direction, while CDEP participation and
unemployment also move together, but in the opposite direction to employment. The

13
main exception to this is that for increasing remoteness, employment and
unemployment decline, while CDEP participation increases, leading to relatively
constant labour supply. The review reveals little evidence suggesting the relevance
of SLM theory to the Indigenous labour market, as the factors reviewed tend to affect
labour force status, and employment probability in particular, in the direction
anticipated by the human capital framework. The influence on employment
probability of several important factors are summarised above in Table 1.
The studies considered above cover a wide range of the main factors thought likely
to impact the labour force status of Indigenous Australians. However, no study
incorporates all these factors simultaneously. Further, there are a number of
additional factors likely to influence labour force status which have not been
incorporated into previous analysis. Therefore, the present paper contributes to this
research by the use a more encompassing specification of the estimating equation to
derive a set of estimates of the determinants of labour force status among
Indigenous Australians. It also adds to existing literature by including ‘new’ variables
for culture, health and housing quality. Further, the present paper also expands on
previous analysis of geographic factors by disaggregating the analysis between non-
remote and remote areas. This more comprehensive analysis may serve as a
benchmark for future studies as new data, such as the 2008 NATSISS, become
available.
3. Data and Methodology
The 2002 NATSISS
The 2002 NATSISS, released for full public access in 2005, was the second major
national survey to have collected information specifically on Indigenous Australians.
At the time of collection the survey was thought to represent 1 in 30 Indigenous
people over 15 years of age (ABS, 2005a: 5). This sample size is argued to permit
reasonably accurate inferences about the general population, as has been
demonstrated by comparisons with other data sources. For example, the rate of
CDEP participation reported in the 2002 NATSIS is almost identical to that recorded
in CDEP administrative data6 (Biddle and Hunter, 2006: 40). However, despite
6 A similar test for the underreporting of arrest was conducted by comparing West Australian Police Force records with results in the 1994 NATSIS, which revealed that the survey results were accurate (Borland and Hunter, 2000: 127).

14
corroborating evidence on some key survey results, concerns exist regarding some
survey techniques and results.
Importantly, it is thought that the survey’s exclusion of residents of non-private
dwellings has the potential to skew information on certain areas of interest. At the
time of collection this excluded subgroup, that is residents of hotels, hostels,
hospitals, short-stay caravan parks, prisons and other correctional facilities, were
estimated to comprise 4 per cent of the Indigenous population (ABS, 2005a: 3).
Members of this subgroup are known to differ significantly from the broader
Indigenous population in a number of respects. In particular, they are more likely to
have been arrested in the last five years, concentrated outside capital cities, more
likely to be male, young and to have been taken from their natural families (Biddle
and Hunter, 2006: 33). Residents of non-private dwellings are also expected to have
worse health outcomes (Ross, 2006a: 70). Given the heterogeneity between these
two populations, the information relating to a number of issues in the 2002 NATSISS
is likely to be subject to some selection bias.
The information on alcohol use in the 2002 NATSISS has been identified as
particularly problematic. In particular, Chikritzhs and Brady (2006) conducted an
exhaustive review of this issue and concluded that the rate of ‘at risk drinking’ is
affected by underreporting to such an extent that the 2002 NATSISS may understate
the incidence of high risk drinking by a factor of three or more (Chikritzhs and Brady,
2006: 245). Despite these concerns, this information has been used in previous
research (see, for example, Hunter and Daly, 2008).
Finally, a number of restrictions to the range of operations permitted in analysing
2002 NATSISS data, required to ensure participant’s privacy, prohibit some areas of
analysis. In particular, while it is possible to control for state or region of residence in
separate analysis, these operations are not possible jointly. Second, though
information was collected separately for remote and very remote areas, they are
reported in aggregate as ‘remote’, preventing separate analysis of these regions. As
noted in Section 2, this aggregation causes ambiguities in the interpretation of
variables which are known to correlate with increased remoteness, such as speaking
an Indigenous language and living in an ethnically mixed household. Further, the
inability to separately analyse information relating to residents of very remote areas

15
hinders research on a group known to have particularly poor socio-economic and
labour market outcomes. As Altman and Hunter (2006) note, there is a “worrying
mismatch between the level at which data are available and the level at which they
are increasingly needed...” (Altman and Hunter, 2006: 314).
The 2002 NATSIS was based on information from 9359 individuals drawn from 5887
households. For the purposes of this study individuals aged over 65 years of age,
full-time students and those with missing information are excluded, reducing the
sample to 7701 people, with 3275 males and 4426 females. Through application of
the unit weights provided in the CURF, the results presented may be interpreted as
reflective of the Indigenous population as a whole (Biddle and Hunter, 2006: 41).
Methodology
The main purpose of this paper’s empirical analysis is to model the labour market
categories of Indigenous Australians as a function of exogenous variables covering
geography, demographic characteristics, education, health, culture, crime and
housing issues. The variables relating to these factors were selected on the basis of
a specific to general modelling strategy (forward selection) governed by the
economic issues being examined. The possible labour market outcomes considered
are ‘employed’ (Empd), ‘CDEP participant’ (CDEP), ‘unemployed’ (Ue) and ‘NILF’
(NILF). As the four dependent variables are categorical, rather than continuous or
ordinal, multinomial logit regression is the most appropriate model for the analysis.
The multinomial logit coefficients for a particular labour force category relate to the
‘log odds ratio’, where the odds ratio is the probability of being in that category
divided by the probability of being in the reference group, assumed here to be
‘employed’. These coefficients may be used to compute probabilities using:
4
1
Probability ( )j i
k ii k
k
eY j
e
β
β
′
= ′
=
= =
∑
X
X
where βj is a vector of coefficients relating the variables contained in the vector X to
the log odds ratio for the jth labour force category relative to the reference labour
force category of the employed.
Given the complexity of interpreting the log odds ratios, it is standard to report the
variable’s marginal effects rather than their coefficients. The marginal effects for

16
each variable (e.g. married) are derived by subtracting the probabilities associated
with the base case (e.g. not married) from the probabilities found for each coefficient
(e.g. married). In discussion of each factor’s marginal effects, reference to their
statistical significance refers to that of the relevant coefficient.
The first model reported in this paper considers the determinants of labour force
status separately for males and females. This model includes both those variables
reviewed in previous studies (region of residence, age, family characteristics,
education, health, culture and crime) and a number of ‘new’ variables, not
incorporated in previous studies for Indigenous Australians7. These ‘new’ variables
cover factors relating to health (smoking and alcohol use8), culture (attending cultural
events and living in homelands) and housing issues. The housing issues covered are
living in a house which is: ‘overcrowded’ (crowding), ‘has not had repairs in the last
12 months’ (no repairs), ‘lacks key household facilities’ (facilities) or ‘has major
structural problems’ (structural problems). Housing issues have been included in the
present study due to recent policy and academic focus on the potential labour
market implications of the poor housing stock available to Indigenous Australians,
particularly in remote areas9. For full details on each variable, their descriptive
statistics, and the omitted category for each set of variables, see Appendix A.
In order to examine the interaction of geography with other determinants of labour
force status, following discussion of the analysis described above, the model is re-
estimated separately for non-remote and remote areas. Through this process it is
possible to observe inter-regional differences in the determinants of labour force
outcomes among Indigenous people.
4. Empirical Results
Determinants of Labour Force Status with the Full Sample
Before discussing particular estimates, it is informative to consider whether the sets
of variables used in this model are independently significant by conducting likelihood
ratio tests. For this purpose, the joint significance of each standard set of factors is
7To ensure that the inclusion of this study’s ‘new’ variables did not adversely affect the estimates relating to other
variables, sensitivity analysis was performed by conducting separate estimates using a parsimonious model which excluded the ‘new’ variables. The estimates of this parsimonious model did not differ significantly from the expanded model, suggesting that the ‘new’ variables inclusion did not adversely affect the estimates. 8Hunter and Daly (2008) use variables for alcohol use, but their analysis covers only labour supply among females. 9Minister Macklin stated “improved housing is central to our agenda for remote Australia. This is because decent housing is essential for... employment...” (Addressing Disadvantage in Remote Australia 2009).

17
considered and, as the new variables are of particular interest, variables relating to
health, culture and housing issues are tested separately. The results of this test for
males, shown in Table 2, reveal that all the variables considered in the expanded
model, including those included for the first time in this study, enhance the fit of the
model. The results of this process are similar for females (not shown). It is now
appropriate to discuss the full results summarised in Tables 3 and 4.
Table 2 – Likelihood Test Procedure, Males
Sets of
Variables
Change in
Likelihood
Ratio
Individual
Variables –
Health
Change in
Likelihood
Ratio
Individual
Variables –
Culture
Change in
Likelihood
Ratio
Individual
Variables –
Housing
Change in
Likelihood
Ratio
Geography 171.43*** Smoker 22.93*** Homelands 12.22*** Crowding 20.96***
Age 68.29*** Disability 34.64*** Mixed household 62.54*** No repairs 4.41*
Family characteristics 92.02*** SAHS 101.79*** Cultural event 77.13*** Facilities 7.23**
Education 150.66*** Alcohol 35.7*** Indigenous language 50.44***
Structural problems 20.11
Arrest 69.79*** Removed 12.41***
TSI 4.73*
Note: Statistical significance based on the chi-squared distribution is indicted by *, ** and *** for p-values of 0.05, 0.01 and 0.001 respectively. Source: ABS 2005b.
The results presented in Tables 3 and 4 are largely consistent with those found by
the prior studies reviewed in Section 2. In particular, variables related to geography,
age, family characteristics, SAHS, disability status, speaking an Indigenous
language, living in an ethnically mixed household, having been removed from family,
identify as TSI and crime, yield results which closely mirror those found in other
studies. Accordingly, the following discussion has been restricted to discussing those
factors for which the results found here differ somewhat from previous studies (most
notably education) and to analysis of results relating to this study’s new variables.
The marginal effects associated with education variables presented in Table 3 are in
general weaker than those presented in previous studies. For example, this paper’s
analysis reveals that completing school has a marginal effect on the probability of
employment of only 6.1 and negative 0.3 percentage points for males and females
respectively. That is, relative to completing year 10, completing year 12 has virtually
no

18
Table 3 – Marginal Effects of Selected Characteristics on LFS, Males
NILF Ue CDEP Empd
Base case 0.232 0.166 0.173 0.429
Geography
Inner regional -0.013 0.016 0.078 -0.081
Outer regional 0.021 0.028 0.026 -0.075
Remote -0.082 -0.127 0.381 -0.173
Age
Age 25-34 0.012 -0.037 -0.091 0.117
Age 35-44 -0.015 -0.045 -0.097 0.157
Age 45-54 0.046 -0.096 -0.096 0.146
Age 55-64 0.228 -0.131 -0.127 0.030
Family
Married -0.135 -0.019 -0.018 0.172
One dependant -0.040 -0.032 0.108 -0.036
Two or three dependants -0.141 0.038 0.336 -0.232
Four or more dependants -0.025 0.048 0.174 -0.197 Education
≤year 9 0.173 -0.025 0.013 -0.161
Year 11 (n.s.) -0.036 -0.034 0.077 -0.007
Year 12 -0.101 -0.024 0.065 0.061
Certificate -0.033 -0.081 -0.036 0.150
Degree or diploma -0.051 0.005 -0.104 0.150
English difficulty 0.116 0.023 0.007 -0.145
Health
Smoker 0.061 0.049 0.011 -0.121
Disability 0.154 0.000 -0.021 -0.133
Good SAHS 0.029 -0.042 0.017 -0.004
Fair SAHS 0.159 -0.007 -0.016 -0.136
Poor SAHS 0.443 -0.132 -0.017 -0.294
No alcohol use 0.006 0.075 0.026 -0.107
High risk alcohol use -0.066 0.009 0.073 -0.016
Cultural
Homelands -0.017 0.023 0.076 -0.082
Mixed household -0.043 -0.060 -0.095 0.198
Cultural event -0.103 -0.055 0.360 -0.203
Indigenous language 0.177 -0.032 0.046 -0.191
Removed -0.051 0.104 -0.003 -0.049
TSI (n.s.) -0.080 0.066 0.031 -0.017
Crime Arrested 0.003 0.155 0.023 -0.181 Housing
Crowding 0.071 0.068 -0.057 -0.082 No repairs -0.002 0.002 0.053 -0.054 Facilities 0.012 -0.066 0.098 -0.044 Structural problems 0.055 0.055 -0.036 -0.074
Note: The base case refers to a hypothetical male with mean characteristics. The marginal effects show the change in th probability of being in the respective labour force category associated with the respective explanatory variable. As the marginal effects in each row sum to zero, if any marginal effect is based on a statistically significant coefficient the other marginal effects in that row are also likely to be statistically significant (Hunter and Gray 1999: 17). Where all the coefficients of a particular variable are statistically insignificant at the 10 per cent significance level this is indicted by “n.s.” in parentheses. The sample size is 3275. Source: ABS 2005b.

19
Table 4 – Marginal Effect of Selected Characteristics on LFS, Females
NILF Ue CDEP Empd
Base case 0.472 0.104 0.099 0.325
Geography
Inner regional 0.015 0.033 0.034 -0.082
Outer regional -0.015 0.006 0.069 -0.060
Remote -0.231 -0.047 0.391 -0.113
Age
Age 25-34 -0.029 -0.042 -0.010 0.080
Age 35-44 -0.148 -0.065 -0.016 0.229
Age 45-54 -0.087 -0.073 -0.026 0.186
Age 45-64 0.124 -0.103 -0.052 0.031
Family
Married 0.013 -0.038 0.025 0.000
One dependant 0.126 -0.035 -0.019 -0.072
Two or three dependants -0.092 0.056 0.232 -0.196
Four or more dependants 0.025 0.068 0.133 -0.226 Education
≤year 9 0.128 -0.014 -0.019 -0.096
Year 11 (n.s.) -0.022 -0.004 -0.007 0.034
Year 12 -0.258 0.128 0.133 -0.003
Certificate -0.156 -0.031 -0.018 0.205
Degree or diploma -0.317 -0.055 -0.049 0.421
English difficulty 0.080 0.023 0.009 -0.112
Health
Smoker 0.023 0.040 0.013 -0.076
Disability 0.085 -0.002 0.015 -0.098
Good SAHS 0.071 0.000 0.012 -0.082
Fair SAHS 0.121 0.037 -0.027 -0.130
Poor SAHS 0.310 -0.037 -0.044 -0.229
No alcohol use 0.069 -0.009 0.031 -0.091
High risk alcohol use -0.008 0.026 0.046 -0.064
Cultural
Homelands -0.043 -0.023 0.028 0.038
Mixed household -0.159 -0.002 -0.031 0.193
Cultural event -0.103 -0.015 0.114 0.003
Indigenous language 0.092 -0.014 0.023 -0.101
Removed 0.005 0.036 -0.001 -0.039
TSI (n.s.) 0.027 0.008 0.021 -0.056
Crime
Arrested 0.132 0.049 -0.010 -0.171
Housing
Crowding 0.043 0.011 0.017 -0.071
No repairs (n.s.) 0.029 -0.020 -0.010 0.001
Facilities (n.s.) 0.062 -0.015 0.010 -0.057
Structural problems 0.006 0.019 0.006 -0.031
Note: The base case refers to an Indigenous female with mean characteristics. The sample size is 4426. Source: ABS 2005b.
20
effect on the employment probability among females and a small effect for males
less than one third the strength of the marginal effects associated with factors such
as the presence of two or three dependants, four or more dependants, poor health,
living in an ethnically mixed household and recent arrest. This contrasts with the far
stronger effects identified by previously reviewed studies, which found completing
year 12 to be associated with marginal effects of 9.8 to 28.6 percentage points.
The contrast between the present study and those previously reviewed appears to
be driven by the use of contrasting reference groups: while this study uses a
reference group which has completed year 10 but with no further qualifications, other
studies use a more extreme reference group which either left school between years
6 to 9 (Hunter and Gray, 1999, 2001, 2002; Borland and Hunter, 2000) or an
unbounded group with less than year 9 or 10 education (Biddle and Webster, 2007;
Hunter and Daly, 2008). It is arguable that using these low education levels as a
reference group unduly inflates the effect of education variables, since the failure to
complete compulsory education may be correlated with other factors, such as social
marginalisation or family dysfunction, which are likely to have an independent
negative effect on the probability of employment. Despite this observation, it should
be noted that this paper’s results do indicate that completing non-school
qualifications has a large positive effect on the probability of employment, particularly
among Indigenous females.
Turning to the new variables, we start with the implications of alcohol use. Relative to
the omitted category of low or moderate alcohol consumption, abstinence from
alcohol is associated with a decline in employment for both genders. Relative to the
same reference group, high alcohol use among females is associated with a
negative marginal effect on employment probability of 6.4 percentage points, but had
no statistically significant relationship with labour force status among males. Perhaps
contrary to popular perception, this result suggests that alcohol abuse among
Indigenous Australians has a weaker effect on employment probability than among
other populations for which similar analyses have been conducted. For example, one
study using data for England has found that problem drinking is associated with a
decline in “the probability of working by between 0.07 and 0.31, depending on the
exact definition of problem drinking and choice of instrument” (MacDonald and

21
Shields, 2004: 147) – significantly higher than the effect found here for Indigenous
Australians. However, it is important to recall the significant caveat for this papers
results that, as the survey excludes residents of non-private dwellings (who are far
less likely to be employed and far more likely to abuse alcohol (Chikritzhs and Brady,
2006: 243)) the results presented here will understate the association between
alcohol abuse and the labour force statuses of Indigenous Australians. This
analytical deficiency cannot be addressed without improved data on this topic.
Ceteris paribus, identifying as a smoker is associated with a negative marginal effect
on the probability of employment of 12.1 and 7.6 percentage points for males and
females, respectively. This is a large effect, for example, similar to the marginal
effect of having a disability. Invoking the human capital framework, one possible
explanation is that smoking may reduce employment indirectly given its documented
negative impact on health. However, as the model used in this study includes other
measures for health status, the scope for this effect is limited. Another possibility is
that, given the documented correlation between smoking and illicit drug abuse
(Sullivan and Covey, 2002: 704), the smoking variable may capture some of the
unmeasured negative labour market implications associated with illicit drug use.
Both the new cultural variables included in this study tend to have a statistically
significant relationship with labour force status. In particular, having attended a
cultural event in the last 12 months is associated with a 20.3 percentage point
decline in the probability of employment for males, but no statistically significant
relationship with labour force status among females. The decline in employment
among males is primarily driven by a 36 percentage point increase in CDEP
participation. As attendance and participation in cultural activities may have been
counted as CDEP work (Hudson, 2008: 2), it is likely that this result reflects the fact
that attending cultural events and CDEP participation are jointly determined.
Among males, ‘living in homelands’ has a negative marginal effect on employment of
8.2 percentage points, with a corresponding increase in CDEP participation of 7.6
percentage points. In contrast, for females, this factor has a small positive effect on
both employment and CDEP participation. These results are of interest in part
because of the prognosis presented by some that a major contributor to the poor
employment outcomes among Indigenous people is their relatively low proclivity to

22
leave their ‘homelands’ and relocate for employment purposes (Hughes, 2007).
Although the results presented here do indicate that living in ‘homelands’ has a
negative association with employment for males, if not for females, the strength of
this relationship is not so strong as to suggest that the choice to live in one’s
‘homelands’ is associated with a major labour market penalty once personal
characteristics are controlled for.
Of the housing quality variables, only ‘crowding’ and ‘structural problems’
consistently have a statistically significant association with labour force status among
males and females. Both of these are associated with a decline in employment and
participation, an effect which is strongest for males. As noted in Section 2, a number
of studies have suggested that poor housing may negatively affect Indigenous
Australian’s association with the labour market, primarily because of its negative
implications for health and educational attainment (Taylor, 2008: 53). However, as
the present study controls for education and health, it is arguable that these results
show that crowding and structural problems have a direct relationship with poor
labour market outcomes.
A possible concern with this interpretation is that the relationship between housing
issues and labour force status may be driven by the fact that having a job allows one
to finance more adequate housing, meaning housing issues would be endogenous to
labour force status. However, as only 25 per cent of Indigenous people live in owner-
occupied homes (Biddle, 2008: 10), housing quality for the majority of the Indigenous
community is likely to be independent of their own finances. Therefore, these results
could well indicate that poor housing has a direct negative effect on an Indigenous
person’s chances of acquiring and retaining employment, a conclusion which is
congruent with prior assumptions and highlights the potential benefits associated
with the recent policy focus on improved housing facilities for Indigenous Australians
(Addressing Disadvantage in Remote Australia, 2009).
Before concluding this sub-section it is useful to briefly consider how these results
can be used to infer the determinants of supply and demand for Indigenous labour.
Though attempts to identify the separate impact of labour supply or demand are
difficult as any particular labour market outcome invariably reflects the interaction of
these factors, the results presented above are sufficient for some tentative

23
conclusions. In particular, it is apparent that males who are either: aged 55 to 64,
have less than year 10 education, have difficulty speaking English, have a disability
or are in fair or poor health, are all much less likely to be labour force participants,
implying that these factors impinge on labour supply. In contrast being married,
having two or three dependants or attending cultural events has a very strong
positive effect on labour supply among males. Similar results are found for women,
except that dependants have a mixed effect on labour supply, while non-school
education and living in an ethnically mixed household have stronger positive effects
on female labour supply. These results confirm that a range of variables relating to
demographic characteristics, culture and human capital are important determinants
of labour supply among Indigenous people.
Though drawing inference in relation labour demand is difficult, not least because of
the role of CDEP, it is likely that those variables which primarily impact on the
relative likelihood of unemployment and employment do so by influencing labour
demand. For example, having been arrested decreases employment and increases
unemployment, but has no effect on NILF and CDEP. This suggests that this
variable has only a limited effect on the desire for mainstream employment (labour
supply), but significantly decreases the demand for labour. This may imply that
further emphasis on employment programs to assist criminal offenders may be
particularly useful in increasing employment outcomes.
In composite this section highlights the wide range of variables which have a
statistically significant relationship with the probability of employment. For both males
and females, some of the strongest positive marginal effects on the probability of
employment are associated with being aged 35 to 44 and living in an ethnically
mixed household. Completing a degree, diploma or certificate also has a strong
positive effect on employment probability, particularly for females. Of the variables to
have a negative impact, among the strongest are having two or three dependants,
four or more dependants, poor SAHS and having been arrested – all of which have a
negative marginal effect on the probability of employment of approximately 20
percentage points for males and females. This section, therefore, highlights that
initiatives to increase employment among Indigenous people are well served by
considering not only those factors related to human capital, such as education and

24
health, but also a range of socio-cultural variables, such as the labour market
implications of dependants and interactions with the criminal justice system. The
very strong positive effect associated with living in an ethnically mixed household is
also of interest and is explored further in the following section.
Determinants of Labour Force Status in Non-Remote and Remote areas
Disaggregating the sample between non-remote and remote areas may offer a
better understanding of the determinants of labour force status in these regions, and
is necessary to identify systematic differences between them. This is important
given recent academic and policy focus on the “...growing disparity between
Indigenous people living in remote areas and both Indigenous and non-Indigenous
Australians living in non-remote areas...” (Gray and Chapman, 2006: 118). Indeed,
this study’s finding that male residents of remote areas were 17.3 percentage points
less likely to be employed than those in major cities (Table 3) again demonstrates
this significant inter-regional contrast. The only previous study to consider inter-
regional variations in the determinants of labour force status is Hunter (2004).
However, as Hunter (2004) relied on the less detailed Census data, the present
study is able to identify a number of hitherto unobserved trends. In the interest of
brevity, only those results which reveal significant variations between non-remote
and remote areas are discussed below, meaning the variable sets for family
characteristics and housing issues are omitted in the following discussion.
The results presented in Table 5 reveal that for both genders the probability of
employment increases more strongly with age in remote areas – a result consistent
with previous findings (Hunter, 2004: 71). This apparent inter-regional difference is
driven by the particularly low rates of employment among young Indigenous people
in remote areas. It is also notable that while increased employment with age in non-
remote areas is accompanied by a significant decline in unemployment, in remote
areas it is CDEP participation which declines most strongly. This result is driven by
the significant presence of young people among the unemployed in non-remote
areas compared with their heavy reliance on CDEP in remote areas.

25
Table 5 – Marginal Effects of Age in Non-Remote and Remote Areas
Non-Remote Remote
Males NILF Ue CDEP Empd NILF Ue CDEP Empd
Base case 0.223 0.202 0.066 0.509 0.255 0.075 0.448 0.223
Age 25-34 0.029 -0.052 -0.043 0.066 0.001 -0.009 -0.182 0.190
Age 35-44 0.021 -0.073 -0.050 0.102 -0.049 -0.003 -0.165 0.217
Age 45-54 0.108 -0.118 -0.051 0.061 -0.022 -0.045 -0.186 0.254
Age 55-64 0.266 -0.162 -0.054 -0.050 0.190 -0.055 -0.296 0.161
Females
Base case 0.472 0.127 0.030 0.371 0.470 0.044 0.285 0.201
Age 25-34 -0.124 -0.060 -0.003 0.188 -0.233 -0.031 -0.061 0.326
Age 35-44 -0.029 -0.090 -0.014 0.132 -0.087 -0.038 -0.086 0.211
Age 45-54 -- -- -- -- -0.033 -0.042 -0.105 0.181
Age 55-64 -0.030 -0.037 -0.001 0.067 -0.114 -0.011 0.028 0.096
Note: The base case refers to a hypothetical person with the mean characteristics which prevail in non-remote and remote areas, respectively. The base case probabilities also apply to Tables 6-11. For males the sample size was 1755 and 1520 for non-remote and remote areas, respectively. For females the corresponding sample sizes were 2499 and 1927. Source: ABS 2005b.
The results for education and English skills, presented in Table 6, reveal that these
variables generally have stronger effects on the probability of employment in non-
remote areas. For example, in non-remote areas, leaving school before completing
year 10 and English difficulty have negative marginal effects on the probability of
employment of over 20 percentage points among males. In contrast, in remote
areas, leaving school early had only a small effect on the probability of employment
(8.1 percentage points), while English difficulty did not have a statistically significant
relationship with any particular labour market outcome. Likewise, education tends to
be associated with stronger effects on labour force participation in non-remote areas.
The only exceptions to this trend is that for males having a certificate is associated
with a significantly stronger positive effect on employment in remote areas (23.3
percentage points) than in non-remote areas (10.4 percentage points), while for
females all non-school education variables have stronger effects in remote areas.
The regional variations in the effects of education shown here conflict with the
findings by Hunter (2004), cited in Section 2, that education consistently has stronger
effects in remote areas. The omission of cultural factors in Hunter (2004), due to
data limitations, may contribute to this discrepancy since not accounting for the
negative correlation between education levels and the measures of cultural

26
attachment used in this study, (tests reveal, ABS, 2005b) leads to an inflated
estimate of the returns to education in remote, relative to non-remote, areas.
Table 6 – Marginal Effects of Education and English Skills in Non-Remote and Remote Areas
Non-Remote Remote Males NILF Ue CDEP Empd NILF Ue CDEP Empd
≤year 9 0.246 -0.051 0.006 -0.201 0.069 0.009 0.003 -0.081
Year 11 (n.s.) -0.010 -0.056 0.052 0.014 (n.s.) -0.086 0.014 0.072 -0.001
Year 12 -0.135 -0.064 0.243 -0.043 (n.s.) -0.076 0.210 -0.170 0.036
Certificate 0.017 -0.113 -0.008 0.104 -0.137 0.005 -0.101 0.233
Degree or diploma (n.s.) -0.039 -0.034 -0.044 0.118 (n.s.) 0.028 0.056 -0.169 0.085
English difficulty 0.186 0.031 0.016 -0.234 (n.s.) 0.014 0.009 -0.047 0.024
Females
≤year 9 0.185 -0.046 -0.012 -0.127 0.227 -0.019 -0.100 -0.108
Year 11 (n.s.) -0.003 -0.001 0.006 -0.002 0.008 -0.024 -0.040 0.056
Year 12 -0.220 0.099 0.055 0.067 -0.134 0.169 -0.047 0.012
Certificate -0.071 0.012 0.001 0.057 -0.134 -0.027 -0.058 0.219
Degree or diploma -0.330 -0.091 -0.027 0.448 -0.393 -0.027 -0.165 0.585
English difficulty 0.072 0.069 -0.003 -0.138 (n.s) -0.013 0.009 0.005 -0.001
Source: ABS 2005b.
Another notable trend is the consistency with which increased education reduces
unemployment in non-remote areas, but increases unemployment in remote areas.
Further, CDEP participation declined significantly in association with education in
remote areas, but is relatively insensitive to increased education in non-remote
areas.
27
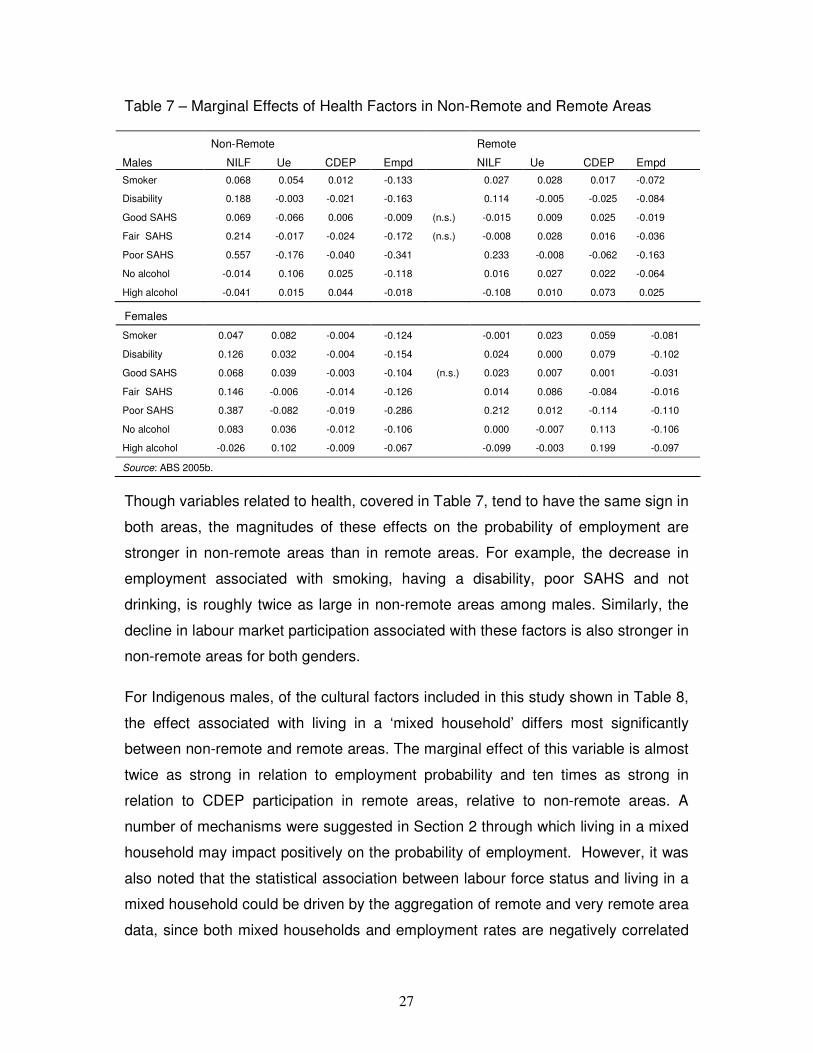
Table 7 – Marginal Effects of Health Factors in Non-Remote and Remote Areas
Non-Remote Remote
Males NILF Ue CDEP Empd NILF Ue CDEP Empd
Smoker 0.068 0.054 0.012 -0.133 0.027 0.028 0.017 -0.072
Disability 0.188 -0.003 -0.021 -0.163 0.114 -0.005 -0.025 -0.084
Good SAHS 0.069 -0.066 0.006 -0.009 (n.s.) -0.015 0.009 0.025 -0.019
Fair SAHS 0.214 -0.017 -0.024 -0.172 (n.s.) -0.008 0.028 0.016 -0.036
Poor SAHS 0.557 -0.176 -0.040 -0.341 0.233 -0.008 -0.062 -0.163
No alcohol -0.014 0.106 0.025 -0.118 0.016 0.027 0.022 -0.064
High alcohol -0.041 0.015 0.044 -0.018 -0.108 0.010 0.073 0.025
Females
Smoker 0.047 0.082 -0.004 -0.124 -0.001 0.023 0.059 -0.081
Disability 0.126 0.032 -0.004 -0.154 0.024 0.000 0.079 -0.102
Good SAHS 0.068 0.039 -0.003 -0.104 (n.s.) 0.023 0.007 0.001 -0.031
Fair SAHS 0.146 -0.006 -0.014 -0.126 0.014 0.086 -0.084 -0.016
Poor SAHS 0.387 -0.082 -0.019 -0.286 0.212 0.012 -0.114 -0.110
No alcohol 0.083 0.036 -0.012 -0.106 0.000 -0.007 0.113 -0.106
High alcohol -0.026 0.102 -0.009 -0.067 -0.099 -0.003 0.199 -0.097
Source: ABS 2005b.
Though variables related to health, covered in Table 7, tend to have the same sign in
both areas, the magnitudes of these effects on the probability of employment are
stronger in non-remote areas than in remote areas. For example, the decrease in
employment associated with smoking, having a disability, poor SAHS and not
drinking, is roughly twice as large in non-remote areas among males. Similarly, the
decline in labour market participation associated with these factors is also stronger in
non-remote areas for both genders.
For Indigenous males, of the cultural factors included in this study shown in Table 8,
the effect associated with living in a ‘mixed household’ differs most significantly
between non-remote and remote areas. The marginal effect of this variable is almost
twice as strong in relation to employment probability and ten times as strong in
relation to CDEP participation in remote areas, relative to non-remote areas. A
number of mechanisms were suggested in Section 2 through which living in a mixed
household may impact positively on the probability of employment. However, it was
also noted that the statistical association between labour force status and living in a
mixed household could be driven by the aggregation of remote and very remote area
data, since both mixed households and employment rates are negatively correlated

28
with remoteness. The results presented above are useful in determining the relative
strength of these alternate hypotheses.
Table 8 – Marginal Effects of Cultural Factors in Non-Remote and Remote Areas
Non-Remote Remote
Males NILF Ue CDEP Empd NILF Ue CDEP Empd
Homelands -0.019 0.055 0.033 -0.068 -0.042 -0.006 0.118 -0.069
Mixed household -0.061 -0.085 -0.032 0.178 0.014 0.005 -0.320 0.302
Cultural event -0.052 -0.076 0.270 -0.141 -0.144 -0.017 0.249 -0.088
Indigenous language 0.173 -0.005 -0.001 -0.167 0.085 -0.040 0.090 -0.136
Removed -0.022 0.148 -0.027 -0.099 -0.050 -0.025 0.041 0.034
TSI -0.087 0.200 -0.056 -0.056 -0.095 -0.070 0.218 -0.053
Females
Homelands -0.169 0.001 0.014 0.154 0.007 -0.024 0.032 -0.016
Mixed household -0.163 -0.033 -0.018 0.215 -0.145 0.000 -0.055 0.200
Cultural event -0.125 -0.014 0.190 -0.051 -0.079 0.001 0.159 -0.081
Indigenous language -0.009 -0.034 -0.012 0.055 0.075 -0.001 0.025 -0.098
Removed -0.003 0.073 -0.008 -0.062 (n.s.) -0.110 -0.018 0.110 0.018
TSI -- -- -- -- -0.065 -0.015 0.156 -0.076
Source: ABS 2005b.
First, as living in a mixed household does have a significantly stronger effect in
remote areas it is possible that the marginal effect of this variable is inflated by its
unmeasured correlation with remoteness. However, it is also possible that the labour
market benefits of living in a mixed household are simply stronger in remote areas.
Moreover, as the discussed data limitations do not apply to non-remote areas, the
fact that living in a mixed household continues to be associated with increased
employment in these areas demonstrates that this factor does have positive labour
market implications even where data limitations are not an issue.
Importantly, if living in an ethnically mixed household can be taken as a rough proxy
for greater integration with non-Indigenous society, then this result suggests that
such integration is associated with a higher probability of employment. However, the
mechanism for this increase is unclear. As noted in Section 2, there are a number of
reasons why living in an ethnically mixed household may be more conducive to
being employed. However, it is also possible that the causality runs in the opposite
direction: having employment may increase the probability of living in a mixed

29
household, through, for example, higher rates of ‘out marriage’ among Indigenous
people in employment.
It was also noted in Section 2 that, as for mixed households, the labour market
effects associated with speaking an Indigenous language may reflect the correlation
between this factor and unmeasured remoteness. However, as the negative effect
on employment for males of speaking an Indigenous language is actually stronger in
non-remote areas, it seems that this measure for cultural attachment is also
associated with negative labour market implications, at least for males, distinct from
complications relating to unmeasured correlation with remoteness. This suggests
that the lower employment rates among males who speak an Indigenous language
are attributable to the preferences among this group for traditional activities outside
the mainstream labour market (as demonstrated by higher rates of NILF and CDEP
participation) or the greater difficulty in gaining employment experienced by more
traditional people (Altman et al., 2005: 21).
In relation to arrest, Table 9 reveals that among males arrest has a significantly
weaker effect on employment in remote areas. In both regions, participation rates
are found to be relatively insensitive to arrest, as was the case when the sample was
considered in aggregate. These results are similar to those for females, except that
in both regions female participation rates fall significantly in association with arrest.
Table 9 – Marginal Effects of Arrest in Non-Remote and Remote Areas
Non-Remote Remote
Males NILF Ue CDEP Empd NILF Ue CDEP Empd
Arrested 0.019 0.190 -0.011 -0.198 -0.014 0.066 0.070 -0.123
Females
Arrested 0.078 0.144 -0.007 -0.214 0.160 0.000 -0.090 -0.070
Source: ABS 2005b.
One trend revealed by this section is that in addition to arrest, other variables relating
to human capital variables, such as education and health, tend to be associated with
a weaker marginal effect on the probability of employment in remote areas relative to
non-remote areas. This is an interesting result with implications which are discussed
at the end of the following section.

30
Section 4 has extended the analysis of Indigenous labour force status by considering
new variables and examining variations in determinants between non-remote and
remote areas. A number of trends emerge from this analysis, the implications of
which are discussed in the following section.
Implications
An important aspect of the Indigenous labour market is the apparent role of the
CDEP as a substitute to unemployment in remote areas. As observed by Biddle and
Webster (2007):
Those who live in Remote or Very Remote regions are less likely to be unemployed than those in major cities or regional areas... [meaning] that in these areas the CDEP scheme appears to be providing an alternative to being unemployed (Biddle and Webster, 2007: 31).
This dynamic is further explored by the disaggregated analysis for non-remote and
remote areas. Importantly, the results confirm prior assumptions that where the
CDEP is widely available (i.e. remote areas) it is utilised by individuals who, given
their personal characteristics, otherwise are more likely to be unemployed, rather
than employed. That is, factors which increase unemployment in non-remote areas,
such as young age or having little education, significantly increase CDEP
participation in remote areas and have only a minor effect on unemployment.
The similarity in personal characteristics between CDEP participants in remote areas
and the unemployed in non-remote areas has implications for ongoing policy
initiatives to dismantle the old CDEP system10. In particular, the results suggest that
as the CDEP program is scaled back in remote areas the formerly CDEP employed
would predominantly transition to unemployment rather than mainstream
employment. That is, given the personal characteristics of remote area CDEP
recipients, even if these individuals relocated to non-remote areas, they would be
reasonably expected to disproportionately join the already unemployed. Of course,
this description is based on the current static analysis: if the employment prospects
of Indigenous people markedly improved, due either to increased human capital or
increased returns to existing human capital11, then this equation would be altered.
However, such a development would be a significant departure from the recent
10As of July 2009 the CDEP is no longer available to residents of non-remote locations “where the economy is well established” (CDEP, 2009). CDEP participants in remote areas will only receive wages until July 2011, after which they will be eligible for other forms of income support until employment is acquired (CDEP, 2009). 11
Attempts to increase such returns include the use of innovative employment programs (SCRGSP, 2009: 497-9).

31
experience of limited success in ongoing efforts to improve employment outcomes
(Altman et al., 2008). In this case, to the extent that the CDEP yields superior
outcomes to unemployment (Altman and Sanders, 2000; Hunter, 2009), the CDEP’s
apparent impending demise may be of some concern.
Another important result of Section 4 is the evidence of a consistent negative
association between the probability of employment and attachment to ‘Indigenous
culture’, as measured by proxy variables such as speaking an Indigenous language,
living in an ethnically mixed household, participation in cultural events and living in
homelands. While this conclusion conflicts with the tentative assertion that culture
“should not be seen as a barrier but as a potential part of the strategy to enhance
employment outcomes” (Dockery, 2009a: 29), it is consistent with results cited in
Section 2, such as those in Hunter and Gray (2001) and Borland and Hunter (2000).
Indeed, the results of the present paper appear to support the suggestion that “the
variables that capture the access of an individual to traditional lifestyles, ...are
associated with significant reductions in labour supply and declines in the desire to
work in the mainstream labour market” (Hunter and Gray, 2002: 24). However, this
conclusion requires some qualification, as there is some danger that utilising the
above variables as proxies for cultural attachment may yield misleading conclusions.
For example, living in an ethnically mixed household is clearly a better proxy
measure for the strength of an individual’s association or integration with non-
Indigenous society, rather than their attachment to Indigenous culture. Therefore,
these results should not be interpreted as straightforward measures of cultural
attachment, but rather may be viewed as reflecting a range of socio-cultural factors.
Despite the above qualifications, the results of Section 4 imply there is some basic
tension between mainstream employment and our measures of cultural attachment.
Likewise, there is evidence suggesting that greater integration with non-Indigenous
society may have significant positive labour market implications. If this reality is
driven by the preference of more traditional or culturally connected Indigenous
people to remain outside the labour force or remain as CDEP participants, then this
underlying disinclination towards mainstream employment may significantly impinge
on the success of attempts to dramatically increase employment rates among the
Indigenous community. Indeed, the conclusion that people who are more strongly

32
connected with the practices of a traditional culture, far removed from the norms of a
post-industrial society and economy, are less inclined to embrace mainstream
employment should perhaps be no great surprise.
The apparent tension between mainstream employment and cultural attachment also
points to the possibility that acquiring mainstream employment may be associated
with some trade-off with traditional culture and obligations for some people. If this is
so, then in light of recent evidence suggesting that strong cultural connections are
associated with significant benefits for Indigenous Australians (Dockery, 2009a,
2009b), the welfare effects of higher rates of mainstream employment may not be as
unambiguously positive as expected by many commentators.
Finally, it was noted at the end of Section 4 that the probability of employment
responds more strongly to variables relating to education, health and arrest in non-
remote areas, than in remote areas. This finding can be interpreted as indicating the
salience of SLM theory to the Indigenous labour market in remote areas, as it is
consistent with SLM theory’s expectations of weak returns to human capital. This is
also supported by the finding that cultural factors generally have a stronger effect in
remote areas, a result anticipated by SLM theory’s emphasis on socio-cultural
factors as key determinants of labour market outcomes. This conclusion implies that
the employment prospects of Indigenous people in remote areas may be particularly
difficult to enhance through a narrow focus on human capital accumulation and will
require consistent attention to a range of complex socio-cultural realities.
6. Conclusion
This paper makes several key contributions. First, by updating previous research
and incorporating a number of ‘new’ variables, it confirms the importance of a wide
array of geographic, demographic, cultural and human capital related factors as
determinants of labour supply and employment prospects among Indigenous
Australians. The only notable difference between these results and prior research is
that variables for education generally have a weaker effect on employment prospects
in this study, a discrepancy which appears to be driven by the use of, arguably
inappropriately, low education levels as the omitted category in prior studies.
Importantly, this analysis highlights the particularly strong association between
employment and a number of socio-cultural factors, such as having dependants,

33
speaking an Indigenous language, living in an ethnically mixed household and
having been arrested. This points to the complex reality of Indigenous employment
disadvantage and should be heeded as caution against ‘silver bullet’ solutions of
focusing on one set of favoured issues.
The paper’s disaggregation of its analysis between non-remote and remote areas
also demonstrated previously unidentified inter-regional variations in the
determinants of labour force status. Importantly, this analysis revealed a significantly
lower return to some standard measures of human capital, such as education and
health, in remote areas.
The implications of these results were considered in Section 5. In particular, it was
noted that the apparent substitution between CDEP and unemployment suggests
that ongoing reductions to the CDEP’s availability may lead to a stronger increase in
unemployment, rather than employment, a result supporting the contentions of other
analysts (Altman and Jordan, 2009; Altman et al., 2005). Section 5 also considers
the evidence implying an inverse relationship between proxy variables for cultural
attachment and mainstream employment. This apparent tension identifies the
difficulty inherent in dramatically increasing employment rates among some sections
of the Indigenous community. Finally, it was noted that the analysis also reveals
evidence suggesting the relevance of SLM theory to the Indigenous labour market in
remote areas, a result which further highlights the difficulty of driving enhanced
employment outcomes across the Indigenous community through a focus on human
capital alone.

34
References
Addressing Disadvantage in Remote Australia, (2009), Available online at http://www.ato.gov.au/budget/2009-10/content/ministerial_statements/ indigenous/html/ms_ indigenous-03.htm [15 Sept 2009].
Ah Kit, J. (2002), Indigenous Issues, Ministerial Statement from the Minister assisting the Chief Minister on Indigenous Affairs, Hansard, Legislative Assembly of the Northern Territory, 7 March. Available online at http://notes.nt.gov.au/lant/hansard/
Altman, J.C., Biddle, N. and Hunter, B.H. (2008), ‘How realistic are the prospects for “closing the gaps” in socioeconomic outcomes for Indigenous Australians?’, CAEPR Discussion Paper No. 287, Available online at http://www.anu.edu.au/caepr/.
Altman, J.C., Gray, M.C. and Levitus, R. (2005), ‘Policy issues for the Community Development Employment Projects Scheme in Rural and Remote Australia’, CAEPR Discussion Paper No. 271, Available online at http://www.anu.edu.au/caepr/.
Altman, J.C., Gray, M.C. and Sanders, W. (2000), 'Indigenous Australians working for welfare: what difference does it make?’, Australian Economic, Review, 33 (4):355-62.
Altman, J.C. and Hunter, B.H. (2006), ‘Influencing Indigenous policy making with statistics’, in Hunter, B.H. (ed.) Assessing Recent Evidence on Indigenous Socioeconomic Outcomes: A focus on the 2002 NATSISS, CAEPR Research Monograph No. 26, ANU E Press, Canberra, ACT, Available online at http://epress.anu.edu.au/
Altman, J.C. and Jordan, K. (2009), The untimely abolition of the Community Development Employment Program: submission to Senate Community Affairs Committee Inquiry into the Family Assistance Program, CAEPR, Canberra, ACT ACT Research, Available online at http://www.anu.edu.au/caepr/.
Altman, J.C. and Sanders, W. (2008), ‘Re-vitalising the Community Development Employment Program in the Northern Territory’, CAEPR Topical Issue No. 5. Available online at http://www.anu.edu.au/caepr/.
Australian Bureau of Statistics (ABS). (2005a), National Aboriginal and Torres Strait Islander Social Survey 2002, Cat. No. 4714.0, ABS, Canberra, ACT.
Australian Bureau of Statistics (ABS). (2005b), National Aboriginal and Torres Strait Islander Social Survey: Expanded Confidentialised Unit Record File, Cat. No.4720.0.
Barrett, G.F. (2002), 'The effect of alcohol consumption on earnings', Economic Record, 78 (1): 79-96.
Biddle, N. (2008), ‘The scale and composition of Indigenous housing need, 2001–06’, CAEPR Working Paper No. 47, Available online at http://www.anu.edu.au/caepr/.
Biddle, N. and Hunter, B.H. (2006), ‘Some methodological issues for the 2002 NATSISS’, Australian Journal of Labour Economics, 9(1): 33-50.
Biddle, N. and Webster, A. (2007), Modelling the labour force status of Aboriginal and Torres Strait Islander Australians, Australian Labour Market Research Workshop, February, Melbourne.
Booth, A. and Carroll, N. (2005), ‘The health status of Indigenous and non-Indigenous Australians’, CAEPR Discussion Paper No. 486, http://www.anu.edu.au/caepr/.
Borland, J. and Hunter, B.H. (2000), ‘Does crime affect employment status? - the case of Indigenous Australians’, Economica, 67(1): 123–44.
Cain, G. (1976), ‘The challenge of segmented labour market theories to orthodox theory: a survey’ Journal of Economic Literature’, December, 14(4): 1215-57.
Chikritzhs, T. and Brady, M. (2006), in Hunter, B.H. (ed.) Assessing Recent Evidence on Indigenous Socioeconomic Outcomes: A focus on the 2002 NATSISS, CAEPR Monograph No. 2, Canberra, ACT. Available online at http://epress.anu.edu.au/c26_citation.html.
Community Development Employment Projects (CDEP), (2009) Available online at http://www.centrelink.gov.au/internet/internet.nsf/services/cdep.htm [8 Oct 2009].
Crossley, T. and Kennedy, S. (2002), ‘The reliability of self-assessed health status’, Journal of Health Economics, 21(4): 643–58.

35
Daly, A.E. (1993), ‘The determinants of employment for Aboriginal people’, Australian Economic Papers, 32(60): 134–151.
Daly, A.E. (1994), ‘The determinants of employment income for Indigenous Australians’, International Journal of Manpower, 16(4): 11–29.
Daly, A.E. (1995), Aboriginal and Torres Strait Islander People in the Australian labour market, Cat. No. 6253.0, ABS, Canberra, ACT.
Daly, A.E., Allen, B., Aufflick, L., Bosworth, E. and Caruso, M. (1993), ‘Determining the labour force status of Aboriginal people using a multinomial logit model, CAEPR Discussion Paper No. 44, Available online at http://www.anu.edu.au/caepr/.
Dockery, A. M. (2009a), ‘Culture and wellbeing: The case of Indigenous Australians’, discussion paper 09/1, Centre for Labour Market Research, Perth.
Dockery, A.M. (2009b), Cultural dimensions of Indigenous participation in education and training, National Centre for Vocational Education Research, Monograph No. Series 2
Gordon, D. (1972), Theories of poverty and underemployment: orthodox, radical, and dual labor market perspectives. Lexington Massachusetts: Health, Lexington Books.
Gray, M.C. and Chapman, B. (2006), ‘Labour market issues’ in Hunter, B.H. (ed.) Assessing recent evidence on Indigenous socioeconomic outcomes: a focus on the 2002 NATSISS, CAEPR Research Monograph No. 26, Canberra, ACT. Available online at http://epress.anu.edu.au/c26_citation.html.
Gray, M.C. and Hunter, B.H. (2005), ‘The labour market dynamics of Indigenous Australians’, Journal of Sociology, 41(4): 389–408.
Gray, M.C. and Hunter, B.H. (1999), 'Determinants of labour force status for Indigenous and non-Indigenous Australians, 1986-96’ CAEPR Discussion Paper No. 186. Available online at http://www.anu.edu.au/caepr/.
Grossman, M. (1972), 'On the concept of human capital and the demand for health', Journal of Political Economy, 80(2): 223-55.
Hill, M. (1979), ‘The wage effects of marital status and children’, Journal of Human Resources, 9(4): 579–593.
Hudson, S. (2008), ‘CDEP help or hindrance? The Community Development Employment Program and its impact on Indigenous Australians’, Centre for Independent Studies, Policy Monograph No. 86. Available online at http://www.cis.org.au/policy_monographs/pm86.pdf.
Hughes, H. (2007), Lands of shame: Aboriginal and Torres Strait Islander “homelands” in transition, Sydney: Centre for Independent Studies.
Hunter, B.H. (1997), ‘The determinants of Indigenous employment outcomes: the importance of education and training’, Australian Bulletin of Labour, 23(3): 177–192.
Hunter, B.H. (2002a), ‘The rise of the CDEP scheme and changing factors underlying Indigenous employment’, CAEPR Working Paper No. 13, Available online at http://www.anu.edu.au/caepr/.
Hunter, B.H. (2002b), ‘Some inter-relationships between the CDEP scheme and Indigenous labour supply’, CAEPR Working Paper No. 14. Available online at http://www.anu.edu.au/caepr/.
Hunter, B.H. (2004), Indigenous Australians in the contemporary labour market, ABS cat. No. 2052.0, ABS, Canberra, ACT.
Hunter, B. H. (2007), ‘Arguing over the [remote] control: Why Indigenous policy needs to be based on evidence and not hyperbole,’ Economic Papers, 26(1): 44–63.
Hunter, B.H. (2009), ‘A half-hearted defence of the CDEP scheme,’ Family Matters, Issue. 81: 43-54.
Hunter, B.H. and Borland, J. (1997), ‘The interrelationships between arrest and employment: more evidence on the social determinants of Indigenous employment’, CAEPR Discussion Paper No. 136, Available online at http://www.anu.edu.au/caepr/.
Hunter, B.H. and Daly, A.E. (2008), ‘Interactions between crime and fertility in the labour supply of Indigenous Australian women’ CAEPR Working Paper, No. 40. Available online at http://www.anu.edu.au/caepr/.

36
Hunter, B.H. and Gray, M.C. (1999), 'Further Investigations into Indigenous labour supply: what discourages discouraged workers?', CAEPR Working Paper No. 2. Available online at http://www.anu.edu.au/caepr/.
Hunter, B.H. and Gray, M.C. (2001), ‘Indigenous labour force status re-visited: Factors associated with the discouraged worker phenomenon’, Australian Journal of Labour Economics, 4(2): 115–37.
Hunter, B.H. and Gray, M.C. (2002), ‘Family and social factors underlying the labour force status of Indigenous Australians’, Family Matters, Issue. 62: 18–25.
Jones, F.L. (1991), ‘Economic status of Aboriginal and other Australians: a comparison’ in Altman, J.C. (ed.) Aboriginal Employment Equity by the Year 2000, CAEPR Research Monograph No. 2, Canberra, ACT. Available online at http://www.anu.edu.au/caepr/.
Killingsworth, M. (1983), Labor Supply, Cambridge: Cambridge University Press. MacDonald, Z. and Shields, M.A. (2004), ‘Does problem drinking affect employment?
Evidence from England’ Health Economics, 13(2): 139–155. Miller, P.W. (1989), ‘The structure of Aboriginal and non-Aboriginal youth unemployment’,
Australian Economic Papers, 28(5): 39–56. Miller, P.W. (1991), ‘Aboriginal youth unemployment’ in Altman, J.C. (ed.) Aboriginal
Employment Equity by the Year 2000, CAEPR Research Monograph No. 2, Canberra, ACT. Available online at http://www.anu.edu.au/caepr/.
Miller, P.W. (1997), ‘The burden of unemployment in family units: an overview', The Australian Economic Review, 30(1): 16-30.
Miller, P.W. and Volker, P. (1987). ‘The youth labour market in Australia', Economic Record, 63(182): 203-19.
Pearson, N. (2008), ‘Five Steps to get them off welfare’, The Australian, Aug, 09. Accessed online on August 2009. Available online at
Riley, J.B. (1994), 'Demographic implications of aboriginal out marriage', Journal of the Australian Population Association, 11(1): 149-59.
Ross, K. (1999), Occasional Paper: Population measurement Issues, Aboriginal and Torres Strait Islander Australians, cat. no. 4708.0, Australian Bureau of Statistics, Canberra.
Ross, R. (2006a), 'Recent evidence on health and employment status for Indigenous Australia', Australian Journal of Labour Economics, 9(1): 65‐81.
Ross, R. (2006b), ‘Health’ in Hunter, B.H. (ed.) Assessing Recent Evidence on Indigenous Socioeconomic Outcomes: A focus on the 2002 NATSISS, CAEPR Research Monograph No. 2, Canberra, ACT. Available online at http://epress.anu.edu.au/c26_citation.html.
Steering Committee for the Review of Government Service Provision (SCRGSP) (2009), Overcoming indigenous disadvantage: key indicators 2009, Productivity Commission Canberra, ACT, http://www.pc.gov.au/gsp/reports/Indigenous/key indicators2007/ keyindicators2009.pdf.
Sibthorpe, B., Anderson, I. and Cunningham, J. (2001), ‘Self-assessed health among Indigenous Australians: How valid is a global question?’ American Journal of Public Health, 91(10): 1660–3.
Smith, S. (2003), Labour Economics, 2nd ed. London: Routledge. Sullivan, M.A., and Covey, L.S., (2002), ‘Current perspectives on smoking cessation among
substance abusers’. Curr. Psych. Rep. 4, 388–396. Taylor. J. (2008), ‘Indigenous Labour Supply Constraints in the West Kimberley’, CAEPR
Working Paper No. 39, Available online at http://www.anu.edu.au/caepr/Publications/WP/CAEPRWP39.pdf.
Terza, J.V. (2002), ‘Alcohol Abuse and Employment: A Second Look’, Journal of Applied Econometrics, 17 (4): 393–404.
Tiplady. T and Braclay. A (2007), Indigenous employment in the Australian minerals industry, The Centre for Social Responsibility in Mining, University of Queensland, Brisbane, Qld http://www.csrm.uq.edu.au/docs/CSRM%20Report_FINAL%20TO%20 PRINT_singles.pdf

37
Appendix A. Description and Descriptive Statistics, Explanatory Variables
Table A.1 Description of explanatory variables for LFS and earnings models
Variable Description (all variables are dichotomous)
Geography
Major cities omitted category, residence in a major cities
Inner regional resident of inner regional area
Outer regional resident of outer regional area
Remote resident of remote or very remote area
Age
Age 15-24 omitted category, for those aged 15 to 24
Age 25-34 those aged 25 to 34 years
Age 35-44 those aged 35 to 44 years
Age 45-54 those aged 45 to 54 years
Age 55-64 those aged 55 to 64 years
Family
Unmarried omitted category, for social marital status of unmarried
Married for a social marital status of married
No dependants omitted category, for those no dependants
One dependant for those with one dependant
Two or three dependants for those with two or three dependants
Four or more dependants for those with four or more dependants
Education
≤year 9 highest educational attainment year 9 or lower
Year 10 omitted category, highest educational attainment year 10 Year 11 highest educational attainment year 11
Year 12 highest educational attainment year 12
Certificate highest educational attainment a certificate Degree or diploma highest educational attainment a diploma, degree or higher
No English difficulty omitted category, no difficulty in communicating in English English difficulty difficulty in communicating in English
Health
Non-smoker omitted category, does not smoke Smoker occasional or regular smoker
No disability omitted category, no disability reported
Disability reported a disability
excellent/very good SAHS omitted category, reported ‘excellent’ or ‘very good’ SAHS Good SAHS reported ‘good’ SAHS
Fair SAHS reported ‘good’ SAHS
Poor SAHS reported ‘good’ SAHS
No alcohol reported no alcohol consumption in the last two weeks
Low/ medium alcohol omitted category, ‘low’ or ‘medium’ risk alcohol consumption in the last two weeks
High alcohol reported ‘high’ risk alcohol consumption in the last two weeks
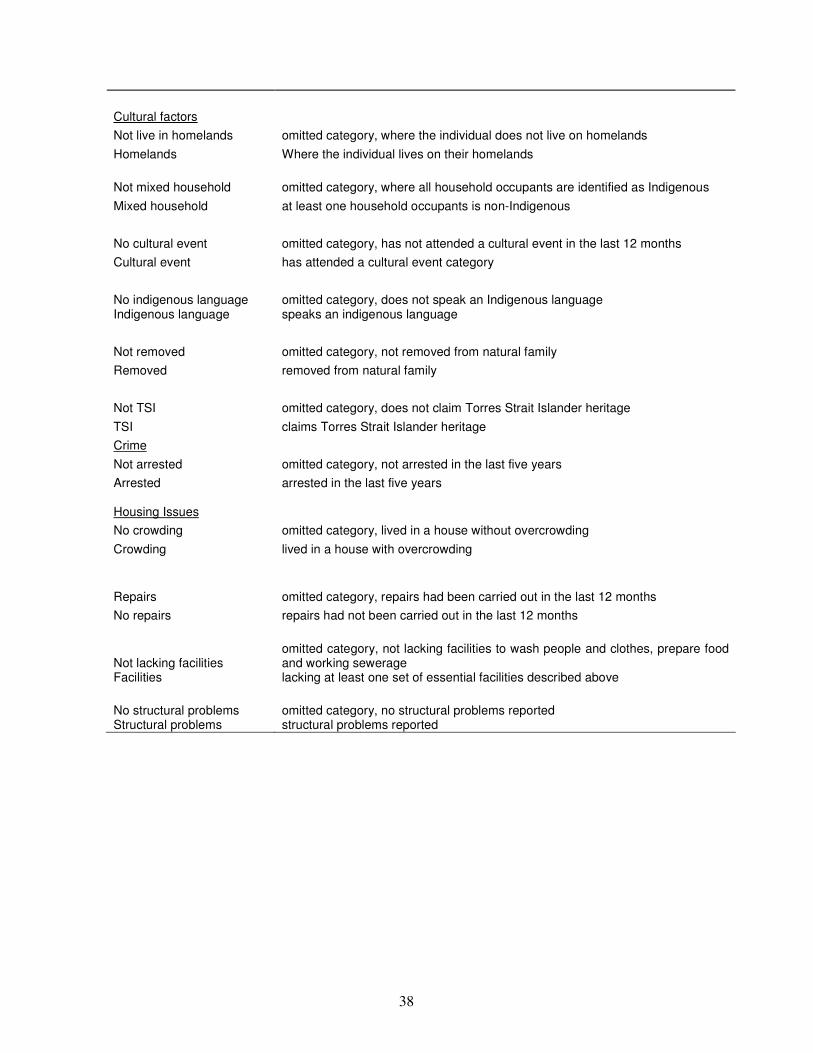
38
Cultural factors
Not live in homelands omitted category, where the individual does not live on homelands
Homelands Where the individual lives on their homelands
Not mixed household omitted category, where all household occupants are identified as Indigenous
Mixed household at least one household occupants is non-Indigenous
No cultural event omitted category, has not attended a cultural event in the last 12 months
Cultural event has attended a cultural event category
No indigenous language omitted category, does not speak an Indigenous language Indigenous language speaks an indigenous language
Not removed omitted category, not removed from natural family
Removed removed from natural family
Not TSI omitted category, does not claim Torres Strait Islander heritage
TSI claims Torres Strait Islander heritage
Crime
Not arrested omitted category, not arrested in the last five years
Arrested arrested in the last five years Housing Issues
No crowding omitted category, lived in a house without overcrowding
Crowding lived in a house with overcrowding
Repairs omitted category, repairs had been carried out in the last 12 months
No repairs repairs had not been carried out in the last 12 months
Not lacking facilities omitted category, not lacking facilities to wash people and clothes, prepare food and working sewerage
Facilities lacking at least one set of essential facilities described above
No structural problems omitted category, no structural problems reported Structural problems structural problems reported

39
Table A.2 Descriptive statistics for explanatory variables in the LFS model, Males
All regions Non-remote Remote Variable Mean Std Dev Mean Std Dev Mean Std Dev Geography Major cities 0.298 0.457 0.415 0.493 Inner regional 0.201 0.401 0.280 0.449 -- -- Outer regional 0.219 0.414 0.305 0.461 -- -- Remote 0.281 0.450 -- -- -- -- Age Age 15-24 0.246 0.430 0.236 0.425 0.270 0.444 Age 25-34 0.283 0.451 0.284 0.451 0.282 0.450 Age 35-44 0.232 0.422 0.238 0.426 0.215 0.411 Age 45-54 0.162 0.369 0.165 0.371 0.156 0.363 Age 55-64 0.077 0.267 0.077 0.266 0.078 0.268 Family Unmarried 0.451 0.498 0.462 0.499 0.425 0.495 Married 0.549 0.498 0.538 0.499 0.575 0.495 No dependants 0.415 0.493 0.462 0.499 0.294 0.456 One dependant 0.155 0.362 0.170 0.376 0.116 0.321 Two or three dependants 0.284 0.451 0.276 0.447 0.307 0.461 Four or more dependants 0.146 0.353 0.092 0.289 0.283 0.450 Education No English difficulty 0.874 0.332 0.900 0.300 0.807 0.395 English difficulty 0.126 0.332 0.100 0.300 0.193 0.395 ≤year 9 0.348 0.476 0.318 0.466 0.425 0.495 Year 10 0.239 0.427 0.231 0.422 0.260 0.439
Year 11 0.075 0.263 0.071 0.257 0.084 0.277 Year 12 0.125 0.330 0.129 0.335 0.113 0.316 Certificate 0.167 0.373 0.192 0.394 0.103 0.305 Degree or diploma 0.047 0.211 0.059 0.236 0.015 0.123 Health Non-smoker 0.425 0.494 0.448 0.497 0.365 0.482 Smoker 0.575 0.494 0.552 0.497 0.635 0.482 No disability 0.636 0.481 0.622 0.485 0.673 0.469 Disability 0.364 0.481 0.378 0.485 0.327 0.469 excellent/very good SAHS 0.463 0.499 0.462 0.499 0.466 0.499 Good SAHS 0.300 0.458 0.286 0.452 0.336 0.472 Fair SAHS 0.174 0.379 0.188 0.391 0.138 0.345 Poor SAHS 0.063 0.242 0.064 0.244 0.060 0.238 No alcohol 0.386 0.487 0.338 0.473 0.508 0.500 Low/ medium alcohol 0.297 0.457 0.354 0.478 0.152 0.359 High alcohol 0.317 0.465 0.307 0.462 0.340 0.474 Cultural factors Not mixed household 0.756 0.429 0.813 0.390 0.610 0.488 Mixed household 0.244 0.429 0.187 0.390 0.390 0.488 Not mixed household 0.615 0.487 0.499 0.500 0.911 0.285 Mixed household 0.385 0.487 0.501 0.500 0.089 0.285 No cultural event 0.361 0.480 0.451 0.498 0.133 0.339 Cultural event 0.639 0.480 0.549 0.498 0.867 0.339 No indigenous language 0.783 0.412 0.905 0.294 0.471 0.499 Indigenous language 0.217 0.412 0.095 0.294 0.529 0.499
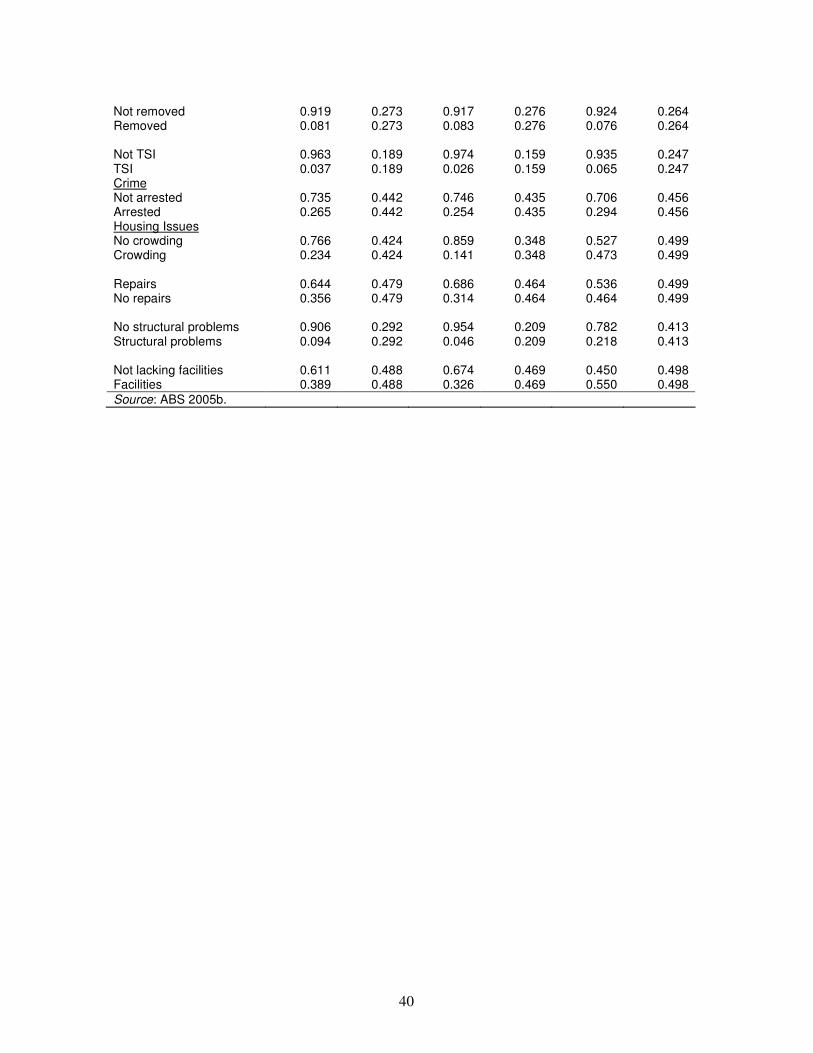
40
Not removed 0.919 0.273 0.917 0.276 0.924 0.264 Removed 0.081 0.273 0.083 0.276 0.076 0.264 Not TSI 0.963 0.189 0.974 0.159 0.935 0.247 TSI 0.037 0.189 0.026 0.159 0.065 0.247 Crime Not arrested 0.735 0.442 0.746 0.435 0.706 0.456 Arrested 0.265 0.442 0.254 0.435 0.294 0.456 Housing Issues No crowding 0.766 0.424 0.859 0.348 0.527 0.499 Crowding 0.234 0.424 0.141 0.348 0.473 0.499 Repairs 0.644 0.479 0.686 0.464 0.536 0.499 No repairs 0.356 0.479 0.314 0.464 0.464 0.499 No structural problems 0.906 0.292 0.954 0.209 0.782 0.413 Structural problems 0.094 0.292 0.046 0.209 0.218 0.413 Not lacking facilities 0.611 0.488 0.674 0.469 0.450 0.498 Facilities 0.389 0.488 0.326 0.469 0.550 0.498
Source: ABS 2005b.

41
Table A.3 Descriptive statistics for explanatory variables in the LFS model, Females
All regions Non-remote Remote Variable Mean Std Dev Mean Std Dev Mean Std Dev
Geography Major cities 0.314 0.464 0.432 0.495 -- -- Inner regional 0.187 0.390 0.256 0.437 -- -- Outer regional 0.227 0.419 0.312 0.463 -- -- Remote 0.272 0.445 -- -- -- -- Age Age 15-24 0.232 0.422 0.222 0.416 0.257 0.437 Age 25-34 0.294 0.456 0.296 0.457 0.289 0.454 Age 35-44 0.234 0.423 0.236 0.425 0.227 0.419 Age 45-54 0.158 0.364 0.246 0.431 0.147 0.355 Age 55-64 0.083 0.276 -- -- 0.079 0.270 Family Unmarried 0.518 0.500 0.547 0.498 0.440 0.497 Married 0.482 0.500 0.453 0.498 0.560 0.497
No dependants 0.221 0.456 0.231 0.471 0.193 0.391 One dependant 0.195 0.396 0.218 0.413 0.132 0.339 Two or three dependants 0.344 0.475 0.330 0.470 0.380 0.486 Four or more dependants 0.169 0.375 0.121 0.326 0.299 0.458 Education
≤year 9 0.307 0.461 0.263 0.440 0.425 0.494 Year 10 0.277 0.439 0.287 0.452 0.250 0.433
Year 11 0.106 0.307 0.106 0.308 0.103 0.304 Year 12 0.130 0.336 0.138 0.345 0.107 0.309 Certificate 0.102 0.303 0.118 0.322 0.061 0.240
Degree or diploma 0.078 0.269 0.088 0.283 0.054 0.226
No English difficulty 0.866 0.341 0.895 0.307 0.789 0.408 English difficulty 0.134 0.341 0.105 0.307 0.211 0.408 Health
Non-smoker 0.460 0.498 0.457 0.498 0.471 0.499 Smoker 0.540 0.498 0.543 0.498 0.529 0.499 No disability 0.641 0.480 0.643 0.479 0.638 0.481 Disability 0.359 0.480 0.357 0.479 0.362 0.481 excellent/very good SAHS 0.405 0.499 0.397 0.489 0.427 0.495 Good SAHS 0.358 0.479 0.347 0.476 0.387 0.487 Fair SAHS 0.169 0.375 0.183 0.386 0.132 0.339 Poor SAHS 0.068 0.252 0.074 0.262 0.053 0.225 No alcohol 0.595 0.491 0.563 0.496 0.680 0.467 Low/ medium alcohol 0.199 0.359 0.233 0.423 0.108 0.310 High alcohol 0.206 0.404 0.203 0.403 0.213 0.409 Cultural factors
Not live in homelands 0.795 0.403 0.855 0.353 0.637 0.481 Homelands 0.205 0.403 0.145 0.353 0.363 0.481 Not mixed household 0.672 0.469 0.585 0.493 0.906 0.292 Mixed household 0.328 0.469 0.415 0.493 0.094 0.292 No cultural event 0.287 0.452 0.348 0.476 0.124 0.329 Cultural event 0.713 0.452 0.652 0.476 0.876 0.329

42
No indigenous language 0.795 0.404 0.916 0.278 0.472 0.499 Indigenous language 0.205 0.404 0.084 0.278 0.528 0.499 Not removed 0.907 0.290 0.890 0.312 0.952 0.214 Removed 0.093 0.290 0.110 0.312 0.048 0.214 Not TSI 0.968 0.175 -- -- 0.950 0.218 TSI 0.032 0.175 -- -- 0.050 0.218 Crime
Not arrested 0.894 0.308 0.887 0.317 0.915 0.279 Arrested 0.106 0.308 0.113 0.317 0.085 0.279 Housing Issues
No crowding 0.739 0.439 0.834 0.372 0.485 0.500 Crowding 0.261 0.439 0.166 0.372 0.515 0.500 Repairs 0.660 0.474 0.698 0.459 0.558 0.497 No repairs 0.340 0.474 0.302 0.459 0.442 0.497 No structural problems 0.913 0.282 0.967 0.179 0.768 0.422 Structural problems 0.087 0.282 0.033 0.179 0.232 0.422 Not lacking facilities 0.592 0.491 0.667 0.471 0.393 0.489 Facilities 0.408 0.491 0.333 0.471 0.607 0.489
Source: ABS 2005b.
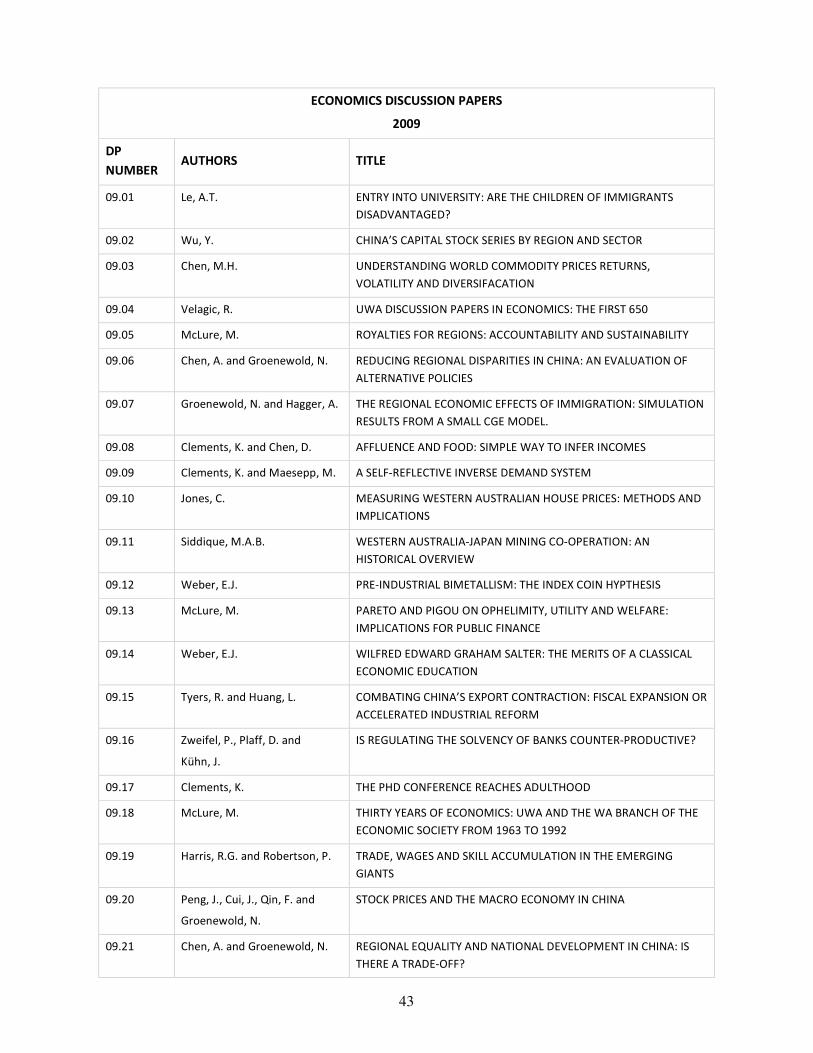
43
ECONOMICS DISCUSSION PAPERS
2009
DP
NUMBER AUTHORS TITLE
09.01 Le, A.T. ENTRY INTO UNIVERSITY: ARE THE CHILDREN OF IMMIGRANTS
DISADVANTAGED?
09.02 Wu, Y. CHINA’S CAPITAL STOCK SERIES BY REGION AND SECTOR
09.03 Chen, M.H. UNDERSTANDING WORLD COMMODITY PRICES RETURNS,
VOLATILITY AND DIVERSIFACATION
09.04 Velagic, R. UWA DISCUSSION PAPERS IN ECONOMICS: THE FIRST 650
09.05 McLure, M. ROYALTIES FOR REGIONS: ACCOUNTABILITY AND SUSTAINABILITY
09.06 Chen, A. and Groenewold, N. REDUCING REGIONAL DISPARITIES IN CHINA: AN EVALUATION OF
ALTERNATIVE POLICIES
09.07 Groenewold, N. and Hagger, A. THE REGIONAL ECONOMIC EFFECTS OF IMMIGRATION: SIMULATION
RESULTS FROM A SMALL CGE MODEL.
09.08 Clements, K. and Chen, D. AFFLUENCE AND FOOD: SIMPLE WAY TO INFER INCOMES
09.09 Clements, K. and Maesepp, M. A SELF-REFLECTIVE INVERSE DEMAND SYSTEM
09.10 Jones, C. MEASURING WESTERN AUSTRALIAN HOUSE PRICES: METHODS AND
IMPLICATIONS
09.11 Siddique, M.A.B. WESTERN AUSTRALIA-JAPAN MINING CO-OPERATION: AN
HISTORICAL OVERVIEW
09.12 Weber, E.J. PRE-INDUSTRIAL BIMETALLISM: THE INDEX COIN HYPTHESIS
09.13 McLure, M. PARETO AND PIGOU ON OPHELIMITY, UTILITY AND WELFARE:
IMPLICATIONS FOR PUBLIC FINANCE
09.14 Weber, E.J. WILFRED EDWARD GRAHAM SALTER: THE MERITS OF A CLASSICAL
ECONOMIC EDUCATION
09.15 Tyers, R. and Huang, L. COMBATING CHINA’S EXPORT CONTRACTION: FISCAL EXPANSION OR
ACCELERATED INDUSTRIAL REFORM
09.16 Zweifel, P., Plaff, D. and
Kühn, J.
IS REGULATING THE SOLVENCY OF BANKS COUNTER-PRODUCTIVE?
09.17 Clements, K. THE PHD CONFERENCE REACHES ADULTHOOD
09.18 McLure, M. THIRTY YEARS OF ECONOMICS: UWA AND THE WA BRANCH OF THE
ECONOMIC SOCIETY FROM 1963 TO 1992
09.19 Harris, R.G. and Robertson, P. TRADE, WAGES AND SKILL ACCUMULATION IN THE EMERGING
GIANTS
09.20 Peng, J., Cui, J., Qin, F. and
Groenewold, N.
STOCK PRICES AND THE MACRO ECONOMY IN CHINA
09.21 Chen, A. and Groenewold, N. REGIONAL EQUALITY AND NATIONAL DEVELOPMENT IN CHINA: IS
THERE A TRADE-OFF?

44
ECONOMICS DISCUSSION PAPERS
2010
DP
NUMBER AUTHORS TITLE
10.01 Hendry, D.F. RESEARCH AND THE ACADEMIC: A TALE OF TWO CULTURES
10.02 McLure, M., Turkington, D. and
Weber, E.J.
A CONVERSATION WITH ARNOLD ZELLNER
10.03 Butler, D.J., Burbank, V.K. and
Chisholm, J.S.
THE FRAMES BEHIND THE GAMES: PLAYER’S PERCEPTIONS
OF PRISONER’S DILEMMA, CHICKEN, DICTATOR, AND
ULTIMATUM GAMES
10.04 Harris, R.G., Robertson, P.E. and
Xu, J.Y.
THE INTERNATIONAL EFFECTS OF CHINA’S GROWTH, TRADE
AND EDUCATION BOOMS
10.05 Clements, K.W., Mongey, S. and Si, J. THE DYNAMICS OF NEW RESOURCE PROJECTS A PROGRESS
REPORT
10.06 Costello, G., Fraser, P., Groenewold, N. HOUSE PRICES, NON-FUNDAMENTAL COMPONENTS AND
INTERSTATE SPILLOVERS: THE AUSTRALIAN EXPERIENCE
10.07 Clements, K.
REPORT OF THE 2009 PHD CONFERENCE IN ECONOMICS AND
BUSINESS
10.08 Robertson, P.E. INVESTMENT LED GROWTH IN INDIA: HINDU FACT OR
MYTHOLOGY?
10.09 Fu, D., Wu, Y., Tang, Y. THE EFFECTS OF OWNERSHIP STRUCTURE AND INDUSTRY
CHARACTERISTICS ON EXPORT PERFORMANCE
10.10 Wu, Y. INNOVATION AND ECONOMIC GROWTH IN CHINA
10.11 Stephens, B.J. THE DETERMINANTS OF LABOUR FORCE STATUS AMONG
INDIGENOUS AUSTRALIANS
Related Documents