1 23 Environmental Monitoring and Assessment An International Journal Devoted to Progress in the Use of Monitoring Data in Assessing Environmental Risks to Man and the Environment ISSN 0167-6369 Environ Monit Assess DOI 10.1007/s10661-013-3348-3 Assessment of land cover changes & water quality changes in the Zayandehroud River Basin between 1997–2008 Fatemeh Bateni, Sima Fakheran & Alireza Soffianian

Welcome message from author
This document is posted to help you gain knowledge. Please leave a comment to let me know what you think about it! Share it to your friends and learn new things together.
Transcript
1 23
Environmental Monitoring andAssessmentAn International Journal Devoted toProgress in the Use of Monitoring Datain Assessing Environmental Risks toMan and the Environment ISSN 0167-6369 Environ Monit AssessDOI 10.1007/s10661-013-3348-3
Assessment of land cover changes & waterquality changes in the Zayandehroud RiverBasin between 1997–2008
Fatemeh Bateni, Sima Fakheran &Alireza Soffianian
1 23
Your article is protected by copyright and all
rights are held exclusively by Springer Science
+Business Media Dordrecht. This e-offprint
is for personal use only and shall not be self-
archived in electronic repositories. If you wish
to self-archive your article, please use the
accepted manuscript version for posting on
your own website. You may further deposit
the accepted manuscript version in any
repository, provided it is only made publicly
available 12 months after official publication
or later and provided acknowledgement is
given to the original source of publication
and a link is inserted to the published article
on Springer's website. The link must be
accompanied by the following text: "The final
publication is available at link.springer.com”.
Assessment of land cover changes & water quality changesin the Zayandehroud River Basin between 1997–2008
Fatemeh Bateni & Sima Fakheran & Alireza Soffianian
Received: 20 December 2012 /Accepted: 10 July 2013# Springer Science+Business Media Dordrecht 2013
Abstract Water quality of rivers is strongly influencedby landscape characteristics of their watershed, includ-ing land use /cover types, and their spatial configura-tion. This research evaluates the effects of land coverchanges on the water quality of the ZayandehroudRiver, which is the most important river in the centerof Iran. The main goal of this study was to quantify thechange in rangelands, forests, and bare lands in theZayandehroud river basin, which suffered intense hu-man interference, in a period of 11 years (1997–2008),and to evaluate how landscape patterns (including thenumber of patches, edge density, percentage ofrangelands, forests, and bare lands) influence on the14 water quality indices (including BOD5, EC, NO3,P, and TDS) measured in 10 stations along the river.Results showed that from 1997 to 2008, bare landsincreased from 5.8 to 20 %, while rangelands de-creased from 70 to 55 % in the whole basin. The resultsindicated that water quality was significantly correlat-ed with both the proportions and configuration ofrangeland and bare land areas. The total edge (TE) ofrangeland area had positive effects on water quality,especially on BOD5 and EC. Percentage of landscape(PLAND) and largest patch index (LPI) metrics ofrangeland had positive effect on decreasing nutrient
(NO3, PO4). The results showed that water qualitywas more likely degraded when there was high edgedensity (ED) of bare lands. Results of this study alsorevealed that degradation of rangeland lead to the deg-radation of water quality. Finding of this study high-lights the importance of rangeland conservation inwater quality management at landscape scale.
Keywords Land cover change . Rangeland . Bareland . Landscape metrics .Water quality . ZayandehRoud Basin
Introduction
The quality of water in many regions of the world isthreatened by overuse, misuse, and pollution, and it isincreasingly recognized that water quality of rivers,streams, and wetlands is strongly influenced by humanactions at landscape scale (Allan 2004; Strayer et al.2003; Wu and Hobbs 2002). The global transition fromundisturbed to human-dominated landscapes has im-pacted ecosystems worldwide and directly or indirectlyhas influences on many hydrological processes(Changnon and Demissie 1996; Tong and Chen 2002;Smith et al. 2003; Allan 2004). One of the major directenvironmental impacts of development and landuse/cover change is the degradation of water resourcesand water quality (USEPA 2001). Therefore, quantifi-cation of land use/land cover change is a valuableindicator of the state of the ecosystems (Meyer andTurner 1994), and the relationship between land
Environ Monit AssessDOI 10.1007/s10661-013-3348-3
For more information about the river Zayandehroud River, visithttp://en.wikipedia.org/wiki/Zayanderud
F. Bateni (*) : S. Fakheran :A. SoffianianDepartment of Natural Resources,Isfahan University of Technology,Isfahan 84156-83111, Irane-mail: [email protected]
Author's personal copy

use/cover and water quality is one of the most importantissues of today’s hydrological research (Yuan 2008).
It is increasingly recognized that water quality ofrivers, streams, and wetlands is strongly influenced bylandscape characteristics of the watersheds includinglandscape composition (i.e., land use/land cover typesand their fractions) in uplands and the spatial configu-ration of these land use/land cover types. Many studieshave shown that composition and spatial arrangement oflandscapes within watersheds can account for the vari-ability of water quality parameters and their concentra-tion in streams (Lenat and Crawford 1994; Johnson et al.1997; Basnyat et al. 2000; Tong and Chen 2002; Cretazand Barten 2007; Lee et al. 2009; Alberti et al. 2007).Most of these studies conclude that agricultural land usestrongly influence stream water nitrogen (Howarth et al.2000), phosphorus (Hill 1981), and sediments (Johnsonet al. 1997).
Using landscape metrics for quantitative analy-sis of landscape pattern structure and its changehave been widely adopted by landscape ecologyresearchers. Reviewed studies have demonstratedthat land use and land cover have a strong impacton water quality, and significant correlations existbetween water quality parameters and landscapecomposition (Sliva and Williams 2001; Mehaffeyet al. 2005; Amiri and Nakane 2008; Lee et al.2009; Tu 2011). The landscape pattern metricshave been used in related research projects forquantifying land use configuration, land use spatialpattern, and integration of the landscape patternand the hydro-geomorphic structure, while for theassessment of surface water quality, different indi-ces have been used including hydro-chemical ions(Schoonover et al. 2005), common water qualityvariables such as BOD5, COD, TDS, and nutrients(Cretaz and Barten 2007; Lee et al. 2009), heavymetals (Callender and Rice 2000), organic pollut-ants (Schoonover et al. 2005), sediment loads, andaquatic organisms (Iserendinoa et al. 2011).
Though there have been many studies linking landuse/cover and landscape configuration to water qualityof rivers, we know of none that has been done in theZayandehroud basin and other watersheds in Iran.Therefore, quantifying landscape pattern changes, itseffects on water quality, and further results oflandscape-scale studies in Iran are urgently required.Planners need to know about land cover change andtheir spatial patterns to analyze their relationships to
surface water pollutions. The main goal of this studywas to quantify the change in rangelands, forest, andbare land areas in the Zayandehroud river basin inIsfahan province, Iran, in a period of 11 years (1997–2008) and to evaluate how landscape patterns influenceon the Zayandehroud river water quality. Human ac-tivities such as urban development and intensificationof agriculture and residential area played an importantrole in the drastic change of rangeland and forest areasin recent decades, particularly in semi-arid areas inIran. The rapid increase of water demand and waterpollution due to population growth and industrial andagricultural development around Zayandehroud Riverhas caused the Zayanderoud water quality to severelydowngrade over the past decades. Therefore, monitor-ing of the Zayandehroud water quality is a criticalissue, especially due to the concern that freshwater isa scarce resource in this region of Iran. In this study, weexamined (1) what are the land cover changes in theZayandehroud basin between 1997 and 2008, (2)whether there is a significant relationship between landcover changes and surface water quality in theZayandehroud basin, (3) whether landscape metricsare good indicators for predicting impacts of landscapestructure on surface water quality, and (4) which of themetrics can be more accountable in predicting waterquality in the study area.
Material and methods
Study area
The Zayandehroud river is the most important river incentral Iran which stretches over a length of 400 km,originating from the Zardkouh Mountain and ending inthe Gavkhooni swamp after passing through the city ofIsfahan and runs in a roughly west–east direction.Isfahan metropolitan area is the second most populousmetropolitan area in Iran after Tehran. Urban expan-sion, population growth in addition to industrial devel-opment, has resulted in degrading environmental qual-ity in Isfahan (Murray et al. 2000).
The Zayandehroud river basin has an area of41,500 km2, with an altitude ranging from 1,466to 3,974 m above sea level, and an average rain-fall of 130 ml. There are 2,700 km2 of irrigatedland in the Zayandehroud river basin, with waterderived from the nine main hydraulic units of the
Environ Monit Assess
Author's personal copy

Zayandehroud river, wells, qanat and springs in lateralvalleys. Also, there have been a number of tunnel pro-jects (Koohrang) to redirect water from the Karun river(Iran’s largest river that also originates from the ZagrosMountains), to the Zayandeh Roud. The ZayandehRoud River flow regime depends not only on climaticconditions but also on the hydroelectric power genera-tion, as well as irrigation needs through the ChadeganDam (Murray et al. 2000; Salemi 2004). The mainsource of pollution in Zayandeh Roud River is agro-chemical materials from agricultural drains, and in termsof organic pollutants, phosphorus and heavy metalsfrom municipal and industrial sewages (Pour moghadaset al. 2001). The location of the study area is shown inFig. 1.
Data collection and preparation
Water quality data (including 14 water quality param-eters for 10 sampling stations along the Zayanderourriver in Ghaleshahrokh, Tanzimi Dam, Zamankhanbridge, Kalle bridge, Dizicheh, lenj, Mousiyan,Choum bridge, Ziyar bridge, and Varzaneh between1997 and 2008 were retrieved from the Isfahan region-al water authority and Department of Environment,Isfahan Provincial Directorate. Grab methods wereused for sampling of the river water. Various waterquality indices in these databases including electricalconductivity (in ms/cm at 25 1 C), biological oxygendemand (BOD5), NO3, P, total dissolved solid (TDS),chemical oxygen demand (COD), dissolved oxygen
Fig. 1 Location of Zayandehroud Basin in Iran
Environ Monit Assess
Author's personal copy
(DO), pH, Na, K, Ca, Cl, SO4, and HCO3 were selectedas water quality indicators for the analysis.
In order to determine land use/land cover for thestudy area, maps were prepared using hybrid classifica-tion of multi-temporal Landsat5 (ETM) images taken inSeptember 1997 and 2008. The five land use/land covertypes were determined including (1) water (2) bare land(covering fallow field and rock quarries, transition-al), (3) forest (covering forest, secondary forest,and planting forest), (4) range land, and (5)otherland uses. The accuracy of the results was evalu-ated by comparison with aerial photographs andground data through Kappa coefficient calculation(Jensen et al. 1997). The Kappa coefficient forestimating the accuracy was 87 %.
Sub basins delineation
Detection and quantification of non-point-source pollu-tions in a large basin such as Zayanderoud is challeng-ing. Therefore, the Zayanderoud basin was divided into10 distinct sub basins based on elevation and availablehydrographical data, using Arc-SWAT extension inArcGIS 9.3. Defining water and land use linkages,stream hydrology has been linked to land coverage. Acontinuous drainage network flow was created by ap-plying 30 m digital elevation data and each of the 10selected water sample sites, using the point coordinatesas the stream outlet (Royappan 2001; Rothenbergeret al. 2009).
Quantifying landscape pattern changes
Changes of landscape pattern can be detected and mea-sured by landscape metrics, specified as a measure, mod-el, or index, which can quantify and categorize complexlandscapes in to identifiable patterns (Gustafson 1998;Mehaffey et al. 2005). For quantifying landscape patternsor characteristics, many landscape metrics have beenproposed and utilized (McGarigal 1995). For this study,to quantify the landscape pattern changes in 1997–2008,we used proportion indices of four land use/land covertypes: range land, forest, bare land area, and water area.We chose six class level metrics including PLAND,number of patches (NP), LPI, ED, TE, and landscapeshape index (LSI), for quantifying the landscape patternin the study area in 1997 and 2008.
The two images of Landsat Thematic Mapper (TM)taken in 1997 and 2008 were used to investigate the
changes of landscape patterns. The images were classi-fied using the hybrid classification method. Spatial pat-tern analysis software FRAGSTATS 3.3 (McGarigal1995) was applied to calculate landscapemetrics of eachclass type and total landscape.
Statistical analysis
Pearson correlation test and regression analysis wasapplied to assess the relationship between landscapemetrics and water quality parameters. Statistical analyseswere conducted in R 2.7.12 (R Development Core Team2007; Olsen 2009). The normality of water quality andlandscape metrics data was examined in the initial phase.In some cases, log transformed data was applied tonormalize the distribution, and linearize the relationshipwith landscape metrics (Madansky 1988; Jones et al.2001). Pearson correlations were computed to assesspair-wise relations between water quality variables andlandscape variables (i.e., landscape metrics). Regressionanalyses were then performed. The log-transformed wa-ter quality indicators were treated as response (or depen-dent) variables, and the landscape metrics were used aspredictor (or independent) variables.
Results and discussion
Land cover change
Land-cover classification maps for 1997 and 2008 aredisplayed in Fig. 2, which demonstrates that the bare landexpansions had occurred in the study area from 1997 to2008. Bare lands increased from 5.8 to 20 %, whilerangelands decreased from 70 to 55 % in whole basin.
Range land has decreased in area (by 15 %); on theother hand, bare land has increased by 14.2 % (Table 1),which could be caused by recent drought in Iran.
The 10 sub basins, which have been set for the studyarea is shown by the name of their outlets (samplingsite stations). The largest sub basin was Varzaneh andthe smallest was Ziyar.
In particular, bare land expansion had occurred inVarzane (13.5 %), Choum (12.7 %), and Ziyar (12 %)sub basins. Bare land increases were traced to theconversion from rangeland. Zaman Khan (33.3 %)and Mousiyan Bridge (36.1 %) basins have shownthe most dramatic decrease in range land in the 11-year span (Table 2).
Environ Monit Assess
Author's personal copy
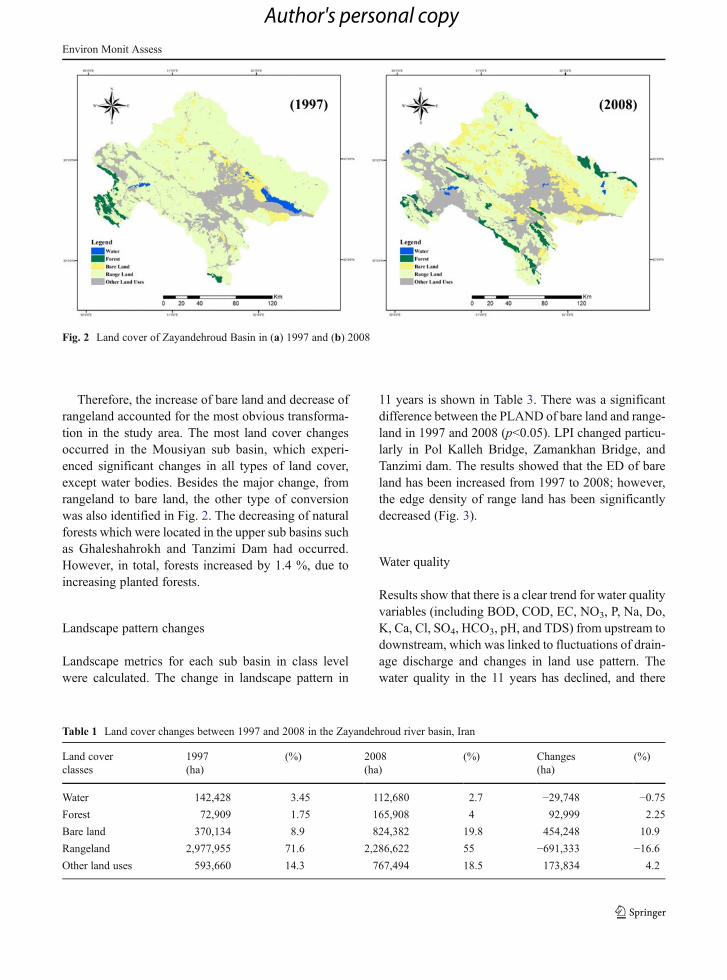
Therefore, the increase of bare land and decrease ofrangeland accounted for the most obvious transforma-tion in the study area. The most land cover changesoccurred in the Mousiyan sub basin, which experi-enced significant changes in all types of land cover,except water bodies. Besides the major change, fromrangeland to bare land, the other type of conversionwas also identified in Fig. 2. The decreasing of naturalforests which were located in the upper sub basins suchas Ghaleshahrokh and Tanzimi Dam had occurred.However, in total, forests increased by 1.4 %, due toincreasing planted forests.
Landscape pattern changes
Landscape metrics for each sub basin in class levelwere calculated. The change in landscape pattern in
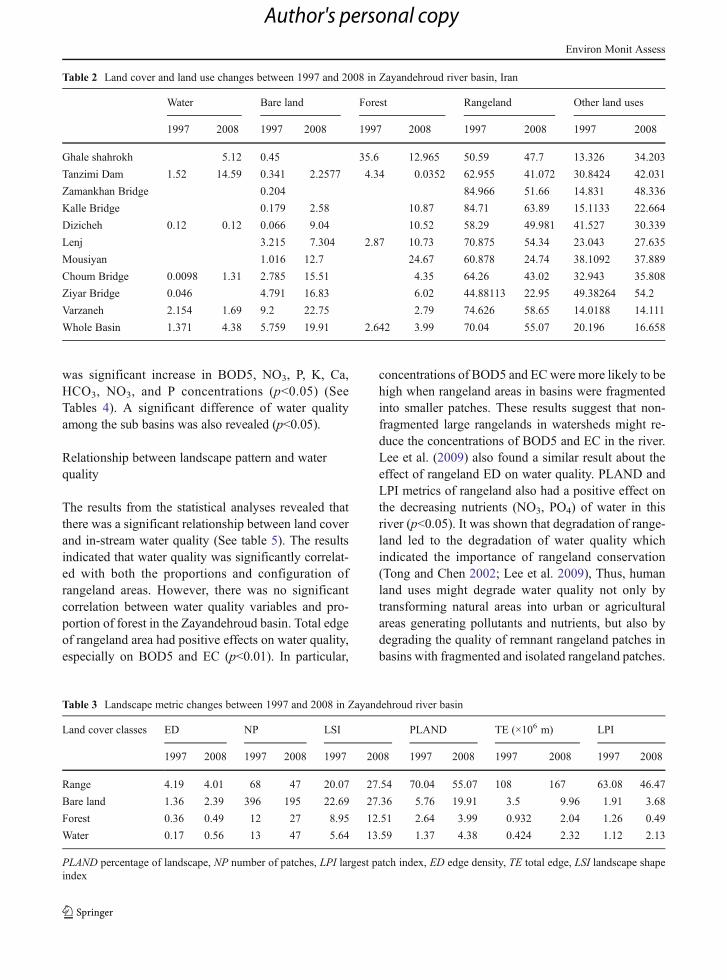
11 years is shown in Table 3. There was a significantdifference between the PLAND of bare land and range-land in 1997 and 2008 (p<0.05). LPI changed particu-larly in Pol Kalleh Bridge, Zamankhan Bridge, andTanzimi dam. The results showed that the ED of bareland has been increased from 1997 to 2008; however,the edge density of range land has been significantlydecreased (Fig. 3).
Water quality
Results show that there is a clear trend for water qualityvariables (including BOD, COD, EC, NO3, P, Na, Do,K, Ca, Cl, SO4, HCO3, pH, and TDS) from upstream todownstream, which was linked to fluctuations of drain-age discharge and changes in land use pattern. Thewater quality in the 11 years has declined, and there
Table 1 Land cover changes between 1997 and 2008 in the Zayandehroud river basin, Iran
Land coverclasses
1997 (%) 2008 (%) Changes (%)(ha) (ha) (ha)
Water 142,428 3.45 112,680 2.7 −29,748 −0.75Forest 72,909 1.75 165,908 4 92,999 2.25
Bare land 370,134 8.9 824,382 19.8 454,248 10.9
Rangeland 2,977,955 71.6 2,286,622 55 −691,333 −16.6Other land uses 593,660 14.3 767,494 18.5 173,834 4.2
Fig. 2 Land cover of Zayandehroud Basin in (a) 1997 and (b) 2008
Environ Monit Assess
Author's personal copy
was significant increase in BOD5, NO3, P, K, Ca,HCO3, NO3, and P concentrations (p<0.05) (SeeTables 4). A significant difference of water qualityamong the sub basins was also revealed (p<0.05).
Relationship between landscape pattern and waterquality
The results from the statistical analyses revealed thatthere was a significant relationship between land coverand in-stream water quality (See table 5). The resultsindicated that water quality was significantly correlat-ed with both the proportions and configuration ofrangeland areas. However, there was no significantcorrelation between water quality variables and pro-portion of forest in the Zayandehroud basin. Total edgeof rangeland area had positive effects on water quality,especially on BOD5 and EC (p<0.01). In particular,
concentrations of BOD5 and ECwere more likely to behigh when rangeland areas in basins were fragmentedinto smaller patches. These results suggest that non-fragmented large rangelands in watersheds might re-duce the concentrations of BOD5 and EC in the river.Lee et al. (2009) also found a similar result about theeffect of rangeland ED on water quality. PLAND andLPI metrics of rangeland also had a positive effect onthe decreasing nutrients (NO3, PO4) of water in thisriver (p<0.05). It was shown that degradation of range-land led to the degradation of water quality whichindicated the importance of rangeland conservation(Tong and Chen 2002; Lee et al. 2009), Thus, humanland uses might degrade water quality not only bytransforming natural areas into urban or agriculturalareas generating pollutants and nutrients, but also bydegrading the quality of remnant rangeland patches inbasins with fragmented and isolated rangeland patches.
Table 2 Land cover and land use changes between 1997 and 2008 in Zayandehroud river basin, Iran
Water Bare land Forest Rangeland Other land uses
1997 2008 1997 2008 1997 2008 1997 2008 1997 2008
Ghale shahrokh 5.12 0.45 35.6 12.965 50.59 47.7 13.326 34.203
Tanzimi Dam 1.52 14.59 0.341 2.2577 4.34 0.0352 62.955 41.072 30.8424 42.031
Zamankhan Bridge 0.204 84.966 51.66 14.831 48.336
Kalle Bridge 0.179 2.58 10.87 84.71 63.89 15.1133 22.664
Dizicheh 0.12 0.12 0.066 9.04 10.52 58.29 49.981 41.527 30.339
Lenj 3.215 7.304 2.87 10.73 70.875 54.34 23.043 27.635
Mousiyan 1.016 12.7 24.67 60.878 24.74 38.1092 37.889
Choum Bridge 0.0098 1.31 2.785 15.51 4.35 64.26 43.02 32.943 35.808
Ziyar Bridge 0.046 4.791 16.83 6.02 44.88113 22.95 49.38264 54.2
Varzaneh 2.154 1.69 9.2 22.75 2.79 74.626 58.65 14.0188 14.111
Whole Basin 1.371 4.38 5.759 19.91 2.642 3.99 70.04 55.07 20.196 16.658
Table 3 Landscape metric changes between 1997 and 2008 in Zayandehroud river basin
Land cover classes ED NP LSI PLAND TE (×106 m) LPI
1997 2008 1997 2008 1997 2008 1997 2008 1997 2008 1997 2008
Range 4.19 4.01 68 47 20.07 27.54 70.04 55.07 108 167 63.08 46.47
Bare land 1.36 2.39 396 195 22.69 27.36 5.76 19.91 3.5 9.96 1.91 3.68
Forest 0.36 0.49 12 27 8.95 12.51 2.64 3.99 0.932 2.04 1.26 0.49
Water 0.17 0.56 13 47 5.64 13.59 1.37 4.38 0.424 2.32 1.12 2.13
PLAND percentage of landscape, NP number of patches, LPI largest patch index, ED edge density, TE total edge, LSI landscape shapeindex
Environ Monit Assess
Author's personal copy
The results indicate that water quality ofZayandehroud River is closely associated with both theproportions of land cover and the configurations of bareland. Water quality is more likely to be degraded whenthere is high edge density of bare land. However, therewas no significant correlation between water qualityvariables and proportion of forest in the Zayandehroud
Fig. 3 Rangeland edge density (ED) in 1997 and 2008. Boldhorizontal lines indicate the median, boxes indicate theinterquartile range, and the whiskers indicate the maximum andminimum values
Table 4 Water quality changes between years 1997 and 2008 inthe Zayandeh Roud River in Isfahan, Iran
Changes(%)
Year Unit Water qualityindices
2008 1997
39.2 14.2 10.2 mg/L BOD
−15.6 5.4 6.4 mg/L Do
83.7 14.24 7.75 mg/L K
1.1 1.84 1.82 mg/L Cl
1000 0.77 0.07 mg/L P
755.7 11.98 1.4 mg/L NO3
15.9 74.8 86.7 mg/L so4
14.8 86.45 75.3 mg/L Ca
14.7 622.66 542.7 mg/L Na
11.4 190.77 171.2 mg/L HCO3
654.7 101257.9 13416 mg/L TDS
20.7 2.3 2.3 us/cm EC
−1.28 7.6 7.7 – pH
Tab
le5
Statisticalrelatio
nshipbetweenland
scapepattern
andwater
quality
inZayandehrou
driverbasinin
Isfahan,
Iran
BOD
COD
Na
Do
KCa
Cl
so4
HCO3
Ec
pHTDS
PNO3
Bareland-ED
.625**
.555*
.632**
−.915**
.634**
.604**
.570*
.512*
.802**
.503*
.716**
Bareland-LPI
−.687**
.565*
.227
.663**
.601**
.723**
Bareland-LSI
.915**
.925**
.947**
−.598**
.913**
.945**
.941**
.937**
.775**
.919**
Bareland-NP
.741**
.783**
.880**
.752**
.834**
.878**
.944**
.584*
.938**
.488*
Bareland-PLAND
.745**
.684**
.658**
−.859**
.769**
.692**
.629**
.555*
.815**
.500*
.631**
.921**
Bareland-TE
.952**
.984**
.962**
−.531*
.957**
.960**
.947**
.907**
.706**
.918**
.568*
Forest-NP
−.109
Range-ED
−.609**
−.571**
−.590**
.645**
−.610**
−.615**
−.600**
−.583**
−.693**
−.531*
−.535*
Range-LSI
.738**
.576**
.518*
.557*
.505*
.475*
.456*
.289
.496*
Range-N
P.541*
.332
Range-TE
.905**
.910**
.895**
−.354
.866**
.873**
.865**
.850**
.571**
.879**
Range-PLAND
−.465*
−.474*
−.482*
Water-N
P.871**
.909**
.825**
.881**
.846**
.806**
.727*
.753*
.863**
.781**
*Correlatio
nissign
ificantatthe0.05
level(2-tailed)
**Correlatio
nissign
ificantatthe0.01
level(2-tailed)
Environ Monit Assess
Author's personal copy
basin except the number of patches for forest land coverthat was negatively related to EC. It means that byincreasing the number of forest patches in sub basins,electrical conductivity has been decreased. The totaledge of rangeland area had positive effects on waterquality, especially on BOD5 and EC (p<0.01).
Conclusions
This study evaluated general land cover patterns, andenvironmental impacts of land cover change in theZayandehroud basin in 1997–2008. Many studies havereported that forest and vegetation cover like rangelandand forests play primary roles in protecting water qual-ity in adjacent aquatic systems (Tong and Chen 2002;White and Greer 2006; Lee et al. 2009). Results of thisstudy also revealed that the degradation of rangelandled to the degradation of water quality which highlight-ed the importance of rangeland conservation in waterquality management at landscape scale. However, asignificant relationship between forest areas and waterquality was not observed in this study because theZayanderoud basin is located in a semi-arid area ofIran, where forests are very limited and are only insmall patches with low density. Thus, in semi-aridareas like the Zayanderoud basin, rangeland conserva-tions play a more important role for the management ofwater quality.
This study indicates that landscape characteristicsare significantly correlated to stream water quality inthe Zayandehroud basin. Water quality parameters hadmore significant correlations with the edge density ofrangeland and also with PLAND of the bare lands inthe study area. Therefore, these landscape metrics arebetter indicators for monitoring and are more account-able in predicting water quality in this region.Therefore, in characterizing stream water quality usinglandscape metrics, the composition indices and spatialconfiguration indices are both important.
For management and restoration actions, reversal ofland use to a less-developed state is rarely practical soimprovement of the stream condition more often de-pends on the improvements in landscape managementand design.
Results of this study can be used in establishing andimplementing effective water management at land-scape scale, in this region. In addition, the informationon the hydrologic effects of land use can provide
guidelines, not only for resource managers in restoringthe aquatic ecosystem but also for policy makers inevaluating alternate land management decisions.
Acknowledgments We express our appreciation to the Isfahanregional water authority and the Department of Environment(DOE), Isfahan Provincial Directorate of Environmental Protec-tion for providing us with the water quality data and usefulinformation on the study area.
References
Alberti, M., Booth, D., Hill, K., Coburn, B., Avolio, C., Coe, S.,et al. (2007). The impact of urban patterns on aquaticecosystems: an empirical analysis on Puget lowland sub-basins. Landscape Urban Plan, 80(4), 345–361.
Allan, J. D. (2004). Landscapes and riverscapes: the influence ofland use on stream ecosystems. The Annual Review ofEcology, Evolution and Systematic, 35, 257–284.
Amiri, B. J., & Nakane. (2008). Entire catchment andbuffer zone approaches to modeling linkage betweenriver water quality and land cover —a case study ofYamaguchi prefecture, Japan. China GeographicalScience, 18(1), 085–092.
Basnyat, P., Teeter, L., Lockaby, B. G., & Flynn, K. M. (2000).Land use characteristics and water quality: a methodologyfor valuing forested buffers. Environmental Management,26, 153–161.
Callender, E., & Rice, K. C. (2000). The urban environmentalgradient: anthropogenic influences on the spatial and tem-poral distributions of lead and zinc in sediments.Environmental Science and Technology, 34, 232–238.
Changnon, S. A., & Demissie, M. (1996). Detection of changesin stream flow and floods resulting from climate fluctua-tions and land use drainage changes. Climate Change, 32,411–421.
Cretaz, A. L. & Barten, P. K. (2007). Land use effects onstreamflow and water quality in the northeastern UnitedStates, Florida and London: CRC Press-Taylor & FrancisGroup, Boca Raton, 319 pp.
Gustafson, E. J. (1998). Quantifying landscape spatial pattern:what is the state of the art. Ecosystems, 1(2), 143–156.
Hill, A. R. (1981). Stream phosphorus exports from watershedswith contrasting land uses in southern Ontario. WaterResource Bulletin, 17(4), 627–663.
Howarth, R., Donald, A., Cloern, J., Elfring, C., Hopkinson, C.,Lapointe, B., et al. (2000). Nutrient pollution of coastalrivers, bays, and seas. Issues in Ecology, 7, 1–17.
Iserendinoa, M., Casauxa, R., Archangelsky, A. M., Di Prinzio,A. C. Y., Brand, A. C., & Kutschker, A. M. (2011).Assessing land-use effects on water quality, in-stream hab-itat, riparian ecosystems and biodiversity in Patagoniannorthwest streams. Science of the Total Environment, 409,612–624.
Jensen, J. R., Cowen, D., Narumalani, S., & Halls, J.(1997). Principles of change detection using digitalremote sensor data. In Integration of Geographic
Environ Monit Assess
Author's personal copy

Information Systems and Remote Sensing. New York:Cambridge University.
Johnson, L. B., Richards, C., Host, G. E., & Arthur, J. W. (1997).Landscape influences on water chemistry on Midwesternstream ecosystems. Fresh Water Biological, 37, 193–208.
Jones, K. B., Neale, A. C., Nash, M. S., Van Remortel, R. D.,Wickham, J. D., Ritters, K. H., et al. (2001). Predictingnutrient and sediment loadings to streams from landscapemetrics: a multiple watershed study from the United States.Landscape Ecology, 16, 301–312.
Lee, S. W., Hwang, S., & Lee, S. B. (2009). Landscape ecolog-ical approach to the relationships of land use patterns inwatersheds to water quality characteristics. Landscape andUrban Planning, 92, 80–89.
Lenat, D. R., & Crawford, J. K. (1994). Effects of land use onwater quality and aquatic biota of three North Carolinapiedmont streams. Hydrobiologia, 294(3), 185–200.
Madansky, A. (1988). Prescriptions for working statisticians.New York: Springer.
McGarigal, K. (1995). Fragstats: spatial pattern analysis pro-gram for quantifying landscape structure. GeneralTechnical Report PNW-GTR-351. Portland: USDA ForestService, Pacific Northwest Research Station.
Mehaffey, M. H., Nash, M. S., Wade, T. G., Ebert, D. W., Jones,K. B., & Rager, A. (2005). Linking land cover and waterquality in New York City’s water supply water-sheds.Environmental Monitoring and Assessment, 107, 29–44.
Meyer, W. B., & Turner, B. L. (1994). Changes in land use andland cover: A global per-spective. New York: CambridgeUniv. 537 pp.
Murray-Rust, H., Sally, H., Salemi, H.R. and Mamanpoush, A.(2000). An overview of the hydrology of the Zayandeh RudBasin, Esfahan Province, Iran. IAERI-IWMI ResearchReports 3.
Olsen, A. R. (2009) Introduction to R Statistical Software, west-ern ecology division, corvalis (541) 754–4790.
Pour moghadas, H., Afsharzadeh, S., Saniei, M. (2001). Waterpollution and river algae: study in Zayandeh Rood River–Isfahan, Journal of Research in Medical Sciences, 6(2).
R Development Core Team, (2007). R: A Language andEnvironment for Statistical Computing. R Foundation forStatistical Computing, Vienna.
Rothenberger, M. B., Burkholder, J. M., & Brownie, C. (2009).Long-term effects of changing land use practices on surface
water quality in a coastal river and lagoonal estuary.Environmental Management, 44(3), 505–523.
Royappan,M. (2001), Survey of effect of change of land use to runoffby SWAT model in South Africa, Kentucky University, 482
Salemi, H. R. (2004). An overview of the hydrology of theZayandeh Rud Basin, Iran. Water and Wastewater (Isfahan),1(50), 2–13.
Schoonover, J., Graeme, E., Lockaby, B., & Shufen, P. (2005).Changes in chemical and physical properties of streamwater across an urban–rural gradient in western Georgia.Urban Ecosystems, 8, 107–124.
Sliva, L., & Williams, D. D. (2001). Buffer zone versus wholecatchment approaches to studying land use impact on riverwater quality. Water Resources, 34(14), 3462–3472.
Smith, S. V., Swaney, D. P., Talaue-Mcmanus, L., Bartley, J. D.,Sandhei, P. T., Mclaughlin, C. J., et al. (2003). Human,hydrology, and the distribution of inorganic nutrient loadingto the ocean. Bioscience, 53, 235–245.
Strayer, D. L., Beighley, R. E., Thompson, L. C., Brooks, S., &Nilsson, C. (2003). Effects of land cover on stream ecosys-tems: roles of empirical models and scaling issues.Ecosystems, 6, 407–423.
Tong, S. T., & Chen, Y. (2002). Modeling the relationshipbetween land use and surface water quality. Journal ofEnvironment Management, 66(4), 377–393.
Tu, J. (2011). Spatially varying relationships between land use andwater quality across an urbanization gradient explored bygeographically weighted regression. Applied Geography,31, 376–392.
USEPA, (2001). Our Built and Natural Environments: a techni-cal review of the interactions between land use, transporta-tion, and environ-mental quality 2001, pp. 49. http://www.smartgrowth.org/. Accessed 12 May 2012.
White, M. D., & Greer, K. A. (2006). The effects of watershedurbanization on the stream hydrology and riparian vegeta-tion of Los Peñasquitos Creek, California. LandscapeUrban Plan, 74(2), 125–138.
Wu, J., & Hobbs, R. (2002). Key issues and research priorities inlandscape ecology: an idiosyncratic synthesis. LandscapeEcology, 17, 355–365.
Yuan, F. (2008). Land-cover change and environmental impactanalysis in the Greater Mankato area of Minnesota usingremote sensing and GIS modeling. International Journal ofRemote Sensing, 29(4), 1169–1184.
Environ Monit Assess
Author's personal copy
Related Documents