1. Report No. FHWAlVA-93-R13 2. Accession No. Technical Report Documentation Page 3. Recipient's Catalog No. 4. Title and Subtitle Field Instrumentation and Measured Response of the 1-295 Cable-Stayed Bridge: Part 2-Field Study of Thermal Re- sponses Duemmel, Thomas T. Baber, Furman W. Barton, Wallace T. McKeel. Jr. 9. Performing Organization Name and Address Virginia Transportation Research Council Box 3817, University Station Charlottesville, Virginia 22903-0817 5. Report Date December 1992 6. Performing Organization Code 8. Performing Organization Report No. VTRC 93-R13 10. Won< Unit No. (TRAIS) HPR Research Study No. 68 11 . Contract or Grant No. 10------------------------------1 13. Type of Report and Period Covered 12. Sponsoring Agency Name and Address Final Report - Part B Virginia Department of Transportation 1401 E. Broad Street Richmond, Virginia 23219 15. Supplementary Notes None 16. Abstract 14. Sponsoring Agency Code This report describes the results of a field study of the thermal responses of a cable-stayed bridge. Data were gathered from the 1-295 James River Bridge, a precast segmental concrete bridge with a cable-stayed main span consisting of twin box girders connected by delta frames. The thermal gradient and associated thermal strains in the box girders and pylons were measured using an extensive array of thermocouples and strain-gaged reinforcing bars installed at selected locations in the main-span box girder and south pylon. The temperature and strain response data were compared with that predicted from detailed finite element models of the structure using both frame and plate elements. Comparison revealed a complex three-dimensional strain pattern dependent on the wind direction and the angle of solar incidence. Simplified beam element models were unable to predict many of the observed local variations in thermal strain, which are influenced by wind direction, solar heating direction, proximity to the web, and the existence of parapets monolithic with the deck. Three-dimensional finite element models appear to be more capable of predicting the kind of three-dimensional strains observed, but quantitative agreement with the observed thermal strains was limited at best. 17. Key Words Thermal tests, prestressed concrete, cable-stayed bridges, field testing. 18. Distribution Statement No restriction. This document is available to the public through the National Technical Information Service, Springfield, VA 22161. 19. Security Ctasif. (of this report) Unclassified Form DOT F 1700.7 (8-72) 20. Security Classif. (of this page) Unclassified Reproduction of completed page authorized 21. No. of Pages 22. Price 86

Welcome message from author
This document is posted to help you gain knowledge. Please leave a comment to let me know what you think about it! Share it to your friends and learn new things together.
Transcript

1. Report No.
FHWAlVA-93-R132. Governme~t Accession No.
Technical Report Documentation Page
3. Recipient's Catalog No.
4. Title and Subtitle
Field Instrumentation and Measured Response of the 1-295Cable-Stayed Bridge: Part 2-Field Study of Thermal Responses
7.1Y:~Ss. Duemmel, Thomas T. Baber, Furman W. Barton,Wallace T. McKeel. Jr.
9. Performing Organization Name and Address
Virginia Transportation Research CouncilBox 3817, University StationCharlottesville, Virginia 22903-0817
5. Report Date
December 19926. Performing Organization Code
8. Performing Organization Report No.
VTRC 93-R13
10. Won< Unit No. (TRAIS)
HPR Research Study No. 6811 . Contract or Grant No.
10------------------------------1 13. Type of Report and Period Covered12. Sponsoring Agency Name and Address
Final Report - Part BVirginia Department of Transportation1401 E. Broad StreetRichmond, Virginia 23219
15. Supplementary Notes
None
16. Abstract
14. Sponsoring Agency Code
This report describes the results of a field study of the thermal responses ofa cable-stayed bridge. Data were gathered from the 1-295 James River Bridge, aprecast segmental concrete bridge with a cable-stayed main span consisting of twinbox girders connected by delta frames.
The thermal gradient and associated thermal strains in the box girders andpylons were measured using an extensive array of thermocouples and strain-gagedreinforcing bars installed at selected locations in the main-span box girder andsouth pylon. The temperature and strain response data were compared with thatpredicted from detailed finite element models of the structure using both frame andplate elements. Comparison revealed a complex three-dimensional strain patterndependent on the wind direction and the angle of solar incidence. Simplified beamelement models were unable to predict many of the observed local variations inthermal strain, which are influenced by wind direction, solar heating direction,proximity to the web, and the existence of parapets monolithic with the deck.Three-dimensional finite element models appear to be more capable of predictingthe kind of three-dimensional strains observed, but quantitative agreement withthe observed thermal strains was limited at best.
17. Key Words
Thermal tests, prestressed concrete,cable-stayed bridges, field testing.
18. Distribution Statement
No restriction. This document is available tothe public through the National TechnicalInformation Service, Springfield, VA 22161.
19. Security Ctasif. (of this report)
Unclassified
Form DOT F 1700.7 (8-72)
20. Security Classif. (of this page)
Unclassified
Reproduction of completed page authorized
21. No. of Pages 22. Price
86

FINAL REPORT
FIELD INSTRUMENTATION AND MEASURED RESPONSEOF THE 1-295 CABLE-STAYED BRIDGE:
PART 2-FIELD STUDY OF THERMAL RESPONSES
Paul S. DuemmelGraduate Research Assistant
Thomas T. BaberFaculty Research Scientist
Furman W. BartonFaculty Research Scientist
Wallace T. McKeel, Jr.Research Manager
(The opinions, findings, and conclusions expressed in thisreport are those of the authors and not necessarily
those of the sponsoring agencies.)
Virginia Transportation Research Council(A Cooperative Organization Sponsored Jointly by the
Virginia Department of Transportation andthe University of Virginia)
In Cooperation with the U.S. Department of TransportationFederal Highway Administration
Charlottesville, Virginia
December 1992VTRC 93-R13

BRIDGE RESEARCH ADVISORY COMMITTEE
C. A. NASH, Chairman, Suffolk District Administrator, VDOT
W. T. MCKEEL, Executive Secretary, Senior Research Scientist, VTRC
G. W. BOYKIN, Suffolk District Materials Engineer, VDOT
N. W. DILLON, Salem District Structures & Bridge Engineer, VDOT
M. T. KERLEY, Salem District Structures and Bridge Engineer, VDOT
T. F. LESTER, Structures and Bridge Division, VDOT
L. L. MISENHEIMER, Staunton District Bridge Engineer, VDOT
C. NAPIER, Structural Engineer, Federal Highway Administration
W. L. SELLARS, Lynchburg District Bridge Engineer, VDOT
D. B. SPRINKEL, Culpeper District Structures and Bridge Engineer, VDOT
J. F. J. VOLGYI, JR., Structures and Bridge Division, VDOT
L. R. L. WANG, Professor of Civil Engineering, Old Dominion University
R. E. WEYERS, Professor of Civil Engineering, VPI & SU
ii

FINAL REPORT
FIELD INSTRUMENTATION AND MEASURED RESPONSEOF THE 1-295 CABLE-STAYED BRIDGE:
PART 2-FIELD STUDY OF THERMAL RESPONSES
Paul S. DuemmelGraduate Research Assistant
Thomas T. BaberFaculty Research Scientist
Furman W. BartonFaculty Research Scientist
Wallace T. McKeel, Jr.Research Manager
INTRODUCTION
Cable-Stayed Bridges
Two relatively recent developments in bridge technology, segmentally erected,prestressed, concrete box girders and cable-stayed support systems, were employedon the James River Bridge near Richmond, Virginia. These innovations result inspeedy erection and efficient use of high-strength materials, as well as pleasing aesthetics.
Until the early 1970s, concrete was not used extensively in cable-stayedbridges because of its relatively low strength-to-weight ratio, but recent design simplifications have helped make it more competitive (Muller & McCallister, 1988).Segmental construction, by means of the cantilever method, is ideally suited to thestay cable support system (Mathivat, 1983). The cable-stayed segmental bridgescheme provides a number of benefits, in addition to some economic advantages.Concrete superstructures are well suited to stay cable configurations because thehorizontal component of cable-stay forces produces prestressing in the deck. Concrete bridges also have favorable vibration damping characteristics, and their smalllive load-to-dead load ratio limits live load deflections. Today, cable-stayed segmental bridges are competitive for intermediate spans that had previously beenconstructed using variable depth box girders. The James River Bridge, with a mainspan of 630 ft, is in this category.
Cable-stayed, segmentally erected, prestressed bridges are challenging toanalyze and design. The typical arrangement of several continuous spans with

multiple supporting cables makes these structures highly statically indeterminate.In addition to the complications introduced by multistage post-tensioning, staycable nonlinearity, and time-dependent deformations, and the complexity of the loaddeformation response, the bridge behavior under complicated time-varying systemsof thermal and mechanical loads must be determined. In particular, serious problems have been attributed to the underestimation of thermal stresses and lack ofconsideration or the underestimation of the effects of thermal gradients (Elbadry &Ghali, 1986).
Numerous methods for analyzing segmental prestressed and cable-stayedbridges have been developed. Although these computational methods can estimatestructural response to a variety of thermal and mechanical loadings, the information is meaningful only if it models the actual behavior of the bridge. Thermal effects on bridge superstructures have not been clearly established, a~d further information concerning the effects of temperature differentials is necessary in order toevaluate modifications in bridge design specifications (Imbsen et al., 1985). Fieldtesting of complex bridge designs is therefore essential to allow the insight neededto constIUct valid computer models and gain insight into the actual behavior ofbridges built using new and innovative structural technology.
James River Bridge
The 1-295 James River Bridge is a segmentally erected, precast, posttensioned, cable-stayed box girder bridge located approximately 15 miles southeastof Richmond, Virginia. The bridge has 28 spans, including approach spans. The focus of this study was a 7-span continuous section, which includes the 630-ft main(river crossing) span and three 150-ft approach spans at each end. The main spanand the two adjacent spans on each side of the river are supported by a system of 52cable stays arranged in a single plane harp configuration. The stays emanate froma pair of 290-ft pylons located on either side of the river. An elevation drawing ofthe bridge is shown in Figure 1.
The bridge deck is composed of twin box girders joined by a closure pouralong the center line of the structure. The forces from the cable stays are transferred to the twin box girders through a series of precast delta frame assemblies located between the girders at each stay location, as shown in Figure 2. The mainspan of the bridge was constructed by the cantilever method, with each side builtoutward from the pylon and connected by a closure pour at midspan. The segmentsare joined by epoxy cement and post-tensioning strands within the girders. The boxgirders are externally post-tensioned by a system of multiple tendons anchoredwithin the girder segments. Figure 3 shows the cross-sectional dimensions of themain span segments, which are 10 ft long and weigh approximately 70 tons each.The bridge superstructure is supported on precast, segmental piers. The pylons arecast in place below deck level and are precast and segmental beginning 6 ft abovethe deck. Figure 4 shows the twin box girders at the main pier/pylon locations.
The James River Bridge was completed in April 1990. It is the firstcable-stayed bridge in Virginia and the first to employ the twin parallel box girder
2
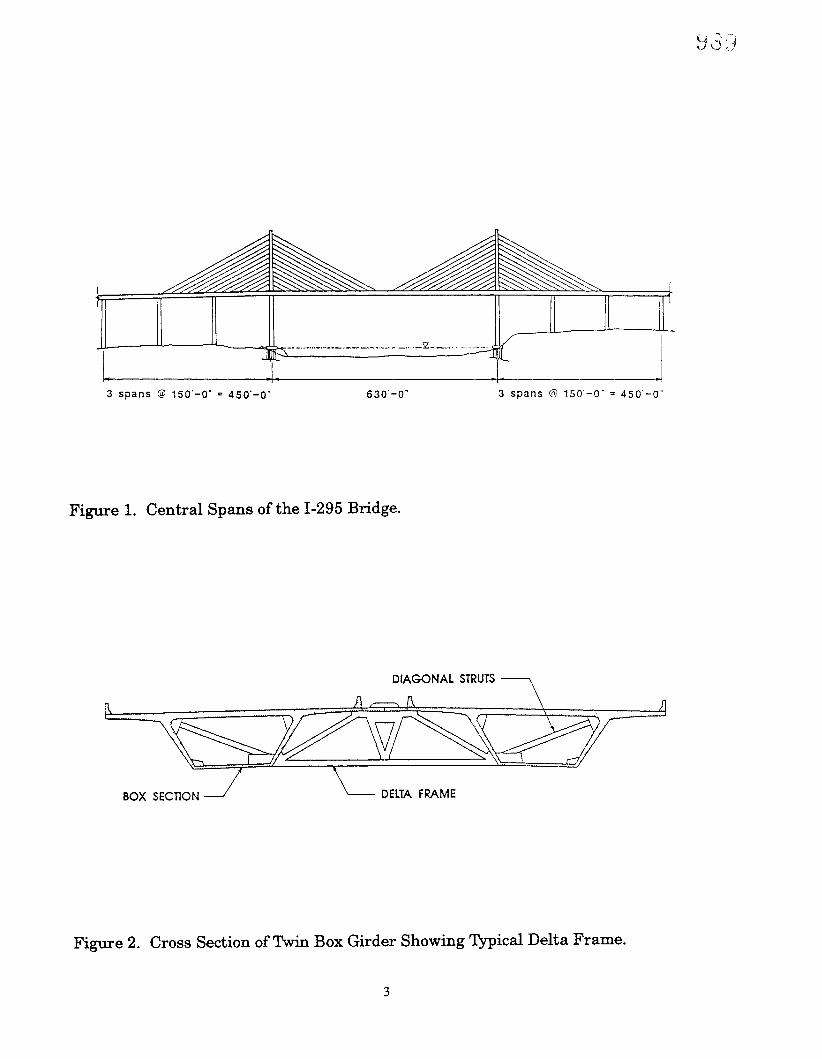
3 spans @ 150'-0" = 450'-0" 630'-0" 3 spans @ 150'-0· -:: 450'-0·
Figure 1. Central Spans of the 1-295 Bridge.
DIAGONAL STRUTS
BOX SECTION DELTA FRAME
Figure 2. Cross Section of Twin Box Girder Showing Typical Delta Frame.
3

;.
Synw
rtoo
boJ
,(G
ird
erl I
(.(- ..
~
~
'0 ~~ ~
8'-
6Yz·
8'
-6~·
Fo
ra
nch
or
blo
ckd
e/o
ils
Su
Shf
No
;58
-;6
"
t9':'
"!
9'-
0"
Iiii
·1
8'
-o·
Fig
ure
3.D
imen
sion
so
fBox
Gir
der
Cro
ssSe
ctio
n.

PRECAST PYLON SEGMENTS
PRECAST PIERS---lr---...IJ1o.-
Figure 4. Bridge Section at Main PierlPylon Locations. CIP = cast in place.
deck supported by a single plane of cable stays. This innovative scheme requiredless material than a single box girder of the same width, and the need for specialconstruction equipment was significantly reduced (Muller & McCallister, 1988).
PURPOSE AND SCOPE
A research team from the University ofVirginia (UVa) and the VirginiaTransportation Research Council (VTRC) conducted the current field study of thethermal responses of a segmental, cable-stayed, box girder bridge. A companion report describes a study of live load responses carried out concurrently with this study(Duemmel et al., 1992).
The overall objective of the UVaIVTRC study was to determine the importantstresses of the James River Bridge during constIUction by the measurement of fieldresponses. Previous work included measurement of strains in the box girders andcable stays during construction (Barton et al., 1991; Mohr, 1989). The objective ofthe present research was to investigate the thermal gradient and resulting thermalstresses in the box girders and pylons. To meet this objective, three tasks were undertaken:
1. A literature review was conducted of the methods used to conduct thermal analyses of box girder bridges.
5

2. The thermal response of the structure was measured over a lO-day periodby thermocouples and strain-gaged reinforcing bars installed in box girder and pylon segments.
3. Measured temperature distributions were used in conjunction with finiteelement models (frame and plate) to predict the daily variations in strainrecorded at the instrumented segments. The strains computed from eachof the models were compared with those measured in the field.
LITERATURE REVIEW
Bridge structures are continuously subjected to temperature changes becauseof varying climatic conditions. Differential heating and cooling of box girder andpylon sections cause deformations, which, when restrained, result in complex statesof stress. Thermally induced stresses may be on the same order of magnitude asthose attributable to applied vehicle loading, emphasizing the need to consider thermal effects on concrete bridges (Waldron et al., 1990). Serious cracking in concretebridges has been attributed to thermal stresses resulting from temperature gradients within box girder bridges (Podolny, 1985).
A comprehensive study of thermally induced stresses in prestressed concretebridge superstructures conducted by the American Association of State Highwayand Transportation Officials (AASHTO) illustrated the lack of a unified approach tothermal gradient effects in design at both domestic and international levels (Imbsenet al., 1985). Current AASHTO specifications have provisions for uniform temperature variation in bridge decks but do not provide guidance for temperature variations within members. The Post-Tensioning Institute's (PTI) Precast Segmental BoxGirder Bridge Manual (1978) provides methods for considering differential temperatures, as do some international codes, but variations are considerable. Surveys ofstate bridge officials indicate few cases of thermal distress, even though the effectsof thermal gradients are often ignored. The lack of serious problems does not suggest that design procedures are adequate, but it has lead to skepticism amongbridge designers as to the need for accurate but complicated thermal design procedures.
The AASHTO study stated that measured thermal gradients and resultingthermal stresses in concrete box girder bridges were sufficiently large to warrantconsideration by designers. Theoretical stresses calculated from measured temperature gradients were often inconsistent with observed bridge performance, however.This suggests the possibility that thermally induced stresses may not be as high aspredicted or that bridge structures may have higher inherent strength than isthought. Since most thermal-related problems affect serviceability rather thanstrength, more information will be needed to convince designers of the need forelaborate thermal design procedures. Although problems are not critical with present bridge designs, the trend toward cross-section optimization in long superstructures increases the need for accurate and consistent thermal gradient design methods (Imbsen et al., 1985).
6

The distribution of temperature throughout the cross section of a box girderbridge is governed by three principal heat transfer mechanisms: radiation (whichincludes reradiation), conduction, and convection. These mechanisms are, in turn,influenced by a number of factors, including bridge geometry, orientation, and geographic location; variations of solar radiation; ambient temperature; wind; andthermal properties of bridge materials (Waldron et al., 1990). Previous studies haveshown that the temperature distributions within concrete box sections are nonlinear because of the continuously varying thermal environment and the relativelypoor thermal conductivity of the concrete itself. Thermal gradients occur throughthe depth of the box girder, as well as through the thickness of the flanges andwebs. Large thermal gradients have been shown to cause severe cracking in a number of box girder bridges (Podolny, 1985; Priestly, 1978). Numerical methods, suchas finite difference and finite element methods, have been used in transient heatflow analyses to predict temperature distributions within box girders accurately using measured climatic data as input (Elbadry & Ghali, 1983; Potgieter & Gamble,1983; Rao, 1986).
A nonlinear temperature distribution through the depth of a box girder member will result in a comparable nonlinear strain distribution since the level of strainin each fiber is proportional to the temperature at that location. The free thermalstrain distribution can be separated into three components: uniform, linear, andnonlinear, shown in Figure 5. If the section is unrestrained, it may elongate andbend because of the uniform and linear strain components. The remaining nonlin-
. . . .... .... .. .... .............. .. ... ... ..... ............ . ... . ...... . . "...... , .. .. . .
FREE STRAIN
.............:.:.:.:.:.:.:.:.:.:.:.:.:.::::::::::::::::::::::::::~: ~: ~: ~:~: ~: ~:~: ~:~: ~: ~: ~:
.~~ ~ ~ ~~~ ~~~~~ ~ ~ ~~ ~ ~~ ~~ ~ ~~~ ~:::::::::::::::::::::::::::::::\:::\:::::::\:\:::\::::
::\:::::::::::::::::::::\:::::::::::::::::::::::::::::::::::::::::::::::::::::..........................
\:\?:::>~/:\<?
UNIFORM
+
LINEAR
+
NONLINEAR
Figure 5. Components of Nonlinear Thermal Strain Distribution.
7

ear strain results in self-equilibrating stresses; i.e., the net resultant axial force andbending moment are zero. This situation is shown in Figure 6.
If the section is fully restrained, the temperature-induced deformations cannot occur, resulting in a system of stresses having the same distribution as the freestrain in Figure 5. The restraint of the thermally induced deformations causes additional stresses in the member. Multi-ply indeterminate bridges, such as thecable-stayed bridge in this study, provide significant restraint and are thus subjected to stresses not present in bridges with simply supported spans.
Transverse thermal gradients occur through the thickness of the walls of abox girder section and result in strain distributions similar to those shown in Figure 5. If the girder is heated uniformly, the walls of the section will expand equallyand no additional stresses will be developed. If differential heating occurs on thetop flange, for example, the cross section will deform as shown in Figure 7. The section acts as a frame in resisting this deformation, generating significant transversestresses, which are usually ignored in design (Waldron et al., 1990).
Little work has been conducted toward measuring temperature variationsand thermal stresses in concrete pylon structures. As with box girders, differentialheating will result in a thermal gradient across the pylon's cross section. The pylonsections are more massive than the box girders, however, and the thickness of theexterior walls will limit the thermal variations within their core. In effect, the exterior walls of the pylon, especially those with southern and western exposures, willbe subjected to large changes in temperature. The temperatures within the section
•CENTROID
(0)
ACTUALSTRAIN
(b) (c) FREESTRAIN
(d)
Figure 6. Stresses in Simply Supported Beam Due to Nonlinear TemperatureDistribution. eIP =cast in place.
8

_.------------ -f - .........I .......... """
/I
l .....-------- ..... _1
Figure 7. Local Cross-Sectional Thermal Section Distortion.
will vary more slowly. These differences in temperature will result in a complexstate of thermal strain and will affect the overall behavior of the bridge.
Analytical methods have been implemented for analysis of box girder bridgessubject to thermal loading and varying climatic conditions. Dilger et ale (1983)employed a one-dimensional finite difference program to predict temperature distributions in composite box girder bridges, which considered the effects of geometry,material, and environment. A parametric study was performed to find extremetemperature differences by varying bridge orientation, cantilever length, and girderdepth for each season. Temperature distributions were then used as input for a finite element analysis to obtain thermal stress distributions for a two-span continuous bridge.
Potgieter and Gamble (1983) presented a thorough review of the literatureconcerning the theoretical prediction and experimental measurement of heat flow inbridge superstructures. They developed programs for linear heat flow analysis andsubsequent thermal stress analysis. The accuracy of the analytical models was assessed in a field study of a segmental box girder bridge. Theoretical temperaturedistributions and stress results showed good agreement with field measurements.The authors used weather data from a number ofD.S. cities as input for the heatflow model to estimate the variation in temperature distributions in different partsof the country and identify the effects of specific climatic parameters. The thermalresponse of various cross sections, including 18 existing box girder bridges, was alsostudied. As a result, specific span configurations at high risk for cracking under
9

thermal loads were identified, and simplified expressions for <;letermining bridgethermal response were developed.
Churchward and Sokel (1980) used measured temperature data from a boxgirder bridge to develop an analytical procedure for determining temperature distributions in bridges with similar cross sections. Thermocouples measured temperatures throughout the cross section, and environmental parameters such as ambienttemperature, solar radiation, and wind speed were recorded simultaneously. Empirical expressions were developed from the observed nonlinear temperature distributions and were correlated with the environmental parameters. The resultsshowed that temperatures could be predicted reasonably well using a function thatconsidered the maximum temperature differential across the section as the dependent variable. The authors reiterated the need for additional thermal data as wellas strain and deflection measurements from other bridges.
Imbsen et al. (1985) conducted a comprehensive study of thermally inducedstresses in reinforced and prestressed concrete bridge superstructures. Field measurements of temperature distributions and associated stresses have been documented by numerous investigators. The thermal design provisions in bridge designcodes from the United States and abroad were surveyed. Typical design thermalgradients were determined from representative codes and applied to a group of U.S.box girder bridges. Both longitudinal and transverse effects were studied, and theresults showed significant differences in calculated stresses depending on the temperature gradient used. Large transverse stresses were identified, although theseeffects are virtually ignored in practice. The authors suggested design guidelinesfor thermal effects based on their findings.
Elbadry and Ghali (1983) formulated a solution for heat flow in concrete boxgirders using the finite element method. A two-dimensional thermal analysis procedure was implemented in a computer program, FETAB, which has the capability ofmodeling material, solar, wind, and seasonal effects. A parametric study was conducted on a two-span continuous bridge, which yielded extreme temperature variations and thermal stress distributions. Significant stresses were found to developon summer days having large variations of ambient temperature. Elbadry andGhali (1986) investigated transverse thermal stresses and discussed the effects ofthermal stresses on cracking of concrete box girders.
Rao (1986) formulated a series solution for heat flow in concrete box girders,which was developed into a finite strip thermal analysis program. The effects of different climatic data on temperature distributions and stresses were analyzed, andresults were compared with those of the finite difference method. The author'smethod was shown to be simpler and converged more rapidly than the finite difference solution. Results of a parametric study again showed the significance of highsolar radiation and large ambient temperature variations on box girder stresses.
Waldron, Ramezankhani, and Woodman (1990) used a time step thermal finite element analysis based on the work of Elbadry and Ghali to investigate temperature distributions in a box girder bridge located in South Wales, U.K Their
10
model measured climatic data as input to establish time-varying boundary conditions. Transverse thermal stresses were obtained using the calculated temperaturedistributions in a two-dimensional plane strain model. Significant daily stress variations in the webs of the two girder bridges were observed. Results were comparedwith field data, and the analytical method showed good agreement with measuredvalues. A parametric study was also performed to investigate the effects of crosssectional configuration on temperature-induced transverse stresses.
METHODS
Overview
Thermal gradients and thermally induced stresses were measured within thebox girder and pylon members. Measured temperature distributions were used inconjunction with a frame finite element model to predict the daily variations instrain recorded at the instrumented segments. Analysis results from a plate element model of the structure were compared with the measured and predicted thermal response data.
Ideally, thermal response data should be taken during the early summermonths, during which large ambient temperature changes and high solar radiationcause the largest thermal gradients within the bridge superstructure. The dataanalyzed for this report were taken over a 10-day period in November 1989. Duringthis period, the bridge had not been opened to normal traffic and cable-stay retensioning operations were underway. Consequently, some of the strain data were subject to the effects of the changes in cable-stay stresses as well as constructionrelated traffic on the bridge. During a weekend period, however, there was no construction activity, allowing the thermal response of the bridge to be measured alone.The thermal response data presented in this study were taken during the periodfrom Friday, November 17, through Sunday, November 19,1989.
Strain Gage Instrumentation
An extensive array of electrical resistance strain gages mounted on dummyreinforcing bars were installed during construction. Each strain gage was mountedon a 4-ft length of No. 5 reinforcing bar by use of a high-grade epoxy resin cured atan elevated temperature. The gages were waterproofed by use of a layer of epoxyresin followed by a polysulfide compound designed for protection of electronic equipment. An instrumented reinforcing bar is shown in Figure 8. The gaged dummyrebars were tied into the deck and pylon segment reinforcing cages prior to theirplacement into the precasting forms. Lead wires, jacketed with TFE Teflon for waterproofing, were run along the cages to blockouts in the walls of the segments. Mter the segment was cast and placed, the lead wires were retrieved and connecteddirectly to the data acquisition system.
11

POLYETHYLENEPOTTING BOTTLE
TEFLON LNSULATEDLEAD WIRE
Figure 8. Instrumented Dummy Reinforcing Bar.
90· ROSETTE
REBAR
POLYSULFJDE WATERPROOFINGCOMPOUND
EPOXY WATERPROOFING LAYER
In the field, changes in temperature result in apparent strains in addition tothe mechanical strains measured by the strain gages. Th compensate for these temperature effects, gO-degree rosette gages, consisting of gages oriented parallel andtransverse to the axis of the bar, were used. The transverse portion of the rosettethen underwent a Poisson strain as well as a compensating thermal strain. Whenthe gages are wired in a Wheatstone half bridge, a small temperature correction appeared but was not significant for the range of temperatures expected during thestudy.
The gages were mounted along the curve of the rebar rather than on a flatsurface, which would have necessitated extra machining. Although mounting thegages on a curve avoids the uncertainties in strain measurement associated with areduction of bar area, an additional temperature-induced strain is introduced by thecurvature of the transverse gage. This apparent strain is a function of the radius ofthe curved surface, the thicknesses of the gage backing and adhesive, and temperature change. An approximate correction was given by Measurements Group, Inc.(1983) as:
12

where EAPP = apparent strain induced by curvature
R = radius of curvature
VA-B = Poisson's ratio of adhesive and backing
hA, hB = adhesive and backing thickness, respectively
aA, aB = thermal expansion coefficients of adhesive and backing,respectively
as = thermal expansion coefficient of specimen
IlT = temperature change.
Strain gages were installed in three deck segments located in the main spanof the bridge. Specifically, the north and southbound lanes of main-span box girdersegments 33, 48, and 62 were instrumented with single longitudinal gages andthree gage rosettes. Figure 9 shows the locations of the instrumented segmentswith respect to the south pylon/pier and the center line of the main span. Segment
tit PYLON AND PIER
STAY 51
SEa 33 SEa 48
et. SPAN\
STAY S13 I
I
ISEG 62 I
II
Figure 9. Location of Box Girder Segments Instrumented with Strain Gages.
13

1 2
58
3 4 10 11
NB
12 13 14A
1 2
7 8
58
3
9
4
SEG 33
10 11
17 18
NB
12
19
13 14
7 8 9
SEG 48 & SEG 62
17 18 19
Figure 10. Location of Strain Gages in Instrumented Box Girder Segments.SB =southbound; NB =northbound; • =single gage oriented parallelto the long axis of the bridge; R =strain rosette.
14
33 is adjacent to the pier, segment 48 is near the quarter span, and segment 62 is atmidspan. The locations of the strain gages within each of the segments are shownin Figure 10, where a dot represents a single gage oriented parallel to the long axisof the bridge, and an R represents the location of a strain rosette. The rosettes consist of three gaged rebars arranged at 45-degree angles and were installed to measure shear strains. Rosette gages were placed in the webs of each instrumentedsegment. As can be seen in Figure 10, additional rosettes were placed in the topand bottom flanges of segment 33. Readers will wish to refer to Figures 9 and 10 toassist in interpreting the discussion of the field study data.
In view of the complexity of behavior anticipated for box girders, complete instrumentation was not feasible, so the strain gages were arranged to provide dataconcerning the gross cross-sectional deformations only. The instrumented segmentswere not connected to delta frames so as to avoid the local cross-sectional distortions likely in these areas. The gage pattern shown in Figure 10 allows the grosscross-sectional flexural strains and the shear strains acting in the four webs to bedetermined. The additional rosettes in the flanges of segment 33 provide additionalinformation concerning the torsional shear strains at that location.
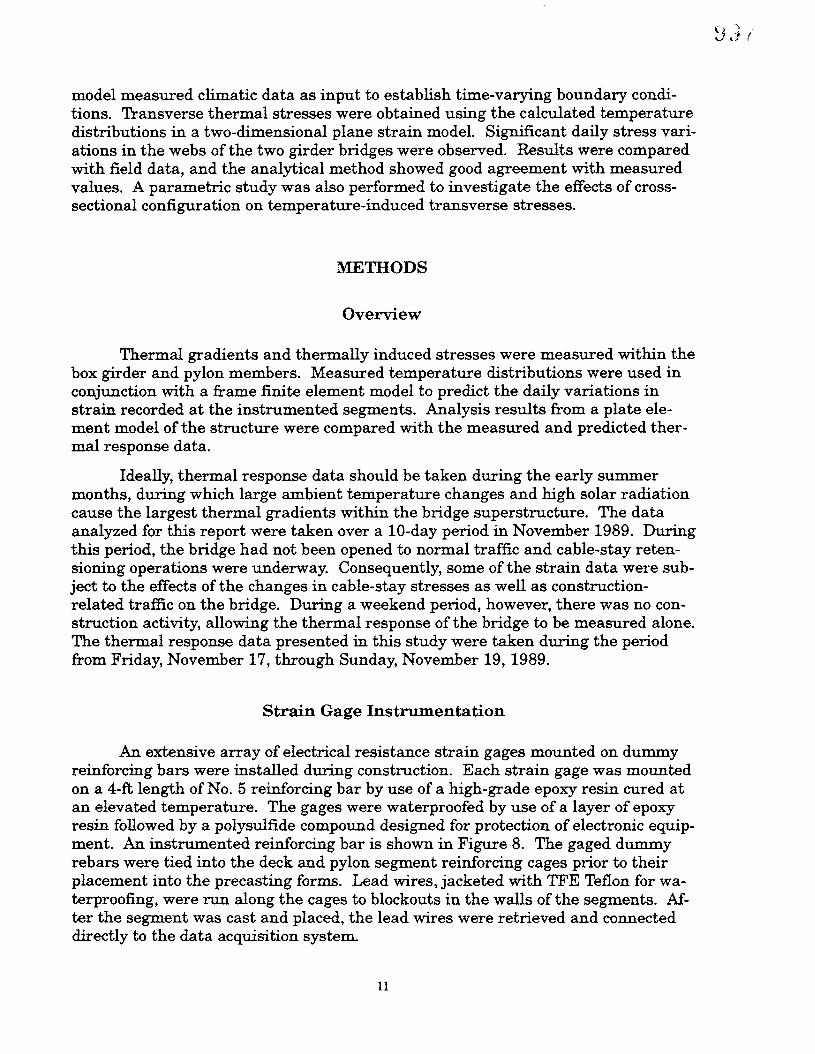
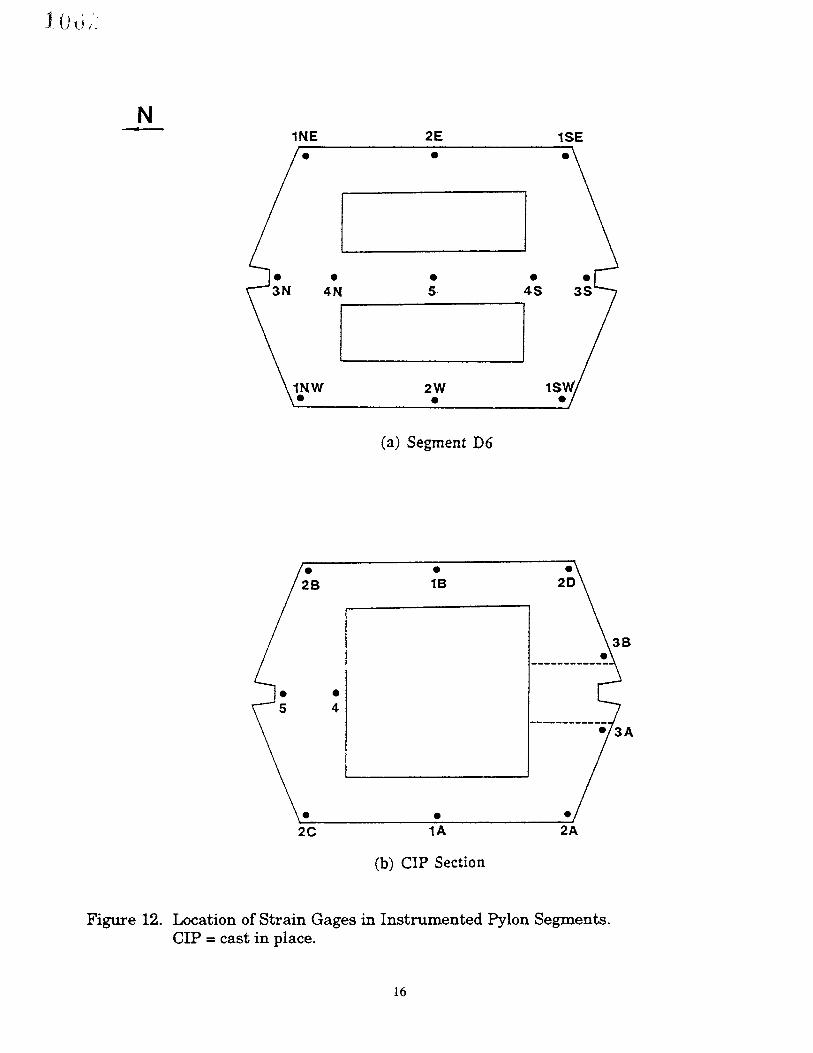
Two sections of the south pylon were also instrumented with strain-gaged reinforcing bars. The gages were placed vertically in the uppermost cast-in-place section, just above deck level, and in precast segment D6, located beneath cable stayS7. The locations of these sections are shown in Figure 11. Figure 12 depicts the
SEGMENT 06
CIP SECTION
Figure 11. Location of Pylon Segments Instrumented with Strain Gages. eIP =cast in place.
15
N..1NE 2E
•
• • •4N 5· 45
I2W•
(a) Segment D6
1SE
•28
•2C
•4
•18
•1A
(b) CIP Section
2A
Figure 12. Location of Strain Gages in Instrumented Pylon Segments.elP = cast in place.
16

locations of the strain gages within the instrumented pylon segments. Readers willwish to refer to Figures 11 and 12 to assist in interpreting the field study data.
Thermocouple Instrumentation
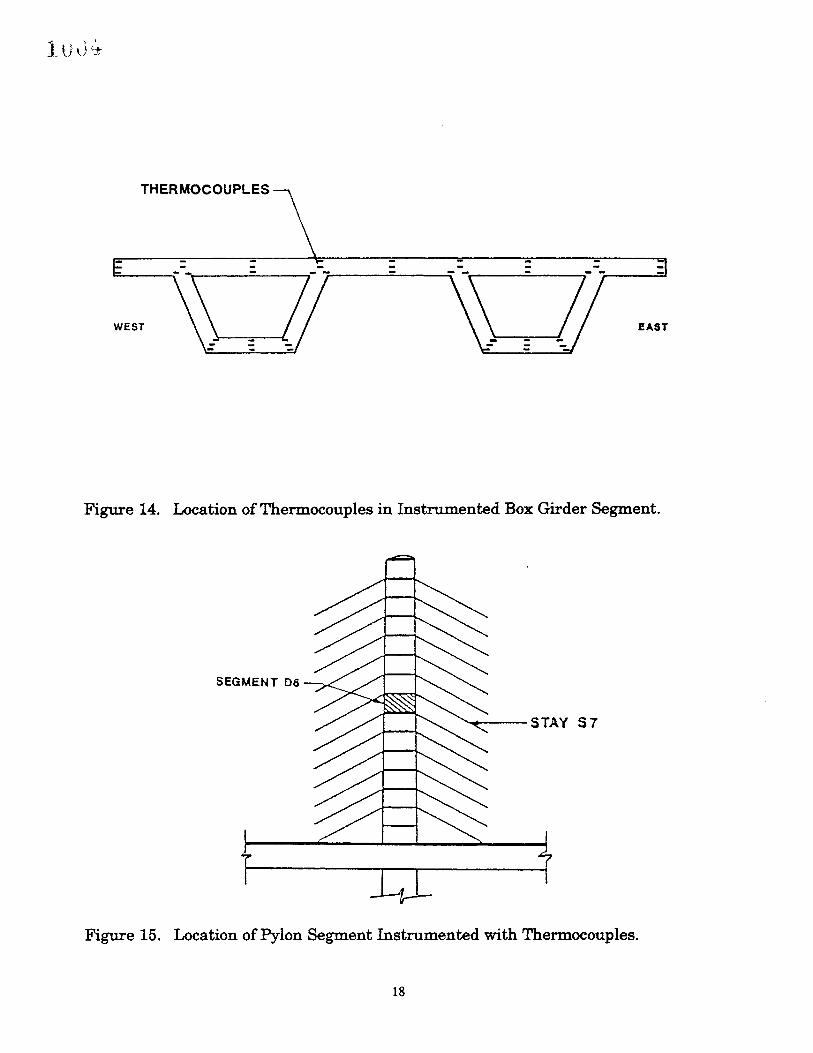
Thermocouples were installed in the box girder and pylon to measure thetemperature variations within these members. Previous research has shown thatlittle variation in temperatures occurs along bridge spans, and the present bridge isessentially straight, except for a small vertical curvature, so a single twin box section of the main span was chosen for instrumentation. Type T thermocouples wereplaced in the top and bottom flanges of main-span segment 46, as shown in Figure13. Thermocouples offered sufficient precision for the current study and are less expensive and more rugged than thermistors. Several thermocouples were installedthrough the thickness of each flange to measure thermal gradients that occurredthrough the depth of the box girders. Thermocouples were located across the section to determine the differential thermal effects resulting from eastern versuswestern exposure. The locations of the thermocouples within box girder segment 46are shown in Figure 14.
Precast pylon segment D6 was also instrumented with an array of thermocouples to correlate data from the strain gages installed at that location. The instrumented pylon segment is shown in Figure 15. Figure 16 shows the locations of
[It. PYlON AND PIER
STAY S1 STAV 88
If. 8PAN\
STAY 813 I.I
THERMOCOUPLE INSTRUMENTED SECTION !I•
Figure 13. Location of Box Girder Segment Instrumented with Thermocouples.
17
THERMOCOUPLES --'\
Figure 14. Location of Thermocouples in Instrumented Box Girder Segment.
SEGMENT 06
~--STAY 57
Figure 15. Location of Pylon Segment Instrumented with Thermocouples.
18

2W -
1NW4NW_
5
1NE
- 2E
1SE
N
I
Figure 16. Location of Thermocouples in Instrumented Pylon Segment.
the thermocouples within the cross section. Considerable care was taken in locatingthe thermocouples within the box girder and pylon cross sections to ensure the accuracy of the measured temperature distributions. Thermocouple wires were attached to the reinforcing cages of the segments and then connected to the data acquisition system after the segments were cast and lifted into place.
Data Acquisition System
A distributed data acquisition system manufactured by the John Fluke Company was used to obtain the data. The system uses a Helios main controller to communicate with the remote scanning units located in the instrumented bridge segments. The strain gages and thermocouples located in each instrumented section ofthe bridge were connected to individual scanning units, which in turn were connected to the Hellos controller via data lines. The scanning units can read thermocouples and electrical resistance strain gages in various configurations, each requiring a single data acquisition channel. The data were stored on a Compaq portablecomputer in Lotus 1-2-3 format by means of Helios Toolbox data acquisition software, a QuickBasic program. The system uses 110-volt line power via an uninterruptible power supply (UPS), which provides surge protection and a backup powersource. The main controller unit, data logging computer, and UPS are protected inan enclosure cabinet with heating and air conditioner units to maintain operationaltemperature and humidity limits. Further details of the data acquisition systemand instrumentation are provided by Baber and Hilton (1988) and Hayes (1988).
19

Model for Prediction of Thermal Strains
The longitudinal stresses induced by nonlinear temperature distributions areof primary interest in this study. Previous field studies have indicated that thesestresses are often significant. Transverse stresses resulting from thermal gradientsthrough the thickness of the walls of the box girder cross section, though possiblyhigh, are beyond the scope of this study. Additional field instrumentation, such asstrain gages oriented perpendicular to the long axis of the bridge, as well as additional thermocouples located through the thickness of the flanges and webs, wouldbe necessary to predict and measure transverse thermal stresses.
Stresses resulting from thermal gradients can be calculated if one knows thetemperature distribution through the depth of a beam. The following procedure isbased on the approach presented by Elbadry and Ghali (1986). The simply supported beam in Figure 6(a) is subjected to a vertical gradient of temperature changeT(y), shown in Figure 6(b), where y is measured from the centroid of the section. Ifthe section is unrestrained through its depth, the free strain profile is given by
[2]
where C1t is the coefficient of thermal expansion. The stress required to restrain thisfree strain artificially would be
Or = -EatT(y)
where E is the modulus of elasticity of the material. The force resultants of thisstress over the cross section are
N = fa,.dA
and
[3]
[4]
[5]
Assuming that plane sections remain plane in bending, the strain at any fiberis
E= EO + 1/Jy
20
[6]

where Eo and 'II are the axial strain at the centroid and the curvature, respectively.These are given by
NEO = - EA [7]
[8]
where A and I are the area and moment of inertia about the centroid. Substitutingequations 3 through 5 into 7 and 8 gives the axial strain and curvature of a statically determinate member as a function of temperature change over its depth:
at fEO = A T(y)bdy
at I1J1 = T T(y )bydy
[9]
[10]
where b is the width of the section at a depth y. The relationship between the freestrain, axial strain, and curvature are shown in Figure 6(c). The difference betweenactual strain and the free thermal strain represents the restrained nonlinear straincomponent of the free strain given by
[11]
and the resulting nonlinear stress distribution, assuming full restraint through thesection, is
a(y) = E[EO + tpy - atT(y)] [12]
These stresses, shown in Figure 6(d), are self-equilibrating; i.e., the net stress resultant is zero.
If the girder shown in Figure 6(a) were continuous over multiple spans, theaxial strain and curvature would be restrained and statically indeterminate reactions and moments would result in continuity stresses. The upward displacementof each span resulting from a positive unrestrained curvature 'JI is resisted by the
21

moment M =E1V in the continuous spans. The statically indeterminate reactionsand bending moments caused by the calculated axial strain and curvature can bedetermined using displacement methods of analysis. The total stress, as a functionof depth, at any location along the bridge is then
[13]
where M' and P' are the calculated indeterminate moment and axial force at thesection of interest. An examination of equation 13 shows that the longitudinalstresses attributable to a thermal gradient can be calculated at any point within thebeam if one knows the temperature distribution, and hence the distribution of temperature change, through the depth of the section.
In this study, the temperature distributions within the box girder and pylonsections were measured with thermocouples. Previous research has shown thatlittle variation in temperature occurs along the length of box girder bridges, so thethermocouple data obtained from segment 46 were considered to be representativeof the temperatures at each of the instrumented box girder segments. Likewise,thermocouple data from precast pylon segment D6 were considered representativeof the temperatures over the height of the pylon. Since the cable stays were not instrumented with thermocouples, the temperature response of these elements wasapproximated using thermocouple data measured in the pylon section.
Approximate cross sections were developed to simplify the calculations inequations 9 and 10 and to make the most use of the available thermocouple data.The geometry of the approximate sections was based on the location of the thermocouples and the actual shape of the box girder and pylon cross sections. The dimensions of the approximate sections were calculated such that overall dimensions,area, and section properties of the true cross section were not significantly altered.The approximate box girder cross section is shown in Figure 17. For this section,the tapered webs of the box girder were replaced with webs of constant thicknessand the top flange was divided into regions of uniform depth. The approximate pylon cross section is shown in Figure 18. Here, the dimensions of the individual rectangular regions were chosen to correspond with the. locations of thermocoupleswithin the section.
The continuity stresses resulting from restraint of the axial strain and curvature were determined using the beam element model developed for the live loadstudy (Duemmel et al., 1992). Forces and moments attributable to respective axialstrains and curvatures within the pylon and box girder were applied to the model asend forces, and temperature effects were applied to the cable stays in the form ofinitial strains. Analysis of the bridge model subject to these forces yielded the indeterminate forces P4 and M4 at locations along the box girder and pylon. The internal resultants of interest were found from the end forces of the beam elements corresponding to the instrumented box girder segments. Once the internal forces were
22

,( \..- 4.5·~1r 13.87'-I ~---
10· 15- -If-rt T t 8-
N
1
I
1-4- 13.5'
I~
Figure 17. Approximate Box Girder Cross Section.
I
5.0'-.1--I
1+2.25~ .... 1.75~II
"' I , ...
r~~ 'l' ""'- ..., ......
r~~ • ""'-
~ ""'- ...• •
r• • • • inco-- 0 ~
i N
fo ~co
1~ ane-)
1--t-- t- ....--. ----- ----- .---. -----------_ .
• • • •
• •... ..... ,-""'-
,-
• , ~
......1;\...... ,-
~.J I ;.,
• - THERMOCOUPLE
Figure 18. Approximate Pylon Cross Section.
23

known, the stresses at the levels of the top and bottom strain gages were calculatedfor each instrumented segment using equation 13.
RESULTS
Box Girder Segments
Measured Temperature Variations with Time
Temperature data recorded by the thermocouples in segment 46 are presented in Figures 19 through 22. These plots represent temperatures measured inthe top and bottom flanges of the box girder over the 3-day period beginning at midnight, November 17. Figure 19 presents temperatures recorded by thermocouplesin the vicinity of gages 2 and 7 located near the outer web of the box girder carryingthe southbound lanes (see Figure 14). Figure 20 shows data recorded at thermocouples near gages 4 and 6, located at the inner web of the southbound box girder.Similarly, Figures 21 and 22 present temperature variations recorded by thermocouples near the outer and inner webs, respectively, of the northbound box girder.
It is observed from these figures that daily temperature variations on the order of 4 to 8 degrees Celsius occurred within the box girder and an overall cooling
1'-
I "
II
//
\ '_/~
\ /~/
- GAGE 2
---- GAGE 7
16
14~
Uc:> 12'-"
~::J 10~
~ 8~~
~6~
~
4
l20 8 16 24 32 40 48 56 64 72 80
TIME (hours)
Figure 19. Measured Temperature Variations, Box Girder Segment 46,Southbound Outside Web.
24

GAGE 4
GAGE 9
16 '-1--------------------------,
I
__ 14~
~ I
12
o 8 16 24 32 40 48 56 64 72 80
TIME (hours)
Figure 20. Measured Temperature Variations, Box Girder Segment 46,Southbound Inside Web.
18,...--.------------------------,
GAGE 13
6f-
8072645648403224168
4 '-------'-I--~I__~I_ ____'___ ___'_I__-'----_-.1.1__-'-- 1_--'
a
TIME (hours)
Figure 21. Measured Temperature Variations, Box Girder Segment 46,Northbound Outside Web.
25

l. (J _i t_"
16 ~GAGE 11
14 GAGE 17~
~UQ
'-' 12
~'\
\\'\ /
/~
~ 10 \\:// /!/ ~\''''''
~ 8 /' \' " r"~ , J \" / ~ ~ ~~ --- '--' ~
~ "'--~ 6
\~
4
20 8 16 24 32 40 48 56 64 72 80
TIME (hours)
Figure 22. Measured Temperature Variations, Box Girder Segment 46,Northbound Inside Web.
trend took place over the period. The largest changes in temperature occurred inthe top flange, or deck region, which was exposed to direct solar radiation. Thedaily minimum and maximum temperatures occurred at approximately 9 A.M. and2 P.M., respectively, and the extreme temperatures in the webs and bottom flangeslagged behind those of the top flange by 1 to 2 hr. Figures 20 and 22 indicate thatsimilar temperatures were recorded at the inner webs of the two girders. Furtherexamination of these figures shows that, although the top flange underwent largerchanges in temperature, the bottom flanges were often warmer during the nighttime hours. A comparison of Figures 19 and 21 illustrates the difference in thermalresponse between locations having eastern versus western exposure. Figure 21shows that, at the eastern side of the bridge, temperatures recorded in the topflange, at gage 13, were consistently higher than those at gage 19, in the bottomflange. On the western side of the bridge, the opposite was true, as shown in Figure19, where higher temperatures were recorded at gage 9 in the bottom flange than atgage 2 in the top flange.
Measured Temperature Distributions Across the Girder
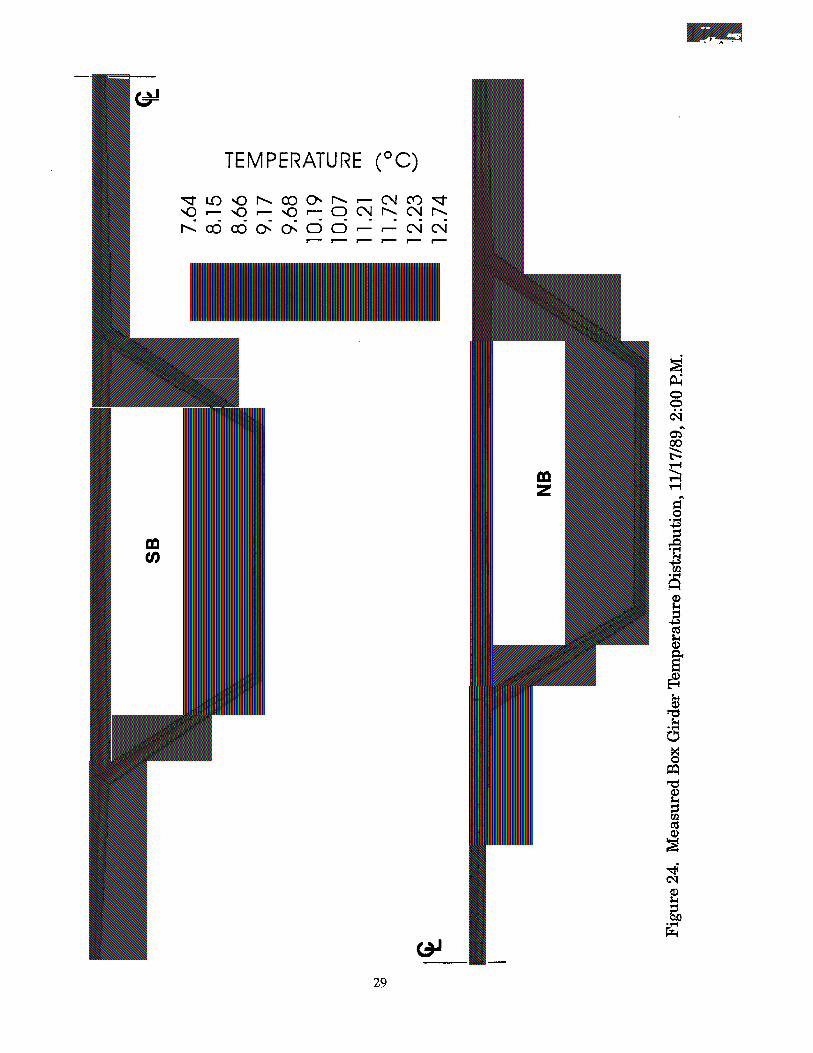
To allow for more insight into the distribution of temperature at a given time,thermal data from the I-295 bridge were plotted into color contours at several timesteps. Two of the measured temperature distributions are shown as contour plotsover the box girder cross section in Figures 23 and 24. These plots represent snapshots of the temperature distribution within the box girder, taken at times at whichextreme temperatures occurred in the top flanges. Figure 23 shows the box girder
26

TEMPERATURE (°C)
TEMPERATURE (°C)
29

temperature distribution recorded at 9 A.M. on November 17, and Figure 24 showsthe distribution at 2 P.M. the same day. Temperature contours were obtained by applying measured temperature data as nodal values in a finite element model inwhich the nodes corresponded to the locations of the thermocouples in segment 46.For clarity, the northbound and southbound portions of the twin box girder areplotted individually in each figure. The following discussion is limited to the temperature data recorded on November 17, which were representative of the data recorded on the following days of the study.
An examination of Figure 21 shows that the lowest temperatures in the boxgirder were recorded 9 A.M. at the closure pour between the girders and at the extreme ends of the top flange. Temperatures of approximately 3 to 4 degrees C wererecorded at the ends of the flange, and temperatures on the order of 10 to 12 degrees C were measured at locations in the top flange, near the interior of the boxsections. The large difference in temperatures observed between these points illustrates the insulating effect of the dead air space within the box girders. Temperatures of approximately 8 to 9 degrees C were recorded in the bottom flanges.
Figure 24 shows that significant warming occurred in the top flange between9 A.M. and 2 P.M. Temperatures of approximately 14 to 16 degrees C were recordedin the top flange in the vicinity of the outer web of the northbound box girder.Again, the lowest temperatures (approximately 7 degrees C) were measured at thewestern end of the top flange and between the girders, at the closure pour. Temperatures of approximately 10 degrees C were recorded in the bottom flanges, and thevariations in temperature through the webs are clearly shown. As shown inFigures 23 and 24, the highest temperatures in the girders were recorded in the topflange, above the outside web of the northbound girder. One explanation for thiscould be that the location was more protected from wind than other locations acrossthe box girder, such as the ends of the flanges, which are exposed to winds fromboth above and below. In both figures, closely spaced contours through the top deckand webs depict the thermal gradient over the depth of the girders. The measuredtemperature distributions presented in Figures 23 and 24 clearly show the complex,two-dimensional thermal state of the twin box girder at a section.
Measured Thermal Strains
Evaluation of the strain data indicated that a significant amount of measured data were unreliable. Potentially defective components of the data acquisition system were identified and replaced, but unfortunately, only about the samenumber of strain gages were operational after the repair efforts were made. Thisseemed to indicate that the problems with the data acquisition system were morecomplex than originally thought and that repairs may have been beyond the expertise of the researchers. Consultations with manufacturer's representatives alsofailed to lead to a solution.
All of the strain gages located in the bottom flange and webs of the northbound portion of segment 33 recorded unreliable data. Later troubleshooting indicated that these gages were apparently controlled by a defective excitation card
31
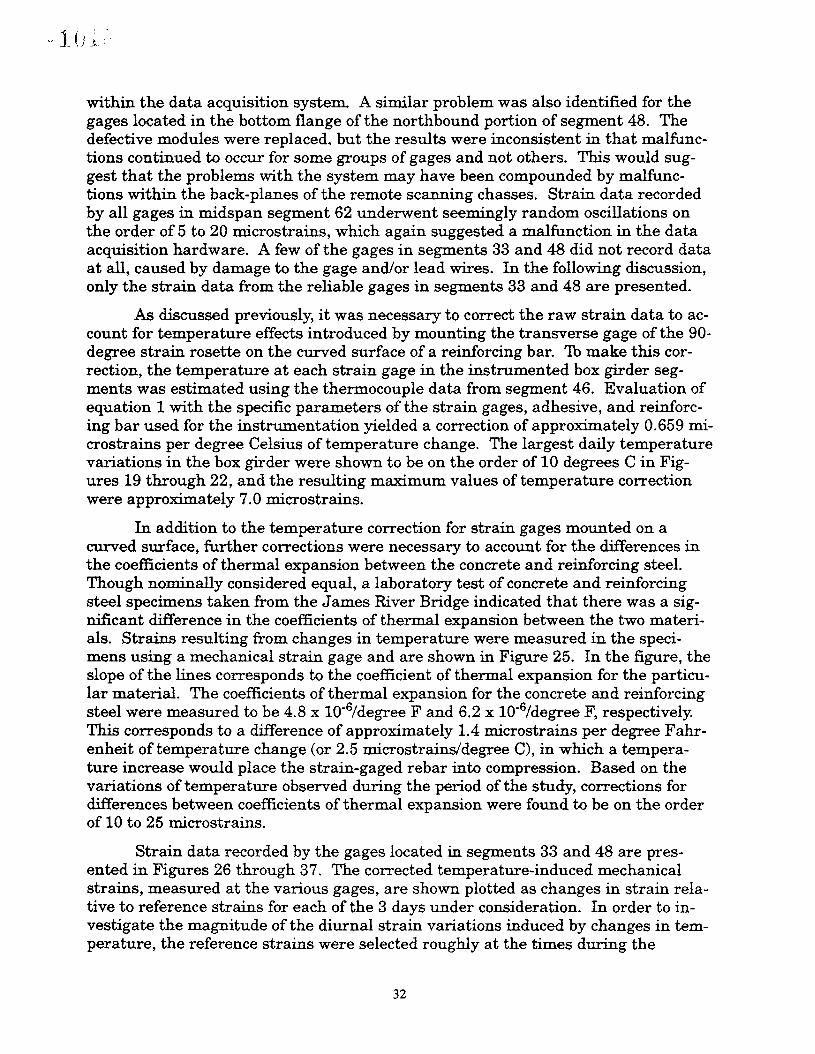
within the data acquisition system. A similar problem was also identified for thegages located in the bottom flange of the northbound portion of segment 48. Thedefective modules were replaced, but the results were inconsistent in that malfunctions continued to occur for some groups of gages and not others. This would suggest that the problems with the system may have been compounded by malfunctions within the back-planes of the remote scanning chasses. Strain data recordedby all gages in midspan segment 62 underwent seemingly random oscillations onthe order of 5 to 20 microstrains, which again suggested a malfunction in the dataacquisition hardware. A few of the gages in segments 33 and 48 did not record dataat all, caused by damage to the gage and/or lead wires. In the following discussion,only the strain data from the reliable gages in segments 33 and 48 are presented.
As discussed previously, it was necessary to correct the raw strain data to account for temperature effects introduced by mounting the transverse gage of the 90degree strain rosette on the curved surface of a reinforcing bar. To make this correction, the temperature at each strain gage in the instrumented box girder segments was estimated using the thermocouple data from segment 46. Evaluation ofequation 1 with the specific parameters of the strain gages, adhesive, and reinforcing bar used for the instrumentation yielded a correction of approximately 0.659 microstrains per degree Celsius of temperature change. The largest daily temperaturevariations in the box girder were shown to be on the order of 10 degrees C in Figures 19 through 22, and the resulting maximum values of temperature correctionwere approximately 7.0 microstrains.
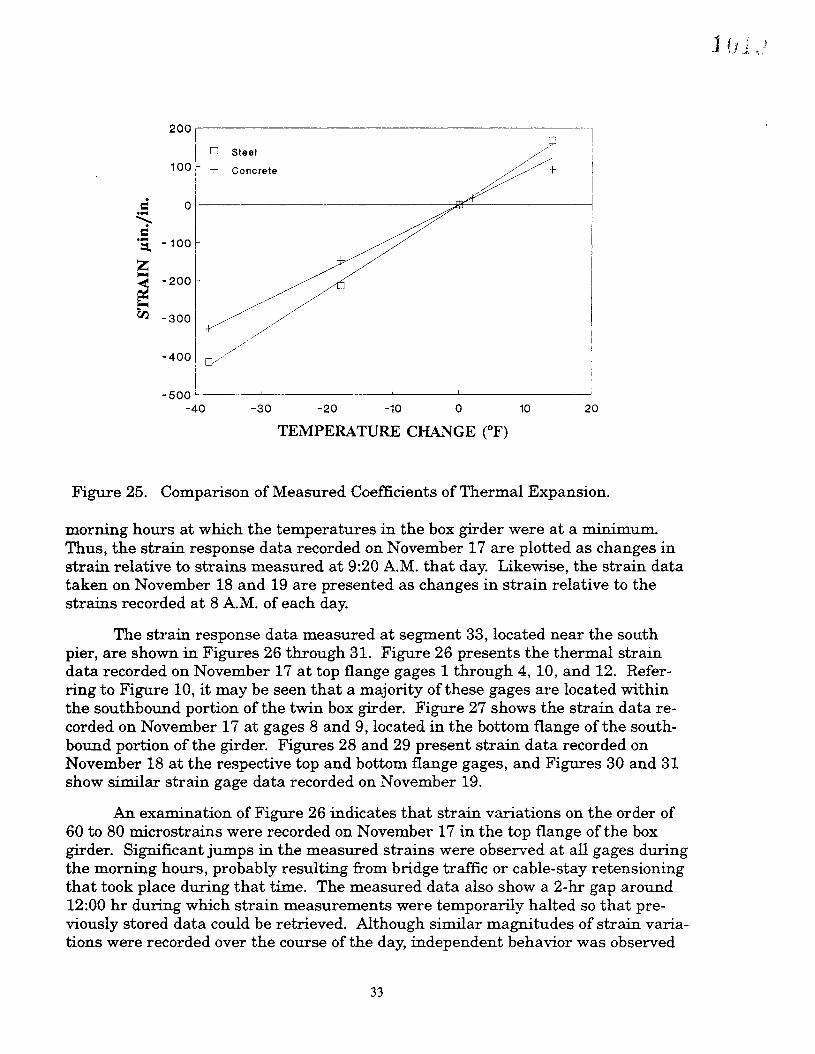
In addition to the temperature correction for strain gages mounted on acurved surface, further corrections were necessary to account for the differences inthe coefficients of thermal expansion between the concrete and reinforcing steel.Though nominally considered equal, a laboratory test of concrete and reinforcingsteel specimens taken from the James River Bridge indicated that there was a significant difference in the coefficients of thermal expansion between the two materials. Strains resulting from changes in temperature were measured in the specimens using a mechanical strain gage and are shown in Figure 25. In the figure, theslope of the lines corresponds to the coefficient of thermal expansion for the particular material. The coefficients of thermal expansion for the concrete and reinforcingsteel were measured to be 4.8 x 10⁻⁶/degree F and 6.2 x 10⁻⁶/degree F, respectively:This corresponds to a difference of approximately 1.4 microstrains per degree Fahrenheit of temperature change (or 2.5 microstrains/degree C), in which a temperature increase would place the strain-gaged rebar into compression. Based on thevariations of temperature observed during the period of the study, corrections fordifferences between coefficients of thermal expansion were found to be on the orderof 10 to 25 microstrains.
Strain data recorded by the gages located in segments 33 and 48 are presented in Figures 26 through 37. The corrected temperature-induced mechanicalstrains, measured at the various gages, are shown plotted as changes in strain relative to reference strains for each of the 3 days under consideration. In order to investigate the magnitude of the diurnal strain variations induced by changes in temperature, the reference strains were selected roughly at the times during the
32
200,I 0 SteelII
100I + Concrete
==I
0.-"'"==... -100:s.Z~
-200
~rJj -300 /
//
-400 /
I~
-500 1
-40 -30 -20 -10 0
+
10 20
1 () ! ,.J- ~...
TEMPERATURE CHANGE (OF)
Figure 25. Comparison of Measured Coefficients of Thermal Expansion.
morning hours at which the temperatures in the box girder were at a minimum.Thus, the strain response data recorded on November 17 are plotted as changes instrain relative to strains measured at 9:20 A.M. that day. Likewise, the strain datataken on November 18 and 19 are presented as changes in strain relative to thestrains recorded at 8 A.M. of each day.
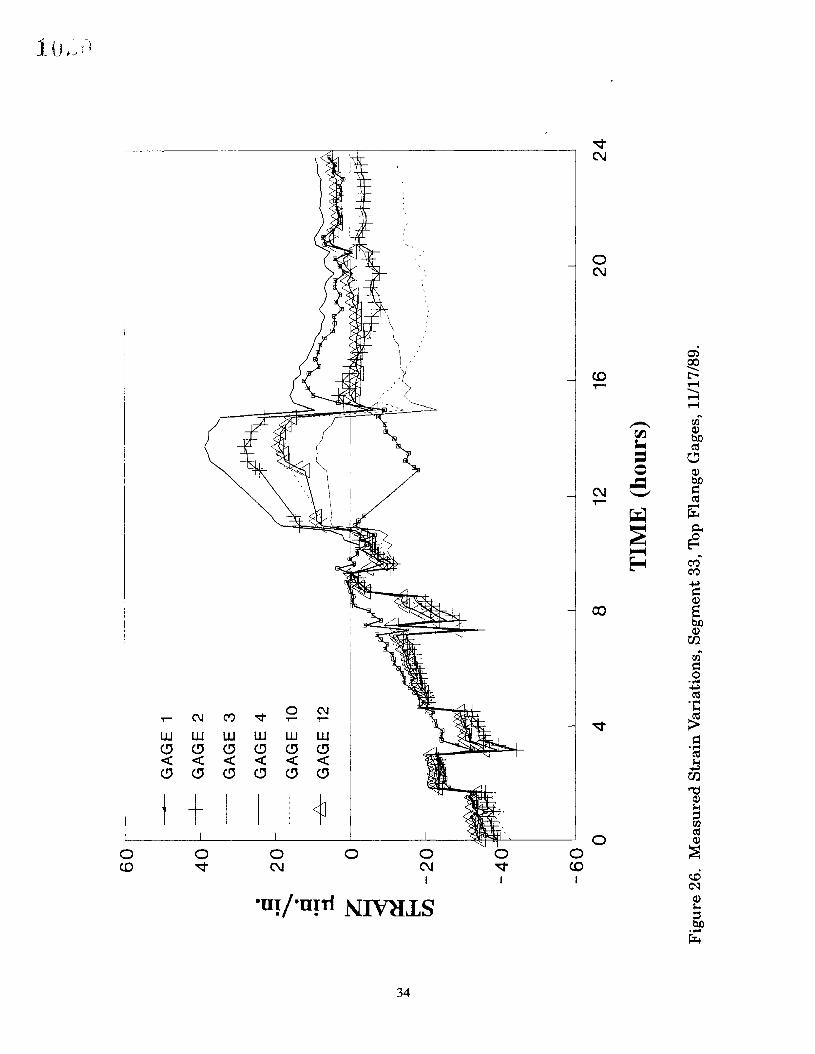
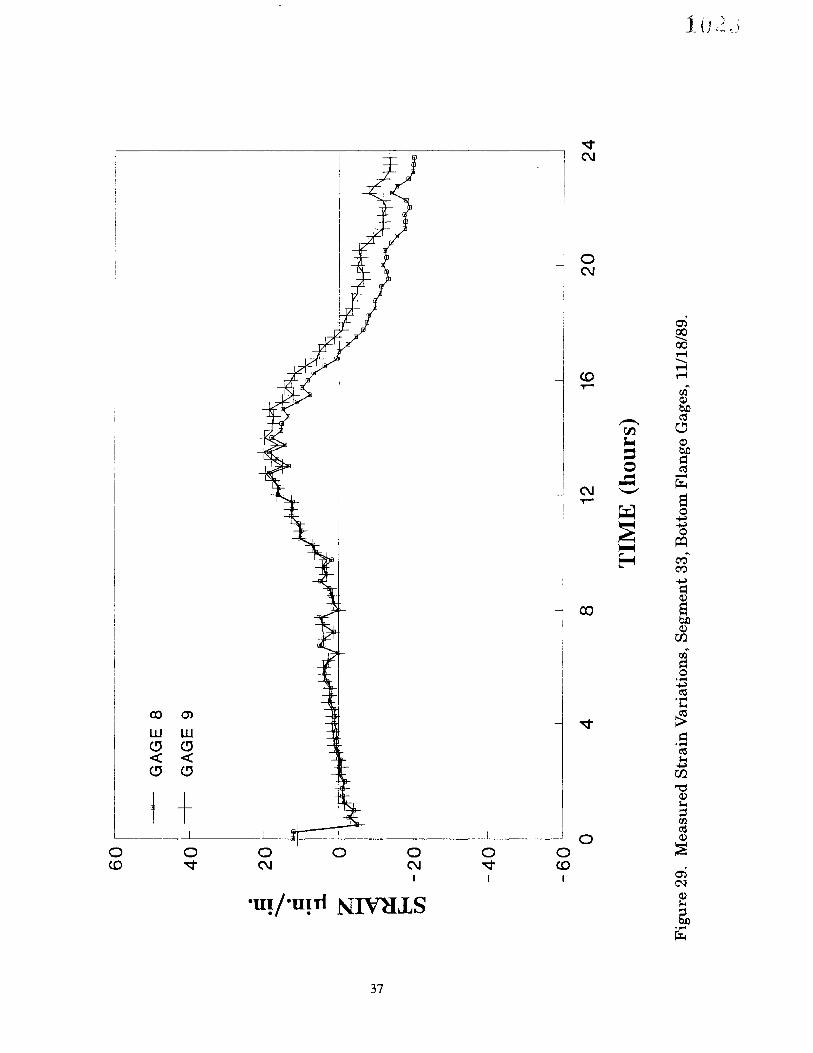
The strain response data measured at segment 33, located near the southpier, are shown in Figures 26 through 31. Figure 26 presents the thermal straindata recorded on November 17 at top flange gages 1 through 4,10, and 12. Referring to Figure 10, it may be seen that a majority of these gages are located withinthe southbound portion of the twin box girder. Figure 27 shows the strain data recorded on November 17 at gages 8 and 9, located in the bottom flange of the southbound portion of the girder. Figures 28 and 29 present strain data recorded onNovember 18 at the respective top and bottom flange gages, and Figures 30 and 31show similar strain gage data recorded on November 19.
An examination of Figure 26 indicates that strain variations on the order of60 to 80 microstrains were recorded on November 17 in the top flange of the boxgirder. Significant jumps in the measured strains were observed at all gages duringthe morning hours, probably resulting from bridge traffic or cable-stay retensioningthat took place during that time. The measured data also show a 2-hr gap around12:00 hr during which strain measurements were temporarily halted so that previously stored data could be retrieved. Although similar magnitudes of strain variations were recorded over the course of the day, independent behavior was observed
33
~~
~ '--.
..,. t
'-<
),-
\--"'
60
I-B
-G
AG
E1
40
i-+-
GA
GE
2
GA
GE
3
•I
-G
AG
E4
=.~
20
"I
GA
GE
10• =
.~
I--
b-
GA
GE
12:1
.
Z0
w~
~
~-2
0'
1~111'I.AI'Yf'
l:l
II
~\
-40
24
20
1612
TIM
E(h
ours
)
84
-60
1I
II
II
~
o
Fig
ure
26.
Mea
sure
dS
trai
nV
aria
tion
s,S
egm
ent
33,T
opF
lan
ge
Gag
es,
11/1
7/89
.

60
r-
~
GA
GE
8
40
~-+
-G
AG
E9
• =2
0..... "- • =
.~ ::1
.
Z0
V.)
~L
I\
~ 7Jl
-2
0
-40
24
20
1612
84
-60
'-1
-_
~
o
TIM
E(h
ours
)
Fig
ure
27.
Mea
sure
dS
trai
nV
aria
tion
s,S
egm
ent
33,
Bo
tto
mF
lan
ge
Gag
es,
11/1
7/89
.~ ,..-
....'--
=~.
~-,~
)....
,..r
't.

-40
~ ,,-...
.~ (''
-'"''
.-. ~,
60
I---8
-G
AG
E1
40r-+
-G
AG
E2
GA
GE
3
•I
-G
AG
E4
=2
0eJ
IIIIIC
"-
IG
AG
E10
• =I
-8-
GA
GE
12eJ
IIIIIC ::1
.
Zo
I~
W
~0
\
~ 7JJ
-2
0/
......
.....
,
24
20
1612
TIM
E(h
ours
)
84
-60
'~
J
o
Fig
ure
28.
Mea
sure
dS
trai
nV
aria
tion
s,S
egm
ent
33,T
opF
lan
ge
Gag
es,
11/1
8/89
.
60
I-
-----------------------
------------------------
-1
3--
GA
GE
8
40
~-t
--G
AG
E9
• =2
0-JI
IIlIIC~
• =-JIIIlI
IC ::1.
Z0
w
~....
.,J
~ trl
-2
0
-40
24
20
1612
84
-6
0L
-I
~
o
TIM
E(h
ours
)
Fig
ure
29.
Mea
sure
dS
trai
nV
aria
tion
s,S
egm
ent
33,B
otto
mF
lan
geG
ages
,11
/18/
89.
~ .-..
,'- I"
;.
.1.'-
.,<1
," \~.

-60
~ ".-
...
'-=-
('-.
)1~
80
I~
GA
GE
16
0~
-+-
GA
GE
2
40r
GA
GE
3
•-
GA
GE
4
=-II
IIIC
"--
20
~---
---G
AG
E10
• =I
-A-
GA
GE
12-II
IIIC ::1
.
Z0
w
~-2
00
0
rJ:J
-40
28
24
20
1612
84
-8
0"
,---L
-..-.
.L-
J
o
TIM
E(h
ours
)
Fig
ure
30.
Mea
sure
dS
trai
nV
aria
tion
s,S
egm
ent
33,T
opF
lan
ge
Gag
es,
11/1
9/98
.

60
r
---B
--
GA
GE
8
40
~-t
-G
AG
E9
• =2
0..... "• =...... ::1
.
Z0
V.)
~\0
~-2
0
-40
.-
28
24
20
1612
84
-6
0I!!
),
I---J
o
TIM
E(h
ours
)
Fig
ure
31.
Mea
sure
dS
trai
nV
aria
tion
s,S
egm
ent
33,B
ott
om
Fla
ng
eG
ages
,11
/19/
89.
~
~
~ '-.:
.-,., .L
~)
,,,,
I

-20
~ ,,-...
.,~
30
l',-
~.....
,...'.,
.,
I-B
-G
AG
E3
20
,-+-G
AG
E4
GA
GE
11
•G
AG
E12
----
f,/
=1
0.~ "-
I---
---G
AG
E13
• =.~
I-A
-G
AG
E14
:1.
Z0
~
~0
~ rJj
-10
24
20
1612
84
-3
0l-
,
o'
TIM
E(h
ours
)
Fig
ure
32.
Mea
sure
dS
trai
nV
aria
tio
ns,
Seg
men
t48
,T
opF
lan
ge
Gag
es,
11/1
7/89
.
30
r-
------------------------
--
----
---------
~
GA
GE
7
20
1--+
-G
AG
E8
GA
GE
9
• =.,.1
0
" =.,. :1-
Z0
t~ ~ rJ:
J-1
0-
~fllllllllllir"
-20
24
20
1612
84
-3
0I
--L
--
L--
--.J
o
TIM
E(h
ours
)
Fig
ure
33.
Mea
sure
dS
trai
nV
aria
tion
s,S
egm
ent
48,
Bot
tom
Fla
nge
Gag
es,
11/1
7/89
.I~
...-..,
'-.,
.'''-
'
,...,
'..I
'

~ c
30
1:'\'r
<~I#
,
I--8
-G
AG
E3
20
j-+
-G
AG
E4
GA
GE
11
•,
GA
GE
12/~-~~"
=1
0.,..
."-
I---
---G
AG
E13
• =.,...I
-A-
GA
GE
14::1
.
Z0
~
~N
~ rJJ
-10
-20
24
20
1612
TIM
E(h
ours
)
84
-30
'I
~
o
Fig
ure
34.
Mea
sure
dS
trai
nV
aria
tion
s,S
egm
ent
48,
Top
Fla
ng
eG
ages
,11
/18/
89.
30
I-&
-G
AG
E7
20i-
t-G
AG
E8
I
GA
GE
9
• =1
0.~ ". =•....c :::!
.
Z0
~
~w
~-1
0rJ
l
-20
24
20
1612
84
-30
'--l-
o
TIM
E(h
ours
)
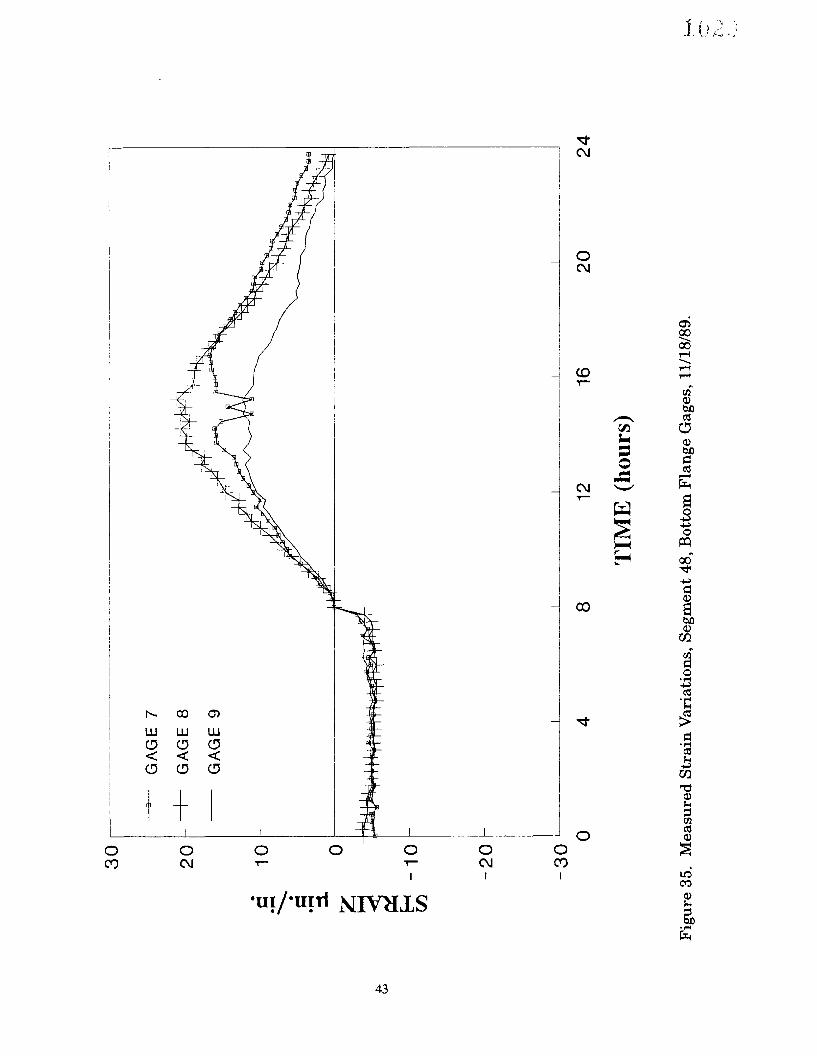
Fig
ure
35.
Mea
sure
dS
trai
nV
aria
tion
s,S
egm
ent
48,
Bo
tto
mF
lan
ge
Gag
es,
11/1
8/89
.~ .-
"",
~-..
.,..
t\)

~ -...
"'-= ..
,N --
" ~
30
I--i3
-G
AG
E3
20
1-1-
GA
GE
4
GA
GE
11
GA
GE
12•
10
=.~
IG
AG
E13
'"• =I
--b
-G
AG
E14
-lilii
ii ::1.
0Z ~
1--"
.-~"
--~
t
~-1
000
-20
28
24
20
1612
84
-30
'~
o
TIM
E(h
ours
)
Fig
ure
36.
Mea
sure
dS
trai
nV
aria
tion
s,S
egm
ent
48,
Top
Fla
ng
eG
ages
,11
/19/
89.
30
I-B
-G
AG
E7
20
,--+-G
AG
E8
IG
AG
E9
• =1
0eJ
IIIIIII
~. =eJIIIIIII ::1.
Z0
~~
VI
~-1
0rJ
)
-20
28
24
20
1612
84
-3
0L
.---
-L
---
l...
.--
L-
__~~
_-.J
o
TIM
E(h
ours
)
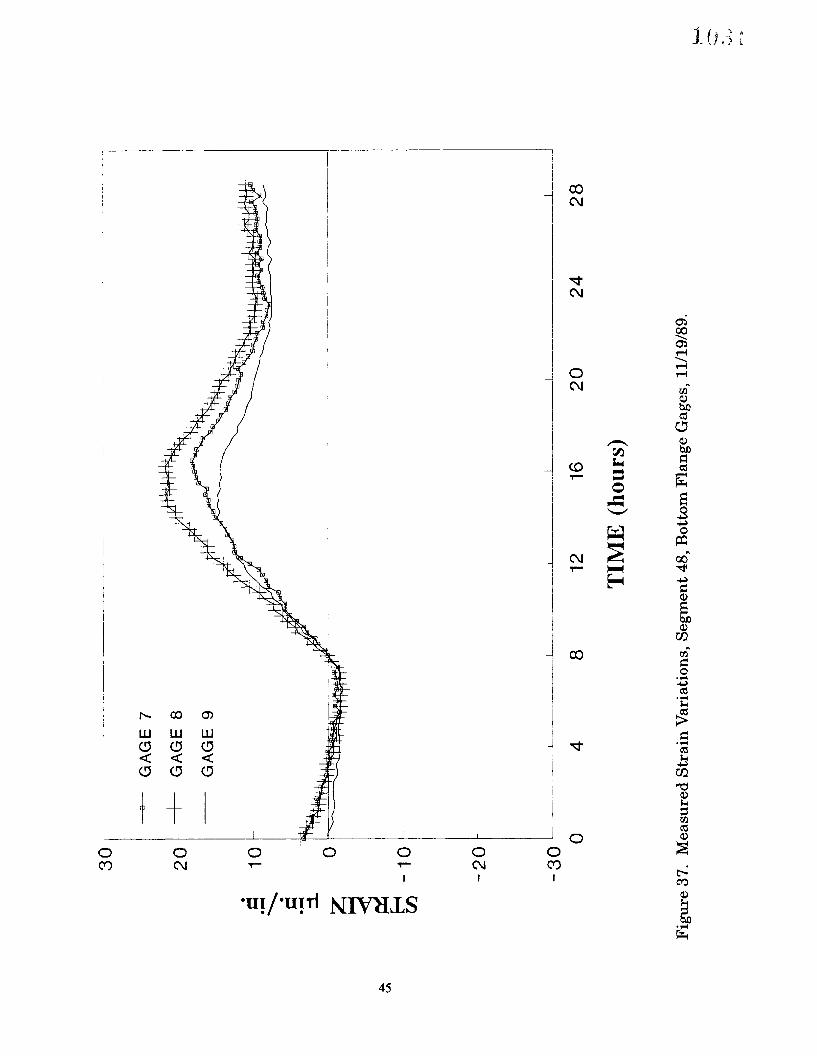
Fig
ure
37.
Mea
sure
dS
trai
nV
aria
tion
s,S
egm
ent
48,
Bo
tto
mF
lan
ge
Gag
es,
11/1
9/89
.~ ,,-
....
~ ...,i
./

between gages across the flange during the afternoon hours. In particular, gages 2and 4, located over the webs of the southbound girder, displayed larger relative tensile strains between 12:00 and 16:00 hr than did gages 3, 12, and 10, which werelocated between webs and at the closure pour. In contrast, gage 1, located at the extreme western edge of the top flange, exhibited relative compressive strains on theorder of 20 microstrains between the same hours, after which tensile strains wererecorded over the remainder of the day.
Figure 27 shows that similar strain behavior occurred in the bottom flange ofsegment 33. The strain response recorded at the bottom flange of the southboundgirder was nearly identical with that measured in the top flange. Again, largejumps in the data were observed during the morning hours. Both gages 8 and 9 recorded similar strains during the morning, but after 12:00 hr, the measured strainsdiverged and a difference of approximately 10 microstrains was reflected betweenthe two gages. Gage 9, located near the inside web of the southbound girder, underwent larger relative tensile strains than gage 8, which was located between webs.
Strains measured in the top flange on November 18 are presented in Figure28. As expected, the trends in overall thermal strain response were similar to thoserecorded on the previous day. The top flange gages reflected relative compressivestrains during the morning hours, the largest of which was approximately 20 microstrains. Again, significant variations in strain readings were observed at locationsacross the flange during the afternoon. Web gages 2 and 4 recorded tensile strainvariations of up to 25 and 35 microstrains, respectively. Strains measured at gage1, on the other hand, reflected relative compressive strains that varied from approximately 50 to 35 microstrains between 14:00 and 24:00 hr. Little difference instrain response was observed between gages 3 and 12, and gage 10, located at theclosure pour, recorded relative compressive strains during the latter part of the day.
Strains measured at the bottom flange on November 18 are presented in Figure 29. It is seen from this figure that the strain variations measured in the topand bottom flange were again similar and reflected the ambient temperaturechanges that occurred during the day. Though the magnitudes of the relativestrains recorded by gages 8 and 9 were smaller than those recorded on the previousday, the overall trends in strain response were largely similar. During the morninghours, nearly identical strains were measured at the two gages; during the afternoon, noticeable differences were observed. As was noted for the November 17data, gage 9, nearest the web, exhibited larger relative tensile strains. In this case,however, the magnitude of the difference between gages was, at most, 5.0 microstrains.
Figure 30 shows the top flange strain data recorded on November 19. Examination of this figure indicates that the trends in measured strain response closelymatch those recorded on the previous day and significant variations were observedbetween gages. For example, differences in relative compressive strains on the order of 10 to 20 microstrains were noted between adjacent gages 1 and 2 during themorning hours. As was shown in Figures 26 and 28, strains recorded at gage 1 exhibited somewhat independent behavior relative to the other top flange gages. At
46

this location, relative compressive strains up to approximately 60 microstrains wererecorded during the afternoon hours. Again, it may be seen that only small differences in strain response were measured on successive days between web gages 2and 4 and between gages 3 and 12.
Strains measured in the bottom flange on November 19 are presented in Figure 31. The variations in strains recorded at gages 8 and 9 were again similar tothose recorded on the preceding days. In contrast to the data presented before,there was little difference in measured strain response between gages during theafternoon hours. In fact, slightly larger compressive strains were recorded at thegage near the web. Relative to 8 A.M., compressive strains of approximately 18 microstrains were measured during early morning hours and tensile strains of up to10 microstrains were observed during the afternoon.
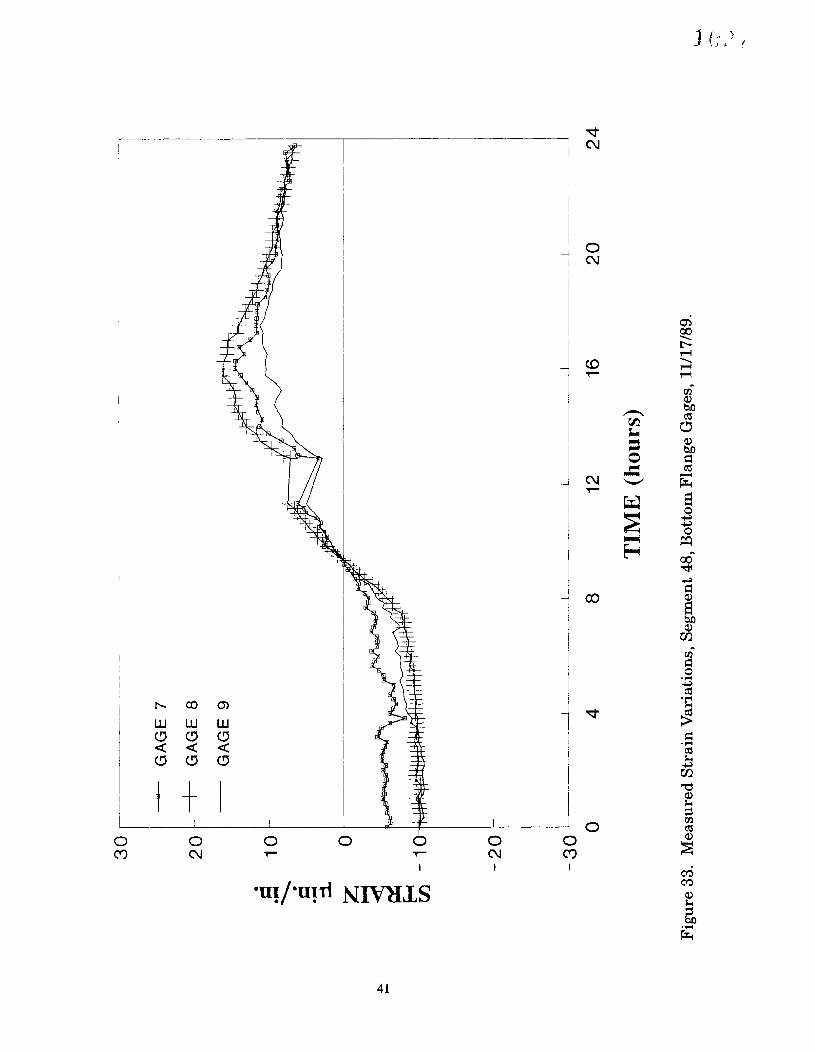
The straiD. data recorded at quarter-span segment 48 are presented in Figures 32 through 37. Figure 32 shows the strain response data recorded on November 17, at top flange gages 3,4, and 11 through 14, most of which are located in thenorthbound portion of the segment. Figure 33 presents the strain data recorded onNovember 17, at bottom flange gages 7, 8, and 9, located in the southbound portionof the segment. Strain data recorded on November 18 are plotted for the top andbottom flange gages in Figures 34 and 35, respectively. Similarly, Figures 36 and37 present the top and bottom flange strains recorded on November 19.
An examination of Figure 32 indicates that strain variations measured in thetop flange of segment 48 were similar to those observed at segment 33. It may alsobe seen that these data did not exhibit the large jumps that were observed at segment 33. This would seem to indicate that the stay tensioning or traffic that causedthese anomalies occurred near the pier segment and had little effect on the rest ofthe structure. Relative compressive strain variations were recorded during themorning hours. During the afternoon, a dissimilar strain response was recorded between gages across the top flange. Gage 12, located between webs in the northbound girder, and gage 13, located above the outer web of the girder, recorded similar magnitudes of relative tensile strain between 12:00 and 20:00 hr. Gages 4 and11, located above the interior webs of the two girders, showed similar variations instrain, which ranged up to approximately 10 microstrains. Gage 3, located abovethe outer web of the southbound girder, recorded relative compressive strains ranging up to approximately 20 microstrains during the latter half of the day. Slightlysmaller compressive strains were measured at gage 14, located at the extreme eastern edge of the top flange.
Strain data recorded in the bottom flange of segment 48 are shown in Figure33. A comparison with Figure 32 shows that similar strain response was measuredbetween the top and bottom flanges of the segment. Relative compressive strainsranging up to 10 microstrains were recorded at gages 7,8, and 9 during the morning hours, and slightly larger relative tensile strains were observed during the afternoon. Data from gages 8 and 9 reflected a similar measured response during themorning hours, and gage 7, located near the outer web of the southbound box girder, recorded slightly smaller compressive strains. The measured strain response
47

showed dissimilarities between gages, but the magnitudes of these differences weresomewhat smaller than those observed between gages in the top flange.
Figure 34 presents the strains measured in the top flange of segment 48 onNovember 18. Although the overall trends of the strain variations were similar tothose recorded on the previous day, the magnitudes of the relative compressive andtensile strains were somewhat smaller. A dissimilar strain response between gageswas again observed during the afternoon hours. The strain response recorded at amajority of the gages reflected relative tensile strains between 8:00 and 20:00 hr.During this period, strains on the order of 10 to 15 microstrains were measured atgages 11 and 12. Web gages 4 and 13 showed similar trends in measured strain response, but the magnitudes of relative tensile strain were slightly smaller than atthe gages between webs. Again, after 8 A.M., gage 3 recorded noticeably largercompressive strains than the other gages.
Figure 35 presents the strains measured in the bottom flange of segment 48for November 18. An examination of this figure along with Figure 34 illustratesthat a similar strain response was again measured in both the top and bottomflanges. It may also be seen that little change in relative strains was observed between 0:00 and 8:00 hr. There appeared to be smaller differences in strain responsebetween gages during the morning hours, whereas more noticeable dissimilaritiesoccurred during the afternoon. At 15:00 hr, relative tensile strains of approximately20 and 10 microstrains were recorded at gages 8 and 9, respectively:
Figures 36 and 37 present the measured strain response from the top andbottom flanges of segment 48 recorded on November 19. These figures show thatsimilar strain variations were recorded by the individual gages on each day of thestudy. As shown in Figure 37, gage 3 again recorded noticeably different strainvariations during the latter half of the day. Similar trends in strain variation weremeasured at gage 4 and gages 11 through 14. At the bottom flange, gages 7, 8, and9 recorded tensile strain variations on the order of 10 to 20 microstrains for most ofthe day. As depicted in Figure 37, differences of approximately 5 to 10 microstrainswere observed between gages during the afternoon hours.
The measured strain data presented in Figures 26 through 37 reflected thechanges caused by the ambient diurnal temperature variations that occurred during the study. Examination of the relative strain variations demonstrated consistencies that served to confirm the validity of the measured data. Apart from theanomalies observed at segment 33, consistent strain data were recorded at the twoinstrumented segments and both portions of the twin box girder showed similarstrain behavior. Individual strain gages recorded comparable strain variations oneach of the 3 days, and similarities in measured response were observed betweengages at corresponding locations within the cross section. Strains measured atgages located above the webs in segment 33, for instance, were similar on each ofthe 3 days. During the morning hours, there was little variation between gages ateither segment. The dissimilarities between gages observed during the afternoonsuggested the presence of differential heating. As would be expected, the differ-
48

ences in measured response between gages were greater in the top flanges of thegirders.
Comparison of Computed and Measured Thermal Strains
Temperature-induced stresses were calculated for the study period, and thecorresponding thermal strains are shown in Figures 38 through 43. The calculatedstrain values are plotted as daily relative changes in strain, similar to the measuredstrain data. Figure 38 shows the predicted strain variations for the top and bottomflanges of segment 33 calculated for November 17. Figure 39 presents the strainvariations calculated on the same day for the top and bottom flanges of segment 48.Calculated strain variations for November 18 are shown for segments 33 and 48 inFigures 40 and 41, respectively. Similarly, the strain variations predicted for thetwo segments on November 19 are shown in Figures 42 and 43.
Examination of the calculated strains presented in Figure 38 indicates thatsignificantly different strain variations were predicted for the top and bottomflanges of the box girder. Relative compressive strains in the top flange were shownto decrease between midnight and 9:20 A.M. This was followed by an increase inrelative compressive strain during the afternoon, which peaked at 16:00 hr. The opposite was tIUe for the bottom flange, where relative tensile strains were shown todecrease during the morning then increase during the afternoon, peaking at 16:00hr. Relative compressive strains on the order of 10 to 18 microstrains were predicted for the top flange, and tensile strains of approximately 22 and 18
60
-a- Top Flange
40 --+- Bottom Flange
:=..."" 20
==....::L
Z 0
~~ -20r:J':J
-40 ~
-60 1
0 4 8 12 16 20 24
TIME (hours)
Figure 38. Predicted Strain Variations, Beam Element Model, Segment 33,11/17/89.
49
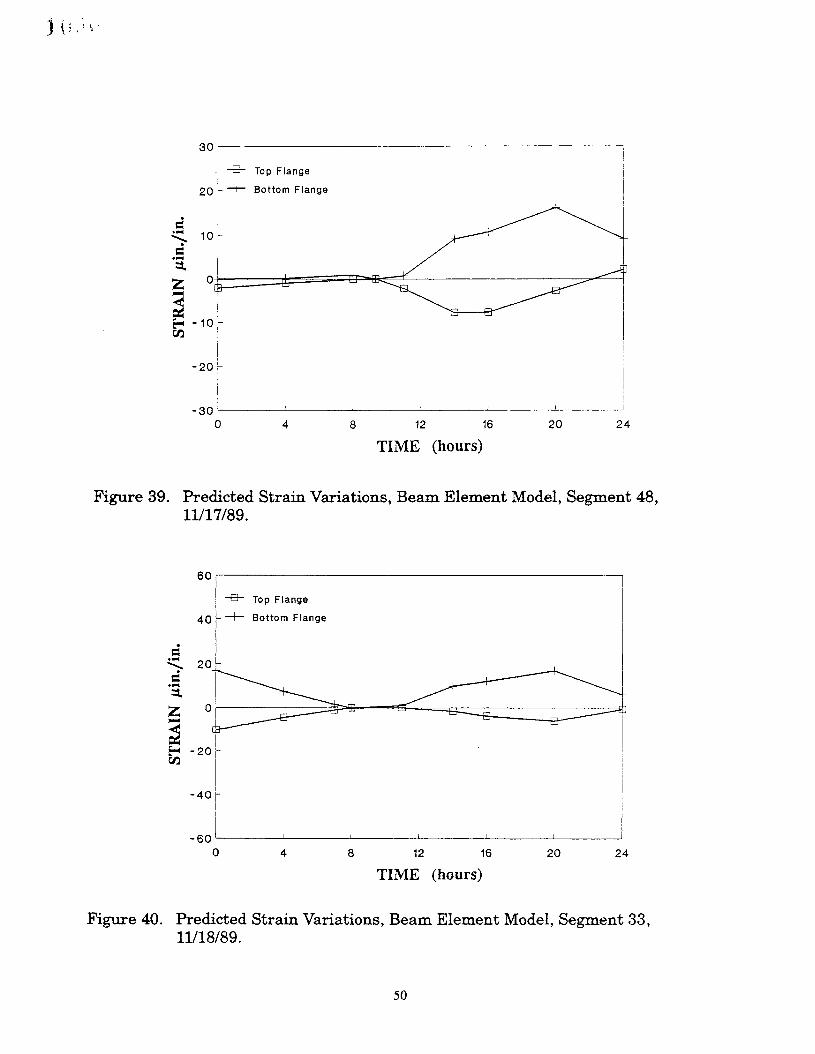
30,
I ....0--I '-' Top FlangeI
20 ~ --r- Bottom Flange
2420161284
-20II
- 30 I'---_-----I..__~_ __'________L....___ _____J.___ ___'
oTIME (hours)
Figure 39. Predicted Strain Variations, Beam Element Model, Segment 48,11/17/89.
60
-B- Top Flange
40 --T- Bottom Flange
==.- 20"'"'==.--::s..Z 0
~~ -20r:J':J
-40 ~-sJ
0 4 8 12 16 20 24
TIME (hours)
Figure 40. Predicted Strain Variations, Beam Element Model, Segment 33,11/18/89.
50

Top Flange
Bottom Flange
I
-10 ~
30,
I~i I
20 1-1
I
== I, 10~
== I
.;.Z Of-----=====~=====F.iir_H:i_~====~;;:::;oo--~~""""_;;;;::~-....:::=::.-.;;;;;;;:::r~;:::;::::::;;-----~
~en
-20
- 30 L-__--L. -L- -l--.. .l...--__---.l.- ---J
o 4 8 12 16 20 24
TIME (hOUfS)
Figure 41. Predicted Strain Variations, Beam Element Model, Segment 48,11/18/89.
80 r--------------------------,
-B- Top Flange60
-r- Bottom Flange
== 40.-""== 2.;.Z 01----------:~..-=;;;...~:----------1~~~:-------1
~ -20~rJ:J
-40
-60
282420161284
- 80 '-__"---__"'---__.J---__..l...--__..l.--__~__...L__---J
o
TIME (hOUfS)
Figure 42. Predicted Strain Variations, Beam Element Model, Segment 33,11/19/89.
51
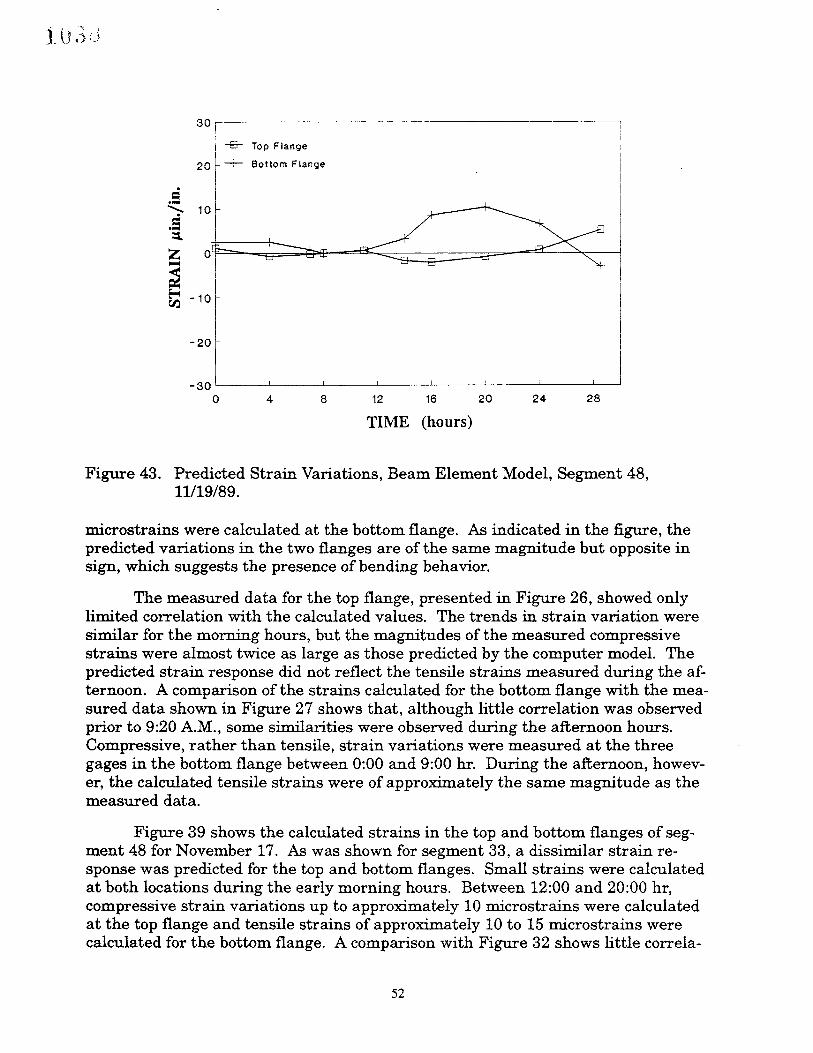
20 --r- Bottom Flange
-20
282420161284
-30 l.-.--.-__L-__.l.-__.l.-__..l..--.__..l..--.__...I-.--__...l.------J
o
TIME (hours)
Figure 43. Predicted Strain Variations, Beam Element Model, Segment 48,11/19/89.
microstrains were calculated at the bottom flange. As indicated in the figure, thepredicted variations in the two flanges are of the same magnitude but opposite insign, which suggests the presence of bending behavior.
The measured data for the top flange, presented in Figure 26, showed onlylimited correlation with the calculated values. The trends in strain variation weresimilar for the morning hours, but the magnitudes of the measured compressivestrains were almost twice as large as those predicted by the computer model. Thepredicted strain response did not reflect the tensile strains measured during the afternoon. A comparison of the strains calculated for the bottom flange with the measured data shown in Figure 27 shows that, although little correlation was observedprior to 9:20 A.M., some similarities were observed during the afternoon hours.Compressive, rather than tensile, strain variations were measured at the threegages in the bottom flange between 0:00 and 9:00 hr. During the afternoon, however, the calculated tensile strains were of approximately the same magnitude as themeasured data.
Figure 39 shows the calculated strains in the top and bottom flanges of segment 48 for November 17. As was shown for segment 33, a dissimilar strain response was predicted for the top and bottom flanges. Small strains were calculatedat both locations during the early morning hours. Between 12:00 and 20:00 hr,compressive strain variations up to approximately 10 microstrains were calculatedat the top flange and tensile strains of approximately 10 to 15 microstrains werecalculated for the bottom flange. A comparison with Figure 32 shows little correla-
52
tion between measured and predicted strain variations for the top flange. The calculated relative compressive strains did not reflect the relative tensile strains measured by a majority of the top flange gages during the afternoon. The strainspredicted at the bottom flange showed reasonable correlation with the measureddata from Figure 33, but the calculated strain values are noticeably smaller between midnight and 11 A.M.
The strain variations calculated at segment 33 for November 18 and 19 arepresented in Figures 40 and 42. It may be seen from these figures that the predicted strain variations were similar to those calculated on the preceding day. Thestrain variations at the top and bottom flanges were again similar in magnitude butopposite in sign. Relative compressive strain values of less than 10 microstrainswere calculated for the top flange, and relative tensile variations up to approximately 15 microstrains were determined for the bottom flange. The analytical values again show only limited correlation with the measured strain data, presented inFigures 28 through 31. For the top flange, a reasonable correlation was observedbetween the strain variation trends during the early morning hours, but again, thecalculated strains did not reflect the relative tensile variations measured during theafternoon. The strain variations calculated for the bottom flange showed limitedagreement with the measured data during the afternoon, but the overall correlationwas poor.
Figures 41 and 42 present the strain responses calculated at segment 48 forNovember 18 and 19. An examination of Figure 41 indicates that very small variations of strain were predicted at the top and bottom flanges of the segment on November 18. The strain variations calculated for November 19, shown in Figure 42,were similar to those calculated for November 17, where relative strains of lessthan 10 microstrains were predicted for the top and bottom flanges. Correlation between the measured data and predicted strain values was also limited on thesedays. The strain response calculated for the top flange again did not agree with therelative tensile strains measured by a majority of the gages. The relative tensilestrains predicted at the bottom flange showed better comparison with the measureddata on both days.
As previously indicated, the thermal strains in the cable stays were approximated based on temperature data measured by pylon thermocouples. For the calculated strain data presented in Figures 38 through 43, it was assumed that thecable-stay strands, which are encased in l-in-thick grouted polyethylene pipe, didnot undergo large daily temperature variations. The temperature variations recorded by thermocouples located at the interior of pylon segment D6 were assumedto be representative of those that may have occurred in the cable stays. In order toassess the possible implications of this assumption, the response of the box girdersegments was calculated considering larger variations in cable-stay strain based onthe temperature variations recorded at the southwest corner of the pylon. The assumed cable-stay strains used in calculating the box girder thermal response areshown in Figure 44 for November 17. Gages 48 and 18W denote the number andlocation of the pylon thermocouples from which the assumed temperature variations were taken.
53

140
120 GAGE 1SW
GAGE 45
==100
...." 80
==....::l 60Z..-I;a 40
~ 20rJj
0
-20
-400 4 8 12 16 20 24
TIME (hours)
Figure 44. Assumed Cable-Stay Strain Variations, 11/17/89.
The box girder strain responses calculated using the two sets of assumedcable-stay strains are compared in Figures 45 and 46. It is seen from Figure 45that the assumed thermal strains in the cable stays have a considerable effect onthe calculated strain values at segment 33. It is also seen that the overall trendswere simil~r for the two sets of data, but the larger cable-stay strains resulted insignificantly larger magnitudes of relative strain in the box girder. At 16:00 hr,compressive strains of approximately 30 and 50 microstrains were calculated forthe top and bottom flanges, respectively, using the assumed stay strains from pylonthermocouple 1SW. The larger cable-stay strains did not improve the correlationbetween measured and predicted response since the overall trends of the predictedstrain variations remained unchanged.
Similar comparisons are made in Figure 46 for the strain response calculatedat segment 48. Again, the assumed cable-stay strains resulted in significant differences at both the top and bottom flanges. For this segment, the larger cable-staystrains led to a decrease in the predicted strain values, particularly during the latter half of the day. In fact, the bottom flange strains calculated using the strainscorresponding to thermocouple lSW reflected a relative compression on the order of5 to 10 microstrains, whereas those calculated using cable-stay strains from thermocouple 4S yielded tensile strains ranging between 5 and 15 microstrains. Although the assumed cable-stay strains resulted in large differences between predicted strain response, the strain variations determined using the larger staystrains did not accurately reflect the measured behavior.
54

Ol---------~~~~L...--------~::...----~~
601
I Top (1SW Strains)
-*- Bottom (1SW Strains)
40 -*- Top (4S Strains)
-+- Bottom (4S Strains)
-20
2420161284
- 40 L--__----l ---i- ---L... ------'-- --'-- ___
o
TIME (hours)
Figure 45. Comparison of Predicted Strain Variations Based on Assumed CableStay Strains, Segment 33, 11/17/89.
-20
30 r----------------------------,
I
I/\ I
~~ i
~
Top (1SW Strains)
20 --* Bottom (1SW Strains)
-*- Top (4S Strains)
4- Bottom (4S Strains)
2420161284
- 30 II....--__..l..---_--"-__--!..--_---l..__--L....-.__
oTIME (hours)
Figure 46. Comparison of Predicted Strain Variations Based on Assumed CableStay Strains, Segment 48, 11/17/89.
55

A more detailed finite element model was used in order to verify the responsepredicted by the beam element model and account for local behavior within the boxgirder. This model, shown in Figure 47, was developed by Yen (1992) for dynamicanalysis of the James River Bridge. The box girder cross section was modeled withplate elements of varying thickness, and the pylon and cable-stay members wererepresented as beam elements. Because of size restrictions, only one quarter of thebridge was modeled, so appropriate boundary conditions were applied along lines ofsymmetry. Changes in temperature, obtained from measured thermocouple data,were applied to the plate elements, and the resulting element stresses were calculated at locations corresponding to box girder segments 33 and 48.
Figure 48 shows the locations of the nodes corresponding to points on thecross section of box girder segments 33 and 48. As shown in Figure 48(a), nodes260, 190, 155, 120, 85, and 15 represent locations in the top flange of segment 33,moving in the direction from the center line of the structure, at the cable stays, toward the outer flange. Similarly, nodes 435, 400, and 365 represent locations in thebottom flange of this segment. In Figure 48(b), nodes in the top flange of segment48 are designated as numbers 252, 182, 147, 112, 77, and 7, in sequential orderfrom the center line of the structure toward the outer flange. Likewise, nodes 427,392, and 357 represent locations in the bottom flange of segment 48.
Figure 49 presents the strain variations obtained from the plate elementmodel at the various nodes within the top flange of segment 33 for November 17. Itis clear that significant differences in strains were predicted at locations across thedeck. The overall trends in response were similar to those calculated using the simpler beam element model, however. Decreasing relative compressive strains werepredicted during the morning hours, followed by an increase in compressive strainsduring the afternoon. It may also be noted that the largest strains were calculatedat the nodes nearest the cable stays. The corresponding strain variations calculatedat the bottom flange nodes are shown Figure 50. Once again, the strain variationspredicted by the plate element model closely resemble those predicted by the simpler beam element model. Differences in relative strains of up to 20 microstrainswere observed between nodes, where the largest strain magnitudes were also calculated at nodes nearest the cable stays.
Similar plate element model results are shown for the top and bottom flangesof segment 48 in Figures 51 and 52, respectively. As was shown for segment 33, significant differences between strain variations were observed at the various locationsacross the flanges. The largest strain magnitudes were predicted during the afternoon hours at the nodes nearest the cable stays. The calculated strain variationsfor the top and bottom flanges of this segment were also similar to those predictedusing the beam element model.
Strains calculated using the plate and beam element models are compared inFigures 53 and 54. Figure 53 compares the strains calculated for the top andbottom flanges of segment 33, in which the plate element model results were averaged over the nodes in the respective flanges. Figure 54 shows a similar comparison of average strain variations calculated for segment 48. Although differences in
56
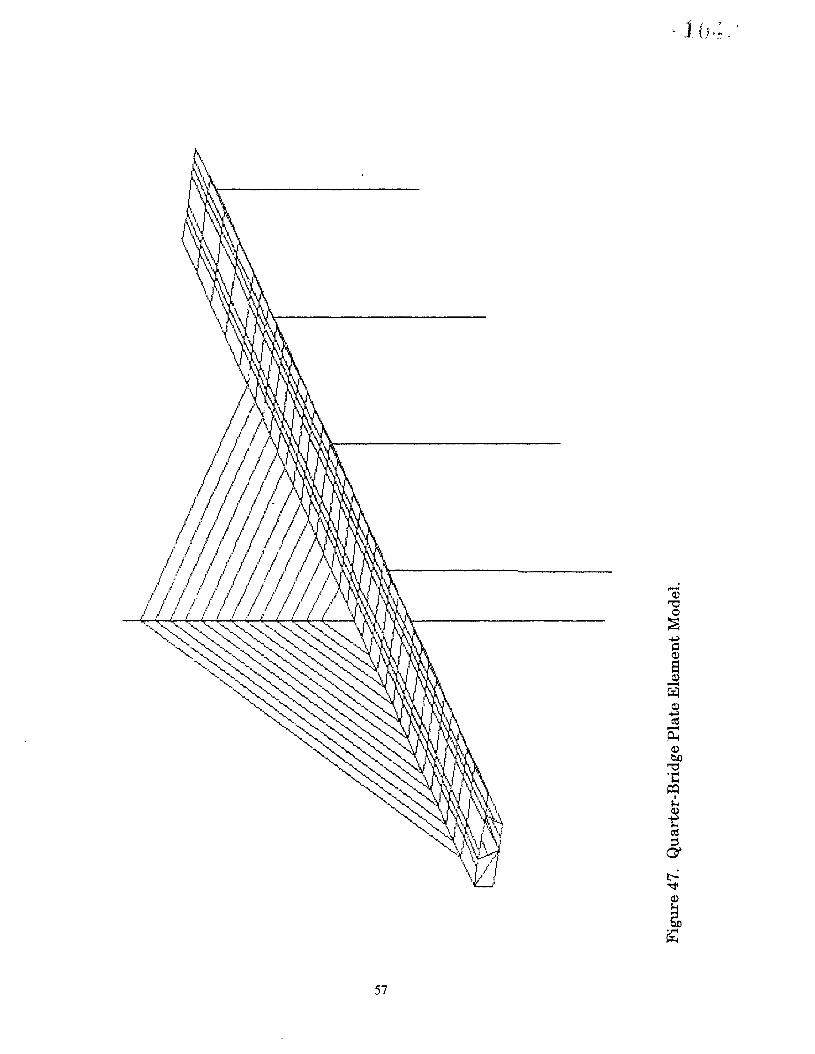
57
j ( 7' t
'~ - lJ ~ ~

<t STRUCTURE
<lSTRUCTURE
\--~
'$ _._~-------......-
---_._---

242016128
10
20 r--I------------------------:
I
c 0,==-;. -10
z=2 -20 -- 260
" -t- 190~r:J'J - 30 --*- 155
I -B- 120 ", i
-40 r~ 85 "_________:
'
I -+- 15 ----------- I
~-50 L-I ~__~ ___l..._ _'_____~ ~
o 4
TIME (hOUfS)
Figure 49. Predicted Strain Variations, Plate Element Model, Segment 33, TopFlange Nodes, 11/17/89.
TIME (hOUfS)
Figure 50. Predicted Strain Variations, Plate Element Model, Segment 33, BottomFlange Nodes, 11/17/89.
59

2420161284
-- 252
-+- 182
--*- 147
-B- 112
---7+- 771\
7-v-
-40
\\
\\\ ~
\ / I
\\ // I
V I
- 50 '-----~------'-----'-----------"------"--------'o
=.:.:::.. -10
=-3-Z -20
~ -30Cfj
TIME (hours)
Figure 51. Predicted Strain Variations, Plate Element Model, Segment 48, TopFlange Nodes, 11/17/89.
20
1
I /~1/-10~/~~ I
-10 -- 427
-+- 392
-20 I 4- 357
o 4 8 12 16 20 24
TIME (hours)
Figure 52. Predicted Strain Variations, Plate Element Model, Segment 48, BottomFlange Nodes, 11/17/89.
60
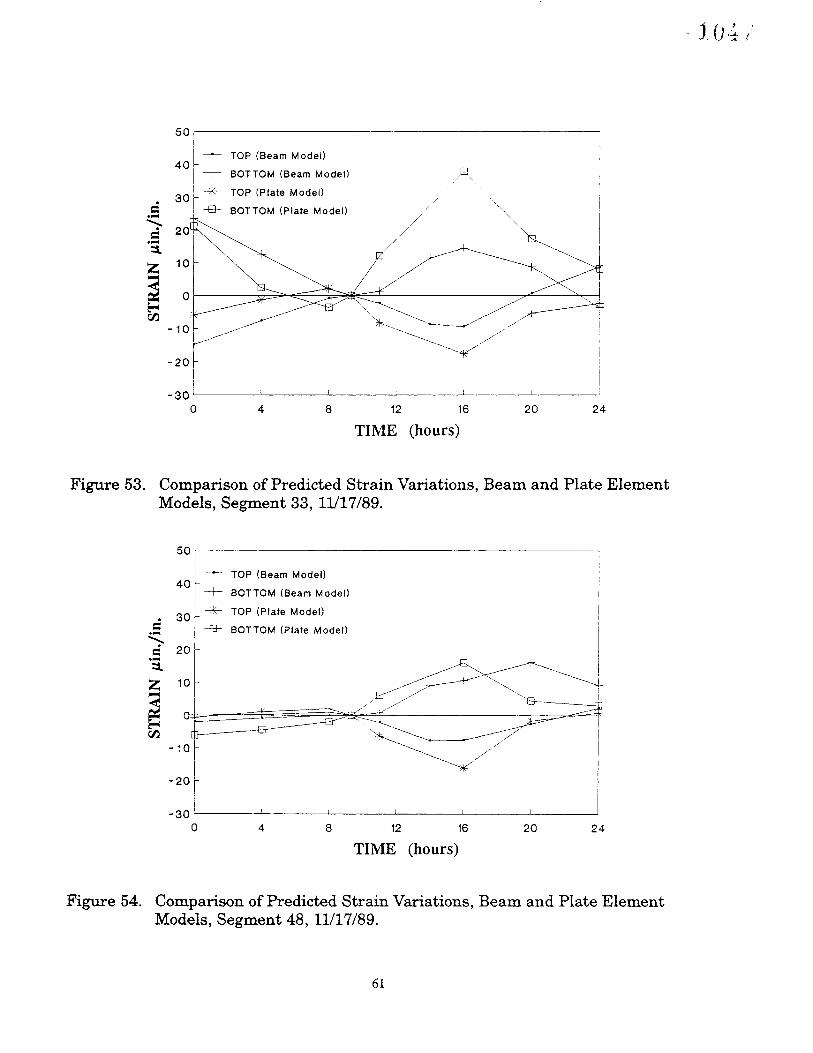
10
-20
-10
50 r-I--------------------------,
I
1
1--- TOP (Beam Model)
40 ~I BOTTOM (Beam Model)
30 ---*- TOP (Plate Model)
:= -B- BOTTOM (Plate Model).."""'-:= 20.3-z
~00
2420161284
- 30 1'-- ~ ~ __'___ ~ ___l._ __'
o
TIME (hOUfS)
Figure 53. Comparison of Predicted Strain Variations, Beam and Plate ElementModels, Segment 33, 11/17/89.
Figure 54. Comparison of Predicted Strain Variations, Beam and Plate ElementModels, Segment 48, 11/17/89.
61

relative strain magnitude were evident between the results of the two models, theoverall trends in strain response are similar. Considering the great difference between the two analysis approaches, it must be concluded that the calculated strainvariations were the best estimates of bridge response that could be obtainedthrough available analytical means.
The large differences between the measured and predicted strain responsesprompted a critical evaluation of the strain-measuring instrumentation and the experimental procedure in general. The measured strains clearly indicate a temperature-driven axial response, so efforts were made to determine if the strains measured by the gages reflected the actual response of the bridge or some othertemperature-induced phenomenon. As discussed previously, corrections were madeto account for transverse gage curvature and the mismatch between coefficients ofthermal expansion of the concrete and reinforcing steel. Other factors that mayhave resulted in temperature-induced apparent strains were identified and systematically eliminated from consideration. Changes in gage factor attributable to temperature have been documented, but variations of less than 1 percent would be expected over the temperature range encountered in the study (Measurements GroupInc.,1983). Imperfect temperature compensation resulting from differences between the individual longitudinal and transverse gages of the gO-degree strain rosettes may have been possible, but it is unlikely that such differences would be consistent at all of the gages. Likewise, accidental thermocouple effects in the gages,attributable to the solder connections of the lead wires, would not have led to consistent variations at each gage. The data acquisition system was designed to operate under a wide range of temperatures. Even if there was some thermal sensitivity in the system, relatively small variations in temperature were observed atlocations of the individual units and the cyclic nature of the temperature changeswere not severe.
Since a reasonable explanation for the measured temperature-inducedstrains could not be identified, it was concluded that the strains measured by thegages do in fact represent the actual bridge response. The consistency with whichstrain variations were recorded at the various gages eliminated the possibility of local malfunctions, such as imperfect bonding between the concrete and gaged rebar.The measured data presented in Figures 26 through 37 indicated consistent globaland local behavior recorded on each of the 3 days of the study. The similarities between the strain variations recorded in the top and bottom flanges of the instrumented segments suggested the presence of a dominant axial response. During theafternoon hours, large differences were observed between gages, especially those inthe top flange. This behavior could be attributed to differential heating effects,such as localized flange bending or local strains attributable to the nonlinear component of the thermal gradient. Such temperature differences were consistentlymeasured at locations within the cross section during the study. The strain response measured at gage 1, in segment 33, and at gage 3, in segment 48, were significantly different from those measured by the other gages in respective flanges,suggesting the possibility that certain portions of the bridge are subject to isolated
62

thermal variations. Such effects may be influenced by the parapet walls or featureswithin the structure that are not readily apparent.
The large amounts of internal and external prestressing steel within the boxgirder probably had a significant influence on the overall thermal response of thestructure. The internal strands, located in the top flange above the webs, were subject to the same temperature changes as the concrete. Assuming the prestressingsteel has a larger coefficient of thermal expansion than the surrounding concrete, atemperature increase would result in a relative tensile strain variation, similar tothat observed in the measured data during the afternoon hours. The external prestressing within each of the main-span box girders consists of 24 tendons, each having 12 strands 0.6 in in diameter. These strands are effectively insulated from thesurrounding environment, so temperature changes in the box girder would generatesignificant restraining forces during the prestressing. The thermal effects of theprestressing would be difficult to model analytically, and the accuracy of the resultswould be limited.
Comparison of the measured and calculated results showed that the computer models were limited in their ability to predict the thermal response of such acomplex structure. A number of assumptions were made in the analyses. First, theanalysis itself involved integrating piece-wise linear temperature distributions overthe cross section, which could not account for local variations in temperature. Theactual temperature distributions were shown to vary significantly across the sectionin Figures 23 and 24. As mentioned previously, approximate cross sections were developed to simplify the calculations for the thermally induced axial strains and curvatures. The thermal strains in the cable stays were assumed to follow the dailytemperature variations recorded in the pylon. Analysis results from the beam model yielded average strains at the top and bottom flanges of the box girder and didnot account for local effects, such as shear lag.
Although these factors limited the accuracy of the predicted strains, the overall strain response was substantiated by the results of the plate element model.Though this model was considerably more detailed and reflected differences instrain variations across the deck, it was also limited in its ability to predict themeasured strain response. Temperature changes were applied uniformly throughthe depth of the plate elements such that the effects of a thermal gradient throughthe depth of the top flange were not considered. In order to introduce the variationof thermal strain through the flange, the plate element model would have to beloaded with a curvature induced by the linear part of the strain gradient. The finiteelement model used for this study precluded the incorporation of such a loading.
Pylon Segments
Measured Temperature Variations with Time
Temperature data recorded by the thermocouples in pylon segment D6 areshown in Figures 55 through 58. The variations in temperature are plotted over
63

)' {. -- c-,
_ , --' ,,}; 1
18
GAGE 2E16
GAGE 2W' \I ,
~ '"'U
I I
e 14'-"
~ 12 ' \
~
~ 10!
!
~I
"-/
Q. 8"- /
"-I
~/
----~ 6~
4~I
2'0 8 16 24 32 40 48 56 64 72 80
TIME (hours)
Figure 55. Measured Temperature Variations, Pylon Segment D6, Gages 3N & 3S.
GAGE 3N
GAGE 3S
20 [
18
~
16Ue'-"
~ 14
~
~12
\\~ 10Q..~~ 8~
I6,4 1
0 8 16 24 32 40 48 56
I \
I \I \
/
64 72 80
TIME (hours)
Figure 56. Measured Temperature Variations, Pylon Segment D6, Gages 2E & 2W.
64

GAGE 1NE
GAGE 1NW
GAGE 4N
20
18
~ 16UQ'-"
~14
~ 12
~ 10~c.. 8~~~ 6
4
20 8 16 24 32 40 48 56 64 72 80
TIME (hOUfS)
Figure 57. Measured Temperature Variations, Pylon Segment D6, Gages lNE,INW, &4N.
20r--------------------------,
GAGE 4S
18~", ,~
- 16~ "!~ (\ (\e r f1'\-'-~ f \ r ~~ 14 / l \ \ -., /..--r-'\ ~ ,/~I \ \
I ~ \ 1--1 _ \ • ,
(
I \ ~ I ~ -~ \-- i ~,I \ ~;:J ! \, "I 1 \\, L ---- \ \
~~ 12K, / \. \ ! r \ " ........ -/ ~ '\l '~~ I \ ... / ,. \ ". ,i r .....--\--10~\\ if •• i~ ,II, i ~ ~
~ I \,'" l! \ ~\ Ii ,f " \ I ' \ ....
~ 8~\;J/'\,... II \~\J11! '~~ 6 ~ ~ \\ ! =GAGE 1SE
GAGE 1SW4--
8072645648403224168
2 '-----'-----'------J.__....J-.--._--'II..--_-l--_-.l..-_----'-,__.....I....--_--l
o
TIME (hOUfS)
Figure 58. Measured Temperature Variations, Pylon Segment D6, Gages ISE,ISW, & 48.
65

}' { ... ,. _tJ J l-:
the same period as previously shown for the box girders. Figure 55 presents thetemperatures recorded at the east and west faces of the segment, and Figure 56shows temperatures recorded at the north and south ends (see Figure 13 for thermocouple locations). From Figure 55 it is seen that daily temperature variations ofapproximately 4 degrees C were recorded at the eastern side of the segment andvariations between 5 and 8 degrees C were recorded at the western side. Daily temperature extremes occurred at the eastern exposure at approximately 6:00 and12:00 hr, and temperature extremes at the western exposure occurred at 7:00 and15:00 hr, respectively. The large slopes of the curve representing the temperaturevariation recorded at gage 2W indicates that rapid heating and cooling occurred atthis location. Figure 56 shows the difference between temperatures measured atthe north and south ends of the pylon. Daily temperature variations on the order of6 degrees C were measured by gage 3S, at the south end, and smaller variations ofapproximately 2 degrees C were measured at the north end.
Similar pylon thermal response information is presented in Figures 57 and58. These figures present temperatures recorded at the four corners and the interior of the precast pylon segment. An examination of Figure 57 shows that temperature variations of approximately 6 to 8 degrees C were observed at gage 1NW, in thenorthwest corner of the segment, and smaller temperature changes of 4 to 6 degreesC were observed at gage lNE in the northeast corner. In contrast to the temperatures recorded near the exterior faces, the thermal response measured at gage 4N,located in the interior of the section, did not exhibit diurnal variations. In fact, thetemperature decrease observed at this location and at gage 48, shown in Figure 58,is indicative of the overall cooling trend that took place during the study. Figures56 and 58 show that the largest variations in temperature OCCUlTed at locationshaving southern exposures. Daily changes in temperature on the order of 8 to 10degrees C were recorded at gages ISE and lSW. Although larger temperature variations were recorded at the south-facing locations, a comparison of the thermal datapresented in Figures 57 and 58 indicates that these points cooled to approximatelythe same temperature as the northern portions of the segment. The sharp peaks inthe temperature variation curves indicate the areas of the pylon subject to rapidheating and cooling.
Measured Temperature Distributions Across the Pylon
To facilitate the visualization of the temperature variation across the pylon,color contour plots of the measured temperatures were constructed. Two of themeasured temperature distributions for the pylon are shown as contour plots in Figures 59 and 60. Figure 59 represents the temperature distribution recorded at 8A.M. on November 17, and Figure 60 presents the distribution recorded at 4 P.M.the same day. These times correspond to the approximate times at which the minimum and maximum temperatures were measured in the pylon section at thermocouple lSW. As with the box girder temperature distributions, temperature contours were generated using a finite element model of the cross section in which thenode points corresponded to the location of the thermocouples in segment D6.
66


U_!
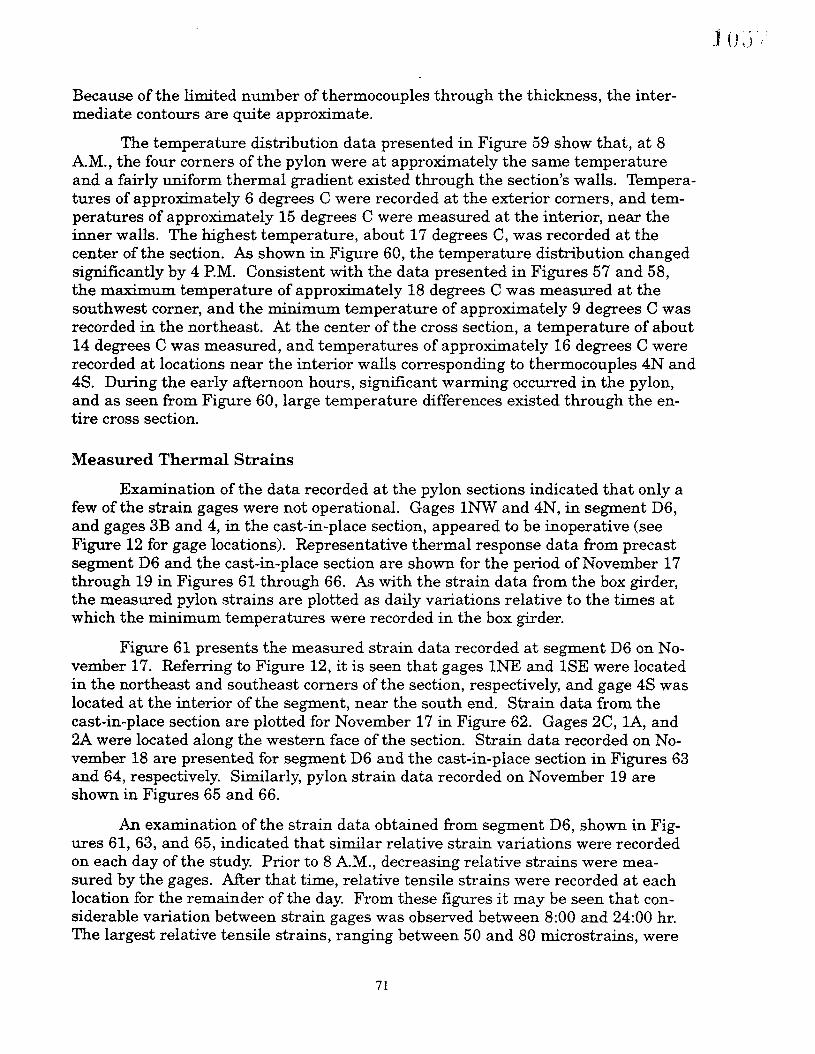
Because of the limited number of thermocouples through the thickness, the intermediate contours are quite approximate.
The temperature distribution data presented in Figure 59 show that, at 8A.M., the four corners of the pylon were at approximately the same temperatureand a fairly uniform thermal gradient existed through the section's walls. Temperatures of approximately 6 degrees C were recorded at the exterior corners, and temperatures of approximately 15 degrees C were measured at the interior, near theinner walls. The highest temperature, about 17 degrees C, was recorded at thecenter of the section. As shown in Figure 60, the temperature distribution changedsignificantly by 4 P.M. Consistent with the data presented in Figures 57 and 58,the maximum temperature of approximately 18 degrees C was measured at thesouthwest corner, and the minimum temperature of approximately 9 degrees C wasrecorded in the northeast. At the center of the cross section, a temperature of about14 degrees C was measured, and temperatures of approximately 16 degrees C wererecorded at locations near the interior walls corresponding to thermocouples 4N and48. During the early afternoon hours, significant warming occurred in the pylon,and as seen from Figure 60, large temperature differences existed through the entire cross section.
Measured Thermal Strains
Examination of the data recorded at the pylon sections indicated that only afew of the strain gages were not operational. Gages INW and 4N, in segment D6,and gages 3B and 4, in the cast-in-place section, appeared to be inoperative (seeFigure 12 for gage locations). Representative thermal response data from precastsegment D6 and the cast-in-place section are shown for the period of November 17through 19 in Figures 61 through 66. As with the strain data from the box girder,the measured pylon strains are plotted as daily variations relative to the times atwhich the minimum temperatures were recorded in the box girder.
Figure 61 presents the measured strain data recorded at segment D6 on November 17. Referring to Figure 12, it is seen that gages 1NE and lSE were locatedin the northeast and southeast corners of the section, respectively, and gage 48 waslocated at the interior of the segment, near the south end. Strain data from thecast-in-place section are plotted for November 17 in Figure 62. Gages 2C, lA, and2A were located along the western face of the section. Strain data recorded on November 18 are presented for segment D6 and the cast-in-place section in Figures 63and 64, respectively. Similarly, pylon strain data recorded on November 19 areshown in Figures 65 and 66.
An examination of the strain data obtained from segment D6, shown in Figures 61,63, and 65, indicated that similar relative strain variations were recordedon each day of the study. Prior to 8 A.M., decreasing relative strains were measured by the gages. After that time, relative tensile strains were recorded at eachlocation for the remainder of the day. From these figures it may be seen that considerable variation between strain gages was observed between 8:00 and 24:00 hr.The largest relative tensile strains, ranging between 50 and 80 microstrains, were
71

2420161284
GAGE 2E
GAGE lNE
501
l ----- GAGE 1SE40
= 30.-"==
20.-:1-
Z 10....~
...0
1I
E-4I00
-10
-20
-300
TIME (hOUfS)
Figure 61. Measured Strain Variations, Pylon Segment D6, Gages 1SE, lNE, &2E, 11/17/89.
60r------------------------,
-- GAGE 1A
-10
2420161284
- 20 1-1---...l---__-...L- -J--__--l- ---'--__----'
o
TIME (hours)
Figure 62. Measured Strain Variations, Cast-in-Place Pylon, Gages lA, 2A, & 2C,11/17/89.
72

80 I ,GAGE 1SE I
I .--.-......~ I
~- GAGE 1NE ........ I/- ...
60 --- GAGE 2E i "
~ / "'\... I:: I ..... I
.~40 I //~~ I
~ 20r'":~~~ v-/---------"-' '- -- '---,- ,,- --- I
en I '"" II - I
I
", /' io I
-201
'V I
o 4 8 12 16 20 24 28
TIME (hours)
Figure 63. Measured Strain Variations, Pylon Segment D6, Gages lSE, lNE, &2E, 11/18/89.
GAGE 1A
GAGE 2A
GAGE 2C
//
Ol---------l---~------------------I
282420161284
- 20 '----_------l__---l.__-.J-__---'-__---'- --'-__---'--_
o
TIME (hours)
Figure 64. Measured Strain Variations, Cast-in-Place Pylon, Gages lA, 2A, & 2C,11/18/89.
73
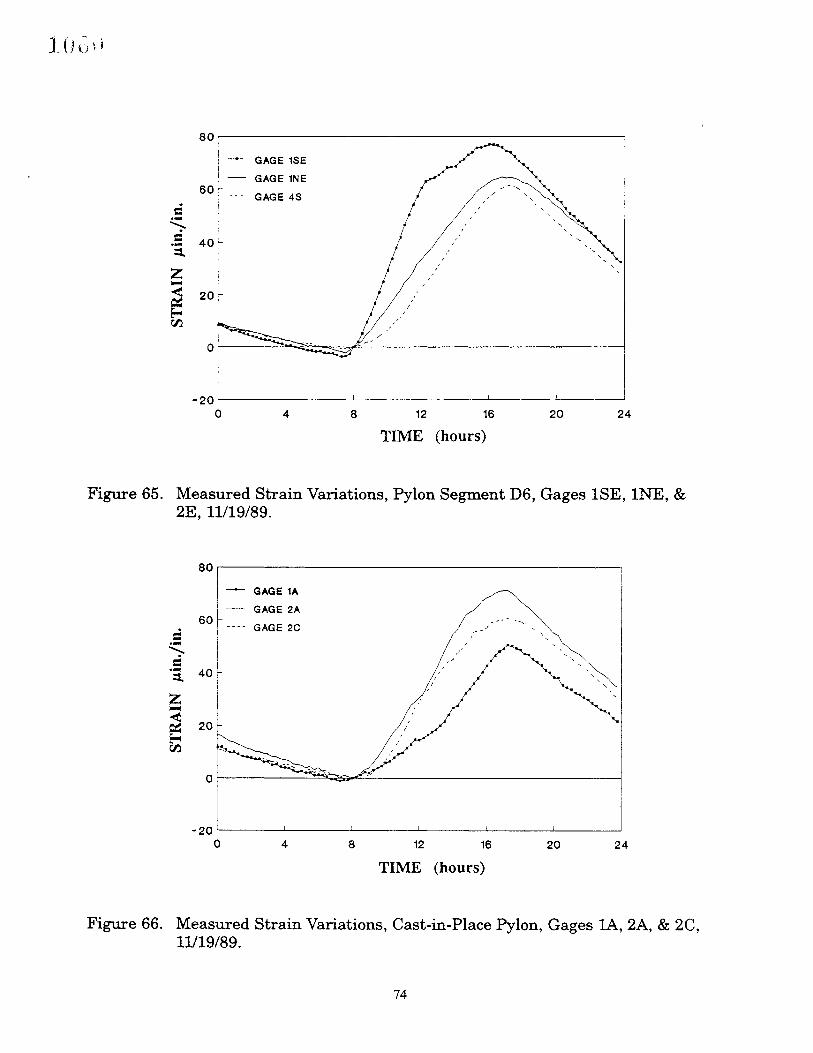
80
-- GAGE 15E
- GAGE lNE60 --- GAGE 45 /'
C I.-.............
== 40.-:lZ...;j 20
~/rJj /
/'
0
2420161284
- 20 '--__---'-- --L.-__-----l --L- ---l....-__--'
o
TIME (hours)
Figure 65. Measured Strain Variations, Pylon Segment D6, Gages ISE, lNE, &2E, 11/19/89.
80
-- GAGE lA
- GAGE 2A60 ~ - " ....
==- - -- GAGE 2C.-
.............
==.- 40:l
Z
~ 20
rJj
0
2420161284
- 20 '-----J- --.J...- ...1-__---J.. ---L-__---..J
o
TIME (hours)
Figure 66. Measured Strain Variations, Cast-in-Place Pylon, Gages lA, 2A, & 2C,11/19/89.
74
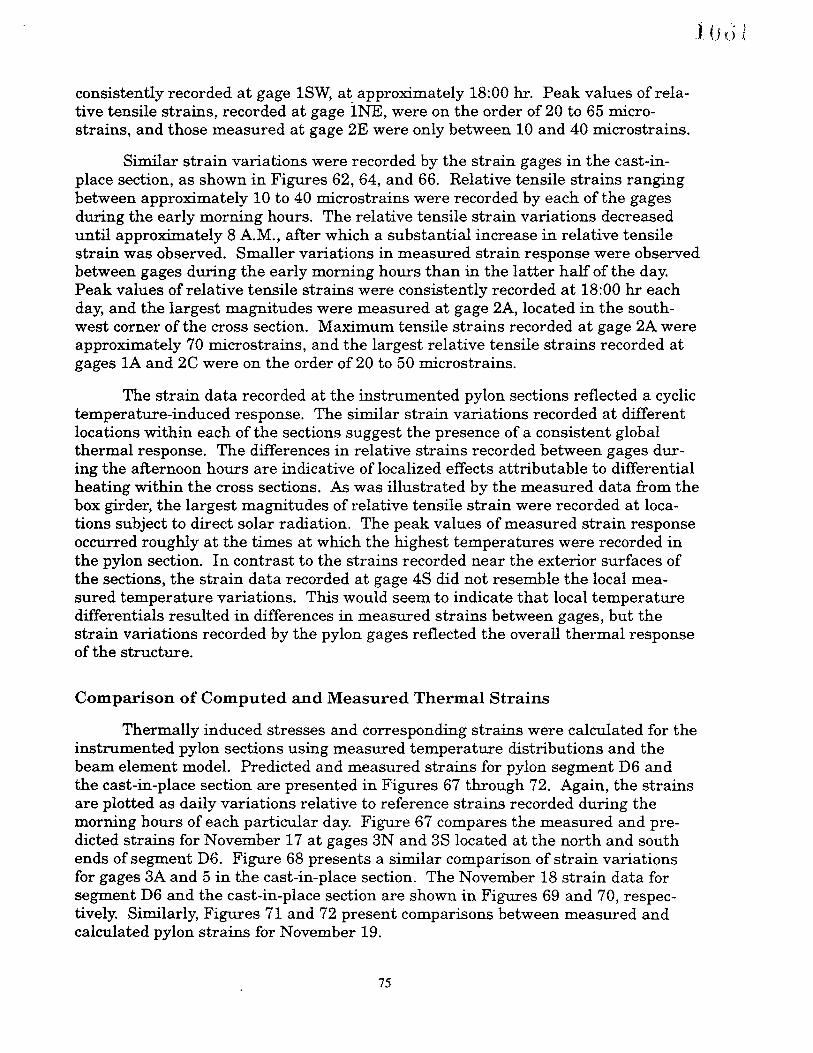
consistently recorded at gage 1SW, at approximately 18:00 hr. Peak values of relative tensile strains, recorded at gage iNE, were on the order of 20 to 65 microstrains, and those measured at gage 2E were only between 10 and 40 microstrains.
Similar strain variations were recorded by the strain gages in the cast-inplace section, as shown in Figures 62, 64, and 66. Relative tensile strains rangingbetween approximately 10 to 40 microstrains were recorded by each of the gagesduring the early morning hours. The relative tensile strain variations decreaseduntil approximately 8 A.M., after which a substantial increase in relative tensilestrain was observed. Smaller variations in measured strain response were observedbetween gages during the early morning hours than in the latter half of the day.Peak values of relative tensile strains were consistently recorded at 18:00 hr eachday, and the largest magnitudes were measured at gage 2A, located in the southwest corner of the cross section. Maximum tensile strains recorded at gage 2A wereapproximately 70 microstrains, and the largest relative tensile strains recorded atgages 1A and 2C were on the order of 20 to 50 microstrains.
The strain data recorded at the instrumented pylon sections reflected a cyclictemperature-induced response. The similar strain variations recorded at differentlocations within each of the sections suggest the presence of a consistent globalthermal response. The differences in relative strains recorded between gages during the afternoon hours are indicative of localized effects attributable to differentialheating within the cross sections. As was illustrated by the measured data from thebox girder, the largest magnitudes of relative tensile strain were recorded at locations subject to direct solar radiation. The peak values of measured strain responseoccurred roughly at the times at which the highest temperatures were recorded inthe pylon section. In contrast to the strains recorded near the exterior surfaces ofthe sections, the strain data recorded at gage 4S did not resemble the local measured temperature variations. This would seem to indicate that local temperaturedifferentials resulted in differences in measured strains between gages, but thestrain variations recorded by the pylon gages reflected the overall thermal responseof the structure.
Comparison of Computed and Measured Thermal Strains
Thermally induced stresses and corresponding strains were calculated for theinstrumented pylon sections using measured temperature distributions and thebeam element model. Predicted and measured strains for pylon segment D6 andthe cast-in-place section are presented in Figures 67 through 72. Again, the strainsare plotted as daily variations relative to reference strains recorded during themorning hours of each particular day. Figure 67 compares the measured and predicted strains for November 17 at gages 3N and 3S located at the north and southends of segment D6. Figure 68 presents a similar comparison of strain variationsfor gages 3A and 5 in the cast-in-place section. The November 18 strain data forsegment D6 and the cast-in-place section are shown in Figures 69 and 70, respectively. Similarly, Figures 71 and 72 present comparisons between measured andcalculated pylon strains for November 19.
75

80
3N Predicted
60 -*- 35 Predicted ~"/ ~"-...-"-35 Measured~
==3N Measured /I ""~"-........ 40
'"//
== ~..... /*:t
Z20
/
/
~/
0~et:J
-20
-400 4 8 12 16 20 24
TIME (hours)
Figure 67. Comparison of Measured and Predicted Strain Variations, PylonSegment D6, 11/17/89.
80
5 Predicted
.~ I60 ~ 3A Predicted / I
*' ~ !3A Measured
///~~==
5 Measured // ...... I/ ;/ , ~
40 - , ',--~ ,I...../ / '~" .""'
==* "~..... / /' I "":t
20 / .j/ ;
Z /
~/// /
0E-4r:J':J
~,/~-20
-4J0 4 8 12 16 20 24
TIME (hours)
Figure 68. Comparison of Measured and Predicted Strain Variations, Cast-inPlace Pylon, 11/17/89.
76

Figure 69. Comparison of Measured and Predicted Strain Variations, PylonSegment D6, 11/18/89.
2420161284
- 40 '-------'------'----_~ ~ _L_____J
o
TIME (hOUfS)
Figure 70. Comparison of Measured and Predicted Strain Variations, Cast-inPlace Pylon, 11/18/89.
77

100
3N Predicted80 +- 35 Predicted
60 35 Measured
==:.:::. 3N Measured
==40......
:1.Z 20' ,,- -- -----...~~
0r:n
-20
-40
-600 4 8 12 16 20 24 28
TIME (hours)
Figure 71. Comparison of Measured and Predicted Strain Variations, PylonSegment D6, 11/19/89.
100
5 Predicted80
-*- 3A Predicted
60 3A Measured
== 5 Measured......""' 40 /"
==/...... I
:1- /
" /,
Z 20~/ " ....-:..--.... ,-:;....
~,/
/
0I
~r:J':J
-20
-40
-600 4 8 12 16 20 24 28
TIME (hOUfS)
Figure 72. Comparison of Measured and Predicted Strain Variations, Cast-inPlace Pylon, 11/19/89.
78

The predicted strain variations for segment D6, presented in Figures 67,69,and 71, indicate that similar relative strain values were calculated for each of the 3days under consideration. Noticeably different behavior was predicted for thenorthern and southern portions of the segment. At the south end, the calculatedrelative strains decreased during the morning, then increased during the afternoon.Peak values of relative tensile strains, on the order of 50 microstrains, were consistently calculated each day at 16:00 hr. Similar trends in predicted response wereobserved at the north end of the segment prior to 8 A.M. During the afternoon,however, relative compressive strains with magnitudes ranging between 10 and 20microstrains were calculated. A comparison with the strain data measured at corresponding locations indicated that the strain response was predicted more accurately at the south end of the section. The relative tensile strains measured at gage3N, between 8:00 and 24:00 hr, were not reflected in the calculated response fromthe northern portion of the section. The small strain variations observed at thenorth and south ends of the section prior to 8 A.M. corresponded reasonably wellwith predicted values.
Similar strain variations were calculated for locations within the cast-inplace section, as indicated in Figures 68, 70, and 72. Again, consistent variationswere predicted for the northern and southern portions of the pylon on each of the 3days. Prior to 8 A.M., calculated values at either location were less than 10 microstrains. During the afternoon, relative tensile and compressive strain variationswere calculated for the south and north ends of the cross section, respectively. At16:00 hr, relative tensile strains of approximately 70 microstrains were predicted atthe north end, and relative compressive variations on the order of 30 to 40 microstrains were predicted for the south. A comparison with the corresponding measured data again indicates only limited correlation with the predicted response values. At the south end of the cast-in-place section, the calculated strain variationswere consistently larger than those measured at gage 3S. After 8 A.M., the compressive strain variations predicted for the north end of the section did not reflectthe relative tensile strains measured at gage 3N.
The predicted strain variations presented in Figures 67 through 72 indicatedthat the analytical procedure was limited in its ability to predict the measuredstrain response within the pylon. A comparison of the measured and predictedstrain values showed that, although the overall trends in strain variation could becalculated with reasonable accuracy, the analysis was unable to predict the localvariations shown by the measured data. In addition to the approximations discussed previously for the box girder, assumptions regarding the temperature distribution within the pylon may have limited the accuracy of the analysis. The temperatures measured by the thermocouples in segment D6 were assumed to representthe temperatures throughout the pylon, resulting in larger differences betweenmeasured and calculated strain variations at the cast-in-place section. In addition,the temperature distribution in each section was approximated as a piece-wise linear function between thermocouples, through the center of the cross section, whichlargely ignored localized temperature differences.
79
DISCUSSION
The measured temperature and strain data illustrated the complexity of thethermal response of the structure. The temperatures at locations within the crosssection of the box girder and pylon members varied continuously and were significantly influenced by localized climatic conditions. As expected, larger diurnal temperature variations were observed at locations subject to direct solar radiation, suchas the top flange of the box girders and the southern portions of the pylon. Significant differences in temperature were also measured between the interior and exterior of the pylon section, especially during the afternoon hours.
Strain variations measured in the instrumented box girder segments reflected the cyclical temperature-induced response of the structure. Comparablestrain data were recorded in the two box girder segments, though slightly larger relative strain variations were observed at segment 33. Strains measured in the topand bottom flanges of the box girder were similar in overall trend and magnitude.In general, the strain variations recorded by gages in the box girder segments followed similar daily trends, in which the relative compressive strains observed during the morning hours were followed by relative tensile strains for the latter half ofthe day. Localized thermal effects in the top flange of the box girder were illustrated by differences in measured response between gages during the afternoonhours. Consistent strain variations were recorded at gages having similar locationswithin the cross section of the segments.
The strain variations recorded at the pylon segments also reflected the overall thermal response of the structure. Comparable daily strain variations weremeasured at precast segment D6 and at the top of the cast-in-place portion of thepylon. Similar magnitudes of relative strain were recorded at the two sections, andconsistent relative tensile strain variations were observed at locations across eachcross section. The measured strain data were indicative of the global response ofthe pylon as well as localized behavior attributable to differential heating effects.
Measured temperature distribution data from the box girder and pylon sections were used in conjunction with a three-dimensional beam element model topredict average thermally induced strain variations within the structure. Calculated strain results were indicative of significantly dissimilar behavior between thetop and bottom flanges of the box girder. The predicted strain variations showedrelatively poor correlation with the measured data, however. The assumed thermalstrains in the cable stays had a significant effect on the magnitude of calculatedstrains in the box girder but had little influence on the overall trends of the predicted strain response. The thermal response data obtained from a threedimensional plate element model were consistent with those from the simpler beamelement model and showed variations in strain across the flanges of the box girder.Predicted strain variations for the pylon sections showed more favorable correlationwith measured data but did not accurately reflect the relative tensile strain variations observed at the northern portion of the cross section. In general, the analytical procedures were able to predict the thermally induced strains within the same
80
order of magnitude as those measured in the bridge, but they did not have the sensitivity to account for the local effects observed in the measured data.
This study revealed the many difficulties associated with field instrumentation and testing of structures, especially under construction conditions. The individual bridge segments were formed in the casting yard at the foot of the bridge.Although it was easier to install the instrumentation there, rather than on thestructure itself, there were logistical problems with materials and scheduling,which were further compounded by the 90-mile driving distance between the bridgeand VTRC. Despite the best efforts of the researchers, it was difficult to protect theequipment from damage caused by construction activities. As a result, a significantnumber of strain gages and thermocouples were inoperative and constant repairs tothe data lines were necessary. Also, the harsh construction and field environmentwas damaging to the sensitive electronic equipment and has led to serious questionsconcerning the reliability of the data acquisition system.
Analysis of the measured strain and temperature data indicated a number ofdeficiencies in the instrumentation and data acquisition system. Malfunctionswithin the remote scanning chasses were difficult to diagnose and repair and resulted in significant losses of data. Thermal strain corrections were influenced bytemperature approximations based on the measured thermocouple data. Largethermal gradients were observed through the flanges of the box girder, and moreaccurate corrections could be made by installing thermocouples adjacent to eachstrain gage. Additional thermocouples installed within the webs of the box girderswould provide a more detailed temperature distribution within the cross section,thereby improving the accuracy of the predicted thermal response of the structure.Thermocouples installed in a few of the cable stays would eliminate the uncertainties caused by assuming the variations of thermal strain within these members.Additional thermocouple instrumentation would have required a reduction in thenumber of strain gages installed within the segments, but the reduced amount ofstrain data would be offset by the improved overall accuracy and reliability provided by more thermocouples.
Large differences between measured and predicted response led to a criticalevaluation of each component of the strain-measuring instrumentation. Althoughthe measured data were determined to represent the actual response of the structure, this evaluation raised serious questions regarding the reliability of the dataacquisition system. Installation of another system of strain-measuring devices,such as Carlson strain meters, in addition to the strain-gaged rebar, would providean independent check on the system components. The daily variations of strain recorded indicated that the thermal response of the structure was measurable, thoughnot significantly large. Measurement of the thermal response during the earlysummer months would yield critical strain variations within the structure.
81

CONCLUSIONS
1. The temperature distribution in both the box girders and the pylons of the I-295bridge is nonlinear. The more massive the element, the more gradual the temperature changes away from the outside surfaces. Thus, the pylon interior temperatures reflected only the long-term mean temperature variation, whereasthe box girder elements reflected diurnal changes in temperature throughoutthe thickness of the elements.
2. Elements of the bridge on the windward side appear to undergo more rapid temperature variation than those away from the wind, as would be expected. Sheltered regions of the bridge, such as the webs between the twin box girders, undergo relatively small diurnal changes that are driven by the ambient airtemperature and heat conduction from the other elements.
3. The longitudinal strains measured as a result of diurnal temperature changesform a complex three-dimensional field. The measured strains were of the sameorder of magnitude as those caused by a fully loaded dump truck traversing thebridge. Even larger strains in the box girders than those measured are anticipated to occur during the summer months, when the angle of solar incidence ishigher. On the other hand, the solar incidence on the vertical pylon surfaces isgreater during the winter months.
4. Attempts to predict the strain field using finite element models had only limitedsuccess. A frame element model was unable to predict the across-bridge variations that were particularly evident on the top flange. The moments applied accounted for only the vertical variation of temperatures. Accurate determinationof thermal strains from temperature data must account for the horizontal aswell as the vertical variation of temperatures.
5. A plate element model appeared to have some ability to predict the acrossbridge strain variations. The plate element model used was designed to accountfor vertical plane variations only and used a vertical plane of symmetry alongthe bridge center line, so it did not adequately model the horizontal variation ofthe strain field.
6. Strain-gaged dummy reinforcing bars did not provide a sufficiently reliabletransducer for the measurement of long-term thermal strains. In particular,two deficiencies were noted: (a) the thermal modulus of the steel and the concrete, although nominally the same, actually differ by a sufficient amount to introduce strains of almost the same order of magnitude as the strains being measured, and (b) the half-bridge gages mounted on the curve did not eliminate thetemperature dependence of the strain readings. Corrections for these effectswere introduced and used in the calculations, but it appears that the correctionsare only approximate.
82

RECOMMENDATIONS
1. Development of a true three-dimensional finite element with no assumption ofsymmetry about the center line should be investigated as a means of improvingcomparison between the predicted and measured thermal strains.
2. Laboratory studies conducted under field temperature conditions are needed todevelop further strain-measuring systems that are quick and inexpensive to install but that will perform reliably under field conditions in measuring thermally induced strains. Particular problems that need to be resolved include thoseencountered with the dummy strain-gaged reinforcing bars on the present instrumentation project. In addition, quick connect (plug in) transducer line connectors need to be investigated for thermal noise contributions since they wouldgreatly facilitate the installation of such systems during construction operations.
3. Little is known of the temperature distribution within cable stays of cablestayed bridges. A study could be carried out with a relatively short length ofstay cable insulated at either end and mounted at the appropriate angle. Suchan experiment would be relatively inexpensive to conduct.
83


REFERENCES
Baber, T.T., & Hilton, M.H. (1988). Field monitoring on the 1-295 bridge over theJames River: Instrumentation installation and construction period studies.Charlottesville: Virginia Transportation Research Council.
Barton, F.W., Baber, T.T., Duemmel, P.S., & McKeel, W.T., Jr. (1991). Field test of acable-stayed bridge. Transportation Research Record 1290. Washington, DC:Transportation Research Board.
Churchward, A.J., & Sokel, Y.J. (1980). Thermal responses in concrete bridges,Brisbane. ARRB Proceedings, 10(3): 87-93.
Dilger, W.H., Ghali, A., Chan, M., Cheung, M.S., & Maes, M.A. (1983). Temperature stresses in composite box girder bridges. Journal of Structural Engineering, 109(6): 1460-1476.
Duemmel, P.S., Baber, T.T., Barton, F.W., & McKeel, W.T., Jr. (1991). Field instrumentation and measured response of the 1-295 cable-stayed bridge: Part 1Field study of live load responses. VTRC Report No. 92-R19. Charlottesville:Virginia Transportation Research Council.
Elbadry, M.M., & Ghali, A. (1983). Thermal variations in concrete bridges.Journal ofStructural Engineering, 109(10): 2355-2374.
Elbadry, M.M., & Ghali, A. (1986). Thermal stresses and cracking of concretebridges. Journal of the American Concrete Institute, 83(6): 1001-1009.
Hayes, S.W. (1988). Implementation of the data acquisition system for the 1-295James River Bridge. Masters thesis. Charlottesville: University of Virginia,Department of Civil Engineering.
Imbsen, R.A., Vandershaf, D.E., Schamber, R.A., & Nutt, R.V (1985). Thermal effects in concrete bridge superstructures. NCHRP Report No. 276. Washington,DC: Transportation Research Board.
Mathivat, J. (1983). The cantilever construction ofprestressed concrete bridges.New York: John Wiley & Sons.
Measurements Group, Inc. (1983). Temperature induced apparent strain and gagefactor variation in strain gages. Technical Note No. TN-504. Raleigh, Ne.
Mohr, M. (1989). The strain gage instrumentation of cables on the 1-295 James River cable-stayed bridge. Masters thesis. Charlottesville: University of Virginia,Department of Civil Engineering.
Muller, J.M., & McCallister, L.F. (1988). Esthetics and concrete segmental bridgesin the United States. Concrete International, 10(5): 25-33.
Podolny, W., Jr. (1985). The causes of cracking in post-tensioned concrete box girder bridges and retrofit procedures. Prestressed Concrete Institute Journal,March/April, pp. 82-139.
85

Post-Tensioning InstitutelPrestressed Concrete Institute. (1978). Precast segmental box girder bridge manual. Glenville, IL.
Potgieter, I.C., & Gamble, W.L. (1983). Response ofhighway bridges to nonlineartemperature distributions. University of Illinois at Urbana-Champaign.
Priestly, M.J.N. (1978). Design of concrete bridges or temperature gradients. ACIJournal, 75: 5.
Rao, D.S. (1986). Temperature distributions and stresses in concrete bridges.Journal of the American Concrete Institute, 83(4): 588-596.
Waldron, P. (1986). Stiffness analysis of thin-walled girders. Journal ofStructuralEngineering, 112(6): 1366-1384.
Waldron, P., Ramezankhani, M., & Woodman, N. (1990). Differential temperatureeffects in concrete box girder bridges. Proceedings of the Developments in Shortand Medium Span Bridge Engineering '90, Supplement, pp. 1-12. Toronto, Ontario, Canada: Canadian Society of Civil Engineers.
Yen, Y.-H. (1992). Modal identification of bridge structures. Ph.D. dissertation inprogress. Charlottesville: University of Virginia, Department of Civil Engineering.
86
Related Documents