1. What is shown here? weather or climate ? analysis valid 18 UTC on 4 Oct 2005

1. What is shown here? weather or climate ? analysis valid 18 UTC on 4 Oct 2005.
Dec 20, 2015
Welcome message from author
This document is posted to help you gain knowledge. Please leave a comment to let me know what you think about it! Share it to your friends and learn new things together.
Transcript
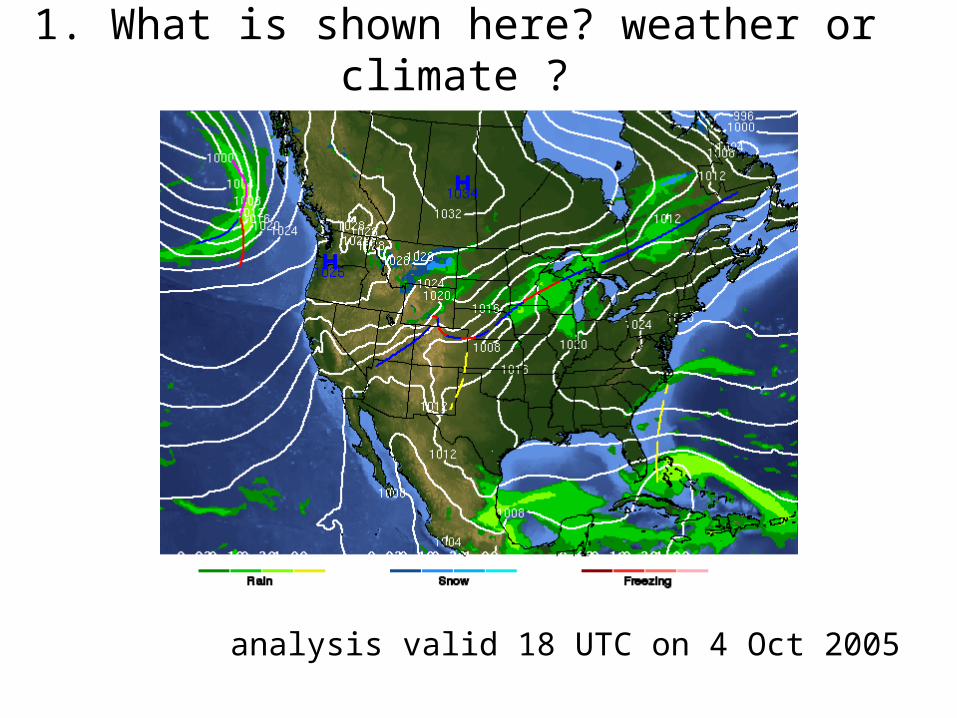
1. What is shown here? weather or climate ?
analysis valid 18 UTC on 4 Oct 2005
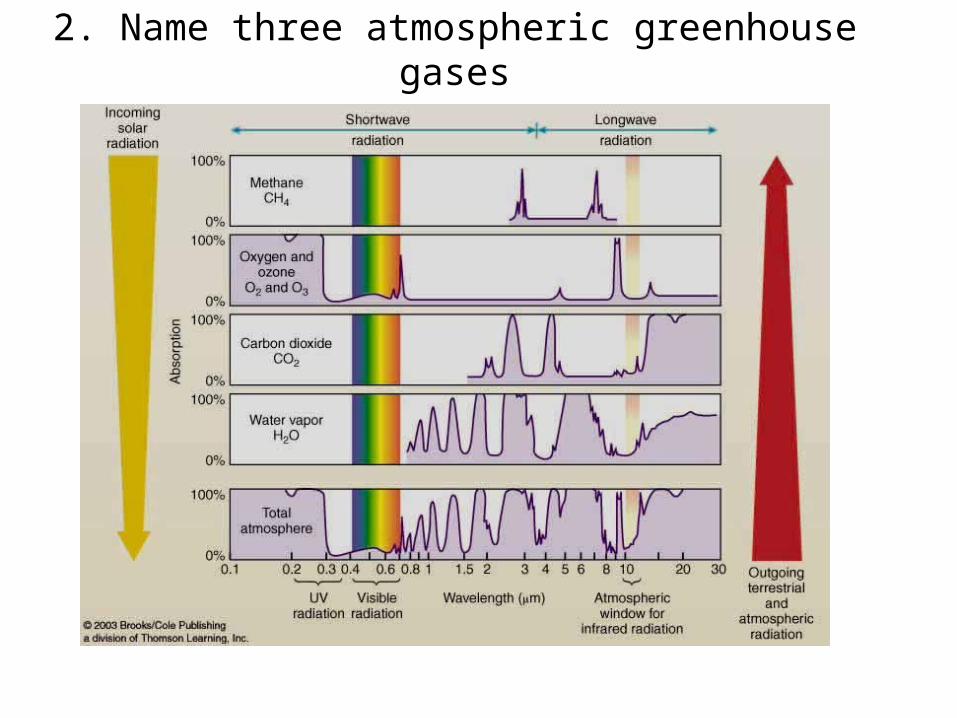
2. Name three atmospheric greenhouse gases
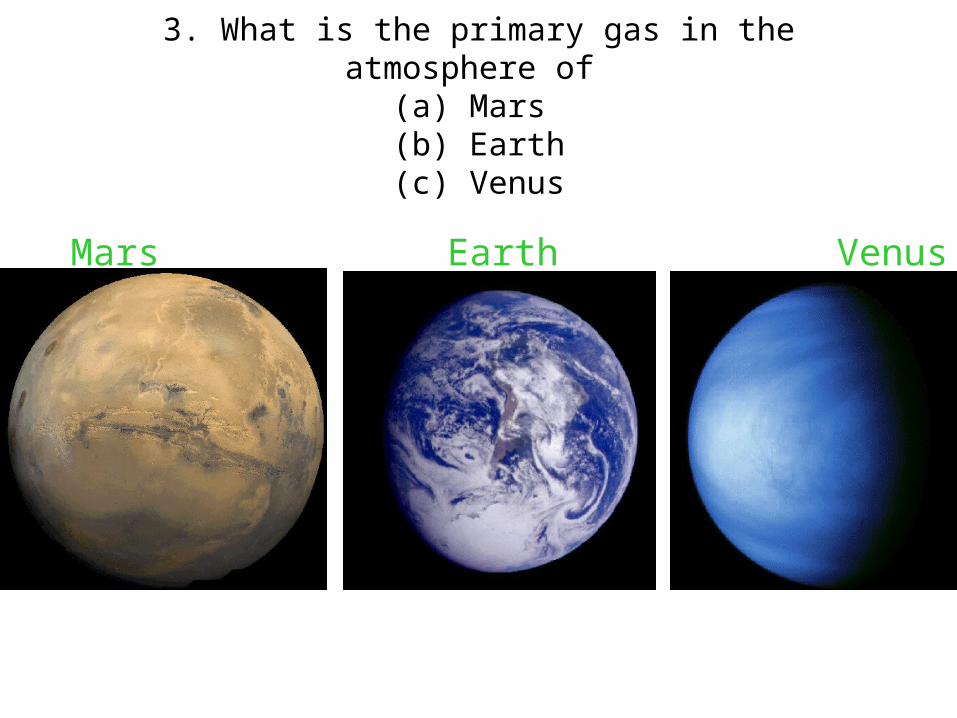
3. What is the primary gas in the atmosphere of (a) Mars (b) Earth(c) Venus
Mars Earth Venus
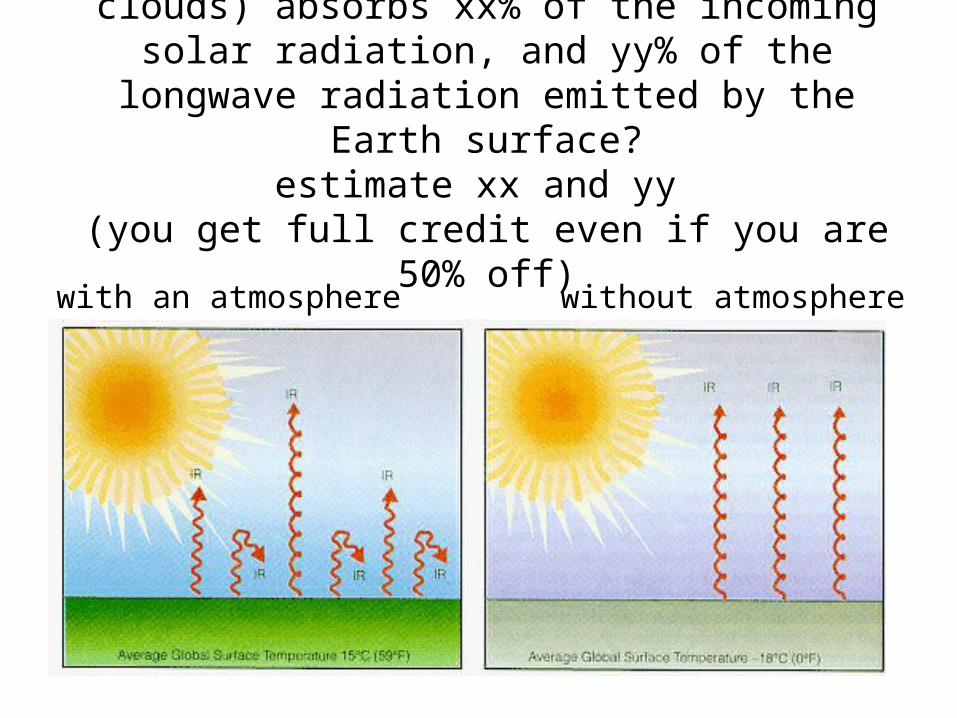
4. The atmosphere (incl. dust and clouds) absorbs xx% of the incoming solar radiation, and yy% of the
longwave radiation emitted by the Earth surface?estimate xx and yy
(you get full credit even if you are 50% off)
aphelion
with an atmosphere without atmosphere
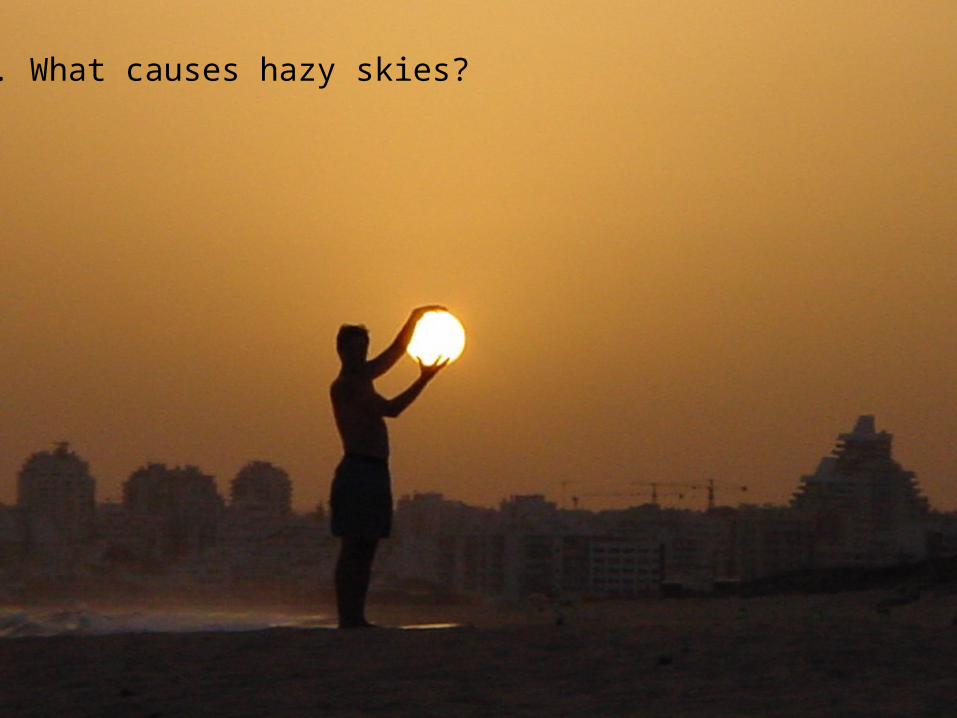
5. What is the name of this layer?5. What causes hazy skies?
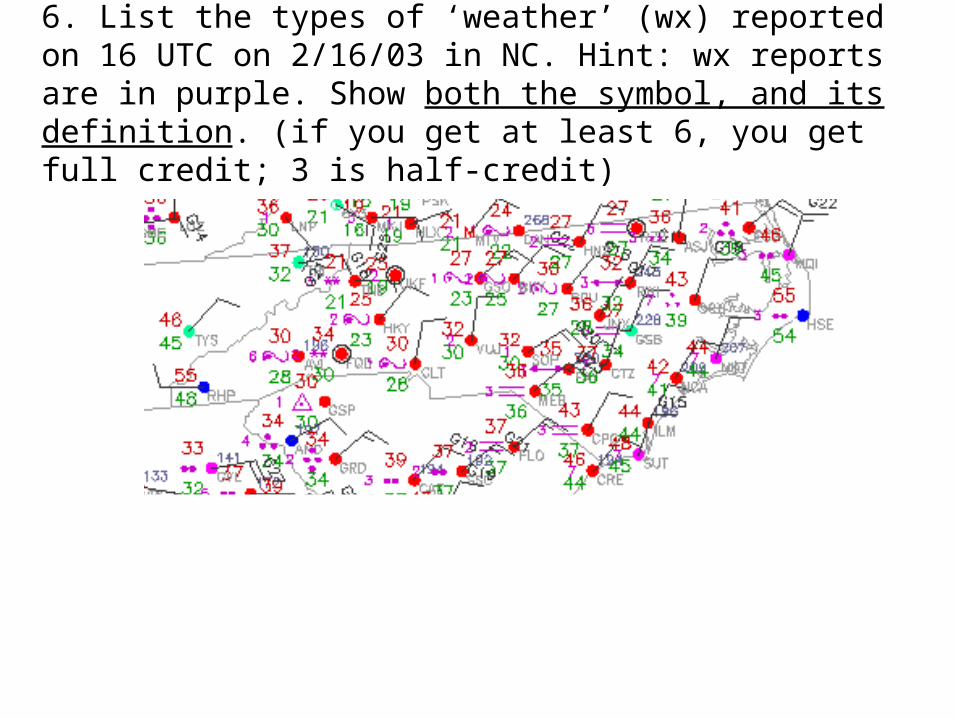
6. List the types of ‘weather’ (wx) reported on 16 UTC on 2/16/03 in NC. Hint: wx reports are in purple. Show both the symbol, and its definition. (if you get at least 6, you get full credit; 3 is half-credit)
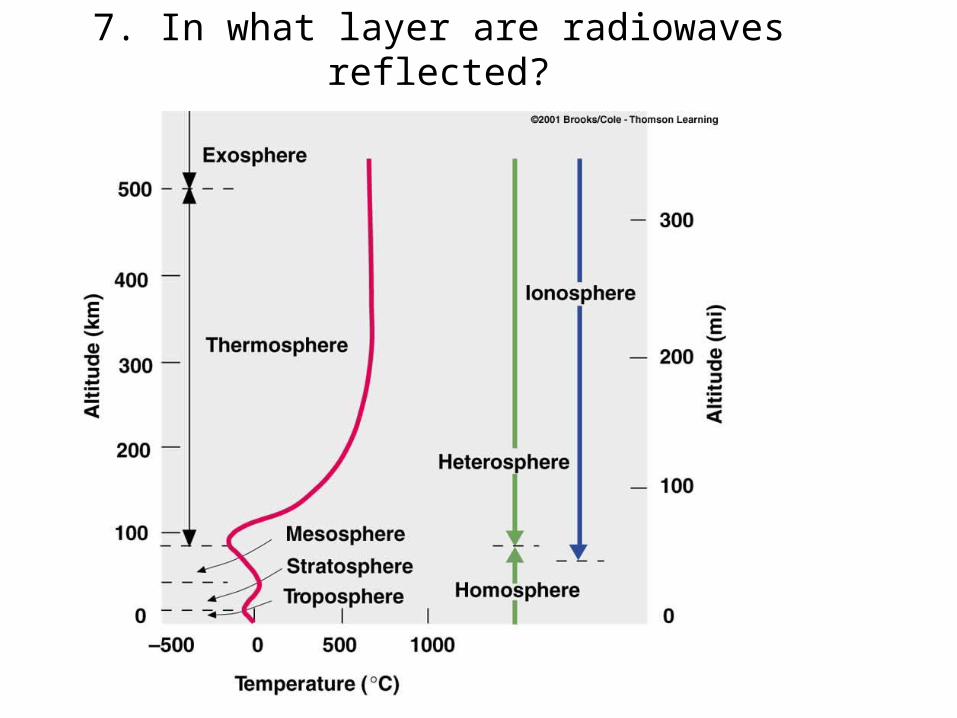
7. In what layer are radiowaves reflected?
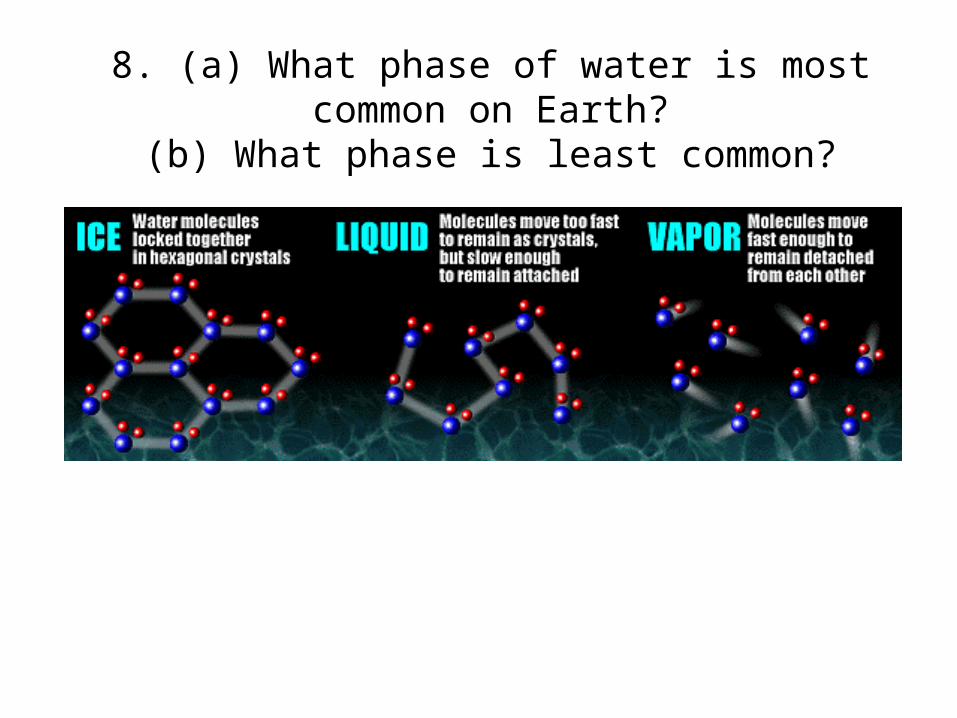
8. (a) What phase of water is most common on Earth?(b) What phase is least common?
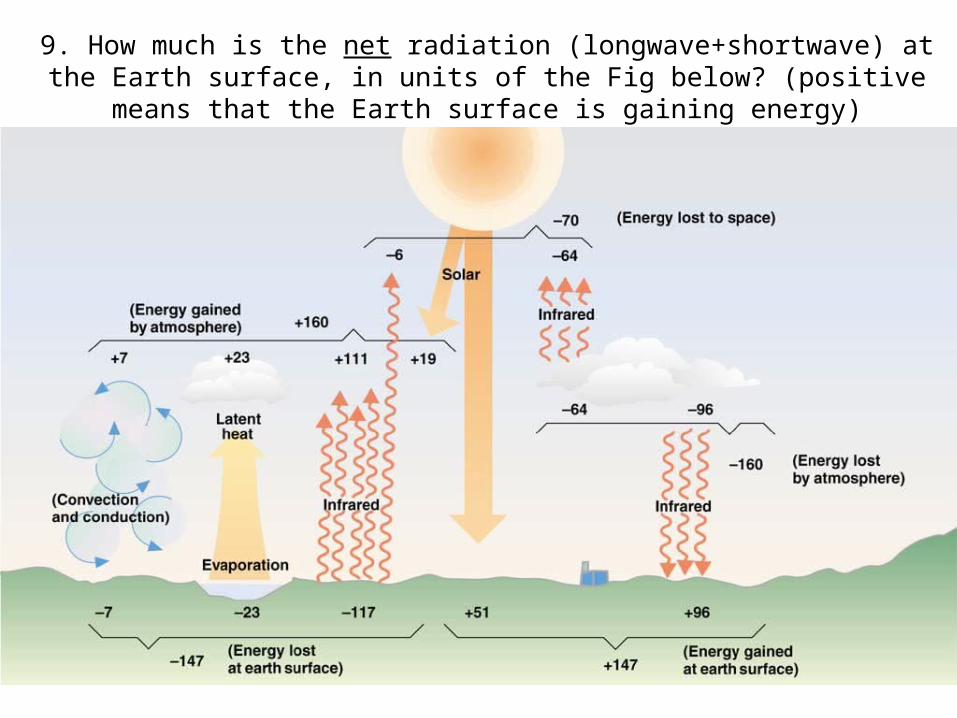
9. How much is the net radiation (longwave+shortwave) at the Earth surface, in units of the Fig below? (positive means that the Earth surface is gaining energy)
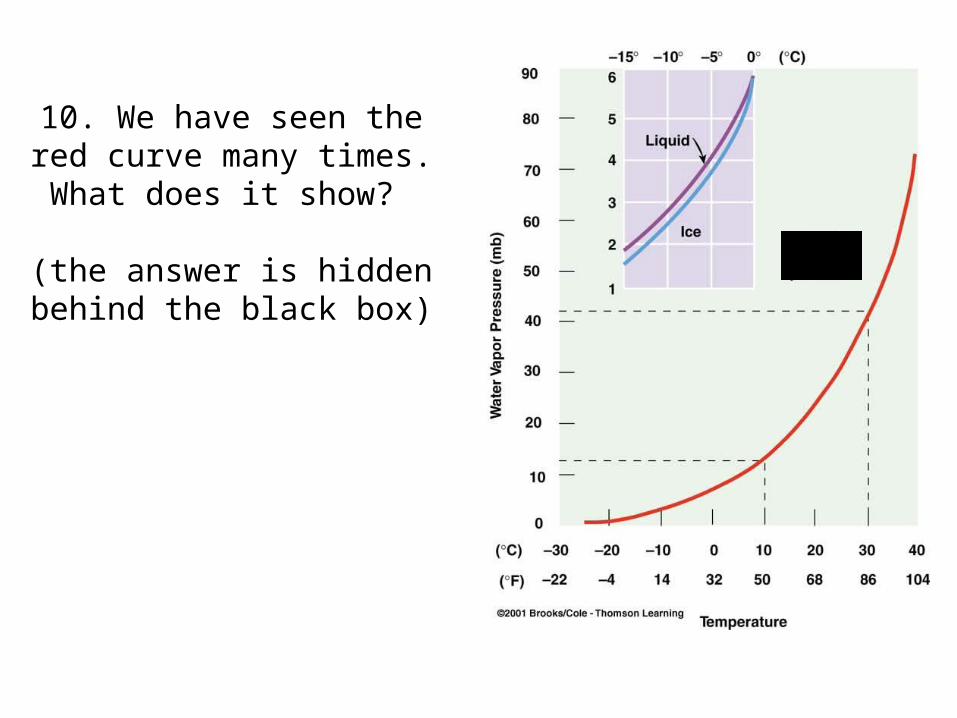
10. We have seen the red curve many times. What does it
show?
(the answer is hidden behind the black box)
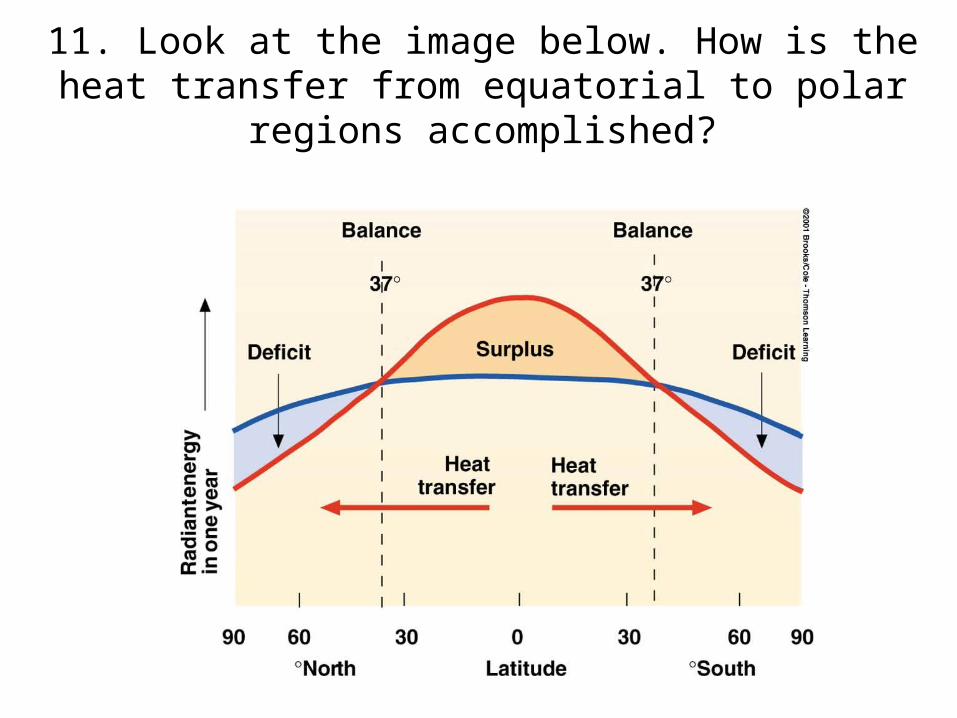
11. Look at the image below. How is the heat transfer from equatorial to polar regions accomplished?

12. Explain this paradox: the Earth is closer to the Sun in January than in July, yet it is colder in January in the northern hemisphere.
perihelionaphelion

a. At which of these two places is the annual mean temperature the highest?b. Where is the daily temperature range largest?c. Where is the annual temperature range largest?
14. Explain (a, b and c)
(hint: both places are along the Pacific coast)
Santa Cruz, CA: mean temperature
ºF Max Min Mean
Winter 61.0 39.6 50.3Summer 74.6 50.8 62.7average 67.8 45.2 56.5
ºF Max Min Mean
Winter 31.7 21.4 26.6Summer 62.7 47.0 54.9average: 47.2 34.2 40.7
Juneau, AK: mean temperature13

15.(a) How does temperature normally change with height in the troposphere?(b) Define an inversion.(c) Why are inversions common in valleys, during clear, calm nights?

16. for the green dot, determine(a) temperature(b) vapor pressure(c) saturation vapor pressure(d) wet-bulb temperature(e) dewpointplease add units to all values
dewpoint
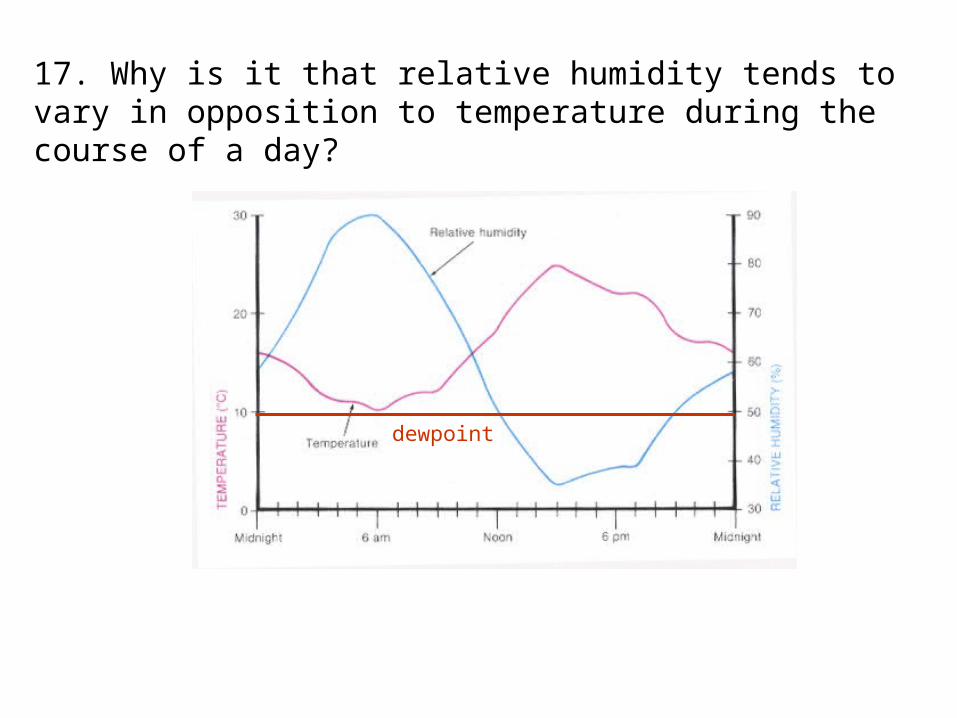
17. Why is it that relative humidity tends to vary in opposition to temperature during the course of a day?
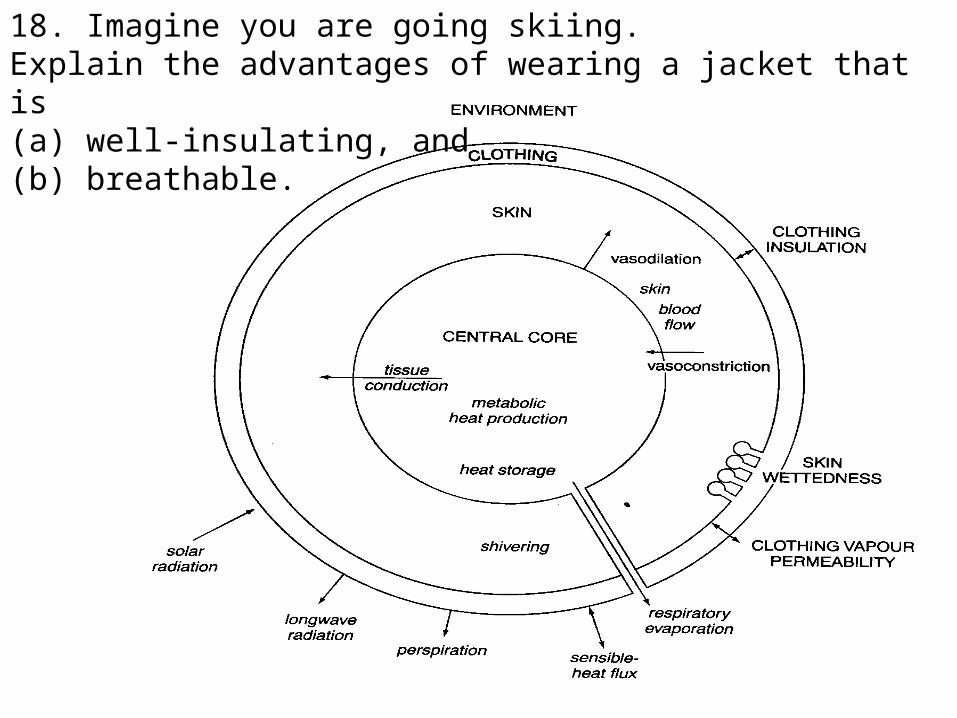
18. Imagine you are going skiing.Explain the advantages of wearing a jacket that is (a) well-insulating, and (b) breathable.

19.(a) In what direction is latent heat transferred? (up or down)(b) Indicate specifically where the latent cooling and the latent warming occur

20. What is the wind speed and direction at this station at this time?
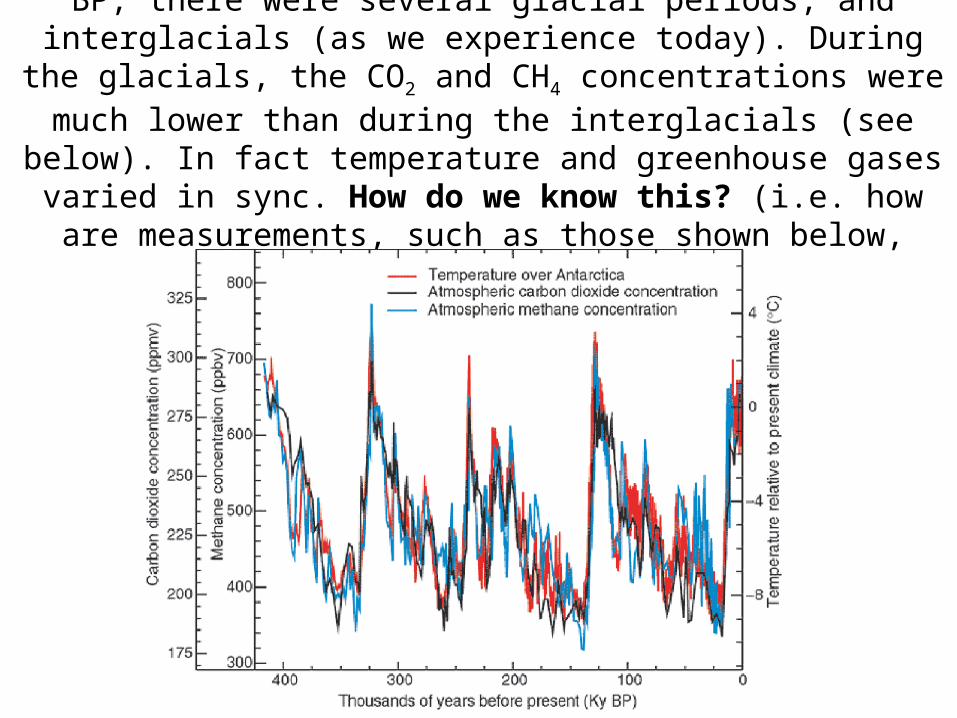
21. (extra credit) In the past two million years BP, there were several glacial periods, and interglacials (as we experience today). During the glacials, the CO2 and CH4 concentrations were much lower than during the interglacials (see below). In fact temperature and greenhouse gases
varied in sync. How do we know this? (i.e. how are measurements, such as those shown below, made?)
Related Documents


