1 Using Software Stacks to Explain Complementarities: The Case of Mergers and Acquisitions in the Software Industry Lucia Silva and Bala Iyer Boston University [email protected], [email protected] HICSS-39, January 2006

1 Using Software Stacks to Explain Complementarities: The Case of Mergers and Acquisitions in the Software Industry Lucia Silva and Bala Iyer Boston University.
Dec 30, 2015
Welcome message from author
This document is posted to help you gain knowledge. Please leave a comment to let me know what you think about it! Share it to your friends and learn new things together.
Transcript

1
Using Software Stacks to Explain Complementarities: The Case of Mergers and Acquisitions in the
Software Industry
Lucia Silva and Bala Iyer
Boston University
[email protected], [email protected]
HICSS-39, January 2006

2
The purpose of the paper is:
1) To test the hypothesis that there is value in equity participation between companies that produce different components of a complementary network;Definition of complementarity by Milgrom and Roberts (1995): “the whole is more than the sum of the parts”, i.e., the returns obtained from combining the activities are greater than the sum of the returns of both activities in isolation.
2) To empirically validate the software stack.

3
The Stack
Hardware
Application software
Systems Software
Middleware Services
Service

4
Industry Stack
Systems(OS, file sharing, terminal access)
Middleware Services(systems management, application & transaction servers, collaboration & messaging
database)
Application software(CRM package, SCM package, BI, HR, engineering & design, e-biz)
Services(IT consulting, systems integration, outsourcing, training & education,
maintenance)
Hardware
5
Stack
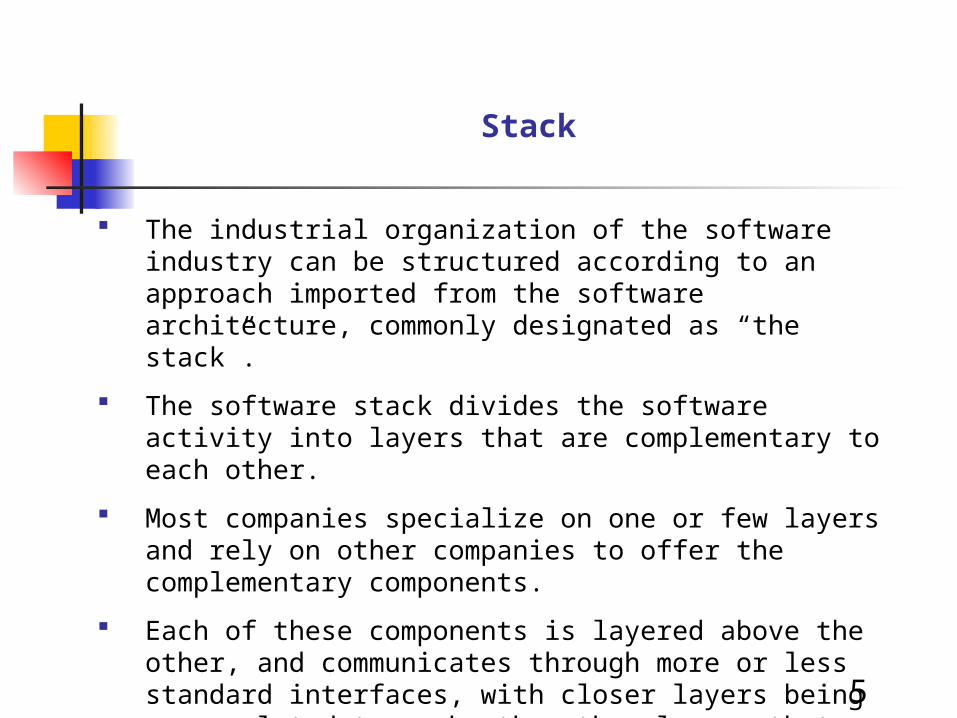
The industrial organization of the software industry can
be structured according to an approach imported from the software architecture, commonly designated as “the stack”.
The software stack divides the software activity into layers that are complementary to each other.
Most companies specialize on one or few layers and rely on other companies to offer the complementary components.
Each of these components is layered above the other, and communicates through more or less standard interfaces, with closer layers being more related to each other than layers that are further apart on the stack.

6
Stack

7
Operationalization
We use the concept of “stack” to operationalize complementarity.
Construction of an index (STACKD) that measures the distance on the stack between two companies.
The index is the weighted sum of coefficients that represents the distance on the stack between two different layers or industry segments. The weights are equal to the product of the percentage of sales of each firm in the corresponding layer.
Example of a two-layer stack Hardware/Software :
C o e f f i c i e n t s :
jiif
jiifd ij 1
0
T h e v a l u e o f t h e i n d e x i s e q u a l t o
0*1*1*0*
0*1*1*0*
TSTHASTSTHAH
TSASTHASTSAHTHAH
PPPPPP
PPPPPPPPSTACKD
8
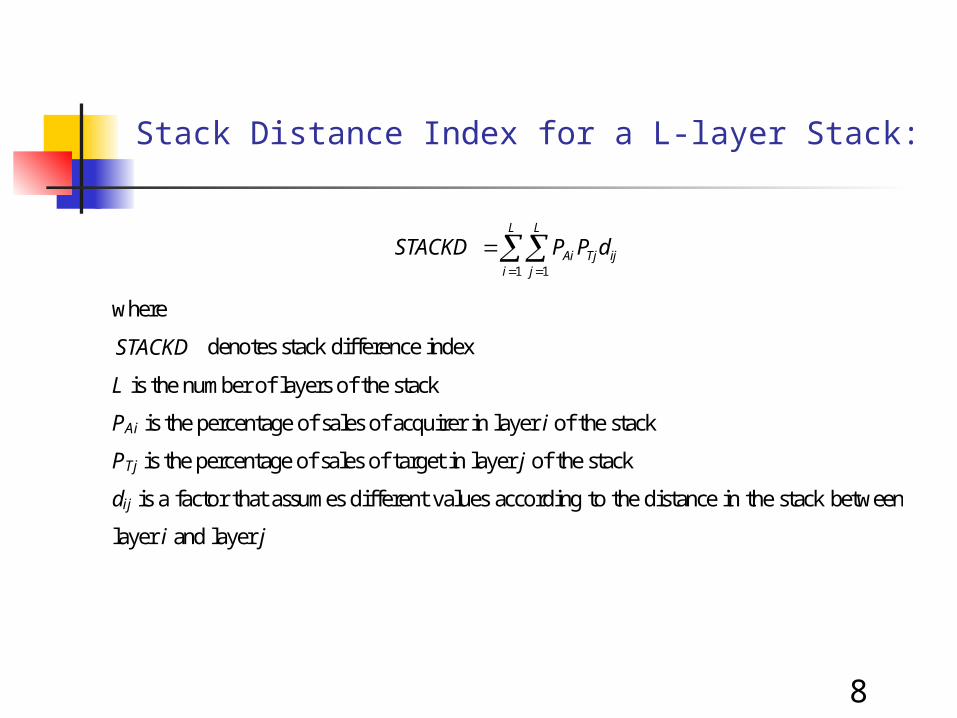
Stack Distance Index for a L-layer Stack:
L
i
L
jijTjAi dPPSTACKD
1 1
where
STACKD denotes stack difference index
L is the number of layers of the stack
PAi is the percentage of sales of acquirer in layer i of the stack
PTj is the percentage of sales of target in layer j of the stack
dij is a factor that assumes different values according to the distance in the stack between
layer i and layer j

9
Event Studies Methodology
Event studies are widely used in the finance and economics literature. Most empirical studies of M&As use the event studies methodology.
This methodology is based on the assumption that share prices are simply the present value of expected future cash flows to shareholders and that any changes in the company’s prospects are immediately reflected in its stock price.
1. Computation of what would be “normal returns,” using market models.
2. Computation of Cumulative Abnormal Returns for a specific event window (we use a three-day window surrounding the M&A announcement date).
Abnormal Returns = Actual Returns – “Normal Returns”
10
Empirical design and data:
Study of the effects of concentration/diversification on layers of the stack between acquirer and targets of Mergers and Acquisitions in complementary network systems.
Data:
Securities Data Company (SDC): data on M&As
Compustat Industry segments: sales classified as Hardware, Software or Services (3-layers stack)
IDC: sales classified as Hardware, Systems software, Middleware software, Applications software and Services (5- layer stack)

11
Three-layer stack
For the sample obtained from Compustat we use a simplified version of the stack (because there are only three layers):
Concentration = PAHPTH+PASfPTSf+PASvPTSv
where PAH, PAsf and PASv are the proportion of sales of the acquirer in
hardware, software and services and PTH, PTSf and PTSv are the proportion of
sales of the target in hardware, software and services.

12
Results
The low level of significance obtained for the results suggests that the concentration or diversification on the three-layer stack explains little of the variation of abnormal returns in M&As in the software industry.
To test if the software stack does indeed characterize the industrial organization of the software industry, and can be the structure of a measure of complementarity between different software companies, we repeat the analysis using the five-layer stack and the index STACKD.

13
Results for the five-layer stack (IDC):
•The results are still not highly significant if we use the concentration measure
•The results are not significant if we use the index STACKD.
•The results are significant when we test for curvilinear relationship (add the square of STACKD).
14
Conclusions
We conclude that there is an inverse curvilinear relationship between abnormal returns and the stack distance index:
Abnormal returns are higher when both sides in the acquisition are classified in adjacent layers of the stack and smaller when acquirer and target are further apart on the stack or are in the same layer.
The results provide evidence that there is value in M&As between complementary components of network systems.
The results empirically validate the software stack.

15
Results
The value of a merger between software companies depends a great deal on how easy it is to technical integrate the products of both companies.
Very often the outcome of mergers between similar software companies is not very successful because these companies have problems with the technical integration of the software products.
When companies produce in different layers of the stack, products are already working as complementary as components of a network system, through a common platform, and technical integration is not an uncertainty.
M&As, allowing firms to hold equity stakes in complementary companies, may lead to the realization of value from the internalization of complementary network externalities

16
Extensions:
Repeat the analysis with a larger sample from IDC (five-
layer stack)
Repeat the analysis for a sample of alliances

17
Results for the three-layer stack:
Variable Combined Acquirer Target
Intercept 0.1273** 0.0574 0.0352
(2.3965) (1.1992) (0.3812)
Concentration in Layers of Stack -0.0292* -0.0279* -0.0417 (-1.7956) (-1.7068) (-0.7347) Payment with Cash 0.0609*** 0.063*** 0.2599***
(3.7574) (3.8654) (4.757)
Acquirer Equity Value -0.0093*** -0.0064**
(-2.7722) (-2.0265)
Relative Size Target/Acquirer 0.0355**
(2.436) Percentage of Target Acquired 0.002** (2.1062)
R^2 0.1045 0.0915 0.1184 F-statistic 8.149 6.345 8.283 N 193 193 193 *** Statistically significant at the 1% level. ** Statistically significant at the 5% level. * Statistically significant at the 10% level.

18
Results for the five-layer stack:
The results are still not highly significant if we use the concentration measure:
Variable Model 2 Intercept 0.0092 (0.6545) Size Target/Acquirer 0.1168*** (2.8548) Same layer / Concentration -0.0429* (-1.7804) R^2 0.1943 F-statistic 5.064 N 45 *** Statistically significant at the 1% level. ** Statistically significant at the 5% level. * Statistically significant at the 10% level.

19
Results for the five-layer stack:
The results are not significant if we use the index STACKD.
Variable Model 4 Intercept 0.0056 (0.1997) Size Target/Acquirer 0.1027** (2.3797) STACKD2 -0.0044 (-0.4039) R^2 0.1368 F-statistic 3.329 N 45 *** Statistically significant at the 1% level. ** Statistically significant at the 5% level. * Statistically significant at the 10% level.

20
Results for the five-layer stack:
The results are significant when we add the square of STACKD. Variable Model 5 Intercept -0.0935* (-1.8479) Size Target/Acquirer 0.1067* (2.5923) STACKD2 0.0919** (2.1312) STACKD2^2 -0.0195** (-2.3019) R^2 0.2356 F-statistic 4.213 N 45 *** Statistically significant at the 1% level. ** Statistically significant at the 5% level. * Statistically significant at the 10% level.

21
Distribution of SIC codes in the three-layer stack
Hardware: 3571 – Electronic Computers 3572 – Computer Storage Devices 3575 – Computer Terminals 3577 – Computer Peripheral Equipment, Not Elsewhere Classified 3661 – Telephone and Telegraph Apparatus 3663 – Radio and Television Broadcasting and Communications Equipment 3669 – Communications Equipment, Not Elsewhere Classified 3674 – Semiconductors and Related Devices 4812 – Radiotelephone Communications 4813 – Telephone Communications, Except Radiotelephone 4822 – Telegraph and Other Related Devices 4841 – Cable and Other Pay Television Services 4899 – Communications Services, Not Elsewhere Classified Software: 7371 – Computer Programming7372 – Prepackage Software Services: 7373 – Computer Integrated Systems Design 7374 – Computer Processing and Data Preparation and Processing Services 7375 – Information Retrieval Services 7376 – Computer Facilities Management Services 7377 – Computer Rental and Leasing 7378 – Computer Maintenance and Repair 7379 – Computer Related Services, Not elsewhere Classified
Related Documents