1 Use of Ocean Surface Winds in NCEP’s Global Data Assimilation System Stephen J. Lord Director NCEP Environmental Modeling Center NCEP: “where America’s climate, weather, and ocean services begin”

1 Use of Ocean Surface Winds in NCEP’s Global Data Assimilation System Stephen J. Lord Director NCEP Environmental Modeling Center NCEP: “where America’s.
Dec 23, 2015
Welcome message from author
This document is posted to help you gain knowledge. Please leave a comment to let me know what you think about it! Share it to your friends and learn new things together.
Transcript

1
Use of Ocean SurfaceWinds in NCEP’s
Global Data AssimilationSystem Stephen J. Lord
DirectorNCEP Environmental Modeling Center
NCEP: “where America’s climate, weather, and ocean services begin”

2
Overview
• Satellite data used in NWP and NWP applications
• The NASA-NOAA-DOD Joint Center for Satellite Data Assimilation– JCSDA-sponsored data impact studies– Impact of QuikSCAT and Windsat (L. Bi et al,
U. Wisconsin and JCSDA)– Improved use of surface wind observations

3
The Environmental Forecast Process
Observations
Analysis
Model Forecast
Post-processed Model Data
Forecaster
User (public, industry…)
NumericalForecastSystem
Data Assimilation

4
Satellite data used in NCEP’soperational data assimilation systems
• HIRS sounder radiances• AMSU-A sounder radiances• AMSU-B sounder radiances• GOES sounder radiances• GOES, Meteosat, GMS
winds• GOES precipitation rate• SSM/I precipitation rates• TRMM precipitation rates• SSM/I ocean surface wind
speeds• ERS-2 ocean surface wind
vectors
• Quikscat ocean surface wind vectors
• AVHRR SST• AVHRR vegetation fraction• AVHRR surface type• Multi-satellite snow cover• Multi-satellite sea ice• SBUV/2 ozone profile and
total ozone• AIRS• MODIS Winds • Altimeter sea level
observations (ocean data assimilation and wave data assimilation system)
5
POES Data Delivery00Z Average 1B Data Counts
0
0.5
1
1.5
2
0.00 1.00 2.00 3.00 4.00 5.00 6.00 7.00 8.00 9.00 10.00
(Mill
ion
s)
Dump Time - Cycle Time (Hours)
Ave
rag
e R
epo
rt C
ou
nt
HIRS-2 (1bhrs2) HIRS-3 (1bhrs3) AMSU-A (1bamua) AMSU-B (1bamub) MSU (1bmsu)
Loca
tions
Rec
eive
d (M
)
GFSData
Cutoff
NAMData
Cutoff
Next-generationSatellite Data Delivery

6
NCEP Forecast Systems andMission Applications
• Forecast Systems– Global Forecast System (GFS) & GDAS– North American Model (NAM) & RDAS– Rapid Update Cycle (RUC)– Global Ensemble System (GEN)– Short-Range Ensemble Forecast System (SREF)– Air Quality Forecast System– Hurricane System (HUR)*– Real Time Ocean Forecast System (RTOFS)– Global and Regional Wave System (WAV)– Ice Drift System (ICE)– Climate Forecast System (CFS)
* System does not have associated data assimilation system

7Five Order of Magnitude Increase in Satellite Data Over Next Ten YearsFive Order of Magnitude Increase in Satellite Data Over Next Ten YearsFive Order of Magnitude Increase in Satellite Data Over Next Ten YearsFive Order of Magnitude Increase in Satellite Data Over Next Ten Years
Count
(Mill
ions)
Daily Satellite & Radar Observation Count
20001990 2010 2010-10%of obs
2002 100 M obs
NPOESS Era Data Volume
2003-4 125 M obs
Level 2 radar data 2 B
2005 210 M obs

8
NASA-NOAA-DOD Joint Center for Satellite Data Assimilation
(JCSDA)– NOAA, NASA, DOD partnership– Mission
• Accelerate and improve the quantitative use of research and operational satellite data in weather and climate prediction models
– Current generation data– Prepare for next-generation (NPOESS, METOP,
research) instruments
– Supports applied research• Partners• University, Government and Commercial Labs

9
• February 2001– SSM/I precipitation estimates in physical initialization (preparation for
TRMM data)• May 2001
– Inclusion of cloud liquid water in model and data assimilation• October 2001
– TRMM TMI precipitation estimates added to physical initialization• January 2002
– QuikSCAT data added (3-8% improvement in 10 m winds vs. mid-latitude deep ocean buoys at 24-96 h; 7-17% improvement for MSLP)
• October 2002– Preparation for AIRS (upgraded OPTRAN, cloud detection, data
thinning algorithms)• June 2005
– AIRS data added (center spot, reduced channels)• November 2005
– MODIS winds added
Research Data Added to NCEP Operational Atmospheric Data Assimilation
2001-2005

10
Data Assimilation Impacts in the NCEP GDAS
(cont)
AMSU and “All Conventional” data provide nearly the same amount of improvement to the Northern Hemisphere.
N. Hemisphere 500 mb AC Z 20N - 80N Waves 1-20
15 Jan - 15 Feb '03
0
0.1
0.2
0.3
0.4
0.5
0.6
0.7
0.8
0.9
1
0 1 2 3 4 5 6 7 8 9 10 11 12 13 14 15 16
Forecast [days]
An
om
aly
Co
rrel
atio
n '
control
no amsu
no conv

11
N. Hemisphere 1000 mb htanomaly correlation
N. Hemisphere 1000 mb AC Z 20N - 80N Waves 1-20
15 Jan - 15 Feb '03
0
0.1
0.2
0.3
0.4
0.5
0.6
0.7
0.8
0.9
1
0 1 2 3 4 5 6 7 8 9 10 11 12 13 14 15 16
Forecast [days]
An
om
aly
Co
rrel
atio
n
'
control
no amsu
N. Hemisphere 1000 mb AC Z 20N - 80N Waves 1-20
15 Jan - 15 Feb '03
0
0.1
0.2
0.3
0.4
0.5
0.6
0.7
0.8
0.9
1
0 1 2 3 4 5 6 7 8 9 10 11 12 13 14 15 16
Forecast [days]
An
om
aly
Co
rrel
atio
n '
control
no hirs
AMSU: 0.5 day improvement at 5 days

12
Jung and Zapotocny
JCSDAFunded by
NPOESS IPO
Satellite data ~ 10-15% impact
Impact of Removing AMSU, HIRS, GOES Wind, Quikscat Surface Wind Data on Hurricane Track Forecasts in the Atlantic Basin - 2003 (34 cases)
-20.0
-15.0
-10.0
-5.0
0.0
5.0
10.0
15.0
12 24 36 48 72 96 120
Forecast Hour
% Im
prov
emen
t NOAMSU
NOHIRS
NOGOESW
NOQuikscat
Impact of Removing AMSU, HIRS, GOES Wind, Quikscat Surface Wind Data on Hurricane Track Forecasts in the East Pacific Basin - 2003 (24 cases)
-60.0
-50.0
-40.0
-30.0
-20.0
-10.0
0.0
10.0
20.0
30.0
12 24 36 48 72
Forecast Hour
% Im
pro
vem
ent
NOAMSU
NOHIRS
NOGOESW
NOQuikscat
Better
Worse
Worse
Better
EPAC
ATL
Impact ofREMOVING
SatelliteData
NOTStatisticallySignificant

13
Assimilating and determining the impact of sea surface winds measured by WindSat/Coriolis data in the Global
Forecast System
Li Bi
Tom Zapotocny
John Le Marshall
Michael Morgan
James Jung
31 May 2006

14
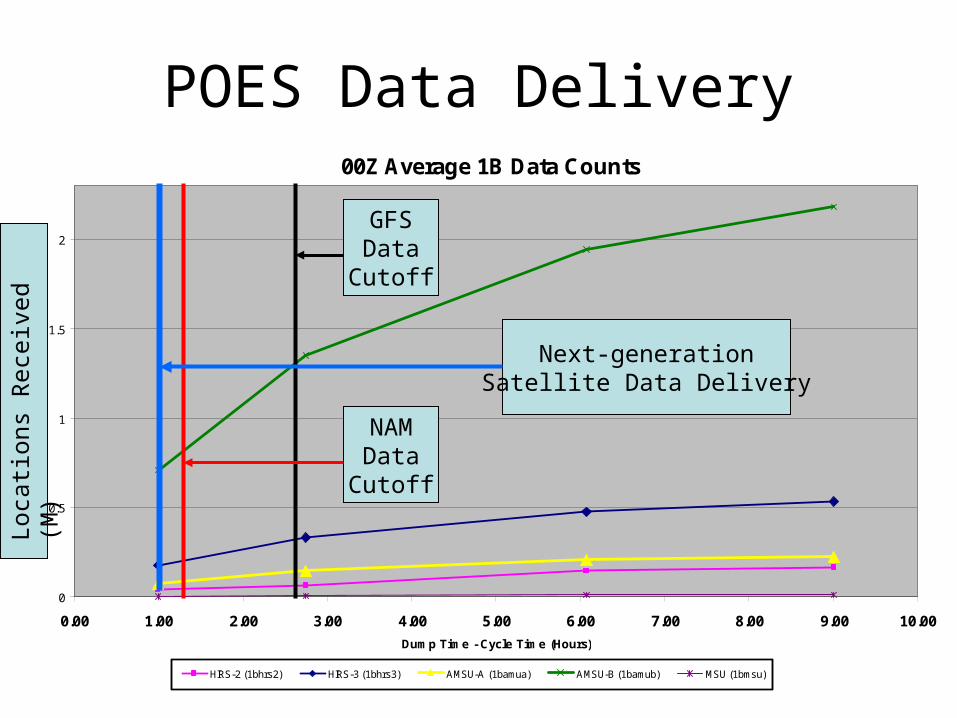
Goals of the Study
• Run GFS with QuikSCAT (cntrl254)
• Run GFS without QuikSCAT (noqscat254)
• Run GFS with Windsat & QuikSCAT
• Study statistical properties of QuikSCAT and Windsat products
15
N. Hemisphere 500 hPa AC Z 20N - 80N Waves 1-20
1 Jan - 15 Feb '04
0.6
0.65
0.7
0.75
0.8
0.85
0.9
0.95
1
0 1 2 3 4 5 6 7
Forecast [days]
An
om
aly
Co
rrel
atio
n '
Control Noqscat
S. Hemisphere 500 hPa AC Z 20S - 80S Waves 1-20
1 Jan - 15 Feb '04
0.6
0.65
0.7
0.75
0.8
0.85
0.9
0.95
1
0 1 2 3 4 5 6 7
Forecast [day]
An
om
aly
Co
rrel
atio
n '
Control Noqscat

16
N. Hemisphere 500 hPa AC Z 20N - 80N Waves 1-20
1 Jan - 15 Feb '04
0.6
0.65
0.7
0.75
0.8
0.85
0.9
0.95
1
0 1 2 3 4 5 6 7
Forecast [days]
An
om
aly
Co
rrel
atio
n '
Control Windsat
S. Hemisphere 500 hPa AC Z 20S - 80S Waves 1-20
1 Jan - 15 Feb '04
0.6
0.65
0.7
0.75
0.8
0.85
0.9
0.95
1
0 1 2 3 4 5 6 7
Forecast [day]
An
om
aly
Co
rrel
atio
n '
Control Windsat

17
Tropical WindsTropics 850 hPa AC V 20N - 20S Waves 1-20
1 Jan - 15 Feb '04
0.4
0.5
0.6
0.7
0.8
0.9
1
0 1 2 3 4 5 6 7
Forecast [day]
An
om
aly
Co
rrel
atio
n '
Control Windsat & QuikSCAT

18
WindSat and QuikSCAT Wind FieldsWindSat QuikSCAT
http://www.npoess.noaa.gov/polarmax

19
JCSDA Community Radiative Transfer Model (CRTM)
• Upgrades for 2006-2007– Major Science upgrades available for immediate testing & further development
• Scattering by clouds• Surface optics• Multiple stream (impacts surface emissivity and reflection)• Aerosol absorption and scattering (Weaver, JCSDA AO)• Preparation for advanced instruments (IASI, CrIS, etc)
– Laying foundation for advanced applications (2006-2010)• Begin assimilation of cloudy radiances• Requires major
– Computing and human resources for complete evaluation of impact – Evaluation and upgrades to forecast model (for forecast cloud properties)– Bias correction and QC development (partial cloudiness, etc)
– Code structure and performance• Execution efficiency, memory footprint• To prepare for new absorption models (e.g. OSS) from JCSDA AO investigators (e.g. AER)• Increase flexibility for future changes• Establish and refine testing procedures (offline and in GSI)

20
Final Comments
• Surface Vector Winds (SVWs) are not a major driver of NWP skill
• Nonetheless, SVWs provide a useful supplement to sounding data and other wind retrievals for specific ocean phenomena (e.g. hurricanes)
• Forecaster use of SVWs is a major consideration
• Preliminary results QuikSCAT appears to be a better instrument than Windsat
• Future SVW capability should match QuikSCAT capability

21
ThanksQuestions?

22
Planning for FY09Integration and Testing of New
Observations1. Data Access (routine, real time) 3 months2. Formatting and establishing operational data base 1 month3. Extraction from data base 1 month4. Analysis development (I) 6-18 months5. Preliminary evaluation 2 months6. Quality control 3 months7. Analysis development (II) 6-18 months8. Assimilation testing and forecast evaluation 1 month9. Operational implementation 6 months10. Maintain system* 1 person “till death do us part”
* Scientific improvements, monitoring and quality assurance
Total Effort: 29-53 person months per instrument
23
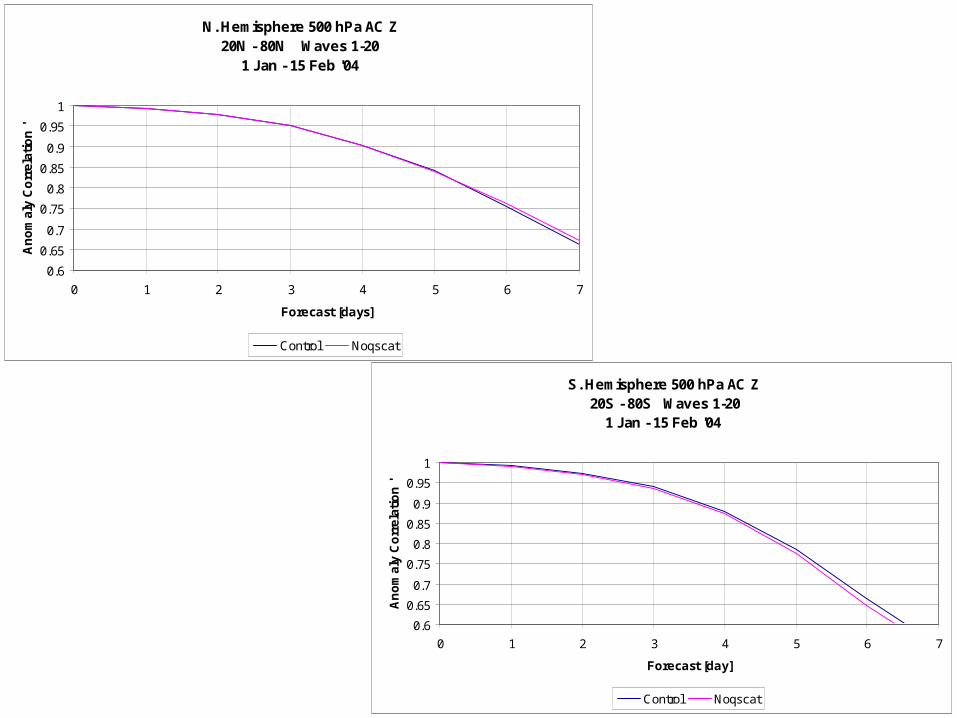
Facilitating Steps• Continue to increase support for
– Computing– Community-based data assimilation and model advances at NOAA and
NASA• Begin to support
– Altimetry and surface wind instruments and data assimilation– Quality control (Operations)– Use of imagery and tracers (e.g. ozone) as proxy for direct wind
observations– “Coupled” data assimilation of atmosphere, land, ocean
• Increase prioritization and planning efforts for FY09– Understanding observing system impacts– New instrument classes
• Unique measurements• Cover under observed aspects of atmosphere, ocean, land
– Atmospheric winds– Coastal ocean data assimilation– Air quality & atmospheric monitoring– Land Surface data assimilation with direct use of radiances
– Example• Wind lidar
24
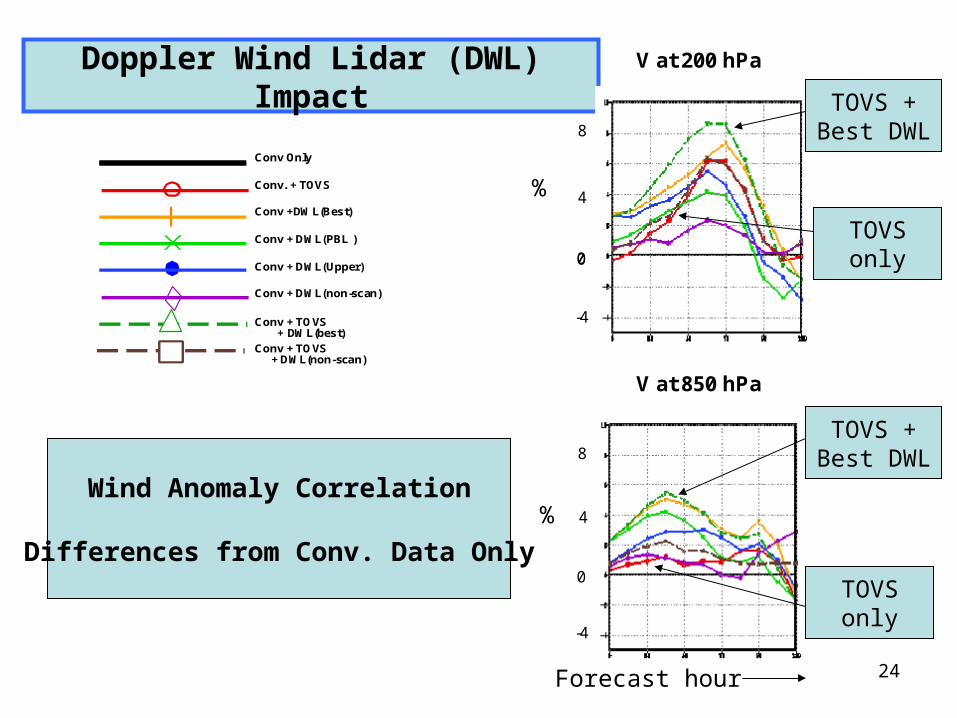
Doppler Wind Lidar (DWL) Impact
Conv Only
Conv. + TOVS
Conv + TOVS + DWL(best)
Conv + DWL(non-scan)
Conv + DWL(PBL )
Conv + TOVS + DWL(non-scan)
Conv +DWL(Best)
Conv + DWL(Upper)
V at 200 hPa
V at 850 hPa
4
-4
4
-4
8
8
00
0
Forecast hour
%
%Wind Anomaly Correlation
Differences from Conv. Data Only
TOVS +Best DWL
TOVSonly
TOVS +Best DWL
TOVSonly

25
500mb 5 Day Global Forecasts
40
45
50
55
60
65
70
75
80
85
90
1980 1990 2000 2010
Year
An
om
aly
Co
rre
lati
on
NH GFS
SH GFS
NH Reanalysis
SH Reanalysis
Impact of Observations and Numerical Forecast SystemTechnology Growth on Global Forecasts
Obsonly
NFSTech
Growth+ Obs
NFS TechGrowth:
ComputingData Assim.
ModelsEnsembles

26
ECMWFImprovement in medium-range forecast skill
NFSTech
Growth+ Obs
12-month running mean anomaly correlation (%) of 500hPa height forecasts
Obsonly

27
Current Satellite Data Assimilation Development (cont)
• Improved use of satellite data for SST analysis– Improved AVHRR QC and bias correction (Xu Li, A. Harris)– Addition of simplified ocean mixed-layer model (EMC-MMAB, GMAO)– Use of microwave instruments (e.g. AMSR-E)
• Upgrades to ozone assimilation– GOME and current NASA, NOAA instruments (CPC, JSDI; Stajner, GMAO, AO)
• Land surface data assimilation– Use of GMAO Catchment model as multi-Land Surface Model (LSM) system
(together with Noah, VIC and Sacramento LSMs)– Collaboration on advanced Ensemble Kalman Filter (EKF) techniques
• Ocean data assimilation– Use of altimeter data (EMC, Behringer)– Impacts on S/I forecasting (EMC, Behringer)– GMAO uses Poseidon isopycnal model but will test developments in MOM-4
• Observing system design and impacts– Analysis adjoint diagnostic tools– Observing System Simulation Experiments (OSSEs) for
• Understanding interaction between observing system and DA system • Defining potential impact of and preparing for future instruments

28
Global Data AssimilationObservations Processing
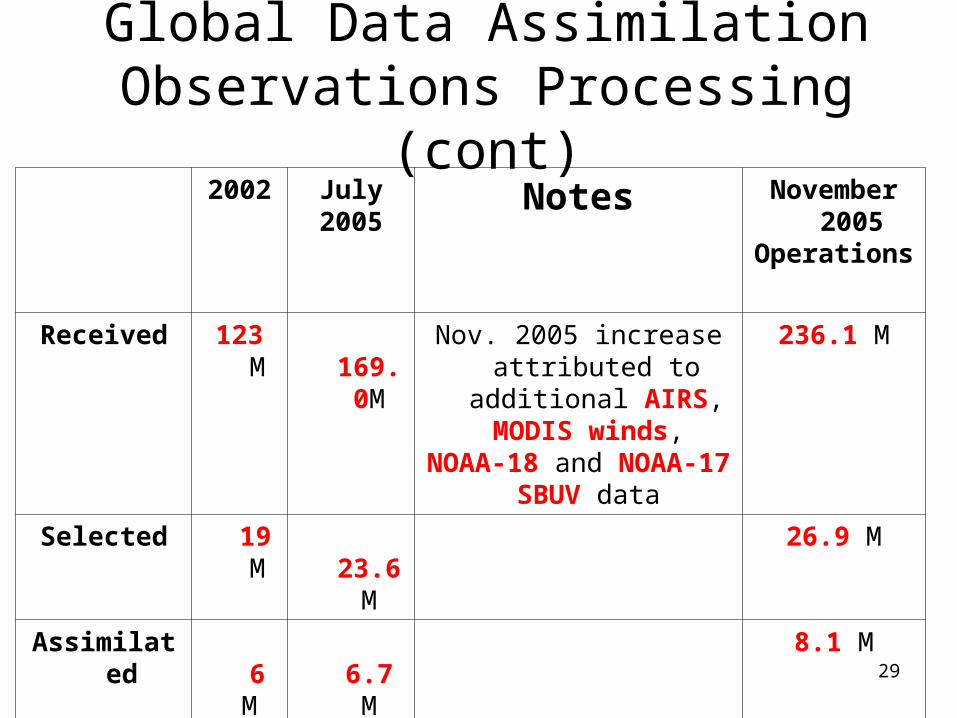
• Definitions– Received: The number of observations received operationally
per day from providers (NESDIS, NASA, Japan, Europeans and others) and maintained by NCEP’s Central Operations. Counted observations are those which could potentially be assimilated operationally in NCEP’s data assimilation system. Observations from malfunctioning instruments are excluded.
– Selected: Number of observations that is selected to be considered for use by the analysis (data numbers are reduced because the intelligent data selection identifies the best observations to use). Number excludes observations that cannot be used due to science deficiencies.
– Assimilated: Number of observations that are actually used by the analysis (additional reduction occurs because of quality control procedures which remove data contaminated by clouds and those affected by surface emissivity problems, as well as other quality control decisions)
29
Global Data AssimilationObservations Processing (cont)
2002 July2005
Notes November 2005
Operations
Received 123 M 169.0M Nov. 2005 increase attributed to additional AIRS, MODIS winds,
NOAA-18 and NOAA-17 SBUV data
236.1 M
Selected 19 M 23.6 M 26.9 M
Assimilated 6 M 6.7 M 8.1 M

30
Current Satellite Data Assimilation Development at the JCSDA
• Community Radiative Transfer Model (CRTM)– NESDIS/ORA leads scientific development– EMC transitions development to operations & maintains operational codes– GMAO focuses on applications to NASA instruments used in research DA
systems– Examples of CTRM applications
• AIRS• MODIS• WindSat• SSM/IS• AMSR• OMI• ATMS• IASI• CrIS• OMPS
• JCSDA partnership for COSMIC – Project management (NESDIS)– Data delivery, formatting (UCAR, NCEP Central Ops)– Scientific algorithms and QC (JCSDA, NESDIS, UCAR)– Testing with CHAMP data prior to launch with DA system (JCSDA, EMC, UCAR)
Related Documents