1 Update on the Hong Kong Update on the Hong Kong Economy for Economy for The Task Force on Economic The Task Force on Economic Challenges Challenges Government Economist Government Economist 3 April 2009 3 April 2009

1 Update on the Hong Kong Economy for The Task Force on Economic Challenges Government Economist 3 April 2009.
Dec 26, 2015
Welcome message from author
This document is posted to help you gain knowledge. Please leave a comment to let me know what you think about it! Share it to your friends and learn new things together.
Transcript

1
Update on the Hong Kong Economy for Update on the Hong Kong Economy for The Task Force on Economic ChallengesThe Task Force on Economic Challenges
Government EconomistGovernment Economist
3 April 20093 April 2009

2
Global economic situation continued to worsen…
3
US: recession in 2009 likely to bethe worst since WWII
-8
-6
-4
-2
0
2
4
6
8
10
90 91 92 93 94 95 96 97 98 99 00 01 02 03 04 05 06 07 08 09
US'sLeadingIndicator
US's GDPannualised
q-t-q rate of changein real terms
Rate of change (%)
US recession in Q4 most serveresince 1982
US imports plunging in tandemwith consumption
-20
-15
-10
-5
0
5
10
15
20
25
30
96 97 98 99 00 01 02 03 04 05 06 07 08 09
US's importsdemand
in real terms
Year-on-year growth rate (%)
US's importsfrom Asia in
nominalterms

4
EU and Japan likewise in dire stateEU GDP vs Sentiment Index
-50
-40
-30
-20
-10
0
10
20
30
40
50
97 98 99 00 01 02 03 04 05 06 07 08 09-6
-4
-2
0
2
4
6
EU'sSentiment
Index(LHS)
EU's GDPannualised q-t-q rate of
change in real terms(RHS)
Year-on-yeargrowth rate (%)
Quarter-to-quartergrowth rate (%)
Japan GDP vs Tankan Survey
-50
-40
-30
-20
-10
0
10
20
30
40
50
95 96 97 98 99 00 01 02 03 04 05 06 07 08-6
-4
-2
0
2
4
6
Japan TANKANLarge enterprises
(LHS)
Japan GDPReal Growth
(RHS)
Index Year-on-year growth rate (%)

5
GDP growth sharply down
-15
-10
-5
0
5
10
15
Q104
Q304
Q105
Q305
Q106
Q306
Q107
Q307
Q108
Q308
China Japan Hong Kong Singapore
Korea Taiwan Indonesia Malaysia
Philippines Thailand
Year-on-year growth rate (%)
Asia’s recession deepened furtherExports all plunging in Jan & Feb
(Year-on-year % change)
Q3 08 Q4 08Jan & Feb
09
China 23.1 4.4 -21.1
Japan 3.2 -23.1 -47.6
Hong Kong 5.5 -2.1 -22.4
Singapore -8.6 -17.8 -29.8
Korea 27.0 -9.9 -26.4
Taiwan 8.0 -24.7 -37.2
Indonesia 27.9 -6.2 -36.1*
Malaysia 16.8 -7.5 -27.8*
Philippines 4.0 -22.5 -40.6*
Thailand 26.0 -7.6 -16.0
(*) January figures.

6
Guangdong’s processing exportsand imports markedly down China's Exports
-50
-40
-30
-20
-10
0
10
20
30
40
50
01/06 07/06 01/07 07/07 01/08 07/08 01/09
Mainland's exports
Guangdong's exports
Guangdong's processingtrade exports
China's Imports
-50
-40
-30
-20
-10
0
10
20
30
40
50
01/06 07/06 01/07 07/07 01/08 07/08 01/09
Mainland's imports
Guangdong's imports
Guangdong's processingtrade imports
Jan & Feb/09Guangdong's processing
trade import : -37.1%
Year on Year growth (%)
Jan & Feb/09Guangdong's processing
trade export : -25.3%
Year on Year growth (%)

7
Export orders rebounding CFLP China Manufacturing PMI
( New export orders shifted forward by 1 month)
25
30
35
40
45
50
55
60
65
70
75
01/05 07/05 01/06 07/06 01/07 07/07 01/08 07/08 01/09-50
-40
-30
-20
-10
0
10
20
30
40
50
China Manufacturing PMI - New export orders (LHS)
China's exports (RHS)
PMI (Index) Year-on-year rate of change (%)
8
Hong Kong economic situation

9
Latest local developments in 2009
• Decline in exports even steeper in January and February
• Retail sales fell in January and February combined
• Flat prices stabilised after an extended period of subdued activities
• Credit conditions eased somewhat in general, but remain tight for sectors hit direct by the shrinking trade flows (e.g. I/E trade and logistics)
• Unemployment rate risen further; employment on a general downtrend

10
External trade

11
Exports sharply down
-80
-60
-40
-20
0
20
40
60
80
1/97 1/98 1/99 1/00 1/01 1/02 1/03 1/04 1/05 1/06 1/07 1/08 1/09-30
-25
-20
-15
-10
-5
0
5
10
15
20
25
30
-30
-20
-10
0
10
20
30
Q197
Q198
Q199
Q100
Q101
Q102
Q103
Q104
Q105
Q106
Q107
Q108
Q109
0
1
2
3
4
5
6
7
8
Hong Kong's total exports(LHS)
World GDP*(RHS)
Year-on-year growth rate in real terms (%)
(*) The world GDP being plotted here is weighted by Hong Kong's total exports of goods.(#) Crude estimates.
Q4/081.7%
Jan-Feb
09#
Year-on-year growthrate in tonne (%)
Year-on-year growthrate in TEU (%)
Air cargo(LHS)
Container throughput(RHS)
Feb-19.7%
-22.0%Jan-Feb-24%

12
Indicators of external trade all down(year-on-year rate of change)
2008 2009Q3 Q4 Jan & Feb
Exports 2.1% -3.5% -24%#
US -7.1% -13.0% -24%#
EU 2.0% -6.3% -23%#
Japan -1.2% -1.0% -16%#
Mainland 3.9% 0.4% -25%#
Asia excl. Mainland and Japan 2.2% -8.2% -28%#
Air cargoes -3.6% -18.6% -24.7%
Container throughput 7.4% -10.3% -22%#
(#) Crude estimates.

13
Domestic sector
14
-12
-10
-8
-6
-4
-2
0
2
4
6
8
10
12
14
16
Q197
Q198
Q199
Q100
Q101
Q102
Q103
Q104
Q105
Q106
Q107
Q108
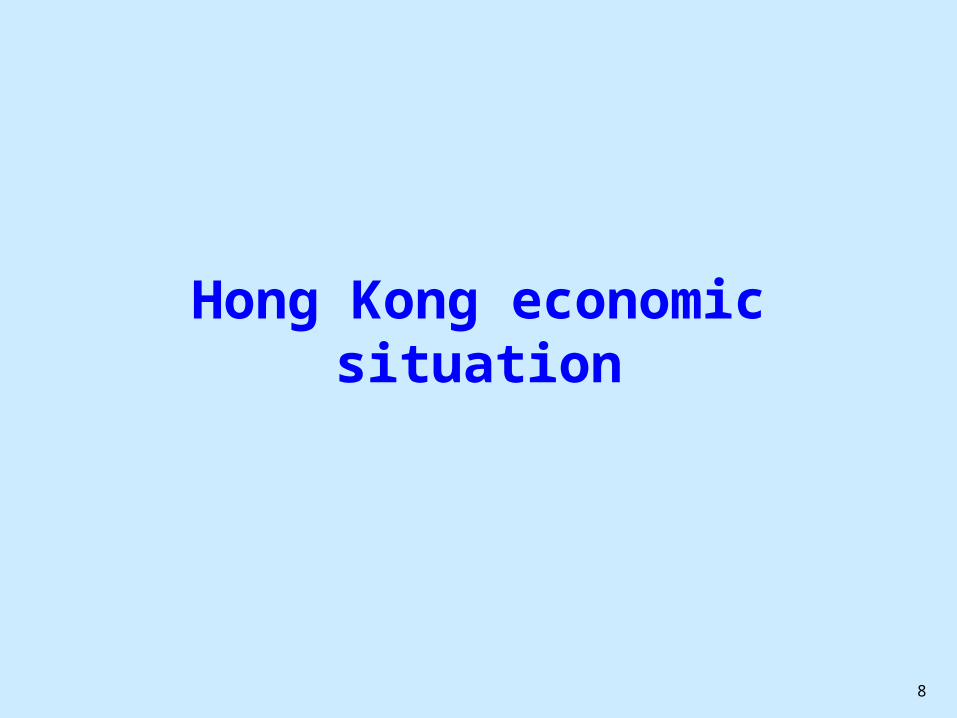
Year-on-year rate of change in real terms (%)
Private consumptionexpenditure
-30
-20
-10
0
10
20
30
40
Q197
Q198
Q199
Q100
Q101
Q102
Q103
Q104
Q105
Q106
Q107
Q108
Year-on-year rate of change in real terms (%)
Expenditure ofbuilding andconstruction
Expenditure of machinery,equipment and
computer software
Overallinvestmentexpenditure
-3.2%
-3.6%
-17.3%-18.7%
Private consumption fell in 2008Q4
Investment also deteriorated on dimmer prospects

15
Consumption and investment:Relevant indicators
2008Q3 2008Q4 2009
Jan&Feb
(year-on-year % change in real terms)
Consumption
Retail sales volume 4.2 -2.3 -3.6
Restaurant receipts 6.6 2.9 N.A.
Visitor arrivals 3.4 -0.9 1.8
Investment
Machinery and equipment
10.6 -18.7 N.A.
Building and construction
-4.1 -3.6 N.A.
Building consents(8-quarter average)
-10.0 -13.4 -16.2

16
Financial services
17
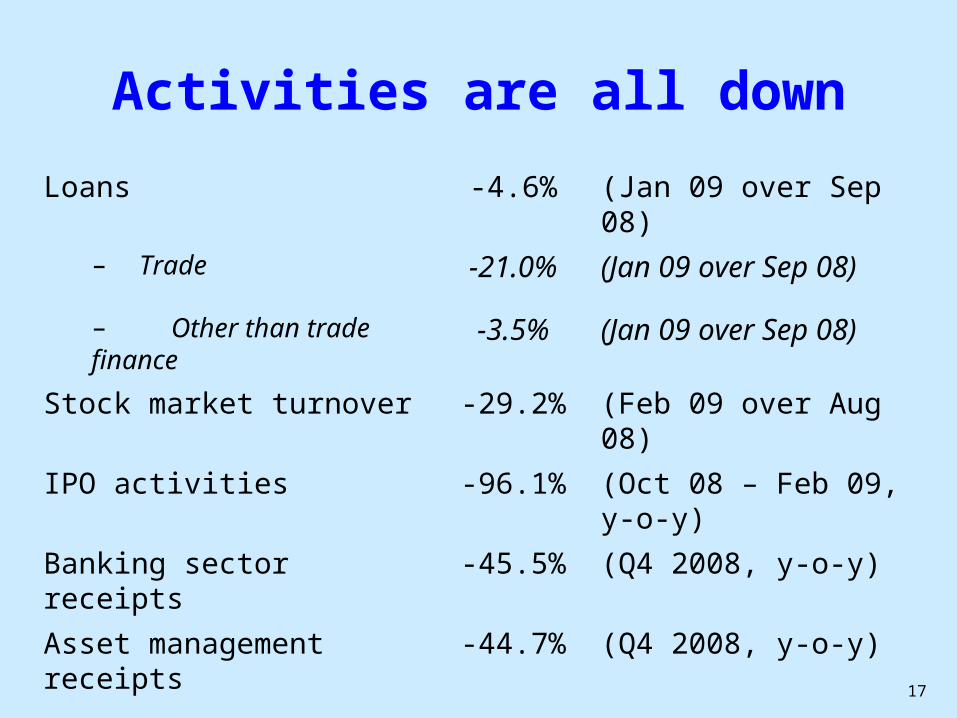
Activities are all down
Loans -4.6% (Jan 09 over Sep 08)
– Trade -21.0% (Jan 09 over Sep 08)
– Other than trade finance -3.5% (Jan 09 over Sep 08)
Stock market turnover -29.2% (Feb 09 over Aug 08)
IPO activities -96.1% (Oct 08 – Feb 09, y-o-y)
Banking sector receipts -45.5% (Q4 2008, y-o-y)
Asset management receipts -44.7% (Q4 2008, y-o-y)

18
Property market
19
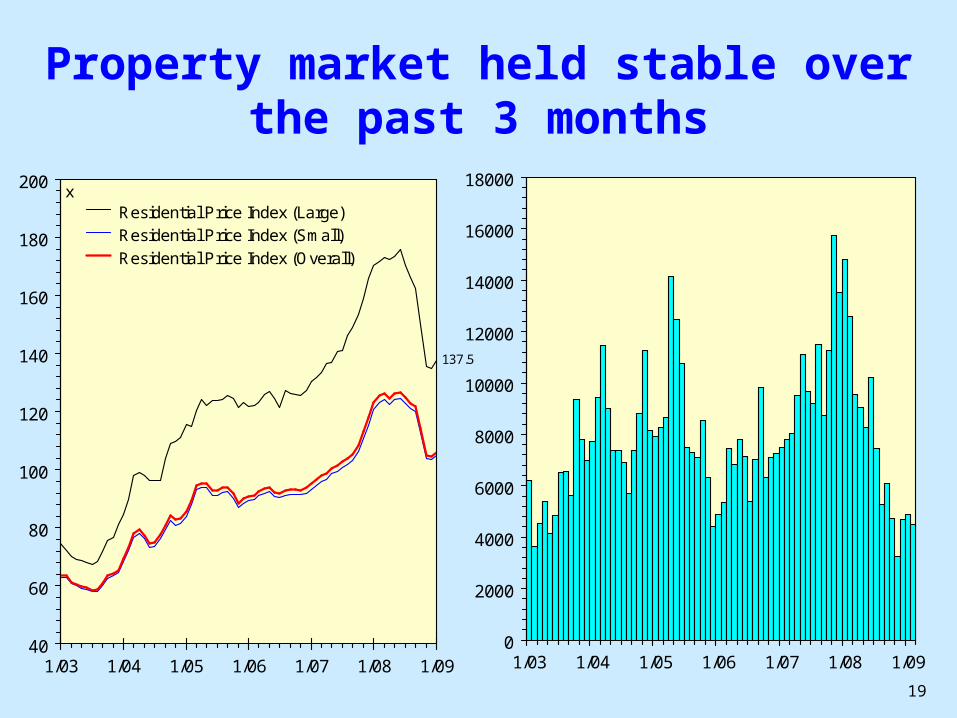
Property market held stable over the past 3 months
40
60
80
100
120
140
160
180
200
1/03 1/04 1/05 1/06 1/07 1/08 1/09
Residential Price Index (Large)
Residential Price Index (Small)
Residential Price Index (Overall)
Indexx
0
2000
4000
6000
8000
10000
12000
14000
16000
18000
1/03 1/04 1/05 1/06 1/07 1/08 1/09
Residential propertytransactions
Number
137.5
106.0104.9
4487
20
-40
-30
-20
-10
0
10
20
30
40
50
Q197
Q198
Q199
Q100
Q101
Q102
Q103
Q104
Q105
Q106
Q107
Q108
Q109
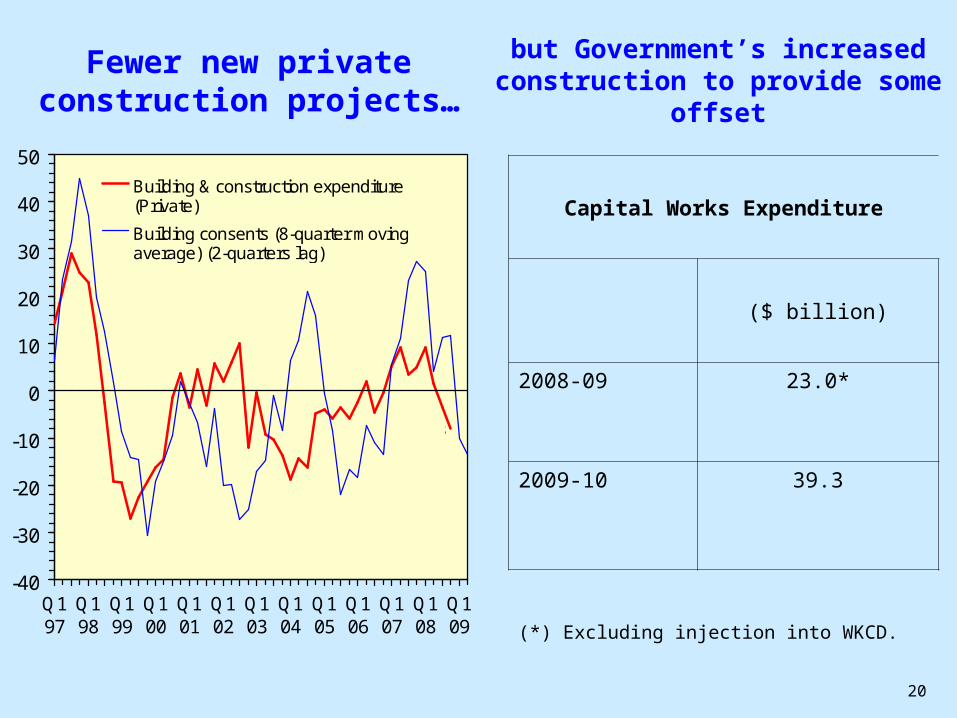
Building & construction expenditure(Private)
Building consents (8-quarter movingaverage) (2-quarters lag)
Year-on-year growth rate in real terms (%)
-13.4%
Q408-8.0%
Fewer new private construction projects…
but Government’s increased construction to provide some offset
Capital Works Expenditure
($ billion)
2008-09 23.0*
2009-10 39.3
(*) Excluding injection into WKCD.

21
Labour market

22
Unemployment rate rising markedly across-the-board
Dec 08 – Feb 09(3)
Change in unemployment rate
over Jun-Aug 08
(%) (% point)
Trading and logistics 4.8 2.3
Trading(1) 4.2 2.0
Logistics(2) 6.2 3.1
Tourism and consumption-related services
6.1 1.6
Retail trade 5.4 1.1
Restaurants 7.5 2.1
Hotels 2.7 1.1
Real estate and construction 7.9 2.7
Real estate 3.9 1.0
Construction 9.8 3.5
Financial services 2.5 0.9
Financing 2.5 1.0
Insurance 2.5 0.7
Others (including first time job seekers) 3.5 0.0
Total (seasonally adjusted) 5.0 1.8Notes: (1) The trading sector includes import/export trades and wholesale trade.
(2) The logistics sector includes freight transport, storage, postal and courier services.
(3) Provisional figures.
Source: General Household Survey, Census and Statistics Department.

23
Total job losses by sector since Jun-Aug 2008
Difference in employment at Dec 2008 – Feb 2009 as compared to Jun-Aug 2008
Trading and logistics -17 400
Trading(1) -2 600
Logistics(2) -14 800
Financial services -13 500
Financing -13 700
Insurance 100
Tourism and consumption-related services -500
Retail trade 4 300
Restaurants -5 300
Hotels 500
Real estate and construction 1 300
Real estate 300
Construction -1 700
Notes: (1) The trading sector includes import/export trades and wholesale trade.
(2) The logistics sector includes freight transport, storage, postal and courier services.
(3) The figures being listed here are provisional.
Source: General Household Survey, Census and Statistics Department.

24
Feedback from SMEs
25
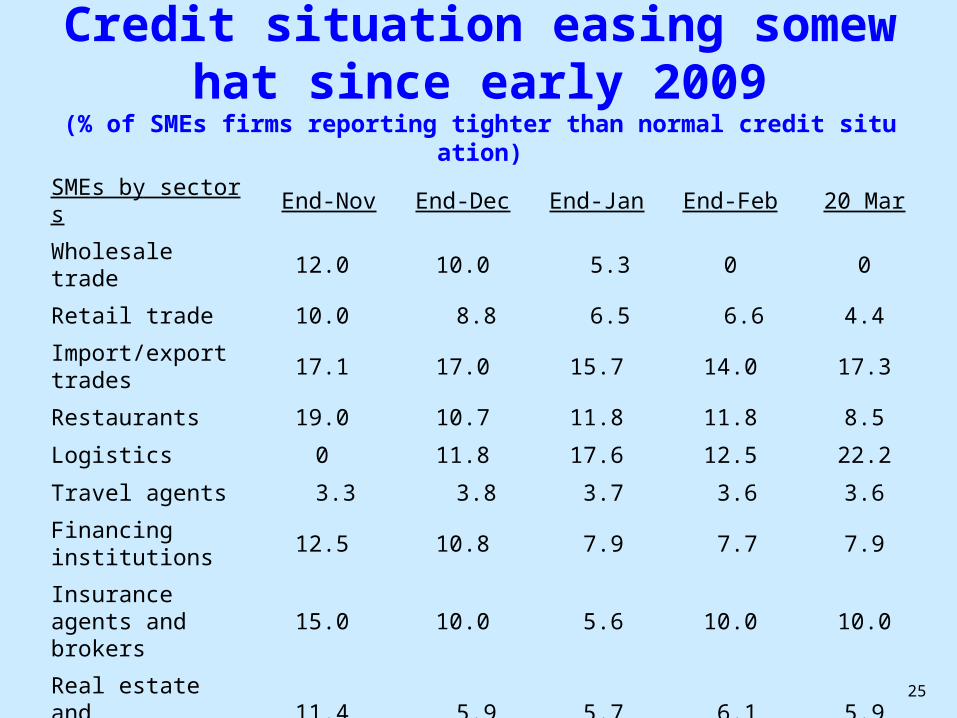
Credit situation easing somewhat since early 2009
(% of SMEs firms reporting tighter than normal credit situation)
SMEs by sectors End-Nov End-Dec End-Jan End-Feb 20 Mar
Wholesale trade 12.0 10.0 5.3 0 0
Retail trade 10.0 8.8 6.5 6.6 4.4
Import/export trades 17.1 17.0 15.7 14.0 17.3
Restaurants 19.0 10.7 11.8 11.8 8.5
Logistics 0 11.8 17.6 12.5 22.2
Travel agents 3.3 3.8 3.7 3.6 3.6
Financing institutions 12.5 10.8 7.9 7.7 7.9
Insurance agents and brokers
15.0 10.0 5.6 10.0 10.0
Real estate and construction
11.4 5.9 5.7 6.1 5.9
Business services 5.7 6.1 0 0 2.9
All the above sectors 12.5 11.9 10.2 9.0 10.4
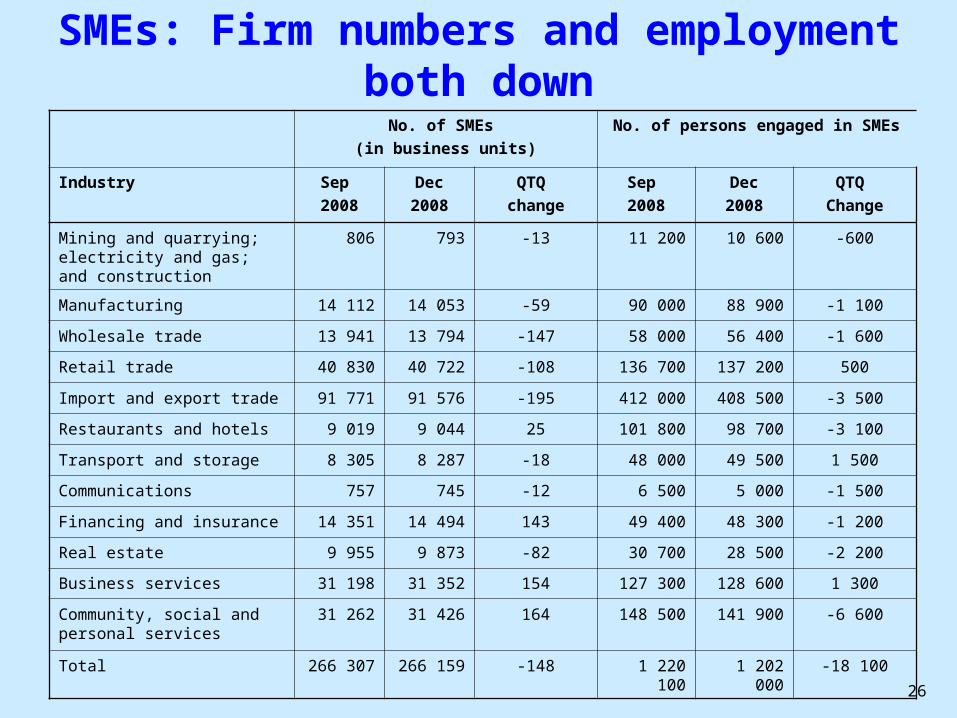
26
No. of SMEs
(in business units)
No. of persons engaged in SMEs
Industry Sep
2008
Dec
2008
QTQ
change
Sep
2008
Dec
2008
QTQ
Change
Mining and quarrying; electricity and gas; and construction
806 793 -13 11 200 10 600 -600
Manufacturing 14 112 14 053 -59 90 000 88 900 -1 100
Wholesale trade 13 941 13 794 -147 58 000 56 400 -1 600
Retail trade 40 830 40 722 -108 136 700 137 200 500
Import and export trade 91 771 91 576 -195 412 000 408 500 -3 500
Restaurants and hotels 9 019 9 044 25 101 800 98 700 -3 100
Transport and storage 8 305 8 287 -18 48 000 49 500 1 500
Communications 757 745 -12 6 500 5 000 -1 500
Financing and insurance 14 351 14 494 143 49 400 48 300 -1 200
Real estate 9 955 9 873 -82 30 700 28 500 -2 200
Business services 31 198 31 352 154 127 300 128 600 1 300
Community, social and personal services
31 262 31 426 164 148 500 141 900 -6 600
Total 266 307 266 159 -148 1 220 100 1 202 000 -18 100
SMEs: Firm numbers and employmentboth down

27
Employment in SMEs under heavy downward drag amid economic downturn
-10
-5
0
5
10
15
Q198
Q398
Q199
Q399
Q100
Q300
Q101
Q301
Q102
Q302
Q103
Q303
Q104
Q304
Q105
Q305
Q106
Q306
Q107
Q307
Q108
Q308
Total employment
GDP in real terms
Year-on-year rate of change (%)
Total SME employment

28
2009 outlook
29
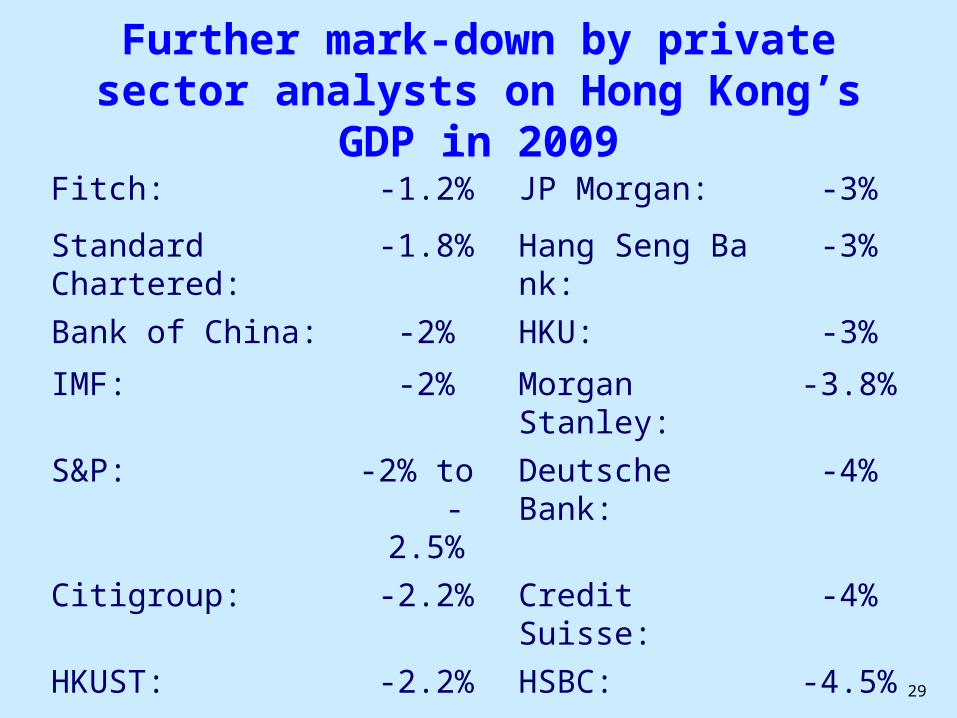
Further mark-down by private sector analysts on Hong Kong’s GDP in 2009
Fitch: -1.2% JP Morgan: -3%
Standard Chartered:
-1.8% Hang Seng Bank: -3%
Bank of China: -2% HKU: -3%
IMF: -2% Morgan Stanley: -3.8%
S&P: -2% to -2.5%
Deutsche Bank: -4%
Citigroup: -2.2% Credit Suisse: -4%
HKUST: -2.2% HSBC: -4.5%
Hong Kong Government:
-2% to -3%
Goldman: -6%

30
End
Related Documents