UNRWA UNRWA education education 1 UNRWA – UNESCO UNRWA – UNESCO Education Programme Education Programme SubCom May 2 nd , 2012 Reform Update

Welcome message from author
This document is posted to help you gain knowledge. Please leave a comment to let me know what you think about it! Share it to your friends and learn new things together.
Transcript

UN
RW
A
UN
RW
A
ed
uca
tion
ed
uca
tion
11
UNRWA – UNESCOUNRWA – UNESCOEducation Education
ProgrammeProgramme
SubCom May 2nd, 2012
Reform Update

UN
RW
A
UN
RW
A
ed
uca
tion
ed
uca
tion
22
Efficiency and effectivenessWay of working: harmonisation, strategic work (planning, M & E – new Indicators, baselines and trends), partnerships and good governanceFocus areas: Investment in/interrelationship of key quality areas which make a difference: teachers (getting the best teachers and making the most out of them), inclusive education, curriculum, TVETZero additional recurrent cost: Teacher Policy, Inclusive Education, teacher training

UN
RW
A
UN
RW
A
ed
uca
tion
ed
uca
tion
33

UN
RW
A
UN
RW
A
ed
uca
tion
ed
uca
tion
44
VISION
STRATEGY & POLICY
DEVELOPMENT PHASE
April 2010
December 2010
2011
2012
2015
OPERATIONAL PLANNING+ BUDGETING
(+ CAPACITY BUILDING)
UNRWA Education Reform
IMPLEMENTATION PHASE
MONITORING & EVALUATION
Ed
Leading
Leading
Leading
Oversight
Oversight
FO
MC Approval
Contributing
Managing
Leading & Managing

UN
RW
A
UN
RW
A
ed
uca
tion
ed
uca
tion
55
Optimization in the Teacher Policy

UN
RW
A
UN
RW
A
ed
uca
tion
ed
uca
tion
666
parameters Baseline (2010-2011) 2011-2012 2012-2013 2013-2014 2017-2018 2018-2019 2019-2020 2020-2021
Years 0 1 2 3 7 8 9 10Education system dataNumber of students 66 400 66 573 66 746 66 919 67 618 67 794 67 970 68 147
Target for the evolution of the number of students 0,26% 0,26% 0,26% 0,26% 0,26% 0,26% 0,26% 0,26% 0,26%
Targeted year 10
Target PTR 31,1
Target year for PTR 10,00
Student teacher ratio (STR) 31,1 31,1 31,1 31,1 31,1 31,1 31,1 31,1
Student class section ratio 38,7 38,7 38,7 38,7 38,7 38,7 38,7 38,7
Number of equivalent full-time teacher posts 2136 2141 2147 2152 2175 2180 2186 2191
Teaching staffTeacher attrition rate 3,10% 4,3% 3,10% 3,10% 3,10% 3,10% 3,10% 3,10% 3,10%
Year of creation of the new categories of staff 4
Teaching staff by categoryDaily paid teachers (DPT) equivalent full-time posts 81 81 81 82 83 83 83 83% of daily paid teachers in the targeted year 3,8% 3,8% 3,8% 3,8% 3,8% 3,8% 3,8% 3,8% 3,8%Targeted year 10Teachers (except DPT, mentors and NQT) 2055 2060 2065 2071 1922 1925 1931 1935Teaching load of NQT (% of full load) 80% 0,00% 0,00% 0,00% 0,00% 80,00% 80,00% 80,00% 80,00%Newly qualified teachers (NQT), first year of teaching 0 0 0 0 65 68 67 68Norm for mentors (% of total teaching staff) 6,67% 0,00% 0,00% 0,00% 0,00% 6,67% 6,67% 6,67% 6,67%Teaching load of mentors (% of full load) 80% 0,00% 0,00% 0,00% 0,00% 80,00% 80,00% 80,00% 80,00%Mentor teachers 0 0 0 0 147 147 148 148
Total number of teaching staff 2136 2141 2147 2152 2217 2223 2229 2234
Non-teaching staff
Number of schools 118 118 118 118 118 118 118 118
Non-teaching staff by categorySchool supervisors (Ed. Specialists from Sept. 2011 onward) 32 32 32 32 0 0 0 0
Norm for Education Specialists (teachers per ES) 40 0,00% 0,00% 0,00% 0,00% 2,50% 2,50% 2,50% 2,50%
Education specialists 0 0 0 0 55 55 55 56
Norm for Quality Assurance Officers (schools / QAO) 10
Quality assurance officers 0 0 0 0 12 12 12 12
Norm for Professional Development Coordinators 7
Professional development coordinators 0 0 0 0 7 7 7 7
Assistant headteacher / Deputy principal 40 40 40 40 40 40 40 40
Headteacher / Principal 118 118 118 118 118 118 118 118
Management staff (Deans, Chief, Deputies, etc.)Other staff
Total number of non-teaching staff 190 190 190 190 232 232 232 232
Increase in the number of non-teaching staff 0 0 0 0 0 0 0
The financial simulation model
UN
RW
A
UN
RW
A
ed
uca
tion
ed
uca
tion
77
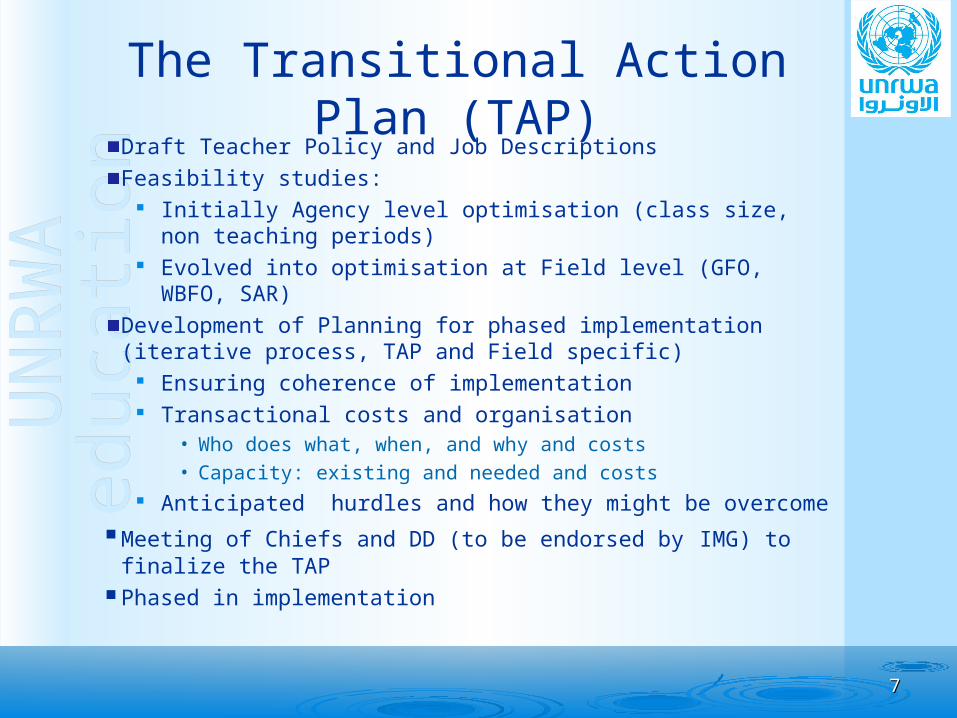
The Transitional Action Plan (TAP)
Draft Teacher Policy and Job DescriptionsFeasibility studies:
Initially Agency level optimisation (class size, non teaching periods)
Evolved into optimisation at Field level (GFO, WBFO, SAR)
Development of Planning for phased implementation (iterative process, TAP and Field specific)
Ensuring coherence of implementation Transactional costs and organisation
• Who does what, when, and why and costs• Capacity: existing and needed and costs
Anticipated hurdles and how they might be overcome Meeting of Chiefs and DD (to be endorsed by IMG) to
finalize the TAP Phased in implementation

UN
RW
A
UN
RW
A
ed
uca
tion
ed
uca
tion
88
Moving forward….
Endorsement and implementationCommunication and advocacyEngagement with hosts, and particularly PAStructures and systemsFinancial support for EMIS – with recurrent costs, but will improve efficiency of system.

UN
RW
A
UN
RW
A
ed
uca
tion
ed
uca
tion
99

UN
RW
A
UN
RW
A
ed
uca
tion
ed
uca
tion
1010
Progress on Reform areasTeacher Development
Policy SBTD Leading for the Future JDs and Post
Inclusive Education IE Policy, IE Strategy Health and Education Strategy
TVET Review undertaken Strategy developed SDC supported programme GIZ and ILO

UN
RW
A
UN
RW
A
ed
uca
tion
ed
uca
tion
1111
Progress on Reform areas
Curriculum Framework Curriculum Policy Statement Curriculum Framework
Human Rights Human Rights Policy HR Learning Competency framework
• Evaluation of material• Development of Teacher Resource Kit
Support Areas Research studies and focal points Irish Aid Partnership strategy in line with ERD Governance Framework
Related Documents