1 UC Davis Athletics Baseline Data, 2000 to 2005 Prepared at the Request of Janet Gong, Interim Vice Chancellor--Student Affairs Lora Jo Bossio, Interim Assistant Vice Chancellor--Student Affairs on behalf of the Athletics Administrative Advisory Committee (AAAC) Academic Senate By Elias Lopez, Student Affairs Gillian Butler, SARI Kathy Davis, SARI Thomas Estes, SARI Bill Kidder, Student Affairs UCOP September 2007

Welcome message from author
This document is posted to help you gain knowledge. Please leave a comment to let me know what you think about it! Share it to your friends and learn new things together.
Transcript
1
UC Davis Athletics Baseline Data, 2000 to 2005
Prepared at the Request ofJanet Gong, Interim Vice Chancellor--Student Affairs
Lora Jo Bossio, Interim Assistant Vice Chancellor--Student Affairson behalf of the
Athletics Administrative Advisory Committee (AAAC) Academic Senate
ByElias Lopez, Student Affairs
Gillian Butler, SARIKathy Davis, SARI
Thomas Estes, SARIBill Kidder, Student Affairs UCOP
September 2007
Contents
Athletes per Sport
Admissions Characteristics
Performance at UC Davis
Graduation Characteristics
Links to Final Report and Presentation at www.sariweb.ucdavis.edu – “Latest publications”

Athletes per Sport
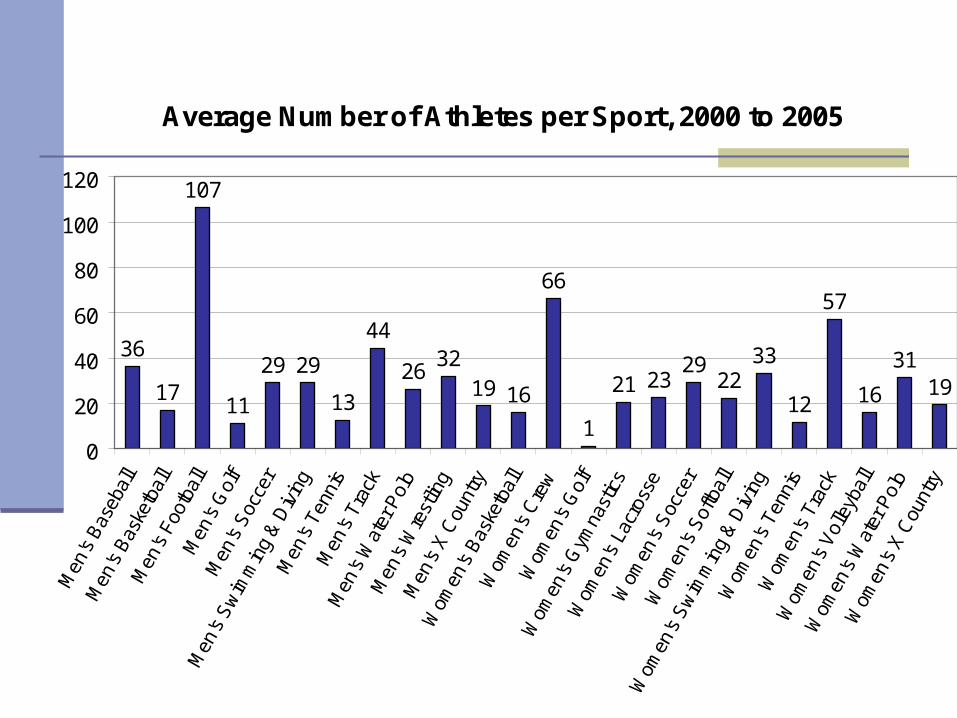
Average Number of Athletes per Sport, 2000 to 2005
36
17
107
11
29 29
13
44
2632
19 16
66
1
21 2329
2233
12
57
16
3119
0
20
40
60
80
100
120
Men
's B
aseb
all
Men
's B
aske
tbal
lM
en's
Foo
tbal
lM
en's
Gol
fM
en's
Soc
cer
Men
's S
wim
min
g &
Div
ing
Men
's T
enni
sM
en's
Tra
ck
Men
's W
ater
Pol
o
Men
's W
rest
ling
Men
's X
Cou
ntry
Wom
en's
Bas
ketb
all
Wom
en's
Cre
wW
omen
's G
olf
Wom
en's
Gym
nast
ics
Wom
en's
Lac
ross
e
Wom
en's
Soc
cer
Wom
en's
Sof
tbal
l
Wom
en's
Sw
imm
ing
& D
ivin
g
Wom
en's
Ten
nis
Wom
en's
Tra
ck
Wom
en's
Vol
leyb
all
Wom
en's
Wat
er P
olo
Wom
en's
X C
ount
ry

Change in the Number of Athletes Between 2000 and 2005
-7 -7
-16
-3 -3
2
-2
2
-2-4
-6
-2
-15
7
-2-5
1 1 1
-2 -1
0
-11-8
-20
-15
-10
-5
0
5
10

Admission Characteristics

Newly Admitted & EnrolledAthletes by Type of Admission, 2000 to 2005(includes Freshman and Transfer Students)
0
50
100
150
200
250
300
Total Athletes 279 242 276 234 250 217
UC Eligible AthleticSponsored
160 123 162 149 182 159
UC Eligible Not AthleticSponsored
92 113 106 78 64 53
Admitted by Exception 27 6 8 7 4 5
2000 2001 2002 2003 2004 2005
Total Athletes
Athletic Sponsored (UC Eligible)
Non-Athletic Sponsored (UC Eligible)
Athletes Admitted by Exception
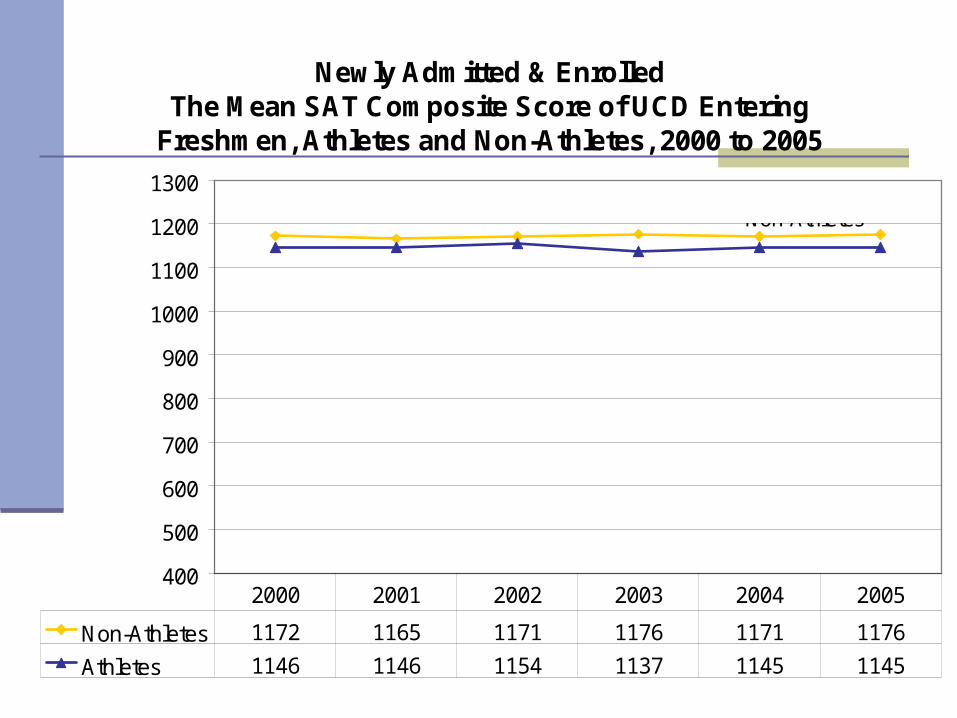
Newly Admitted & EnrolledThe Mean SAT Composite Score of UCD Entering
Freshmen, Athletes and Non-Athletes, 2000 to 2005
400
500
600
700
800
900
1000
1100
1200
1300
Non-Athletes 1172 1165 1171 1176 1171 1176
Athletes 1146 1146 1154 1137 1145 1145
2000 2001 2002 2003 2004 2005
Non-Athletes
Athletes
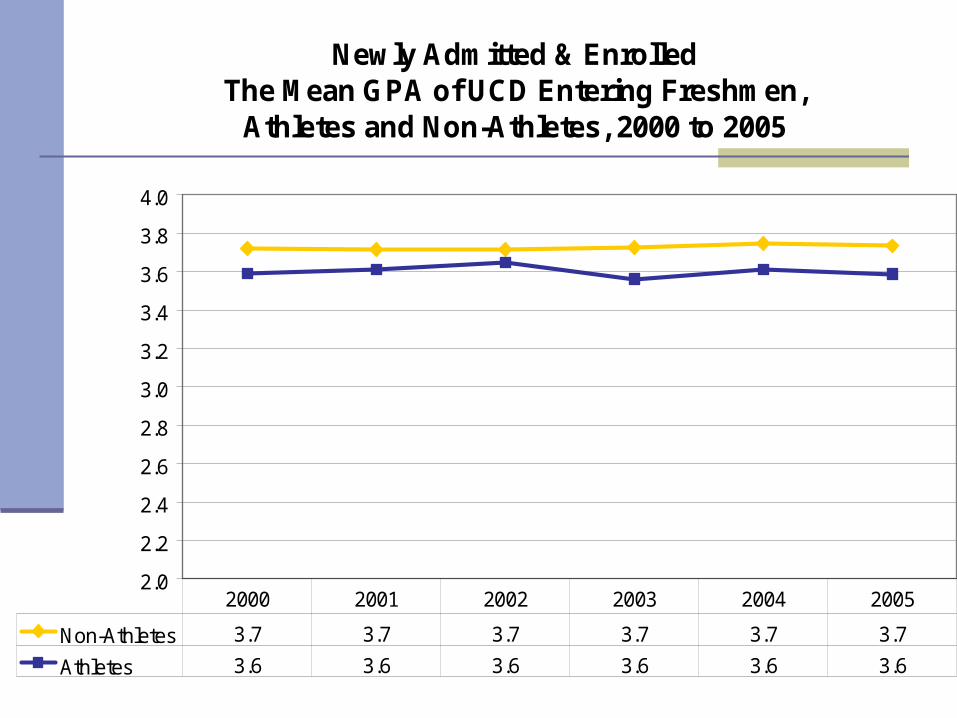
Newly Admitted & EnrolledThe Mean GPA of UCD Entering Freshmen,
Athletes and Non-Athletes, 2000 to 2005
2.0
2.2
2.4
2.6
2.8
3.0
3.2
3.4
3.6
3.8
4.0
Non-Athletes 3.7 3.7 3.7 3.7 3.7 3.7
Athletes 3.6 3.6 3.6 3.6 3.6 3.6
2000 2001 2002 2003 2004 2005
Athletes
Non-Athletes
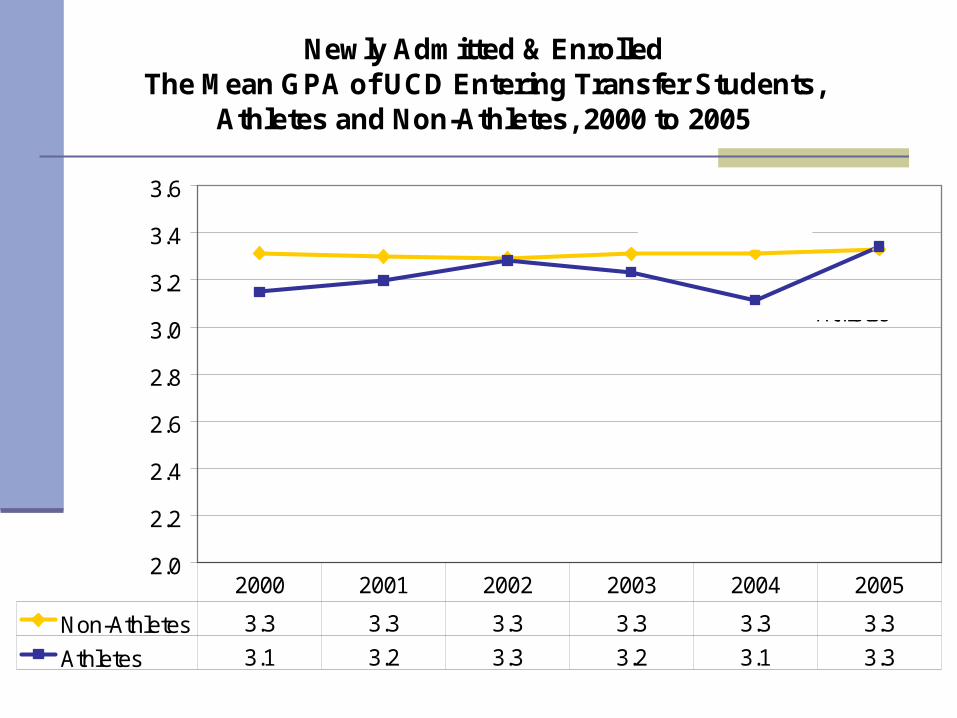
Newly Admitted & EnrolledThe Mean GPA of UCD Entering Transfer Students,
Athletes and Non-Athletes, 2000 to 2005
2.0
2.2
2.4
2.6
2.8
3.0
3.2
3.4
3.6
Non-Athletes 3.3 3.3 3.3 3.3 3.3 3.3
Athletes 3.1 3.2 3.3 3.2 3.1 3.3
2000 2001 2002 2003 2004 2005
Athletes
Non-Athletes
Performance at UC Davis
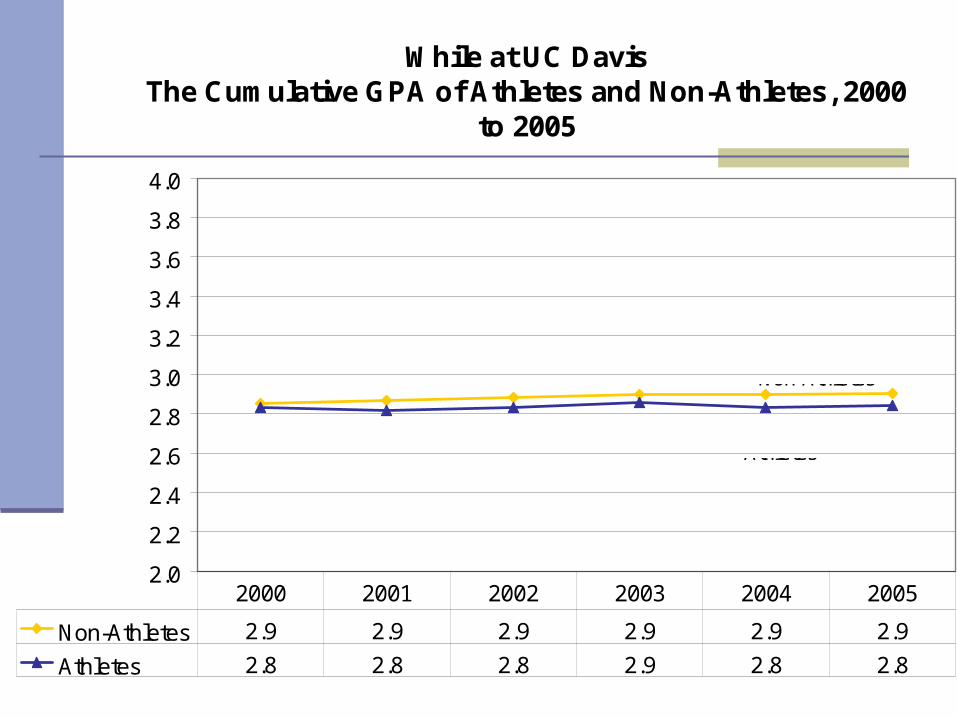
While at UC DavisThe Cumulative GPA of Athletes and Non-Athletes, 2000
to 2005
2.0
2.2
2.4
2.6
2.8
3.0
3.2
3.4
3.6
3.8
4.0
Non-Athletes 2.9 2.9 2.9 2.9 2.9 2.9
Athletes 2.8 2.8 2.8 2.9 2.8 2.8
2000 2001 2002 2003 2004 2005
Non-Athletes
Athletes
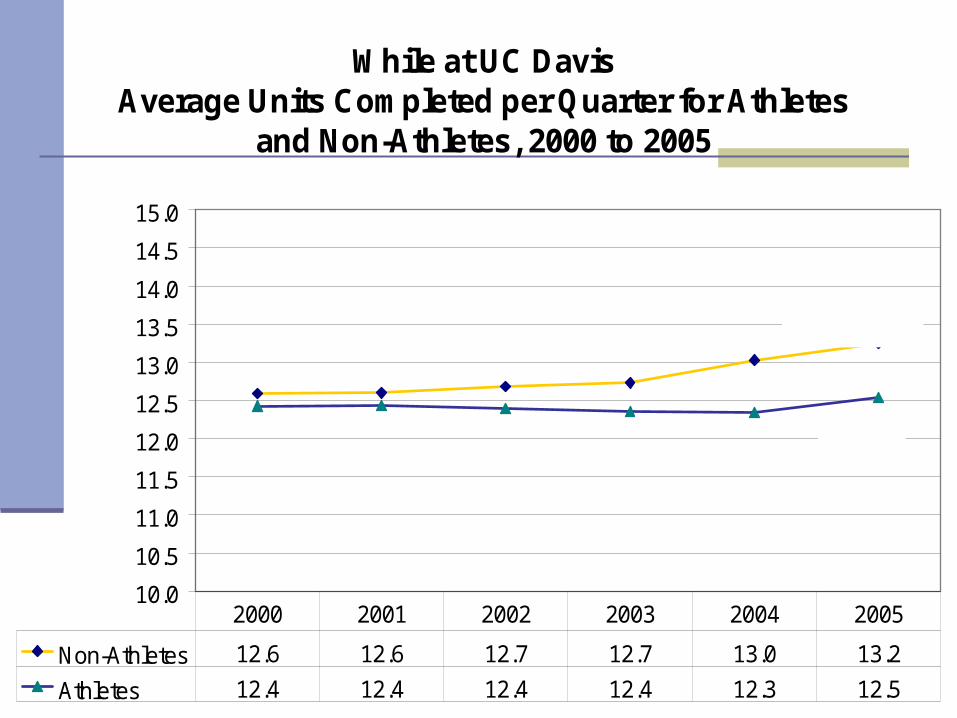
While at UC DavisAverage Units Completed per Quarter for Athletes
and Non-Athletes, 2000 to 2005
10.0
10.5
11.0
11.5
12.0
12.5
13.0
13.5
14.0
14.5
15.0
Non-Athletes 12.6 12.6 12.7 12.7 13.0 13.2
Athletes 12.4 12.4 12.4 12.4 12.3 12.5
2000 2001 2002 2003 2004 2005
Non-Athletes
Athletes
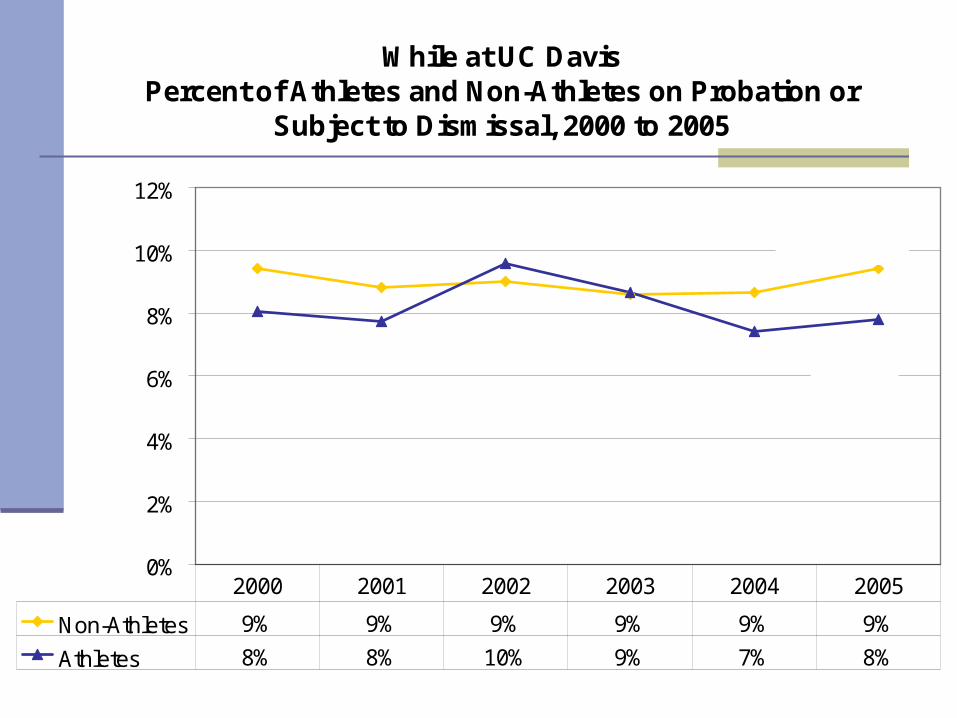
While at UC DavisPercent of Athletes and Non-Athletes on Probation or
Subject to Dismissal, 2000 to 2005
0%
2%
4%
6%
8%
10%
12%
Non-Athletes 9% 9% 9% 9% 9% 9%
Athletes 8% 8% 10% 9% 7% 8%
2000 2001 2002 2003 2004 2005
Non-Athletes
Athletes
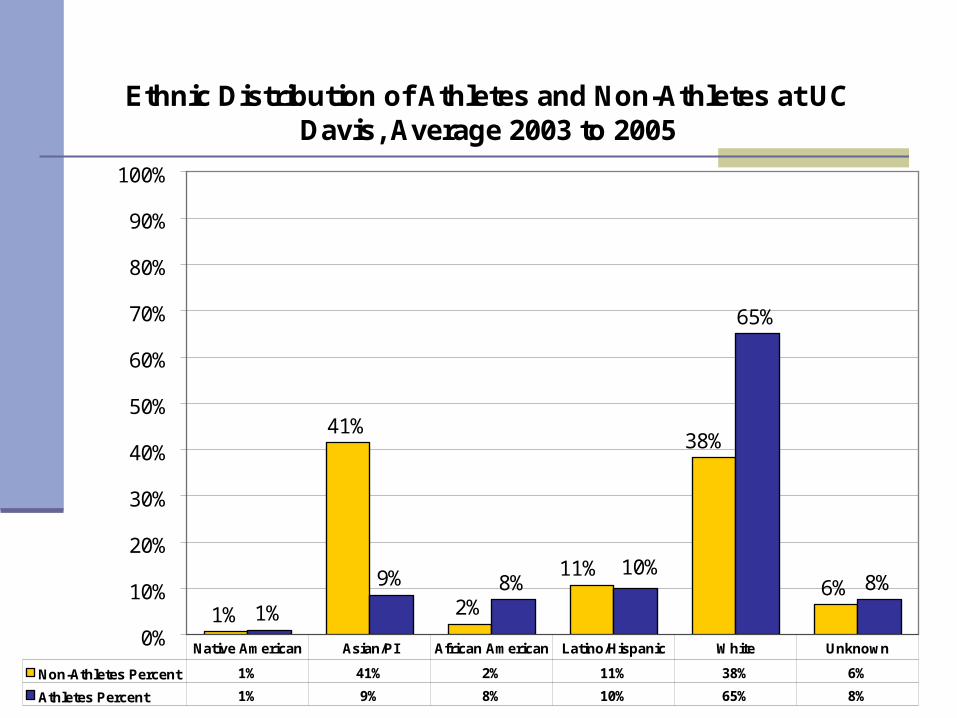
Ethnic Distribution of Athletes and Non-Athletes at UC Davis, Average 2003 to 2005
1%
41%
2%6%
1%
9% 8%
65%
8%11%
38%
10%
0%
10%
20%
30%
40%
50%
60%
70%
80%
90%
100%
Non-Athletes Percent 1% 41% 2% 11% 38% 6%
Athletes Percent 1% 9% 8% 10% 65% 8%
Native American Asian/PI African American Latino/Hispanic White Unknown
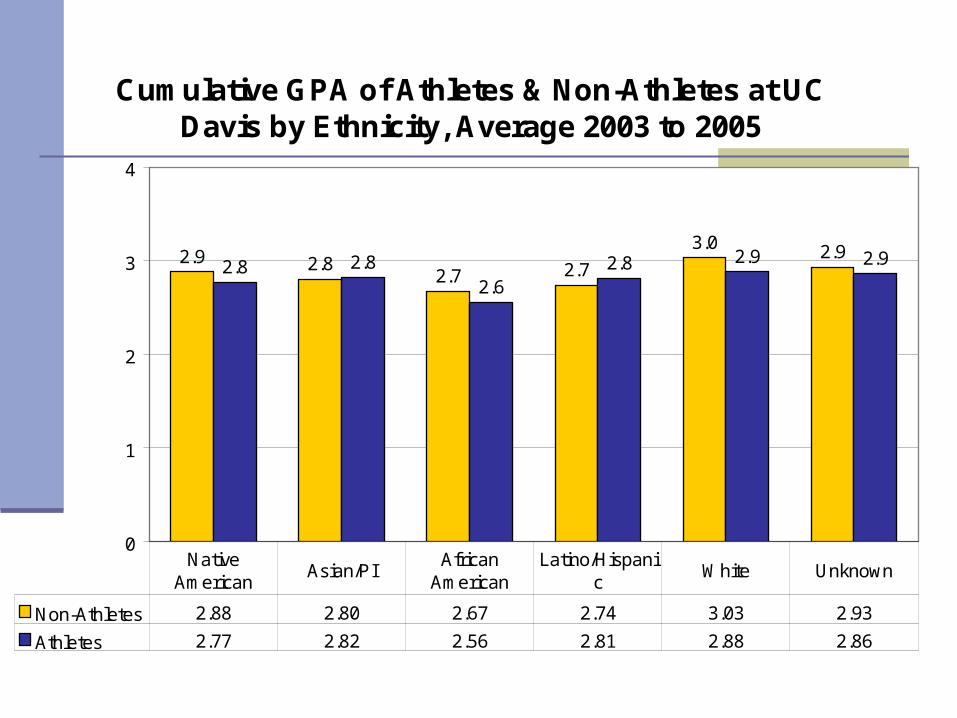
Cumulative GPA of Athletes & Non-Athletes at UC Davis by Ethnicity, Average 2003 to 2005
2.9 2.82.7 2.7
3.0 2.92.8 2.8
2.62.8 2.9 2.9
0
1
2
3
4
Non-Athletes 2.88 2.80 2.67 2.74 3.03 2.93
Athletes 2.77 2.82 2.56 2.81 2.88 2.86
Native American
Asian/PIAfrican
AmericanLatino/Hispani
cWhite Unknown
Source: Student Affairs Research & Information.
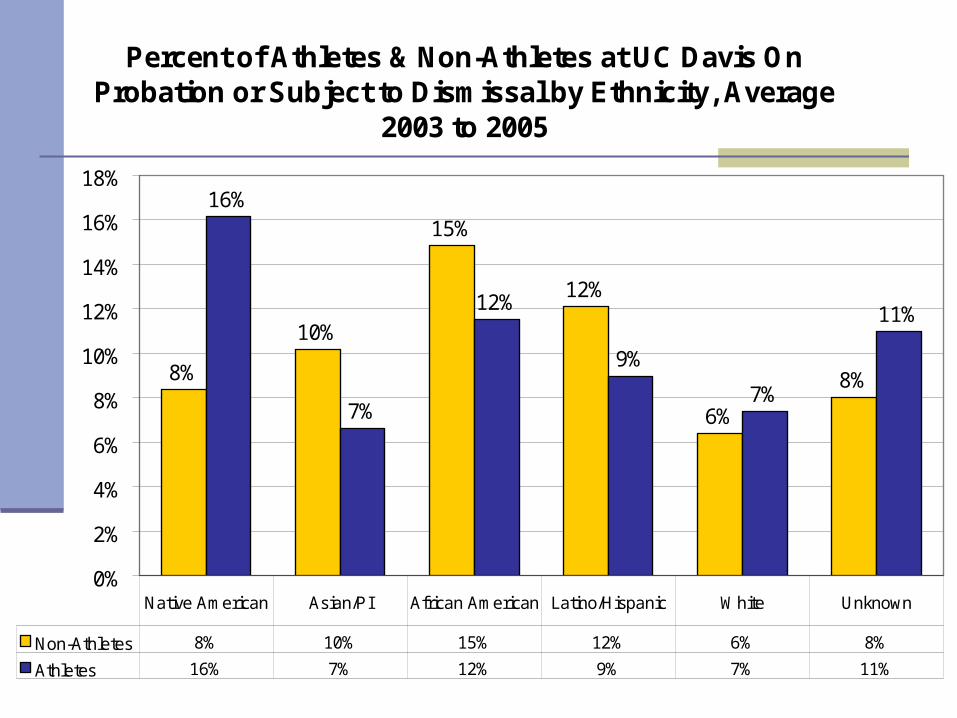
Percent of Athletes & Non-Athletes at UC Davis On Probation or Subject to Dismissal by Ethnicity, Average
2003 to 2005
8%
10%
15%
12%
6%
8%
16%
7%
12%
9%
7%
11%
0%
2%
4%
6%
8%
10%
12%
14%
16%
18%
Non-Athletes 8% 10% 15% 12% 6% 8%
Athletes 16% 7% 12% 9% 7% 11%
Native American Asian/PI African American Latino/Hispanic White Unknown

Graduation Characteristics
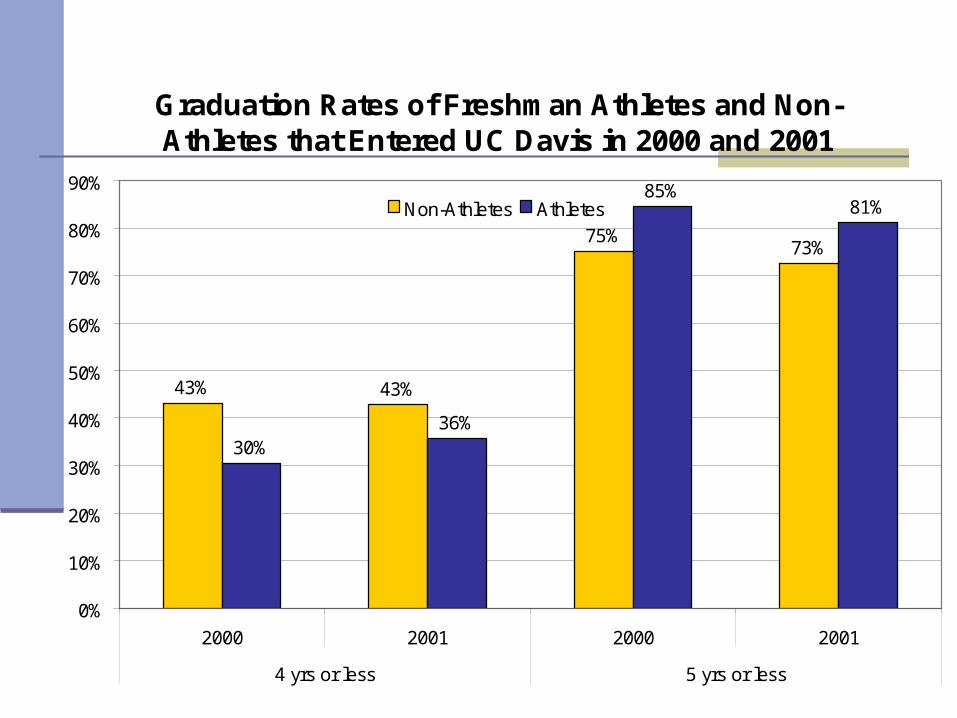
Graduation Rates of Freshman Athletes and Non-Athletes that Entered UC Davis in 2000 and 2001
43% 43%
75%73%
30%36%
85%81%
0%
10%
20%
30%
40%
50%
60%
70%
80%
90%
2000 2001 2000 2001
4 yrs or less 5 yrs or less
Non-Athletes Athletes
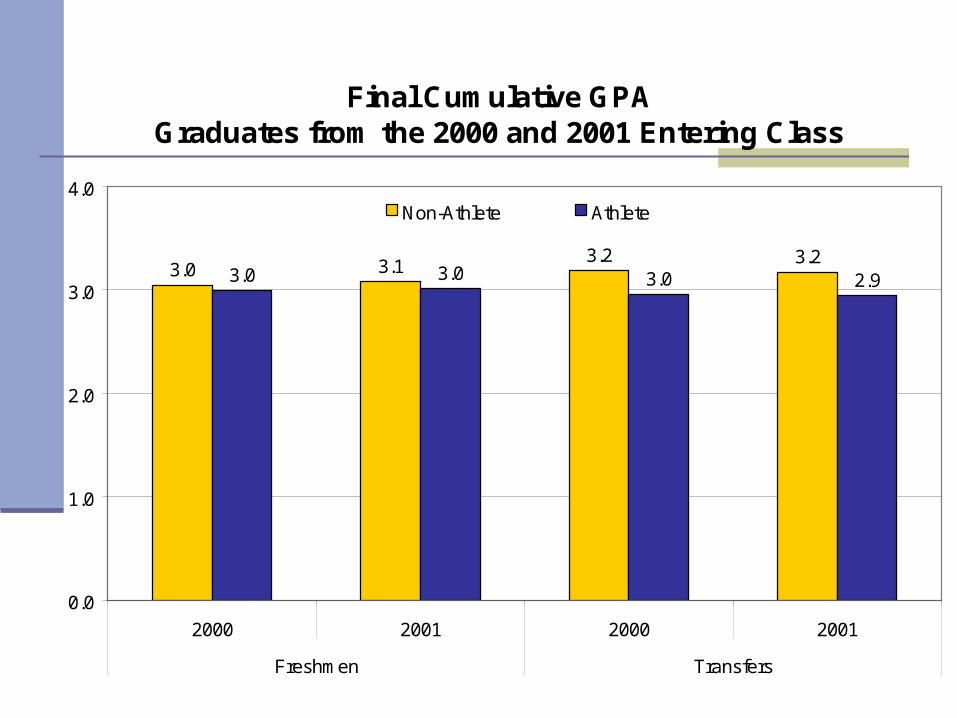
Final Cumulative GPAGraduates from the 2000 and 2001 Entering Class
3.0 3.13.2 3.2
3.0 3.0 3.0 2.9
0.0
1.0
2.0
3.0
4.0
2000 2001 2000 2001
Freshmen Transfers
Non-Athlete Athlete

Total Units Upon GraduationGraduates from the 2000 and 2001 Entering Class
201 201 199 199197 193 197 195
0
50
100
150
200
250
2000 2001 2000 2001
Freshmen Transfers
Non-Athletes Athletes
Links to Presentation and Final Report
www.sariweb.ucdavis.edu – “Latest Publications” on SARI home page.
Related Documents