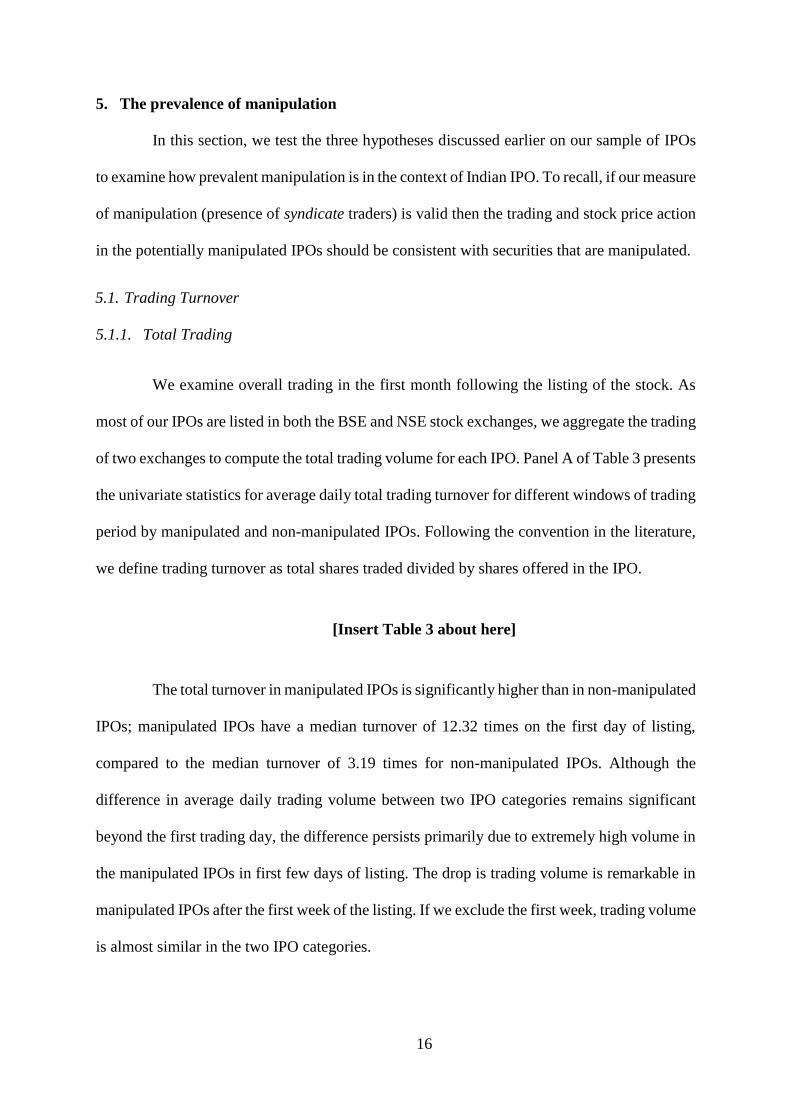
Trade-based manipulation: Beyond the prosecuted cases Author Neupane, Suman, Rhee, S. Ghon, Vithanage, Kulunu, Veeraraghavan, Madhu Published 2017 Journal Title Journal of Corporate Finance DOI https://doi.org/10.1016/j.jcorpfin.2016.11.011 Copyright Statement © 2017 Elsevier. Licensed under the Creative Commons Attribution-NonCommercial- NoDerivatives 4.0 International (http://creativecommons.org/licenses/by-nc-nd/4.0/) which permits unrestricted, non-commercial use, distribution and reproduction in any medium, providing that the work is properly cited. Downloaded from http://hdl.handle.net/10072/172394 Griffith Research Online https://research-repository.griffith.edu.au

Welcome message from author
This document is posted to help you gain knowledge. Please leave a comment to let me know what you think about it! Share it to your friends and learn new things together.
Transcript
Trade-based manipulation: Beyond the prosecuted cases
Author
Neupane, Suman, Rhee, S. Ghon, Vithanage, Kulunu, Veeraraghavan, Madhu
Published
2017
Journal Title
Journal of Corporate Finance
DOI
https://doi.org/10.1016/j.jcorpfin.2016.11.011
Copyright Statement
© 2017 Elsevier. Licensed under the Creative Commons Attribution-NonCommercial-NoDerivatives 4.0 International (http://creativecommons.org/licenses/by-nc-nd/4.0/) whichpermits unrestricted, non-commercial use, distribution and reproduction in any medium,providing that the work is properly cited.
Downloaded from
http://hdl.handle.net/10072/172394
Griffith Research Online
https://research-repository.griffith.edu.au
1
Trade-Based Manipulation: Beyond the Prosecuted Cases
Suman Neupane*a, S. Ghon Rheeb, Kulunu Vithanage a and Madhu Veeraraghavanc
Abstract
Using insights from prosecuted cases, we present compelling evidence of large-trade based
manipulation in a sizeable number of Indian IPOs that, in all likelihood escaped enforcement
actions. Consistent with the pump-and-dump scheme these IPOs exhibit abnormally high
volume of large trades, a significant fraction of which originates from a syndicate of traders
present in the prosecuted IPOs. More importantly, stock price in the manipulated IPOs rises
initially on account of artificial trades, but then declines significantly as the manipulators exit
the market. Interestingly, not all attempts at manipulation are entirely successful as stock price
in some of the manipulated IPOs crash on the first day of listing.
JEL Classification: G15, G24, G28
Keywords: IPOs, manipulation, trade-based manipulation, pump-and-dump scheme, Indian
IPOs
* Corresponding Author
a Department of Accounting, Finance and Economics
Griffith Business School, Griffith University
Nathan QLD 4111, Australia
Email: [email protected]/[email protected]
b Shidler Distinguished Professor of Finance
University of Hawaii Shidler College of Business; Honolulu, HI 96822
E-mail: [email protected]
c Accounting, Economics and Finance Area
T.A. Pai Management Institute, India
Email: [email protected]
This version: October 2016
2
1. Introduction
The costs of market misconduct in a stock market go beyond just the mis-pricing of
specific stocks. It derails investor confidence, trust, and participation. In this paper, we examine
manipulation in initial public offerings (IPOs) in the context of the Indian market which had a
profound impact on overall IPO activity and investor confidence. In light of the revelation, the
regulator had to bring in several measures to prop up the confidence in the primary market.1
Although IPOs are an extremely important source of finance, a high degree of information
asymmetry at the time of the offering as well as the complexity of the process makes them
susceptible to abuse and irregularities.2
In late 2011 the Securities and Exchange Board of India (SEBI, hereafter) brought
cases against 7 IPO firms and banned these companies and their directors from accessing the
capital market. The investigation uncovered several irregularities including concealment of
material information in the offer document and manipulative trades to create artificial demand
during the offer and post-listing periods. The irony, however, is that the Indian IPO market is,
possibly, one of the most transparent in the world with information on investors’ bids publicly
available on a real time basis when the offer is open for subscription.3 Further, in response to
past irregularities, underwriters in Indian IPOs have a limited role with auction as the main
selling mechanism, where manipulation and abuse should be considerably lower (Jagannathan
et al., 2015).
Thus, given the setting of the Indian IPO market and the revelation from SEBI’s
investigation, we begin by conducting an in-depth analysis of the 7 SEBI-investigated IPOs
1 The measures included the introduction of safety net for retail investors and requiring investment banks to
disclose their track records. The safety net allows investors to sell their shares back to the issuers if the share price
falls sharply during the first six months of listing. 2 See Ritter (2011) for a review of irregularities in the context of IPOs. 3 See Neupane and Poshakwale (2012) and Neupane et al. (2014) for a discussion of the institutional settings of
the Indian IPO market.
3
(hereafter, ‘investigated IPOs’). Consistent with the idea that it is difficult to move or
manipulate a large-capitalization stock (Aggarwal and Wu, 2006), we find that the investigated
firms are smaller in size, managed by lower ranked underwriters and fail to attract institutional
investors. More importantly, in line with the evidence in studies on trade-based manipulation
(Allen and Gale, 1992; Jiang et al., 2005), the investigated IPOs exhibit abnormally high
trading volume, particularly large-volume trades.4 In conjunction with high trading volume,
the investigated IPOs exhibit extreme stock price volatility in the immediate period after its
listing.
Given the richness of our data and the fact that trade-based manipulation, by
definition, proceeds through large trades (Jiang et al., 2005), we further examine these trades
with a particular emphasis on the traders involved. Consistent with the idea that manipulation
schemes are undertaken jointly by several parties (Aggarwal and Wu, 2006), we find a core set
of traders (henceforth syndicate) that execute large trades on the first trading day in each of the
investigated IPOs.5 Unsurprisingly, a significant fraction of the large trades in the investigated
IPOs originates from this syndicate. SEBI’s investigation also presents evidence of a nexus
between the issuing firms and manipulators with IPO proceeds routed to traders who incur
losses in post-listing trades.
In the main empirical section of the paper we use a two-stage strategy to examine the
pervasiveness of manipulation in a sample of 228 IPOs issued during the 2006-2011 period.
Using the presence of syndicate as an instrument, we identify a further 32 IPOs (henceforth,
manipulated) that we consider as manipulated. We then test three hypotheses on post-listing
4 In order to increase transparency and provide information to the market, SEBI requires firms to publicly disclose
transactions that account for more than 0.5% of the number of outstanding shares listed on the exchange. These
large transactions are referred to as bulk trades. 5 The names of a number of these traders appear in SEBI’s investigation. A list containing the names of these
investors is presented in Appendix B.
4
trading, large-volume traders and stock returns to establish that these IPOs are indeed
manipulated. Not surprisingly, manipulated IPOs exhibit characteristics consistent with
investigated IPOs: smaller size, weak institutional interest and managed by a lower ranked
underwriter. The more striking results are related to trading and stock price performance.
Manipulated IPOs have as much as five times the amount of large trades as in the sample of
non-manipulated IPOs on the first day of listing. Further, just as in the investigated IPOs, almost
fifty percent of these large trades originates from the syndicate.
Consistent with the operation of trade-based manipulation, and more specifically, the
pump-and-dump scheme (Khawaja and Mian, 2005), stock price in these manipulated IPOs,
rises initially, but then falls suddenly and significantly after the first week of listing. The
median first day return of 21 percent for manipulated IPOs tumbles to -35 percent (a drop of
56 percent) at the end of the first month listing; the corresponding fall in the sample of non-
manipulated IPOs is a modest 2 percent. This rise and fall in stock price coincides, respectively,
with the unusually large trading volume and the manipulators exiting the market. Stock price
continues to fall in manipulated IPOs – the median return at the end of the three months is -47
percent, compared to -7 percent for IPOs in the non-manipulated group.
An interesting revelation from our analysis is that not all attempts at manipulation
appear to be entirely successful. Stock price in five of the seven investigated IPOs and a few
manipulated IPOs fall sharply on the first day of listing despite very high trading volume.
Consistent with the operation of a manipulation scheme, whilst large trades dries up
immediately in IPOs whose stock price fall on the first of listing, we find significant volume
of large trades beyond the listing date for manipulated IPOs that have positive listing return.6
6 SEBI’s investigation reveals that substantial sums of money was transferred from IPO proceeds to traders who
incurred losses on first day trades. We discuss these in detail in Section 2.
5
Our paper makes two main contributions to the sparse literature on stock price
manipulation, particularly in the context of emerging markets where legal and institutional
environments are weak. Khwaja and Mian (2005) identify brokers who manipulate prices
through pump-and-dump schemes resulting in gains of 50-90 percent point higher annual
returns than outside investors in the Pakistani market. In a similar vein, Khanna and Sunder
(1999) document that brokers collaborate with company owners to manipulate prices in pump
and dump schemes in the Indian stock market and Zhou and Mei (2003) document evidence of
manipulation in the Chinese market. We add to this strand of literature by documenting
evidence of manipulation in IPOs. More generally, our study contributes to the literature on
trade-based manipulation (Aggarwal and Wu, 2006; Allen and Gale, 1992; Jiang et al., 2005).
Second, an important innovation of our paper is that we document manipulation not
only in the firms that faced litigation from the regulator, but also several other firms that, in all
likelihood, escaped regulatory action. Our evidence shows that the prosecuted firms only
account for a small fraction of the firms that were manipulated. While most previous studies
rely on litigation cases brought by the regulator to examine manipulation (Aggarwal et al.,
2005; Aggarwal and Wu, 2006), the unique setting of the Indian market as well as the richness
of our data allowed us to explore manipulation over a much larger sample. Given that we
examine pervasiveness of manipulation, we also document that not all attempts at manipulation
are successful with stock price slumping on the first day of trading despite significant trading
volume.
The remainder of the paper is organized as follows. Section 2 describes the
investigated IPOs. Section 3 reviews the literature and develops the testable hypotheses.
Section 4 presents the data, proxy for manipulation and summary statistics. Section 5 presents
the empirical analysis of the prevalence of manipulation in Indian IPOs. In Section 6 we
perform some additional robustness tests and we conclude with Section 7.
6
2. The investigated IPOs
As an appropriate analysis of the prevalence of manipulation rests on a proper
understanding of the 7 IPOs investigated by SEBI, in this section we analyze these IPOs in
some detail. We first discuss some of the irregularities presented in SEBI’s investigation report
(referred to as the Order). We then present and discuss the firm, offer and market related
characteristics of these IPOs.
2.1. SEBI’s investigation
In the following paragraphs, we describe the irregularities (as reported in SEBI’s
report) that are observed before, during and after the listing of the IPO. These irregularities are
primarily related to concealment of material information, improper use of IPO proceeds,
irregularities in IPO subscription and post-listing trading.
One major irregularity that the investigation reveals is the failure of the firms to
disclose significant liabilities in their offer document. Referred to as intercorporate deposits
(ICDs), these liabilities are essentially loan taken by the IPO firms from related or affiliated
parties. For PG Electroplast, for instance, ICDs worth INR 520 million amounting to 43% of
the size of its IPO were not disclosed.7 Taksheel Solutions, Bharatiya Global Infomedia and
Tijaria Polypies also failed to disclose ICDs worth INR 320 million, 70 million, and 125 million
respectively. Brooks laboratory (BL) had non-disclosed ICDs with 13 companies, seven of
which had common directors. As we discuss below, these ICDs were later used to support IPO
subscription and post-listing trades as well as to siphon IPO proceeds away from the firm.8
7 During the sample period, US$ 1 was approximately equal to INR 45. 8 Even where funds were used for the stated objectives they were paid to related parties at highly inflated prices.
In the case of Onelife Capital Advisors (OCA), for instance, INR 70 million was siphoned to Onelife Gas and
Energy Infra Ltd, a group company, to set up a corporate office. Similarly, RDB Rasayan’s uses of funds included
purchasing a plant and machinery and depositing security deposit with the West Bengal State Electricity
Distribution Company. Neither of the transactions materialized; instead, the funds were used to pay off ICDs.
7
The investigation also discloses unscrupulous bids made during IPO subscription.
Three IPO subscribers, Chin Info, M.L. Commodities and Sunlight Pvt, received significant
sums of money through ICDs to put in subscriptions for PG Electroplast (PGE).9 Separately,
for Onelife Capital Advisors (OCA), 80 retail and two quasi-institutional subscribers shared
the same postal and bank branch address. Further, significant sums of money were also diverted
from IPO proceeds to individuals and entities (through ICDs) for trading in the immediate post-
listing period. More importantly, for the purpose of our study, the reports present detailed
description of wash and synchronized trades made by several investors through large (bulk)
trades on the first day of trading. For RDB Rasayans, for instance, the top 10 synchronized
traders made 601 trades worth INR 13.72 million on the first day of trading.10
Another interesting observation the investigation reveals is the channeling of IPO
proceeds (through ICDs) to traders who incurred losses in post-listing trades. Five of the seven
investigated IPOs closed significantly below their offer price on the first day of listing.
Accordingly, INR 25 million was routed to Overall Financial Consultant Pvt Ltd which lost
INR 21.3 million in Brooks Laboratories. Overall Financial Consultant Pvt Ltd and Rose
Valley Merchandise also received IPO funds for the losses in Tasksheel Solutions.
2.2. Firm, offer and market characteristics
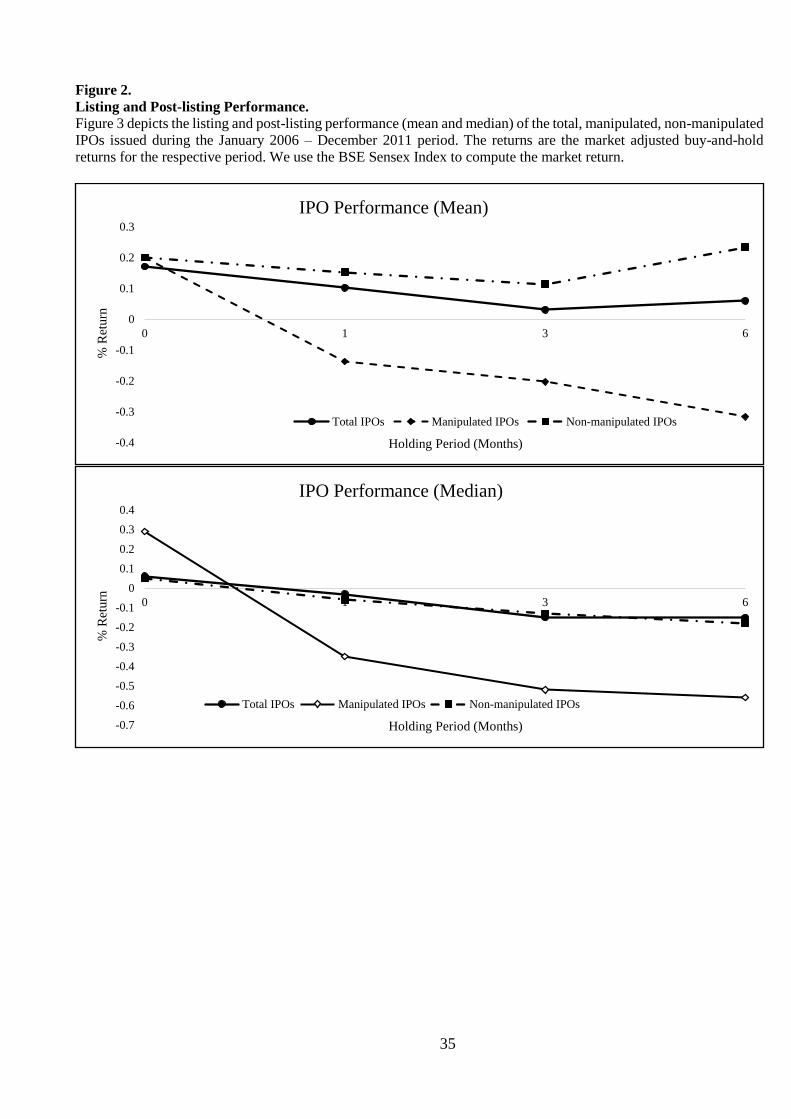
Table 1 provides descriptive statistics of 7 investigated IPOs along with median values
for all IPOs issued during the January 2006 – December 2011 period. As shown in Table 1, the
investigated IPOs are smaller in size (both in terms of total assets and gross proceeds) and have
9 Chin Info, M.L. Commodities and Sunlight Pvt received INR 9.4 million, 8.6 million and 4 million, respectively
to subscribe in the IPO. 10 There are several references to the functioning of IPO operators or syndicates in the Indian IPO market both in
the financial press as well as on IPO portals such as chittorgarh.com. For example, see Sawardekar (2011). These
accounts suggest that operators allegedly help promoters of small and weak offerings, who struggle for
subscription from institutional investors by artificially creating demand both during the offer subscription period
as well as during the post-listing trading period in exchange for guaranteed returns.
8
lower offer price relative to the overall median IPO. All the seven investigated IPOs are also
managed by low-reputation underwriters. This evidence is consistent with Aggarwal and Wu’s
(2006) observation that it is difficult for manipulators to move a large-capitalization stock
without incurring huge costs and taking on enormous risk making smaller firms the target of
such manipulation. As for investors’ subscription, both overall and institutional subscription is
considerable lower in these IPOs. Three of the seven IPOs do not receive a single institutional
bid. Notwithstanding the limited participation from institutional investors, both quasi-
institutional and retail investors participate reasonably well in these IPOs.11, 12
[Insert Table 1 about here]
Table 1 also shows statistics related to trading and stock performance. The
investigated IPOs exhibit abnormally high turnover on the first day of trading. With the
exception of RDB Rasayans, total trading turnover (as a fraction of shares offered in the IPO)
is 11 times or more in the other six IPOs – almost four times higher than in the overall median
IPO. Remarkably, bulk or large trades are also extremely high in the investigated IPOs. Whilst,
bulk trades on the first day of trading for the overall median IPO is only 0.99 times, it is more
than 6 times in six of the seven investigated IPOs. Again, this evidence is consistent with prior
research which informs us that stock market manipulation, particularly trade-based ones,
usually proceeds through large trades (Jiang et al., 2005).
11 Indian IPO firms are required to reserve and allocate separate quotas of shares to institutional investors, retail
investors and quasi-institutional investors. Institutional investors receive 50% of the shares offered, whereas
quasi-institutional and retail investors receive 15% and 35% of the shares offered respectively. 12 Since we do not have bid level data for individual subscription, we are unable to examine subscribers to these
IPOs. The reasonable participation by retail and non-institutional investors could be on account of fake bids by
manipulators as well as the participation of information seekers who are unable to differentiate the observed bids
as coming from informed traders or manipulators.
9
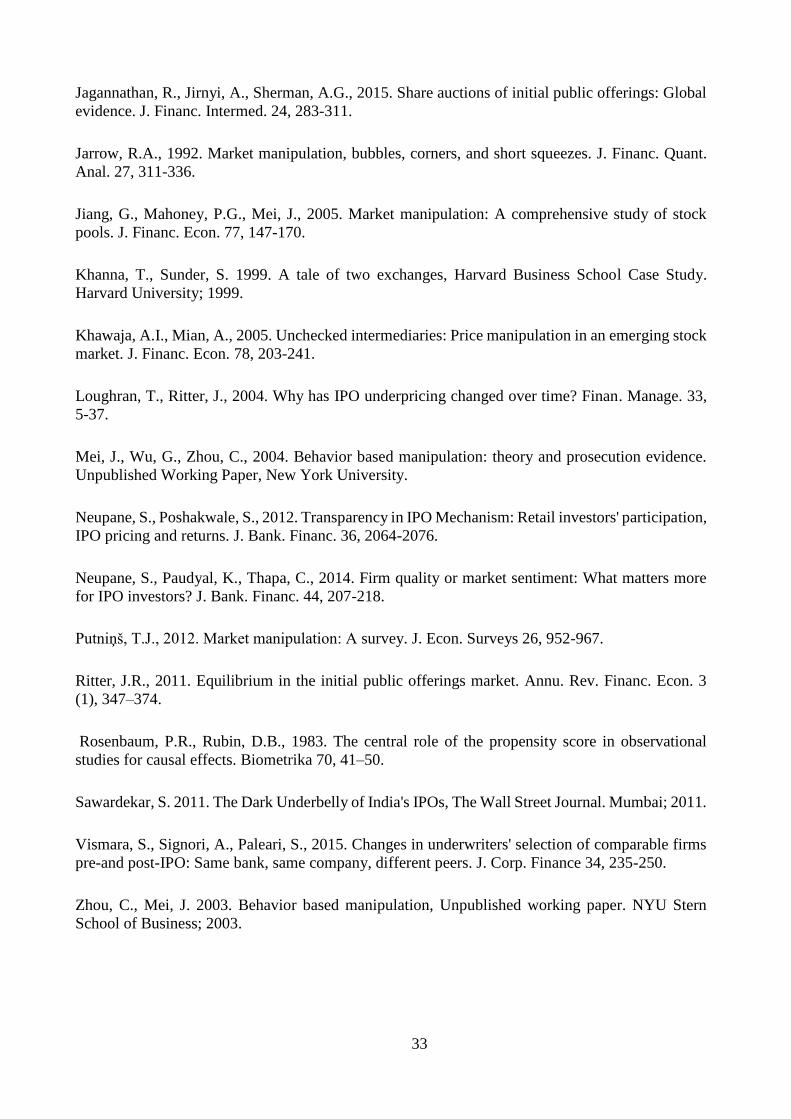
[Insert Figure 1 about here]
To better understand this extreme turnover, we further examine bulk trades with a
particular emphasis on the traders involved.13 Our bulk trades data is incredibly rich. It provides
information on quantity, price and direction, as well as the names of the individuals and
institutions involved. The analysis of bulk trades is also relevant as SEBI’s report show the use
of these trades in creating artificial demand in the post-listing period. A number of interesting
observations emerge from this analysis. In line with the idea that manipulation schemes are
undertaken jointly by several parties (Aggarwal and Wu, 2006), we come across a core set of
21 syndicate traders, who appear to be the most common perpetrators in these investigated
IPOs; at least 18 of these traders participate in each of the seven IPOs. Figure 1 shows this
network of traders, while Appendix A presents a list containing the names of these traders
along with data on their participation in IPOs. Not surprisingly, the names of a number of these
syndicate traders appear in SEBI’s report.14 As shown in Table 1, we also find that a large
fraction of bulk trades in these 7 IPOs originates from this syndicate – about 45% to be precise.
As for the stock performance, as mentioned earlier, five of the seven investigated IPOs
decline 40% or more below their offer price on the first day of trading. Stock price of these
IPOs continues to deteriorate further with five of the seven IPOs falling as much as 70 percent
below their offer price by the end of the first month of listing.15
To summarize, the above discussion of the 7 investigated IPOs presents some
compelling insights. Although the 7 companies were prosecuted for irregularities following
13 We use UCINET 6 software (Borgatti et al., 2002) to analyse and report bulk traders involved in these IPOs.
UCINET is a widely used tool to examine social networks. 14 In October 2015, SEBI imposed penalties on Marwadi Shares and Finance Ltd and Chandarana Intermediaries
Brokers Pvt Ltd, two traders from the syndicate for creating artificial volume (through self-trades) in relation to
one of the investigated IPOs. Both the investors executed bulk trades on the first day of trading in all the 7
investigated IPOs. We further discuss these traders in Section 5.2. 15 We further discuss the dramatic fall in stock price on the first day of listing in these IPOs in Section 5.
10
SEBI’s investigation, our descriptive analysis also presents evidence that are consistent with
large trade-based manipulation. The in-depth analysis of the investigated IPOs also help us in
identifying a core set of traders who appear to be the main force behind the extremely high
bulk trades observed in these IPOs. The channeling of IPO proceeds for both bidding and post-
listing trades also clearly suggests a nexus between the manipulators and the firms involved.
Using these insights gained from the analysis, in the remaining part of the paper we examine
the prevalence of manipulation in Indian IPOs.
3. Trade based manipulation: literature review and hypotheses development
Allen and Gale (1992) categorize stock market manipulation into trade-based,
information-based and action-based manipulation. In this section we provide an overview of
the existing research on trade-based manipulation and develop our hypotheses.16
Trade-based manipulation occurs when a large trader or a group of traders attempt to
manipulate the price of an asset by buying and then selling, without taking any publicly
observable actions to alter the value of the firm or releasing false information to change the
price. The uncertainty among traders to relate large trading volume to information or
manipulation allows a pooling equilibrium (Aggarwal and Wu, 2006). The literature discusses
several trade-based manipulation techniques including ‘painting the tape or spoofing’ and
‘pumping-and-dumping’ (Cumming and Johan, 2008). ‘Painting the tape’ involves a series of
transactions that are reported on a public display facility which give the impression of trading
activity or price movements. Pumping-and-dumping, on the other hand, involves manipulators
colluding and trading amongst themselves to artificially raise the price to attract naïve
16 Refer to Putniņš (2012) for an overview of other forms of market manipulation. Cumming et al. (2015) also
provide a review of literature on financial market misconduct. In the context of IPOs, Vismara et al. (2015) find
underwriters’ bias in peer selection when valuing the offering.
11
investors. Once prices have risen, the manipulators leave the market triggering a dramatic
decline in the stock price.
Several theoretical papers examine conditions under which trade-based manipulation
is profitable (Aggarwal and Wu, 2006; Allen and Gale, 1992; Jarrow, 1992). Chakraborty and
Yılmaz (2004) show that informed traders also benefit from manipulation. Fishman and
Hagerty (1995) show how insiders manipulate or benefit from disclosure rule for large-trades.
Several studies also model trade-based manipulation for specific securities, events or market
design. Gerard and Nanda (1993), for instance, examine the potential for manipulation in
seasoned equity offerings.
The empirical evidence on trade-based manipulation to-date has been either indirect
or by examining known cases of manipulation (Putniņš, 2012). Khawaja and Mian (2005)
provide indirect evidence of pump-and-dump manipulation in Pakistan’s stock market where
brokers manipulate price to profit from positive feedback traders. Khanna and Sunder (1999)
and Zhou and Mei (2003) discuss similar episodes for China and India respectively. Using 142
known cases of manipulation, Aggarwal and Wu (2006) find evidence of pumping-and-
dumping with the prosecuted stocks experiencing a price increase during the manipulation
period followed by a decrease in the post-manipulation period. In the context of IPOs,
Aggarwal et al. (2005) find that firms that have tie-in agreements with underwriters have
significantly high first-day return and trading volume but inferior long term performance
compared to firms without such tie-in agreements. Our paper contributes to this strand of
literature, but to the best of our knowledge, goes beyond the prosecuted cases to examine the
prevalence of manipulation over a larger sample of companies.
To examine this prevalence of manipulation in IPOs, we construct a measure of
manipulation and identify firms that are subject of trade-based manipulation. If our measure of
12
manipulation is valid, we would expect the potentially manipulated IPOs to exhibit
characteristics that are consistent with manipulated securities. Based on prior research, we set
up the following hypotheses to empirically test the validity of our manipulation measure. A
key feature that stands out in trade-based manipulation is the presence of information
asymmetry. While some theoretical papers have modelled manipulation even in the absence of
information asymmetry, the presence of information asymmetry accentuates manipulations.
IPOs are strong candidates for manipulation as they exhibit high information asymmetry which
makes it easier for manipulators to entice information seekers and harm market efficiency.
As the name suggests, the most striking aspect of trade-based manipulation is the
presence of very high trading volume. Aggarwal and Wu (2006) show that manipulated firms
have significantly higher daily trading volume during the manipulation period compared to
similar non-manipulated firms. Such manipulative schemes usually involves wash sales,
matched or synchronized orders and pools where the main objective is to artificially increase
the price with no genuine change of ownership (Putniņš, 2012). Further as Jiang et al. (2006)
state, such artificial trading usually proceeds through large-trades. Hence, if our measure of
IPO manipulation in valid then,
H1: Manipulated IPOs should have significantly higher trading volume, and in
particular large trades, than non-manipulated IPOs.
Since trade-based manipulation involves wash sales and matched or syncronised
orders, such schemes are usually undertaken jointly by several parties (Aggarwal and Wu,
2006). Although Zhou and Mei (2003) model manipulation where a single large trader move
prices, our setting is more in line with Khawaja and Mian (2004) and Aggarwal and Wu (2006)
where we consider manipulation to be undertaken jointly by several parties. Hence, if our
measure of manipulation in valid then,
13
H2: A significant portion of bulk trades in manipulated IPOs should come from a set
of common traders.
The presence of significantly high trading volume is a necessary, but not a sufficient
condition for manipulation. For manipulation to exist, the action of the manipulators should
influence stock price both during as well as in the post-manipulation period. In their
examination of pump-and-dump scheme, Khawaja and Mian (2004) demonstrate that when
manipulators collude and trade amongst themselves they are able to artificially raise the price
to attract naïve investors. Once prices have risen, the manipulators leave the market triggering
a dramatic decline in the stock price. Hence, if our measure of manipulation in valid then,
H3: Stock price in manipulated IPOs should rise with the action of the manipulators
and decline significantly as the manipulators exit the market.
4. Data, Proxy for Manipulation and Summary Statistics
4.1. Data
The overall data set used in this study comprises of 235 IPOs (including the 7
investigated firms) listed on the Bombay Stock Exchange (BSE) and the National Stock
Exchange (NSE) spanning the period January 2006 to December 2011.17 We exclude the 7
investigated firms from the analysis on the prevalence of manipulation. Data on firm and offer
characteristics are collected from the prospectus. We obtain data on stock price, trading
(including bulk trades) and the subscription of various investor categories from from the
BSE/NSE websites.
4.2. Proxy for Manipulation and Manipulated IPOs
17 We begin from 2006 as it marks the beginning of regime where underwriters do not have allocation discretion.
More importantly, since all the investigated IPOs are issued in 2011, we limit our sample to a reasonable time
period prior to the event window.
14
Our empirical strategy requires that we first use a measure of manipulation to identify
potentially manipulated IPOs. For this purpose, we use the syndicate of common bulk traders
identified in the 7 investigated IPOs which we consider to be a powerful measure not only
because the names of these traders appear in SEBI’s Orders, but also because SEBI recently
penalized two of these traders for creating artificial demand. Hence, as in the investigated firms,
we analyze the first day bulk trades in our sample of 228 IPOs to identify companies that are
likely to be manipulated. We come across several IPOs where the 21 syndicate traders make
bulk trades on the first day of trading. More specifically, we find 27 IPOs where at least 18 of
the 21 and 32 IPOs (excluding the investigated IPOs) where at least 15 of the 21 syndicate
traders make bulk trades on the first day of listing.18 We consider these 32 firms (henceforth,
manipulated IPOs) as manipulated and become the basis on which we test our hypotheses on
the prevalence of manipulation. We consider the remaining 196 IPOs as non-manipulated.19
[Insert Table 2 about here]
4.3. Summary Statistics
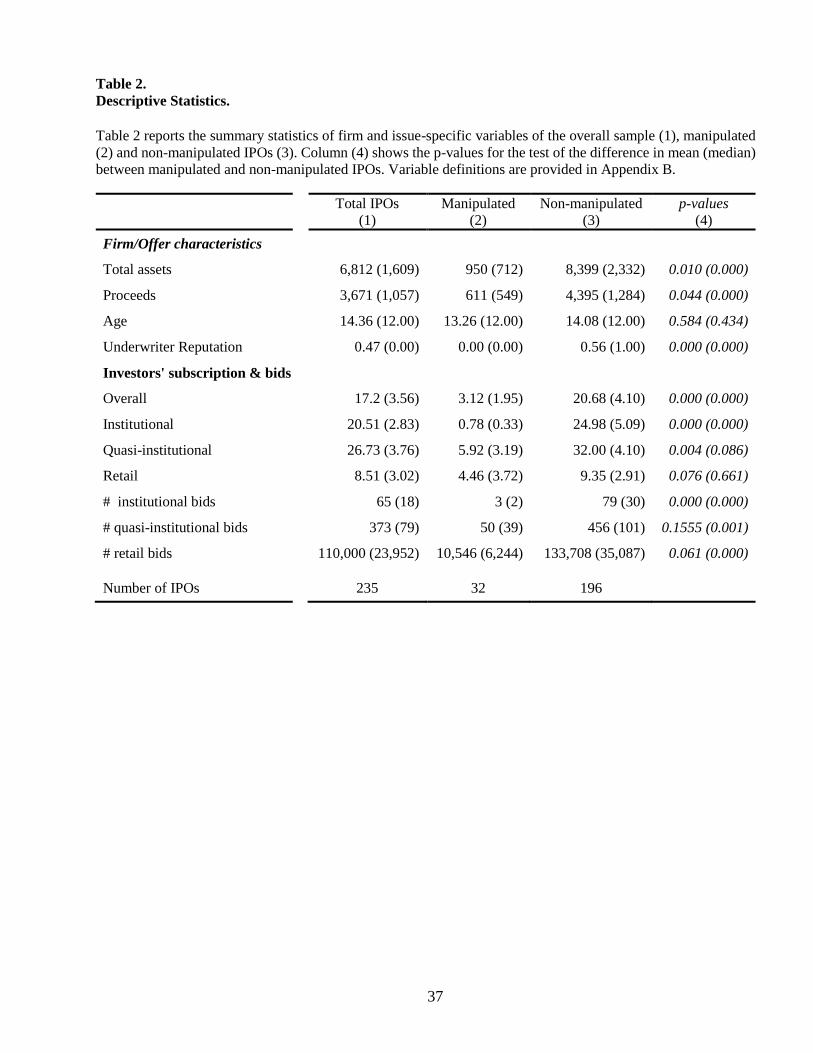
Table 2 presents the summary statistics separately for total, manipulated, and non-
manipulated IPOs. The descriptive statistics for manipulated and non-manipulated IPOs are
presented in columns (2) and (3) with column (4) showing the p-values for the test of the
difference in mean and median values. While the 7 investigated IPOs are included in the total
column, they are excluded from the set of manipulated IPOs. Results are identical when the 7
IPOs are included in the analysis. As expected, we find significant difference between
18 Whilst, we perform all our empirical analysis on this set of 32 IPOs (excluding the 7 investigated IPOs), our
results are identical with (i) the sample of 27 IPOs where at least 18 of the 21 syndicate traders make bulk trades
and (ii) when we include the 7 investigated in the overall analysis. Results are available upon request. The
identification of the manipulated IPOs can be provided upon request. 19 To address comparability of firms across the two categories, in Section 6 we perform robustness test using
propensity matching.
15
manipulated and non-manipulated IPOs in terms of total assets, proceeds raised and the
reputation of the underwriter managing the offer. The manipulated IPOs, just like the
investigated ones, are much smaller in size and predominantly managed by low reputation
underwriters.
The two IPO groups also differ significantly in terms of investor subscription. The
mean (median) overall subscription is only 3.12 (1.95) for manipulated IPOs, which is
considerably smaller than the 20.68 (4.10) for the non-manipulated IPOs (p value<0.01). Most
of the manipulated IPOs barely obtain full subscription, which is not surprising, given the poor
participation by institutional investors. Institutional subscription in the median manipulated
IPO is only 0.33, considerably smaller than the 5.09 for the median non-manipulated IPO (p
value<0.01). The manipulated IPOs receive very few institutional bids – 2 bids in the median
manipulated IPO compared to 30 bids in the median non-manipulated IPO. The participation
of both quasi-institutional and the retail investors, on the other hand, is not very different
between the two IPO categories. The median manipulated IPO is subscribed 3.19 (3.72) times
by quasi-institutional (retail) investors, compared to 32.00 (2.99) times in the median non-
manipulated. Although the subscription is fairly similar, the number of bids by both quasi-
institutional and retail investors is considerably smaller in manipulated IPOs, suggesting that a
far lower number of bidders place significantly higher subscriptions in manipulated IPOs.
Overall, the univariate statistics shows that just as in the investigated IPOs,
manipulated IPOs barely attract any institutional interest; non-manipulated IPOs, on the other
hand, obtain significant institutional subscription. Similarly, the number of bids by quasi-
institutional and retail investors is also significantly lower in manipulated IPOs compared to
non-manipulated IPOs. In the next section we will expand on this analysis by examining the
trading (including bulk trades) and stock performance of the two IPO categories using both
univariate and multivariate regression analysis to assess the prevalence of manipulation.
16
5. The prevalence of manipulation
In this section, we test the three hypotheses discussed earlier on our sample of IPOs
to examine how prevalent manipulation is in the context of Indian IPO. To recall, if our measure
of manipulation (presence of syndicate traders) is valid then the trading and stock price action
in the potentially manipulated IPOs should be consistent with securities that are manipulated.
5.1. Trading Turnover
5.1.1. Total Trading
We examine overall trading in the first month following the listing of the stock. As
most of our IPOs are listed in both the BSE and NSE stock exchanges, we aggregate the trading
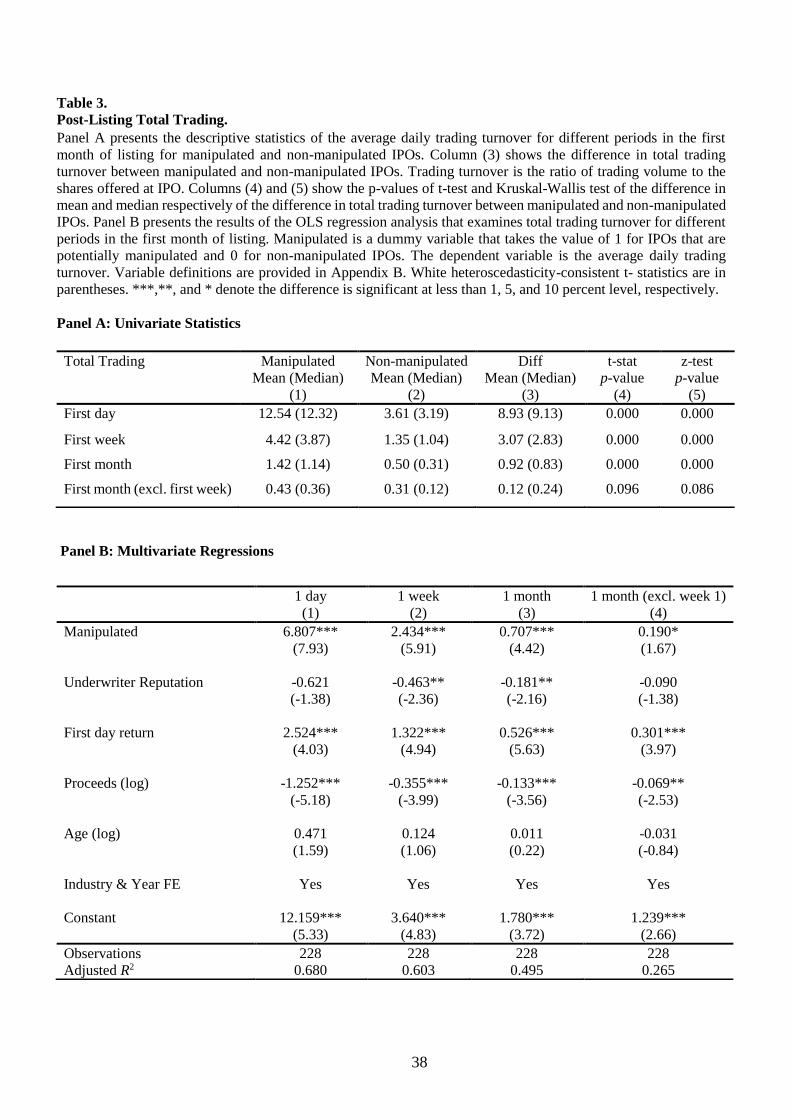
of two exchanges to compute the total trading volume for each IPO. Panel A of Table 3 presents
the univariate statistics for average daily total trading turnover for different windows of trading
period by manipulated and non-manipulated IPOs. Following the convention in the literature,
we define trading turnover as total shares traded divided by shares offered in the IPO.
[Insert Table 3 about here]
The total turnover in manipulated IPOs is significantly higher than in non-manipulated
IPOs; manipulated IPOs have a median turnover of 12.32 times on the first day of listing,
compared to the median turnover of 3.19 times for non-manipulated IPOs. Although the
difference in average daily trading volume between two IPO categories remains significant
beyond the first trading day, the difference persists primarily due to extremely high volume in
the manipulated IPOs in first few days of listing. The drop is trading volume is remarkable in
manipulated IPOs after the first week of the listing. If we exclude the first week, trading volume
is almost similar in the two IPO categories.
17
Panel B of Table 3 presents the results of the OLS regression for trading turnover for
different windows of trading period. The dependent variable is the average daily trading
turnover with the main variable of interest being the manipulated dummy variable, which takes
the value of 1 for manipulated and 0 for non-manipulated IPOs. Following Ellis (2006), we
also include underwriter reputation, first day return, proceeds (log) and firm age (log) as control
variables. We also control for industry and year fixed effects.20
Consistent with the univariate results, manipulated IPOs exhibit significantly higher
turnover on the first day of trading (column 1), even after the inclusion of control variables.
The size of the coefficient suggests that trading is almost seven times higher in manipulated
IPOs on the first day of listing. The model explains about 70 percent of the variation in the
trading volume with the manipulated variable alone explaining about 54 percent of the
variation. As for control variables, underwriter reputation is negatively, first day return is
positively, and IPO proceeds are negatively related to total trading turnover. Overall, the
analysis on total trading shows that manipulated IPOs have extremely high trading volumes,
which is consistent with our first hypothesis.
5.1.2. Bulk trades
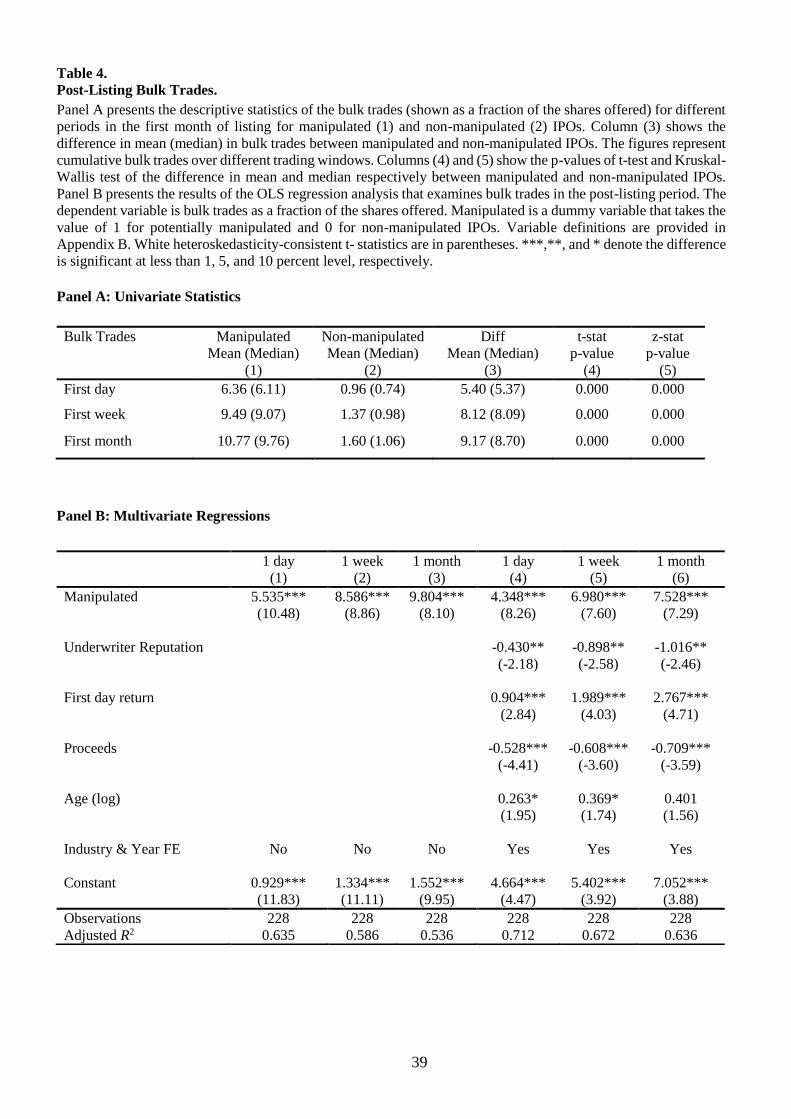
We next turn our attention to bulk trades. As mentioned earlier, bulk trades are large
trades that accounts for more than 0.5% of the number of outstanding shares listed on the
exchange. As with trading turnover, we aggregate the bulk trades of two exchanges to compute
the total bulk trades for each IPO. Bulk trades turnover is defined as total bulk trades divided
by shares offered in the IPO. However, instead of calculating the average daily bulk trades, we
calculate the cumulative bulk trades up to the first month of listing. We limit our analysis only
to the first month of listing, as there are very few bulk transactions thereafter.
20 We group IPO firms into 11 industry sectors: consumer discretionary, consumer staples, energy, healthcare,
industrials, financials, information technology, utilities, materials and telecommunication services.
18
Panel A of Table 4 presents the univariate statistics on bulk trades for the first day,
first week and first month of listing. Consistent with our hypothesis, we find that bulk trades
are significantly higher in manipulated IPOs. Specifically, the median value of first-day bulk
trades in the manipulated IPO is 6.11 times compared to only 0.74 times in the non-manipulated
IPOs with the differences statistically significant at less than 1% level. The difference in the
bulk trades in the two IPO categories jumps to more than eight times by the end of the first
week of listing (9.07 times in the manipulated vs. only 0.98 times in the non-manipulated
IPOs). It is also interesting to note that although bulk trades are significantly higher in
manipulated IPOs in the first week of listing, these trades decline significantly thereafter. Bulk
trades in the median manipulated IPO at the end of the first month is 9.76 times, which is only
marginally higher than the 9.07 times at the end of the first week of listing.
[Insert Table 4 about here]
In Panel B of Table 4 we present the results of the multivariate regression analysis.
The dependent variable is bulk trades turnover and the main variable of interest is the
manipulated dummy variable. As with total trading, we include underwriter reputation, first
day return, proceeds (log) and firm age (log) as control variables. We also control for industry
and year fixed effects. As shown in column (1), the manipulated variable alone explains about
66 percent of the variation in first day bulk trades. Manipulated remains significantly positive
for first week and also when we include the control variables. Just as we observe in univariate
analysis, the coefficient on manipulated dummy variable for the first month regression is only
marginally higher than the value of the coefficient for the first week regression. The
coefficients on control variables are similar to those reported for total trading regressions.
In sum, in support of our first hypothesis, we find significantly high volume of bulk
trades, and consequently high total trading, in manipulated IPOs relative to non-manipulated
19
IPOs. Our evidence also indicates that if the excessive volume is on account of manipulation,
then such trade-based manipulation is played out within the first few days of listing as the
volume declines significantly thereafter. 21
5.2. Bulk Traders
The previous section demonstrates that trading volume in the immediate post-listing
period is extremely high in manipulated IPOs; in this section, we examine who contributes to
this high volume by performing a comprehensive analysis of bulk trades done in the first month
of listing. Although a total of 3,463 traders make bulk trades in our sample of 228 IPOs, a
majority of these traders (2,303 to be precise) trade only in one IPO.22 There are 1,932 bulk
traders in the 32 manipulated IPOs and 2,177 traders in 196 non-manipulated ones. Thus, not
surprisingly, we find a significantly higher number of bulk traders in manipulated compared to
non-manipulated IPOs.
[Insert Table 5 about here]
Panel A of Table 5 presents the univariate analysis of bulk traders and the trades made
by these traders in the first month of listing. Overall, we find 121 bulk traders and 436 trades
in the median manipulated IPO compared to just 23 traders and 50 trades in the median non-
manipulated IPO. Of more interest is the trades made by the syndicate, the core set of traders
identified in the investigated IPOs. Given how we define manipulated IPOs, it is natural that
we see a significantly higher number of syndicate traders in manipulated IPOs. However, we
also find that the number of trades as well as the fraction of the total bulk trades volume by the
21 As market misconduct is also driven by exchange trading rules (Aitken et al., 2015), we also examined bulk
trades separately for the two stock exchanges (BSE and NSE). We find that the volume of manipulative bulk
trades is similar across the two exchanges. 22 Just as in the other sections, we exclude the 7 investigated IPOs from the analysis. The mean (median) results,
however, are essentially the same when we include the 7 IPOs.
20
syndicate traders is significantly higher in manipulated IPOs. There are 92 bulk trades by the
syndicate in the median manipulated IPOs compared to 10 trades in the median non-
manipulated IPO. Similarly, just as in the investigated IPOs, about 42% of the bulk trade
volume in the median manipulated IPO originates from the syndicate, compared to only about
5% in the median non-manipulated IPO.
Although the number of trades as well as the volume by syndicate traders in much
lower in non-manipulated IPOs, their presence in these other IPOs suggest that the traders are
regular IPO investors and know the market quite well. To examine this further, in columns (1)
and (2) of Appendix A we show the total as well the number of manipulated IPOs in which the
syndicate traders make bulk trades in the first month of listing. As shown, although there are
traders who disproportionately trade only in manipulated IPOs, quite a few of these traders are
active across a large number of IPOs. Almost half of the syndicate traders have made bulk
trades in almost a quarter of all the IPOs issued during the sample period.
In Panel B we perform a multivariate regression analysis on bulk traders. The main
variable of interest, as before, is the manipulated dummy that takes the value of 1 for
manipulated and 0 for non-manipulated IPOs. We include the same set of control variables as
in the trading regressions. The dependent variable in specifications (1) and (2) is the total
number of bulk traders and the number of bulk trades respectively. In specifications (3) and (4)
where we examine the syndicate, the dependent variables are the number of bulk trades by the
syndicate and the fraction of the total bulk volume that originates from the syndicate
respectively. Consistent with univariate analysis, the dummy variable, Manipulated, is
significant in all the specifications and suggests that manipulated IPOs have a significantly
larger number of bulk trades as well as have a significantly large fraction of the trades
originating from the syndicate traders. Overall, the result from this section provides support to
21
our second hypothesis as we show that a significant portion of the bulk trade volume originates
from a core set of traders.
In sum, the analysis of post-listing trading shows that the set of 32 manipulated IPOs,
just as in the SEBI investigated IPOs, exhibits extremely high volumes of total and bulk trading.
If these IPOs are indeed manipulated, then this should not come as a surprise, particularly the
excessive amount of bulk trades, as trade-based manipulation, by definition, proceeds through
large trades (Jiang et al., 2005). Further, as in the investigated IPOs, we also observe a causal
link between the syndicate and the high volume of bulk trades in manipulated IPOs.
5.3. IPO performance
In this section, we test our third hypothesis (H3). As discussed earlier, if the set of
manipulated IPOs are indeed exploited, and the large trades in the immediate post-listing period
is an element of the manipulation scheme, we should then observe a significant influence of
this excessive trading on stock prices, both while these trades are executed and also as the
manipulators exit the market. To demonstrate this, we examine the listing and post-listing
returns for our sample of manipulated and non-manipulated IPOs and present the results in
Table 6. To measure IPO performance, we compute the market adjusted buy and hold returns
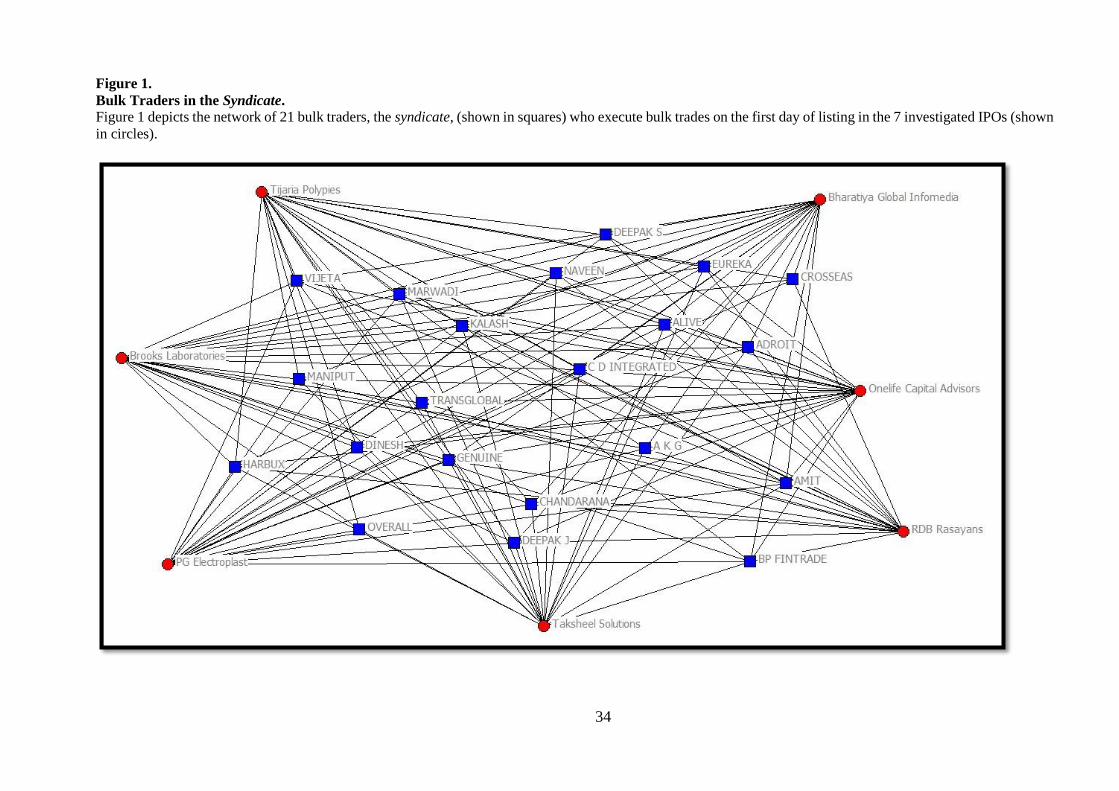
for the period under consideration.23 Panel A presents the univariate statistics and Figure 2
shows the post-listing returns (mean and median) for firms in the two IPO categories.
[Insert Figure 2 and Table 6 about here]
Consistent with our hypothesis we find that manipulated IPOs have positive returns
on listing. In fact, the median first day (first week) returns are higher (comparable) for
manipulated IPOs; the median first-day (first week) return is 21% (7%) for manipulated IPOs,
23 Results are essentially the same when we use raw instead of market adjusted returns. The results can be provided
upon request.
22
compared to 4% (7%) for non-manipulated IPOs. More importantly, consistent with our
hypothesis, we find that stock price in the manipulated IPOs collapses after the first week of
listing. The median return in the manipulated IPO declines a massive 56% from its listing day
price by the end of the first month of trading (21% on the first-day vs. -35% for the first month);
the comparable decline is a modest 2% in the median non-manipulated IPO. This decline
coincides with the sharp fall in total and bulk trading volumes in the manipulated IPOs. By the
end of the third month of listing, the median manipulated IPO falls as much as 47% below its
offer price, compared to a decline of about 7% for the median non-manipulated IPO.
We find that the stock price in 9 of the 32 manipulated IPOs declines below the offer
price on the first day of listing. Excluding these IPOs, the average (median) first-day return in
the remaining 23 manipulated IPOs jumps to 52% (49%). For non-manipulated IPOs, 76
offerings close below their offer price on the first day of trading and after excluding them the
average (median) first day return for the remaining IPOs goes up to 36% (25%). The median
difference in first day returns between manipulated and non-manipulated IPOs after excluding
firms with negative returns is statistically significant 24%.
To get a better insight of the manipulated IPOs that decline on the first day of listing
despite high trading (bulk trades) volume, we examine the intra-day price movement in these
IPOs. Stock price in these IPOs does not decline immediately on listing; in fact, in almost all
these IPOs, stock price rises significantly above its offer price during the course of the day. For
instance, stock price of Indo Thai Securities, which was priced at INR 74, reaches an intraday
high of INR 99 before slumping to INR 23 by the end of the first day of listing. Similarly,
Omkar Speciality Chemicals Ltd priced at 98, reaches at intraday high of 101 before declining
to INR 46 at the end of the day. Shilpi Cable Technologies (priced at 69) reaches a high of 85
23
before declining to 48.24 Thus, despite the execution of large trades, it certainly appears the
attempt at manipulation is not entirely successful in some cases as stock price in some of the
IPOs slump on the first day of listing.
Another interesting observation across manipulated IPOs with positive and negative
listing returns is the volume of bulk trades beyond the first day of listing. We find that bulk
trades dries up immediately after the first day for manipulated IPOs with negative listing
returns. The average bulk trades increases only marginally from 6.99 times on the first day to
7.25 times at the end of the first week. On the other hand, in IPOs with positive listing returns,
the average bulk trades rises considerably from 7.10 times on the first day to 11.79 times at the
end of the first week of listing.
In Panel B of Table 6, we present the results of the multivariate regression analysis on
IPO returns where the result for the first day is show in column (1); the first month in column
(2); the first three months in column (3); and the first six months in column (4). To avoid the
effect of the first day, in columns (5) and (6) we report the first-month, three-month and six-
months returns by calculating return from the price at the end of the first day of listing. Hence,
the dependent variable in specifications (1) – (4) is the respective market-adjusted return for
the period under consideration calculated from the offer price; the dependent variable for
specifications (5) – (7) is the respective market-adjusted return for the period under
consideration calculated from the price at the end of the first day of trading. We use returns on
the BSE Sensex Index in calculating market returns.
As before, our primary variable of interest is the manipulated dummy variable. We
also include underwriter reputation, proceeds (log), age (log) and market condition as
24 The evidence is similar for the investigated IPOs that experience significant decline in stock price on the first
day of trading. The stock price of RDB Rasayans (priced at INR 79), for instance, reaches a high of INR 93, before
falling to INR 26. Similarly, Bharatiya Global Media (priced at INR 82) reaches as high as INR 84, before
slumping to INR 29 by the end of the first day of trading.
24
additional control variables [see, Derrien and Womack (2003) and Loughran and Ritter
(2004)]. Consistent with the univariate analysis, regressions (1) – (4) clearly show that whilst
there is no significant difference in first day returns between the two IPO categories, returns in
the manipulated IPOs become significantly worse in the post listing period. By the end of the
first month of listing, the difference in returns between the two IPO categories is as much as
35% which rises to about 60% at the end of the six month period. Results are similar in
specifications (5) – (7), where we exclude the return on the first day of trading.
Overall, the results on the analysis on stock returns provide strong support for our
third hypothesis. As predicted, we find that the stock price in manipulated IPOs initially rises,
but then declines dramatically as manipulators exit the market. Taken together, the evidence
we gather from the analysis of bulk trades, the traders involved in these trades and the pattern
of stock price, all point toward the presence of trade-based manipulation, and more specifically
the pump-and-dump scheme in a number of Indian IPOs. We find that the manipulated IPOs
exhibit very high volumes of large trades; a significant fraction of these large trades originates
from a core set of traders (the syndicate); and finally we find that the stock price in these
manipulated IPOs rises significantly in conjunction with large trades, but declines dramatically
as manipulators leave the market. This description of trading and stock price behavior is
entirely consistent with the pump-and-dump scheme of manipulation, previously discussed in
the context of stock market manipulation (Khanna and Sunder, 1999; Khawaja and Mian, 2005;
Mei et al., 2004). Interestingly, we also find that manipulators are not entirely successful at
manipulation in some cases with the stock price plunging on the first day of listing despite
heavy trading volume.
6. Robustness test: Propensity Matching
It could be argued that it is, perhaps, not appropriate to compare manipulated IPOs
with all the other remaining IPOs in the sample as they do not have similar characteristics.
25
Hence, in this section we use matching procedures based on propensity score matching (PSM)
and Abadie and Imbens matching (AIM) to match manipulated with similar control IPOs. Both
the matching methods control for selection bias by controlling for IPO firm characteristic, and
estimate the average treatment effect on the treated (ATT).
[Insert Table 7 about here]
For the PSM method, we use nearest neighbor matching with replacement and caliper
matching, as suggested by Rosenbaum and Rubin (1983) and Dehejia and Wahba (2002). We
match by using a maximum of four nearest neighbors for the nearest neighbor method, and a
caliper of 0.2 for the radius caliper matching. The caliper is chosen to be wide enough to allow
for a reasonable number of matches. We choose the option of matching with replacement as it
produces less-biased matches. Following Abadie and Imbens (2006, 2011), we use simple
matching and bias-corrected estimation method to calculate the ATT for the AIM method. We
use total assets, IPO proceeds, age, underwriter reputation and time trend as covariates for
estimating the ATT for all methods. We use the same set of variables for bias correction in
AIM. The standard error for the ATT is calculated using 10,000 bootstrap replications. In
unreported results, we find that the balancing condition is satisfied in our matched sample, i.e.
independent variable does not differ significantly between manipulated and control firms.
The results of this analysis are shown in Table 7 where we report the estimates for
ATT and p-values for all the important variables used in the study. As shown, the value and
the statistical significant of the coefficients suggests that the result of our prior analyses are
robust. The size of the coefficient suggests that manipulated IPOs have seven times more total
trading volume and about five times more bulk trades than in a sample of matched control
IPOs. The total number of bulk traders as well as the number of bulk trades in significantly
higher than in the control sample. Similarly, estimates for ATT suggests that fraction of bulk
26
trade volume by the syndicate is almost 40% higher in manipulated IPOs. The coefficients on
the returns suggest that manipulated IPOs perform significantly worse than control IPOs in the
post-listing period, although there is no such difference in the first day return.
7. Conclusions
An examination of market misconduct is not only interesting, but also has important
policy implications as the costs of financial misconduct are significant (Cumming et al., 2015).
A survey of investment practitioners by the CFA Institute (2014) cites market fraud as a
significant ethical issue facing global markets. In this context, this paper examines market
misconduct in the context of IPOs in an emerging market. In late 2011, SEBI probed 7 IPOs
and found several irregularities such as concealment of material information in offer
documents, improper use of proceeds and irregular bidding and trading by investors to create
artificial demand during the offer and post-listing periods. Using insights gleaned from the
seven investigated IPOs and using an innovate approach this study examines the prevalence of
manipulation in Indian IPOs issued during the 2006 – 2011 period.
Through our analyses, we present compelling evidence of large-trade based
manipulation in a sizeable number of IPO offerings that in all likelihood escaped enforcement
action. More specifically, consistent with the pump-and-dump scheme of manipulation, several
manipulators jointly push up the stock price artificially through large trades with the stock price
subsequently crashing suddenly and drastically as the manipulators exit the market. Taken
together, our evidence and SEBI’s investigation show that irregularities were quite wide-
ranging in a substantial number of IPOs: concealment of material information and manipulation
both at the time of offer subscription and in the post-listing period. It should be pointed out
that most of the manipulated and the investigated IPOs were issued in a three-year period, 2009
– 2011. In unreported analysis we also examine IPOs issued in the post-investigation period
and fail to come across firms that exhibit characteristics of manipulated IPOs. Although some
27
of the syndicate traders do make bulk trades, we do not find any irregular pattern in these IPOs.
This suggests that SEBI’s investigation and the subsequent enforcement actions appear to have
mitigated manipulation in the market. However, given the relative ease with which we detect
irregularities using publicly available data, the regulatory authorities should be much more
vigilant in keeping a check on abnormal market activities as early as possible to avoid losing
investor trust and confidence. Further, consistent with Neupane and Poshakwale (2012), our
paper also shows that retail investors in the transparent Indian IPO setting can avoid
manipulated offerings and improve their returns by free-riding on institutional investors.
28
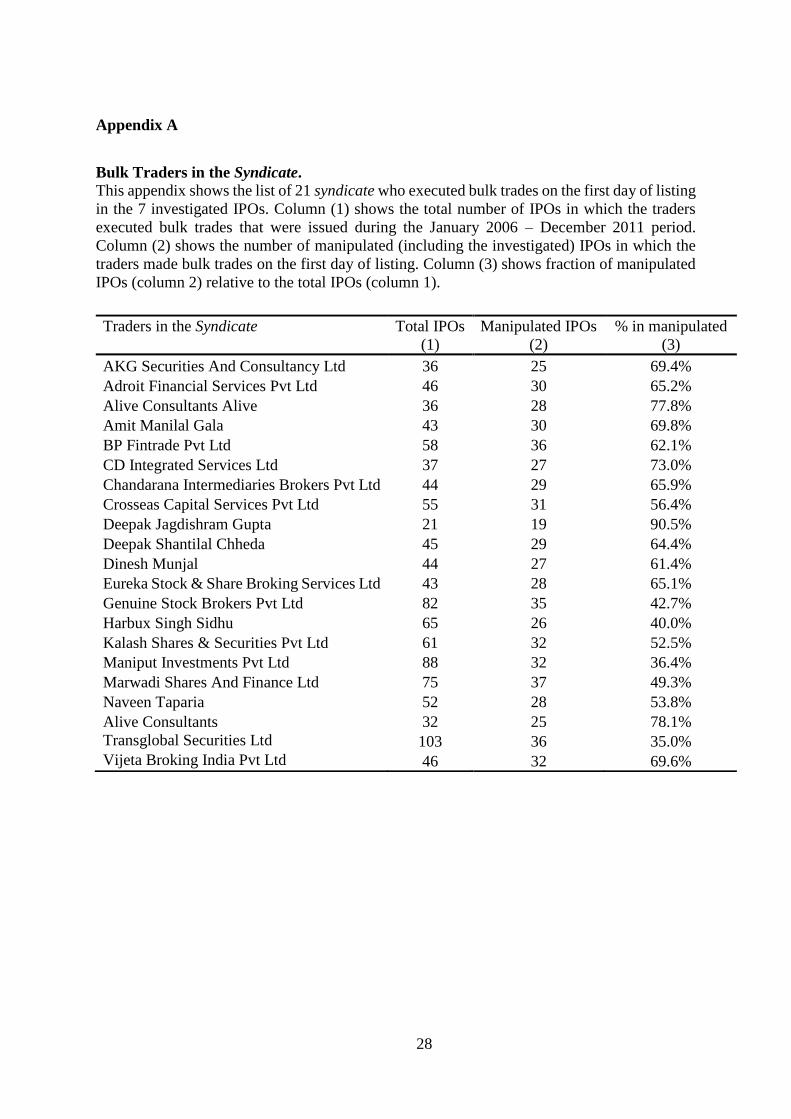
Appendix A
Bulk Traders in the Syndicate.
This appendix shows the list of 21 syndicate who executed bulk trades on the first day of listing
in the 7 investigated IPOs. Column (1) shows the total number of IPOs in which the traders
executed bulk trades that were issued during the January 2006 – December 2011 period.
Column (2) shows the number of manipulated (including the investigated) IPOs in which the
traders made bulk trades on the first day of listing. Column (3) shows fraction of manipulated
IPOs (column 2) relative to the total IPOs (column 1).
Traders in the Syndicate
Total IPOs
(1)
Manipulated IPOs
(2)
% in manipulated
(3)
AKG Securities And Consultancy Ltd 36 25 69.4%
Adroit Financial Services Pvt Ltd 46 30 65.2%
Alive Consultants Alive 36 28 77.8%
Amit Manilal Gala 43 30 69.8%
BP Fintrade Pvt Ltd 58 36 62.1%
CD Integrated Services Ltd 37 27 73.0%
Chandarana Intermediaries Brokers Pvt Ltd 44 29 65.9%
Crosseas Capital Services Pvt Ltd 55 31 56.4%
Deepak Jagdishram Gupta 21 19 90.5%
Deepak Shantilal Chheda 45 29 64.4%
Dinesh Munjal 44 27 61.4%
Eureka Stock & Share Broking Services Ltd 43 28 65.1%
Genuine Stock Brokers Pvt Ltd 82 35 42.7%
Harbux Singh Sidhu 65 26 40.0%
Kalash Shares & Securities Pvt Ltd 61 32 52.5%
Maniput Investments Pvt Ltd 88 32 36.4%
Marwadi Shares And Finance Ltd 75 37 49.3%
Naveen Taparia 52 28 53.8%
Alive Consultants 32 25 78.1%
Transglobal Securities Ltd 103 36 35.0%
Vijeta Broking India Pvt Ltd 46 32 69.6%
29
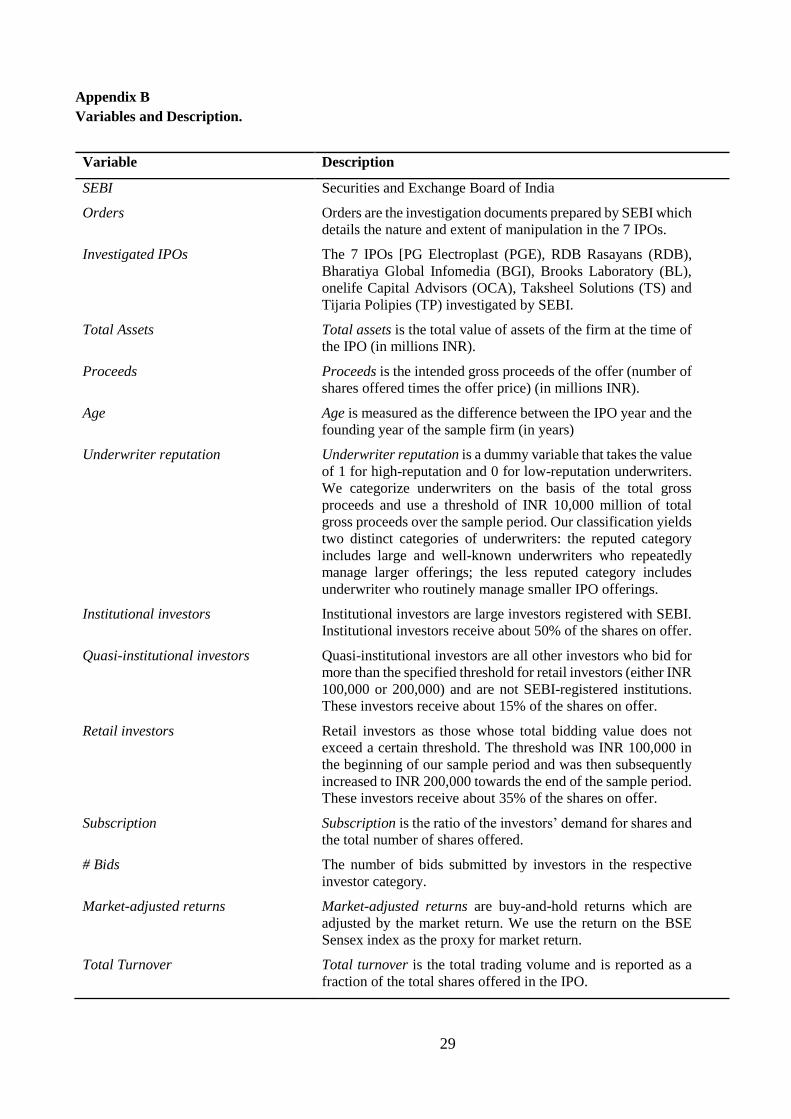
Appendix B
Variables and Description.
Variable Description
SEBI Securities and Exchange Board of India
Orders Orders are the investigation documents prepared by SEBI which
details the nature and extent of manipulation in the 7 IPOs.
Investigated IPOs The 7 IPOs [PG Electroplast (PGE), RDB Rasayans (RDB),
Bharatiya Global Infomedia (BGI), Brooks Laboratory (BL),
onelife Capital Advisors (OCA), Taksheel Solutions (TS) and
Tijaria Polipies (TP) investigated by SEBI.
Total Assets Total assets is the total value of assets of the firm at the time of
the IPO (in millions INR).
Proceeds Proceeds is the intended gross proceeds of the offer (number of
shares offered times the offer price) (in millions INR).
Age Age is measured as the difference between the IPO year and the
founding year of the sample firm (in years)
Underwriter reputation Underwriter reputation is a dummy variable that takes the value
of 1 for high-reputation and 0 for low-reputation underwriters.
We categorize underwriters on the basis of the total gross
proceeds and use a threshold of INR 10,000 million of total
gross proceeds over the sample period. Our classification yields
two distinct categories of underwriters: the reputed category
includes large and well-known underwriters who repeatedly
manage larger offerings; the less reputed category includes
underwriter who routinely manage smaller IPO offerings.
Institutional investors Institutional investors are large investors registered with SEBI.
Institutional investors receive about 50% of the shares on offer.
Quasi-institutional investors Quasi-institutional investors are all other investors who bid for
more than the specified threshold for retail investors (either INR
100,000 or 200,000) and are not SEBI-registered institutions.
These investors receive about 15% of the shares on offer.
Retail investors Retail investors as those whose total bidding value does not
exceed a certain threshold. The threshold was INR 100,000 in
the beginning of our sample period and was then subsequently
increased to INR 200,000 towards the end of the sample period.
These investors receive about 35% of the shares on offer.
Subscription Subscription is the ratio of the investors’ demand for shares and
the total number of shares offered.
# Bids The number of bids submitted by investors in the respective
investor category.
Market-adjusted returns Market-adjusted returns are buy-and-hold returns which are
adjusted by the market return. We use the return on the BSE
Sensex index as the proxy for market return.
Total Turnover Total turnover is the total trading volume and is reported as a
fraction of the total shares offered in the IPO.
30
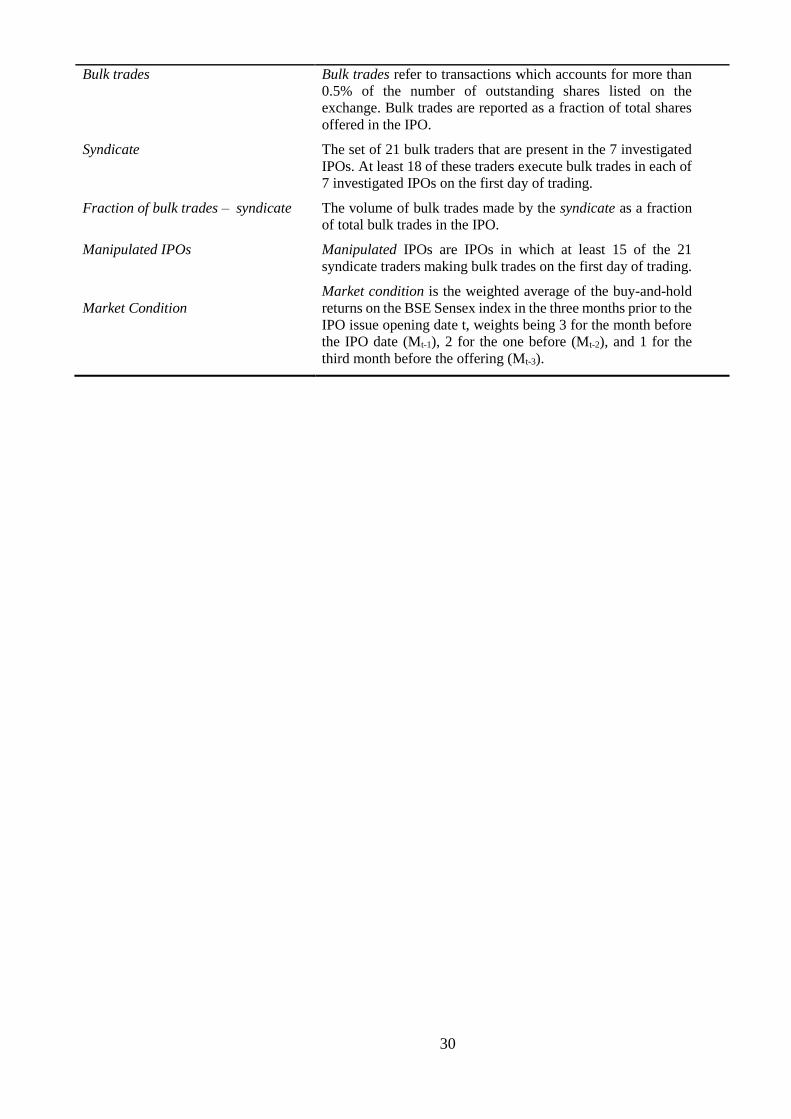
Bulk trades Bulk trades refer to transactions which accounts for more than
0.5% of the number of outstanding shares listed on the
exchange. Bulk trades are reported as a fraction of total shares
offered in the IPO.
Syndicate The set of 21 bulk traders that are present in the 7 investigated
IPOs. At least 18 of these traders execute bulk trades in each of
7 investigated IPOs on the first day of trading.
Fraction of bulk trades – syndicate The volume of bulk trades made by the syndicate as a fraction
of total bulk trades in the IPO.
Manipulated IPOs Manipulated IPOs are IPOs in which at least 15 of the 21
syndicate traders making bulk trades on the first day of trading.
Market Condition
Market condition is the weighted average of the buy-and-hold
returns on the BSE Sensex index in the three months prior to the
IPO issue opening date t, weights being 3 for the month before
the IPO date (Mt-1), 2 for the one before (Mt-2), and 1 for the
third month before the offering (Mt-3).

31
Acknowledgements
We thank Renee Adams, Reena Aggarwal, Henk Berkman, Dan Bradley, Douglas Cummings, Jack
Cooney, François Derrien, Steven Dolvin, Vidhan Goyal, Jayant Kale, Woojin Kim, Tim Loughran,
Vikram Nanda, Prabhakar Patil, Raghu Rau, Jonathan Reuter, Jay Ritter, Jayati Sarkar, Subrata
Sarkar and seminar participants at the 2014 NSE-IGIDR conference (Mumbai, India), the 2014
Financial Markets and Corporate Governance Conference & Symposium (QUT, Brisbane) for their
helpful comments. We gratefully acknowledge the research support provided by the NSE-IGIDR
Corporate Governance Research Initiative. We thank Pawan Neupane for excellent research
assistance.
32
References
Abadie, A., Imbens, G.W., 2006. Large sample properties of matching estimators for average
treatment effects. Econometrica 74, 235–267.
Abadie, A., Imbens, G.W., 2011. Bias corrected matching estimators for average treatment effects.
J. Bus. Econ. Stat. 29, 1–11.
Aggarwal, R.K., Purnanandam, A.K., Wu, G., 2005. Underwriter Manipulation in IPOs.
Unpublished working paper.University of Minnesota and University of Michigan.
Aggarwal, R.K., Wu, G., 2006. Stock Market Manipulations. The Journal of Business 79, 1915-
1953.
Aitken, M., Cumming, D., Zhan, F., 2015. Exchange trading rules, surveillance and suspected
insider trading. J. Corp. Finance 34, 311-330.
Allen, F., Gale, D., 1992. Stock-price manipulation. Rev. Financ. Stud. 5, 503-529.
Borgatti, S.P., Everett, M.G., Freeman, L.C. 2002. Ucinet for Windows: Software for social network
analysis, Analytic Technologies. Harvard, MA; 2002.
CFA Institute, 2014. Global Market Sentiment Survey 2015: Detailed Survey Results. CFA
Institute; http://www.cfainstitute.org/Survey/gmss_2015_detailed_results.pdf.
Chakraborty, A., Yılmaz, B., 2004. Informed manipulation. J. Econ. Theory 114, 132-152.
Cumming, D., Dannhauser, R., Johan, S., 2015. Financial market misconduct and agency conflicts:
A synthesis and future directions. J. Corp. Finance 34, 150-168.
Cumming, D., Johan, S., 2008. Global Market Surveillance. Amer. Law Econ. Rev. 10, 454-506.
Dehejia, R.H., Wahba, S., 2002. Propensity score-matching methods for nonexperimental causal
studies. Rev. Econ. Stat. 84 (1), 151–161.
Derrien, F., Womack, K.L., 2003. Auctions vs. Bookbuilding and the Control of Underpricing in
Hot IPO Markets. Rev. Financ. Stud. 16, 31-61.
Ellis, K., 2006. Who trades IPOs? A close look at the first days of trading. J. Financ. Econ. 79, 339-
363.
Fishman, M.J., Hagerty, K.M., 1995. The mandatory disclosure of trades and market liquidity. Rev.
Financ. Stud. 8, 637-676.
Gerard, B., Nanda, V., 1993. Trading and manipulation around seasoned equity offerings. J. Finance
48, 213-245.
33
Jagannathan, R., Jirnyi, A., Sherman, A.G., 2015. Share auctions of initial public offerings: Global
evidence. J. Financ. Intermed. 24, 283-311.
Jarrow, R.A., 1992. Market manipulation, bubbles, corners, and short squeezes. J. Financ. Quant.
Anal. 27, 311-336.
Jiang, G., Mahoney, P.G., Mei, J., 2005. Market manipulation: A comprehensive study of stock
pools. J. Financ. Econ. 77, 147-170.
Khanna, T., Sunder, S. 1999. A tale of two exchanges, Harvard Business School Case Study.
Harvard University; 1999.
Khawaja, A.I., Mian, A., 2005. Unchecked intermediaries: Price manipulation in an emerging stock
market. J. Financ. Econ. 78, 203-241.
Loughran, T., Ritter, J., 2004. Why has IPO underpricing changed over time? Finan. Manage. 33,
5-37.
Mei, J., Wu, G., Zhou, C., 2004. Behavior based manipulation: theory and prosecution evidence.
Unpublished Working Paper, New York University.
Neupane, S., Poshakwale, S., 2012. Transparency in IPO Mechanism: Retail investors' participation,
IPO pricing and returns. J. Bank. Financ. 36, 2064-2076.
Neupane, S., Paudyal, K., Thapa, C., 2014. Firm quality or market sentiment: What matters more
for IPO investors? J. Bank. Financ. 44, 207-218.
Putniņš, T.J., 2012. Market manipulation: A survey. J. Econ. Surveys 26, 952-967.
Ritter, J.R., 2011. Equilibrium in the initial public offerings market. Annu. Rev. Financ. Econ. 3
(1), 347–374.
Rosenbaum, P.R., Rubin, D.B., 1983. The central role of the propensity score in observational
studies for causal effects. Biometrika 70, 41–50.
Sawardekar, S. 2011. The Dark Underbelly of India's IPOs, The Wall Street Journal. Mumbai; 2011.
Vismara, S., Signori, A., Paleari, S., 2015. Changes in underwriters' selection of comparable firms
pre-and post-IPO: Same bank, same company, different peers. J. Corp. Finance 34, 235-250.
Zhou, C., Mei, J. 2003. Behavior based manipulation, Unpublished working paper. NYU Stern
School of Business; 2003.
34
Figure 1.
Bulk Traders in the Syndicate.
Figure 1 depicts the network of 21 bulk traders, the syndicate, (shown in squares) who execute bulk trades on the first day of listing in the 7 investigated IPOs (shown
in circles).
35
Figure 2.
Listing and Post-listing Performance.
Figure 3 depicts the listing and post-listing performance (mean and median) of the total, manipulated, non-manipulated
IPOs issued during the January 2006 – December 2011 period. The returns are the market adjusted buy-and-hold
returns for the respective period. We use the BSE Sensex Index to compute the market return.
-0.4
-0.3
-0.2
-0.1
0
0.1
0.2
0.3
0 1 3 6
% R
eturn
Holding Period (Months)
IPO Performance (Mean)
Total IPOs Manipulated IPOs Non-manipulated IPOs
-0.7
-0.6
-0.5
-0.4
-0.3
-0.2
-0.1
0
0.1
0.2
0.3
0.4
0 1 3 6
% R
eturn
Holding Period (Months)
IPO Performance (Median)
Total IPOs Manipulated IPOs Non-manipulated IPOs
36
Table 1.
Investigated IPOs.
Table 1 presents the descriptive statistics of the seven IPOs investigted by SEBI in late 2011. The seven IPOs are PG
Electroplast (PGE), RDB Rasayans (RDB), Bharatiya Global Infomedia (BGI), Brooks Laboratories (BL), Onelife
Capital Advisors (OCA), Taksheel Solutions (TS) and Tijaria Polypies (TP). The overall median represents the values
of the median IPO for the total sample 235 IPOs issued during January 2006 - December 2011 period. Variable
definitions are provided in Appendix B.
PGE RDB BGI BL OCA TS TP
Overall
Median
Firm/Offer Characteristics
Total assets 1,021 348 576 404 145 1,052 554 1,609
Offer Price 210 79 82 100 110 150 60 196
Proceeds 1,206 356 551 630 369 825 600 1,057
Age 8.00 16.00 10.00 5.00 4.00 12.00 10.00 12.00
Underwriter reputation 0 0 0 0 0 0 0 0.00
Investors' subscription & bids
Overall 1.33 1.45 1.47 1.77 1.52 2.95 1.21 3.56
Institutional 0.98 0.00 0.00 0.00 1.02 0.24 0.67 2.83
Quasi-institutional 1.83 0.75 1.48 3.13 0.93 4.60 - 3.76
Retail 1.64 3.96 5.06 3.36 2.50 6.18 1.73 3.02
# institutional bids 6 0 0 0 3 1 3 18
# quasi-institutional bids 28 10 72 52 18 50 - 79
# retail bids 4,188 2,781 5,026 4,826 1,914 10,238 3,158 23,952
First day trading
Total trading 12.056 7.779 13.141 11.850 17.462 16.620 13.06 3.848
Bulk trades 6.813 2.912 7.588 6.139 8.771 8.443 7.53 0.99
Fraction bulk trades - Syndicate 0.51 0.30 0.48 0.47 0.41 0.45 0.56 0.05
Market adjusted returns
First day 1.037 -0.616 -0.595 -0.397 0.291 -0.651 -0.724 0.06
First month 0.022 -0.883 -0.694 -0.738 1.736 -0.823 -0.743 -0.03
Three months -0.057 -0.878 -0.806 -0.816 1.311 -0.871 -0.842 -0.15
Six months -0.063 -0.944 -0.831 -0.856 1.733 -0.914 -0.868 -0.15
37
Table 2.
Descriptive Statistics.
Table 2 reports the summary statistics of firm and issue-specific variables of the overall sample (1), manipulated
(2) and non-manipulated IPOs (3). Column (4) shows the p-values for the test of the difference in mean (median)
between manipulated and non-manipulated IPOs. Variable definitions are provided in Appendix B.
Total IPOs
(1)
Manipulated
(2)
Non-manipulated
(3)
p-values
(4)
Firm/Offer characteristics
Total assets
6,812 (1,609) 950 (712) 8,399 (2,332) 0.010 (0.000)
Proceeds
3,671 (1,057) 611 (549) 4,395 (1,284) 0.044 (0.000)
Age
14.36 (12.00) 13.26 (12.00) 14.08 (12.00) 0.584 (0.434)
Underwriter Reputation
0.47 (0.00) 0.00 (0.00) 0.56 (1.00) 0.000 (0.000)
Investors' subscription & bids
Overall
17.2 (3.56) 3.12 (1.95) 20.68 (4.10) 0.000 (0.000)
Institutional
20.51 (2.83) 0.78 (0.33) 24.98 (5.09) 0.000 (0.000)
Quasi-institutional
26.73 (3.76) 5.92 (3.19) 32.00 (4.10) 0.004 (0.086)
Retail
8.51 (3.02) 4.46 (3.72) 9.35 (2.91) 0.076 (0.661)
# institutional bids
65 (18) 3 (2) 79 (30) 0.000 (0.000)
# quasi-institutional bids
373 (79) 50 (39) 456 (101) 0.1555 (0.001)
# retail bids
110,000 (23,952) 10,546 (6,244) 133,708 (35,087) 0.061 (0.000)
Number of IPOs
235 32 196
38
Table 3.
Post-Listing Total Trading.
Panel A presents the descriptive statistics of the average daily trading turnover for different periods in the first
month of listing for manipulated and non-manipulated IPOs. Column (3) shows the difference in total trading
turnover between manipulated and non-manipulated IPOs. Trading turnover is the ratio of trading volume to the
shares offered at IPO. Columns (4) and (5) show the p-values of t-test and Kruskal-Wallis test of the difference in
mean and median respectively of the difference in total trading turnover between manipulated and non-manipulated
IPOs. Panel B presents the results of the OLS regression analysis that examines total trading turnover for different
periods in the first month of listing. Manipulated is a dummy variable that takes the value of 1 for IPOs that are
potentially manipulated and 0 for non-manipulated IPOs. The dependent variable is the average daily trading
turnover. Variable definitions are provided in Appendix B. White heteroscedasticity-consistent t- statistics are in
parentheses. ***,**, and * denote the difference is significant at less than 1, 5, and 10 percent level, respectively.
Panel A: Univariate Statistics
Panel B: Multivariate Regressions
1 day
(1)
1 week
(2)
1 month
(3)
1 month (excl. week 1)
(4)
Manipulated 6.807*** 2.434*** 0.707*** 0.190*
(7.93) (5.91) (4.42) (1.67)
Underwriter Reputation -0.621 -0.463** -0.181** -0.090
(-1.38) (-2.36) (-2.16) (-1.38)
First day return 2.524*** 1.322*** 0.526*** 0.301***
(4.03) (4.94) (5.63) (3.97)
Proceeds (log) -1.252*** -0.355*** -0.133*** -0.069**
(-5.18) (-3.99) (-3.56) (-2.53)
Age (log) 0.471 0.124 0.011 -0.031
(1.59) (1.06) (0.22) (-0.84)
Industry & Year FE Yes Yes Yes Yes
Constant 12.159*** 3.640*** 1.780*** 1.239***
(5.33) (4.83) (3.72) (2.66)
Observations 228 228 228 228
Adjusted R2 0.680 0.603 0.495 0.265
Total Trading Manipulated
Mean (Median)
(1)
Non-manipulated
Mean (Median)
(2)
Diff
Mean (Median)
(3)
t-stat
p-value
(4)
z-test
p-value
(5)
First day 12.54 (12.32) 3.61 (3.19) 8.93 (9.13) 0.000 0.000
First week 4.42 (3.87) 1.35 (1.04) 3.07 (2.83) 0.000 0.000
First month 1.42 (1.14) 0.50 (0.31) 0.92 (0.83) 0.000 0.000
First month (excl. first week) 0.43 (0.36) 0.31 (0.12) 0.12 (0.24) 0.096 0.086
39
Table 4.
Post-Listing Bulk Trades.
Panel A presents the descriptive statistics of the bulk trades (shown as a fraction of the shares offered) for different
periods in the first month of listing for manipulated (1) and non-manipulated (2) IPOs. Column (3) shows the
difference in mean (median) in bulk trades between manipulated and non-manipulated IPOs. The figures represent
cumulative bulk trades over different trading windows. Columns (4) and (5) show the p-values of t-test and Kruskal-
Wallis test of the difference in mean and median respectively between manipulated and non-manipulated IPOs.
Panel B presents the results of the OLS regression analysis that examines bulk trades in the post-listing period. The
dependent variable is bulk trades as a fraction of the shares offered. Manipulated is a dummy variable that takes the
value of 1 for potentially manipulated and 0 for non-manipulated IPOs. Variable definitions are provided in
Appendix B. White heteroskedasticity-consistent t- statistics are in parentheses. ***,**, and * denote the difference
is significant at less than 1, 5, and 10 percent level, respectively.
Panel A: Univariate Statistics
Bulk Trades Manipulated
Mean (Median)
(1)
Non-manipulated
Mean (Median)
(2)
Diff
Mean (Median)
(3)
t-stat
p-value
(4)
z-stat
p-value
(5)
First day 6.36 (6.11) 0.96 (0.74) 5.40 (5.37) 0.000 0.000
First week 9.49 (9.07) 1.37 (0.98) 8.12 (8.09) 0.000 0.000
First month 10.77 (9.76) 1.60 (1.06) 9.17 (8.70) 0.000 0.000
Panel B: Multivariate Regressions
1 day
(1)
1 week
(2)
1 month
(3)
1 day
(4)
1 week
(5)
1 month
(6)
Manipulated 5.535*** 8.586*** 9.804*** 4.348*** 6.980*** 7.528***
(10.48) (8.86) (8.10) (8.26) (7.60) (7.29)
Underwriter Reputation -0.430** -0.898** -1.016**
(-2.18) (-2.58) (-2.46)
First day return 0.904*** 1.989*** 2.767***
(2.84) (4.03) (4.71)
Proceeds -0.528*** -0.608*** -0.709***
(-4.41) (-3.60) (-3.59)
Age (log) 0.263* 0.369* 0.401
(1.95) (1.74) (1.56)
Industry & Year FE No No No Yes Yes Yes
Constant 0.929*** 1.334*** 1.552*** 4.664*** 5.402*** 7.052***
(11.83) (11.11) (9.95) (4.47) (3.92) (3.88)
Observations 228 228 228 228 228 228
Adjusted R2 0.635 0.586 0.536 0.712 0.672 0.636
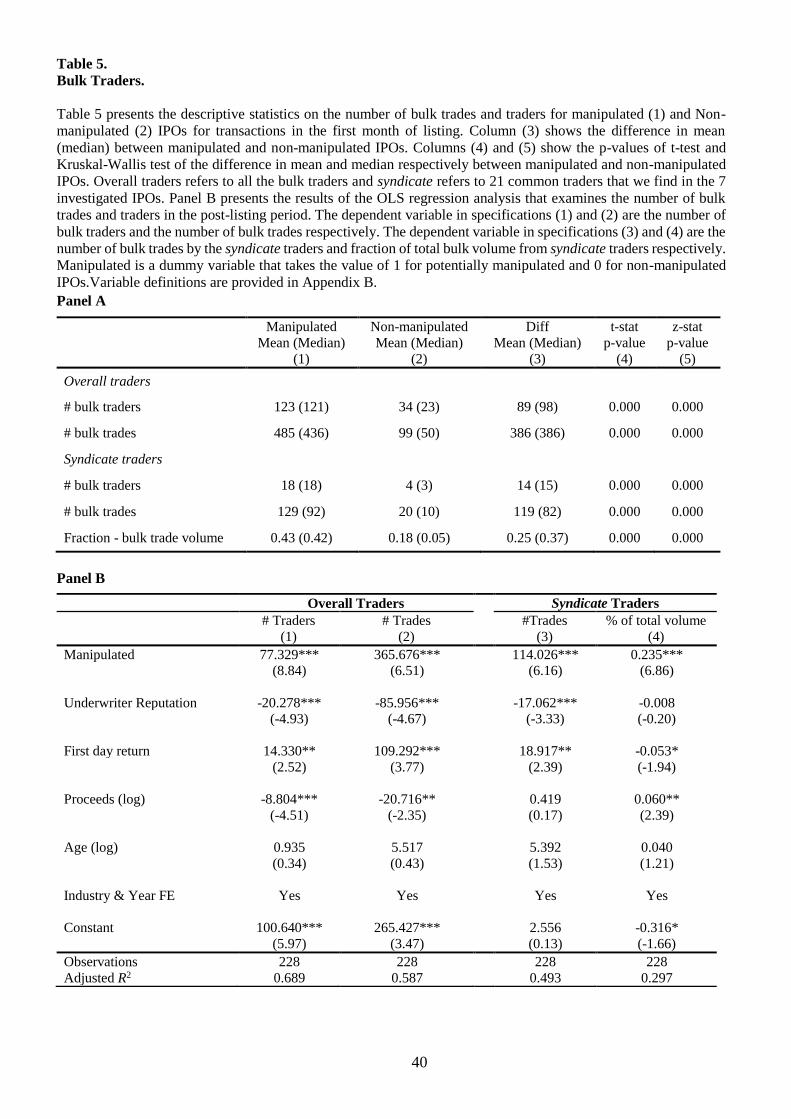
40
Table 5.
Bulk Traders.
Table 5 presents the descriptive statistics on the number of bulk trades and traders for manipulated (1) and Non-
manipulated (2) IPOs for transactions in the first month of listing. Column (3) shows the difference in mean
(median) between manipulated and non-manipulated IPOs. Columns (4) and (5) show the p-values of t-test and
Kruskal-Wallis test of the difference in mean and median respectively between manipulated and non-manipulated
IPOs. Overall traders refers to all the bulk traders and syndicate refers to 21 common traders that we find in the 7
investigated IPOs. Panel B presents the results of the OLS regression analysis that examines the number of bulk
trades and traders in the post-listing period. The dependent variable in specifications (1) and (2) are the number of
bulk traders and the number of bulk trades respectively. The dependent variable in specifications (3) and (4) are the
number of bulk trades by the syndicate traders and fraction of total bulk volume from syndicate traders respectively.
Manipulated is a dummy variable that takes the value of 1 for potentially manipulated and 0 for non-manipulated
IPOs.Variable definitions are provided in Appendix B.
Panel A
Manipulated
Mean (Median)
(1)
Non-manipulated
Mean (Median)
(2)
Diff
Mean (Median)
(3)
t-stat
p-value
(4)
z-stat
p-value
(5)
Overall traders
# bulk traders 123 (121) 34 (23) 89 (98) 0.000 0.000
# bulk trades 485 (436) 99 (50) 386 (386) 0.000 0.000
Syndicate traders
# bulk traders 18 (18) 4 (3) 14 (15) 0.000 0.000
# bulk trades 129 (92) 20 (10) 119 (82) 0.000 0.000
Fraction - bulk trade volume 0.43 (0.42) 0.18 (0.05) 0.25 (0.37) 0.000 0.000
Panel B
Overall Traders Syndicate Traders
# Traders
(1)
# Trades
(2)
#Trades
(3)
% of total volume
(4)
Manipulated 77.329*** 365.676*** 114.026*** 0.235***
(8.84) (6.51) (6.16) (6.86)
Underwriter Reputation -20.278*** -85.956*** -17.062*** -0.008
(-4.93) (-4.67) (-3.33) (-0.20)
First day return 14.330** 109.292*** 18.917** -0.053*
(2.52) (3.77) (2.39) (-1.94)
Proceeds (log) -8.804*** -20.716** 0.419 0.060**
(-4.51) (-2.35) (0.17) (2.39)
Age (log) 0.935 5.517 5.392 0.040
(0.34) (0.43) (1.53) (1.21)
Industry & Year FE Yes Yes Yes Yes
Constant 100.640*** 265.427*** 2.556 -0.316*
(5.97) (3.47) (0.13) (-1.66)
Observations 228 228 228 228
Adjusted R2 0.689 0.587 0.493 0.297
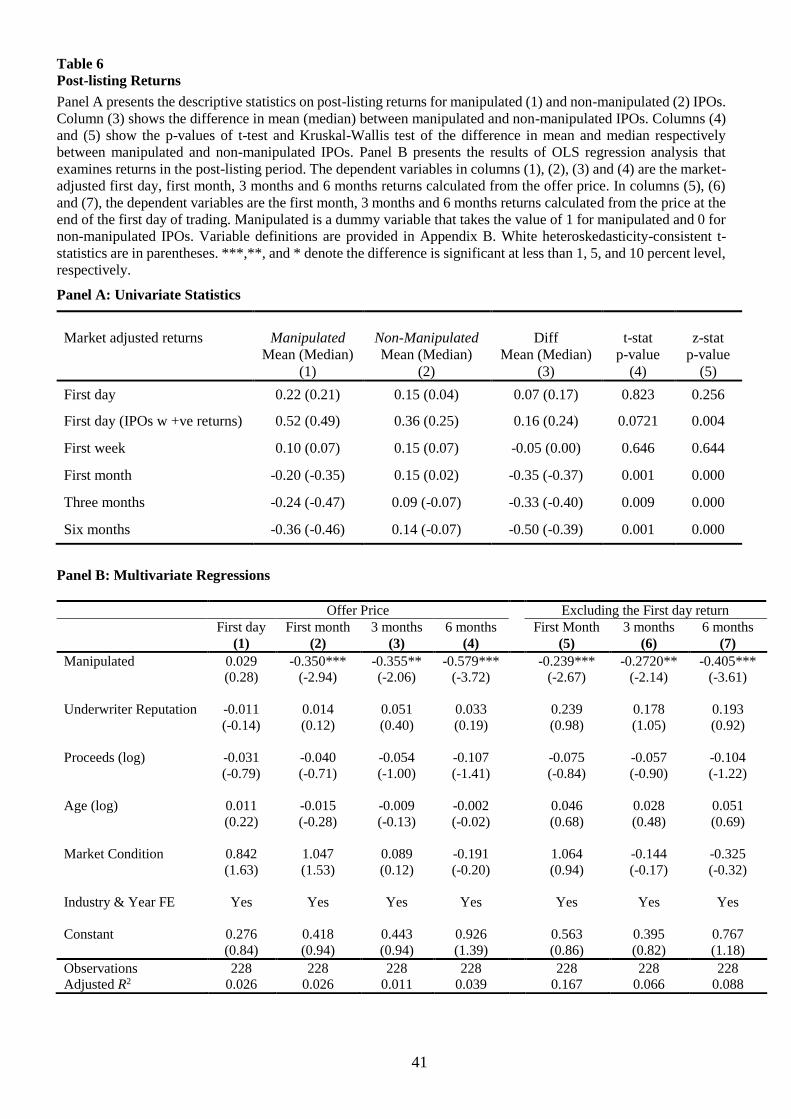
41
Table 6
Post-listing Returns
Panel A presents the descriptive statistics on post-listing returns for manipulated (1) and non-manipulated (2) IPOs.
Column (3) shows the difference in mean (median) between manipulated and non-manipulated IPOs. Columns (4)
and (5) show the p-values of t-test and Kruskal-Wallis test of the difference in mean and median respectively
between manipulated and non-manipulated IPOs. Panel B presents the results of OLS regression analysis that
examines returns in the post-listing period. The dependent variables in columns (1), (2), (3) and (4) are the market-
adjusted first day, first month, 3 months and 6 months returns calculated from the offer price. In columns (5), (6)
and (7), the dependent variables are the first month, 3 months and 6 months returns calculated from the price at the
end of the first day of trading. Manipulated is a dummy variable that takes the value of 1 for manipulated and 0 for
non-manipulated IPOs. Variable definitions are provided in Appendix B. White heteroskedasticity-consistent t-
statistics are in parentheses. ***,**, and * denote the difference is significant at less than 1, 5, and 10 percent level,
respectively.
Panel A: Univariate Statistics
Market adjusted returns Manipulated
Mean (Median)
(1)
Non-Manipulated
Mean (Median)
(2)
Diff
Mean (Median)
(3)
t-stat
p-value
(4)
z-stat
p-value
(5)
First day 0.22 (0.21) 0.15 (0.04) 0.07 (0.17) 0.823 0.256
First day (IPOs w +ve returns) 0.52 (0.49) 0.36 (0.25) 0.16 (0.24) 0.0721 0.004
First week 0.10 (0.07) 0.15 (0.07) -0.05 (0.00) 0.646 0.644
First month -0.20 (-0.35) 0.15 (0.02) -0.35 (-0.37) 0.001 0.000
Three months -0.24 (-0.47) 0.09 (-0.07) -0.33 (-0.40) 0.009 0.000
Six months -0.36 (-0.46) 0.14 (-0.07) -0.50 (-0.39) 0.001 0.000
Panel B: Multivariate Regressions
Offer Price Excluding the First day return
First day
(1)
First month
(2)
3 months
(3)
6 months
(4)
First Month
(5)
3 months
(6)
6 months
(7)
Manipulated 0.029 -0.350*** -0.355** -0.579*** -0.239*** -0.2720** -0.405***
(0.28) (-2.94) (-2.06) (-3.72) (-2.67) (-2.14) (-3.61)
Underwriter Reputation -0.011 0.014 0.051 0.033 0.239 0.178 0.193
(-0.14) (0.12) (0.40) (0.19) (0.98) (1.05) (0.92)
Proceeds (log) -0.031 -0.040 -0.054 -0.107 -0.075 -0.057 -0.104
(-0.79) (-0.71) (-1.00) (-1.41) (-0.84) (-0.90) (-1.22)
Age (log) 0.011 -0.015 -0.009 -0.002 0.046 0.028 0.051
(0.22) (-0.28) (-0.13) (-0.02) (0.68) (0.48) (0.69)
Market Condition 0.842 1.047 0.089 -0.191 1.064 -0.144 -0.325
(1.63) (1.53) (0.12) (-0.20) (0.94) (-0.17) (-0.32)
Industry & Year FE Yes Yes Yes Yes Yes Yes Yes
Constant 0.276 0.418 0.443 0.926 0.563 0.395 0.767
(0.84) (0.94) (0.94) (1.39) (0.86) (0.82) (1.18)
Observations 228 228 228 228 228 228 228
Adjusted R2 0.026 0.026 0.011 0.039 0.167 0.066 0.088
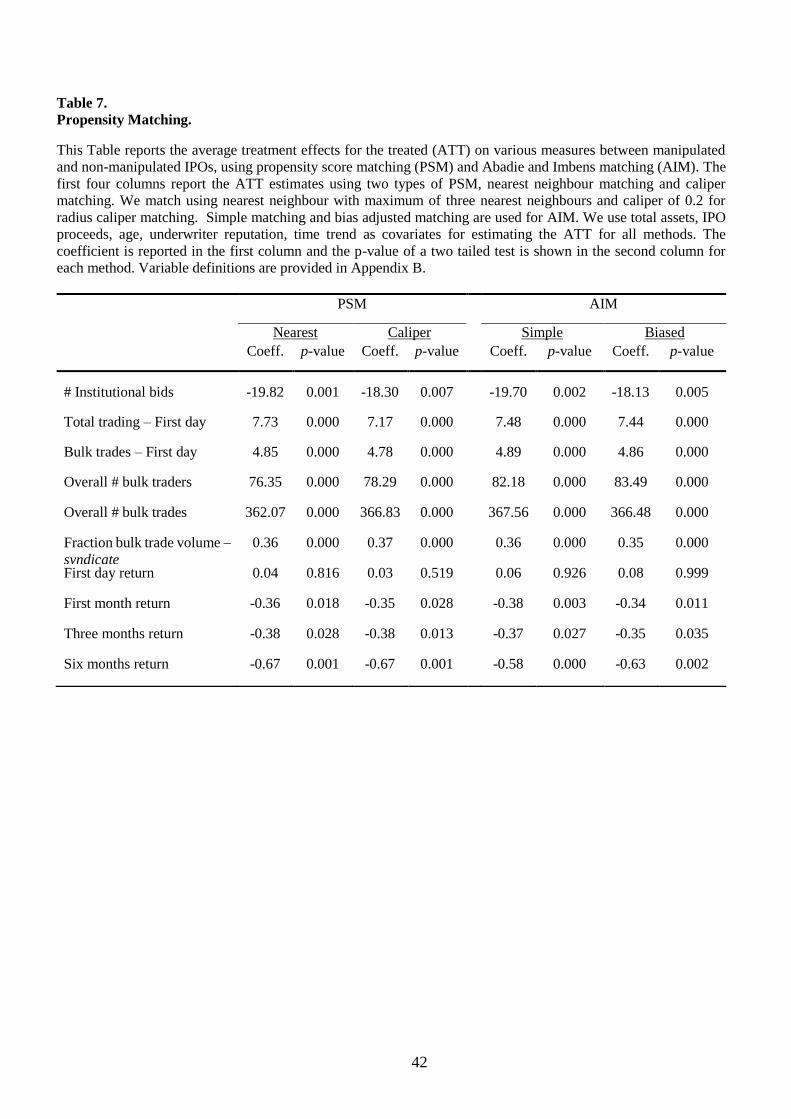
42
Table 7.
Propensity Matching.
This Table reports the average treatment effects for the treated (ATT) on various measures between manipulated
and non-manipulated IPOs, using propensity score matching (PSM) and Abadie and Imbens matching (AIM). The
first four columns report the ATT estimates using two types of PSM, nearest neighbour matching and caliper
matching. We match using nearest neighbour with maximum of three nearest neighbours and caliper of 0.2 for
radius caliper matching. Simple matching and bias adjusted matching are used for AIM. We use total assets, IPO
proceeds, age, underwriter reputation, time trend as covariates for estimating the ATT for all methods. The
coefficient is reported in the first column and the p-value of a two tailed test is shown in the second column for
each method. Variable definitions are provided in Appendix B.
PSM AIM
Nearest
Neighbour
Caliper Simple Biased Coeff. p-value Coeff. p-value Coeff. p-value Coeff. p-value
# Institutional bids -19.82 0.001 -18.30 0.007 -19.70 0.002 -18.13 0.005
Total trading – First day 7.73 0.000 7.17 0.000 7.48 0.000 7.44 0.000
Bulk trades – First day 4.85 0.000 4.78 0.000 4.89 0.000 4.86 0.000
Overall # bulk traders 76.35 0.000 78.29 0.000 82.18 0.000 83.49 0.000
Overall # bulk trades 362.07 0.000 366.83 0.000 367.56 0.000 366.48 0.000
Fraction bulk trade volume –
syndicate
0.36 0.000 0.37 0.000 0.36 0.000 0.35 0.000
First day return 0.04 0.816 0.03 0.519 0.06 0.926 0.08 0.999
First month return -0.36 0.018 -0.35 0.028 -0.38 0.003 -0.34 0.011
Three months return -0.38 0.028 -0.38 0.013 -0.37 0.027 -0.35 0.035
Six months return -0.67 0.001 -0.67 0.001 -0.58 0.000 -0.63 0.002
Related Documents