1 Thought Questions: 1. What things would cause people to leave a certain place? 2. What factors would cause people to move to a certain place? 1.POPULATION

1 Thought Questions: 1. What things would cause people to leave a certain place? 2. What factors would cause people to move to a certain place? 1.POPULATION.
Dec 25, 2015
Welcome message from author
This document is posted to help you gain knowledge. Please leave a comment to let me know what you think about it! Share it to your friends and learn new things together.
Transcript
1
Thought Questions:1. What things would cause people to
leave a certain place?2. What factors would cause people to
move to a certain place?
1.POPULATION

Key UnderstandingsPeople are not distributed equally on the
earth’s surfaceThe world’s population continues to
grow, but at different rates in different regions

3
REGIONS Part of the Earth’s surface that is alike or connected in some way, such as by politics, economics, culture, or environment.
1) Formal Region, 2) Functional Region, and 3) Perceptual Region

4
DEMOGRAPHY Demography: The study of population
Demographer: A person who studies demography
Demographics: the statistical data of a population showing age, gender, income, education, etc.
What is Demography?
• study of population
What is the primary tool of demography?
• Census- survey of population, done every 10 years.

6
GLOBALIZATION Describes an ongoing process by which regional economies, societies, and cultures have become integrated through a globe-spanning network of communication and trade.

7
Global Population Distribution
• Population Distribution of the Earth is uneven due to factors such as climate, landscape, transportation routes, and available resources. • There are FOUR centers of heavy population in the world
• These areas contain more than 70% of the Earth’s population

8
1)Eastern Asia has the greatest concentration of people on Earth – it is centered in China and has 21% of Earth’s population.
2) Southern Asia is the second largest concentration of
people – it is centered in India and has 16% of the Earth’s pop.

9

10
3) Western Europe is the third largest concentration.
In Western Europe people are concentrated near natural resources needed for industry.

11
12
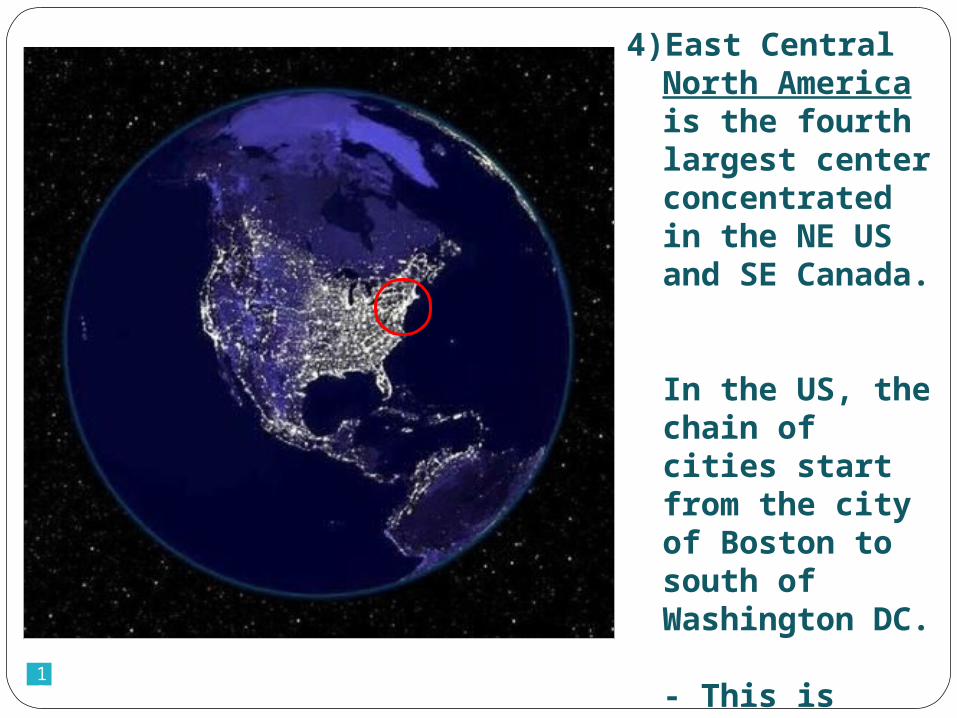
4)East Central North America is the fourth largest center concentrated in the NE US and SE Canada.
In the US, the chain of cities start from the city of Boston to south of Washington DC.
- This is called a megalopolis.

13

14
Africa has 12% of the Earth’s population.
Largest cluster of people found in the Nile River Valley.
Cairo is the largest city in Africa.

15

16
South America is lightly populated compared with other continents.
Patterns of people live along the edges of the continent – SE Buenos Aires in Argentina, Montevideo in Uruguay, and Rio de Janeiro and Recife in Brazil.

17
Australia has the fewest number of people.
They are concentrated along the eastern and southern coasts.
(17.5 million people total on the entire continent. – as much as the NYC metro area)
18
North Pole

19
World Population by Continent

20
Population DensityThe number
of people in a unit of spaceExample: 8,000 people per square mile

21
Population Density

22
Food Supply The rate of population growth was more
than the amount of food produced. More than 13 million to 18 million people
die each year because they do not have a good diet. (35,000 a day; 24 a minute – most are children)
More land is needed for agriculture Productive farming methods
More productive farming techniques Using new food sources
New sources of food Today 90% of the world’s food comes from 15 crops and 7
livestock animals. There are more than 10 million kinds of plants and animals on
Earth.

23
PUSH & PULL FACTORS The push factor involves a force which acts to drive people away from a place.
The pull factor is what draws people to a new location.

24
Migration – Push & Pull Factors
Most people move because of economic or political reasonsPushed from a bad situation
Less developed countryPulled to a better situation
More developed country, access to resources, better economy
People also move from rural to urban areasHuge demand on city infrastructure and economy Job market, living quarters

25
“The J Curve”

26

When did the increase explode?During the Industrial Revolution
• Late 1700’s to 1900’s
• Extensive use of machines to increase production
How does increased production cause population to increase?

What is Population Distribution?
• Habitable Lands - 2/3 of population between 20*N and 60*N
• Urban-Rural Mix – ½ of population lives in cities, more each year
• Migration – people moving, causes change in population
• Push Factors – reasons people leave home
• Pull Factors – reasons people come to new home

What is Population Density?• The number of people in a unit of space.• Example: “8,500 people per square mile”

How do demographers determine who is
growing?• Birth rates and Death rates, for starters
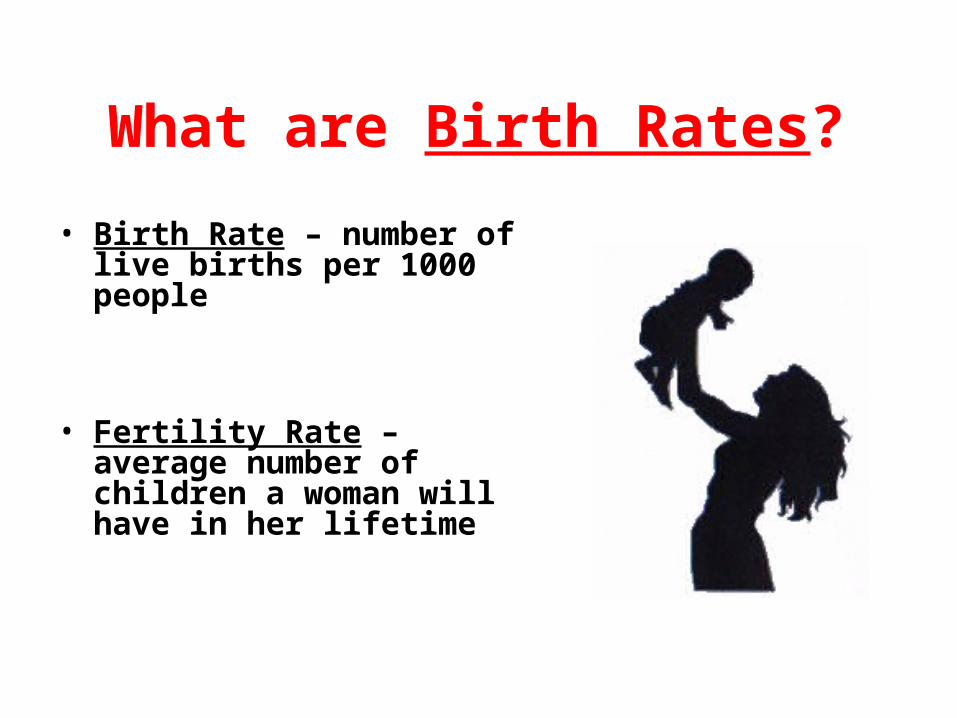
What are Birth Rates?
• Birth Rate – number of live births per 1000 people
• Fertility Rate – average number of children a woman will have in her lifetime

What are Death Rates?• Death (Mortality) Rate – number of deaths per 1000
people
• Infant Mortality Rate – number of deaths among infants under 1 year old, per 1000 live births

What is Rate of Natural Increase?
Rate of Natural Increase- % a population grows in one year
Birth Rate minus Death Rate =
Rate of Natural Increase

Who is having the kids?
Based on 2006 CIA Estimates
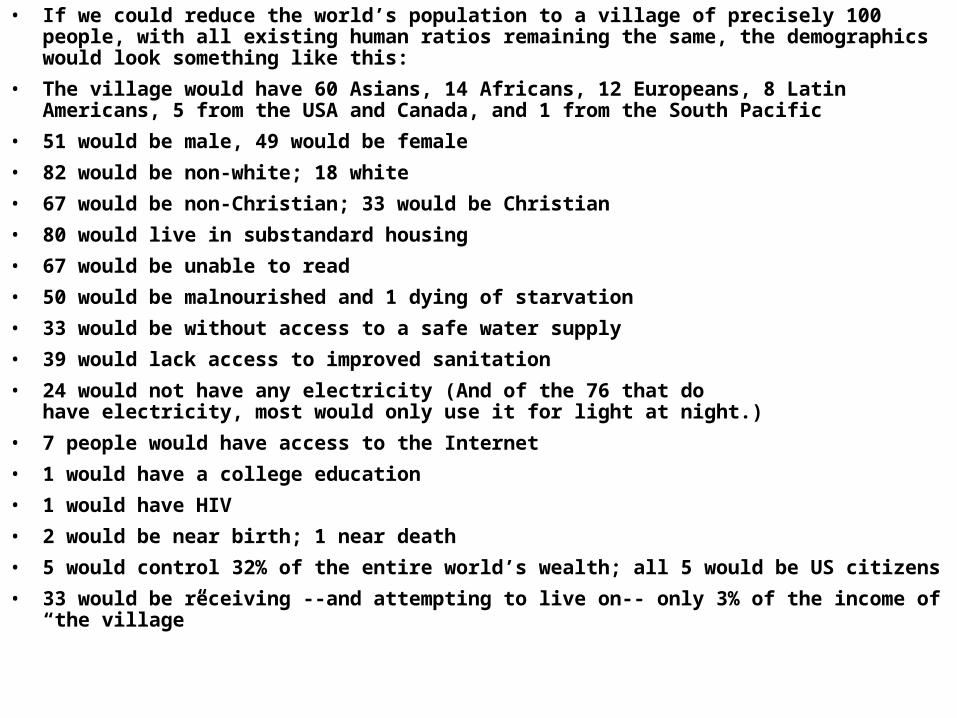
• If we could reduce the world’s population to a village of precisely 100 people, with all existing human ratios remaining the same, the demographics would look something like this:
• The village would have 60 Asians, 14 Africans, 12 Europeans, 8 Latin Americans, 5 from the USA and Canada, and 1 from the South Pacific
• 51 would be male, 49 would be female
• 82 would be non-white; 18 white
• 67 would be non-Christian; 33 would be Christian
• 80 would live in substandard housing
• 67 would be unable to read
• 50 would be malnourished and 1 dying of starvation
• 33 would be without access to a safe water supply
• 39 would lack access to improved sanitation
• 24 would not have any electricity (And of the 76 that do have electricity, most would only use it for light at night.)
• 7 people would have access to the Internet
• 1 would have a college education
• 1 would have HIV
• 2 would be near birth; 1 near death
• 5 would control 32% of the entire world’s wealth; all 5 would be US citizens
• 33 would be receiving --and attempting to live on-- only 3% of the income of “the village”

36
POPULATION PYRAMIDS
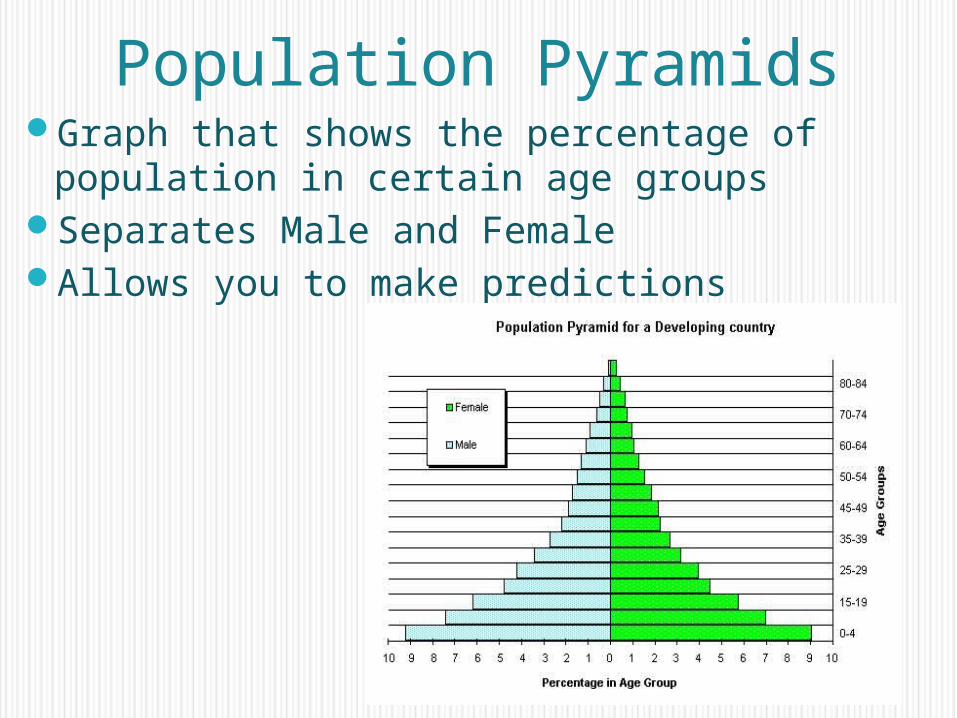
Population PyramidsGraph that shows the percentage of
population in certain age groupsSeparates Male and FemaleAllows you to make predictions

38
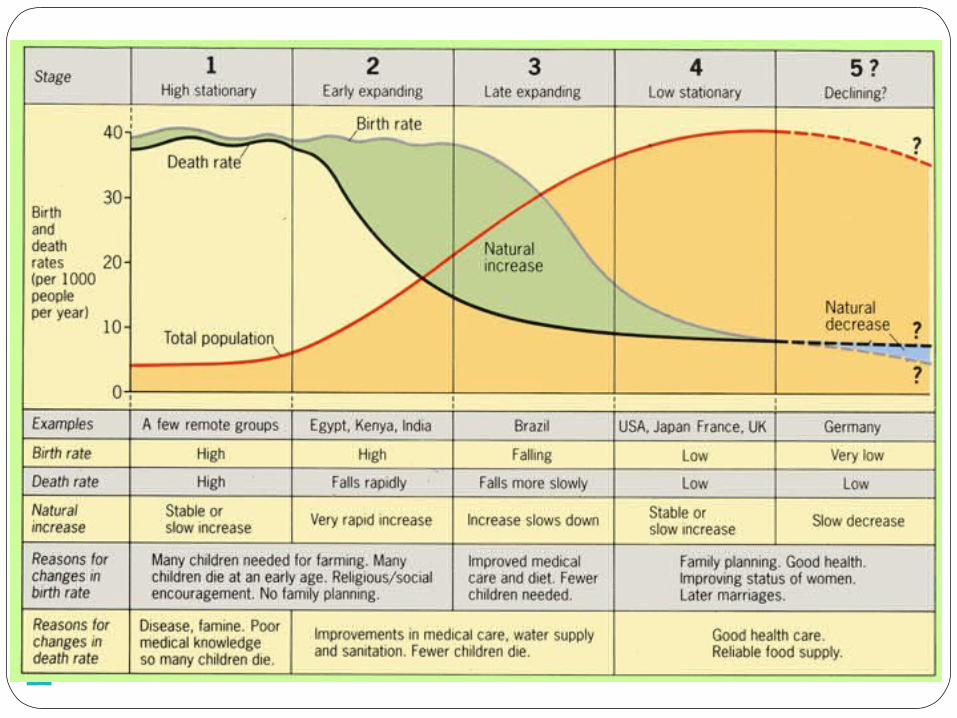
Stage OneHigh Birth RateHigh Death RateResult: slow growth ratesPre-industrial, hunter/gatherer societies
in remote areas.

39
Stage TwoHigh Birth RateLow or Falling Death
RateResult: Rapid Growth
RateVery LOW Standard of
LivingFound In Least
Developed CountriesSouth AmericaSouthern AfricaAsia

40
Stage ThreeModerate to High Birth RateLow Death RateResult: Explosive Growth RatesCauses a large population increase, but
standard of living remains low Developing Countries and the Newly
Industrialized CountriesFound In Countries:
MexicoSoutheast AsiaMiddle East

41
Stage FourLow birth ratesLow death ratesResult: slow or no
growth ratesPopulation slowly
increases, with a high standard of living
Developed CountriesUSACanadaAustralia Europe

42
Stage FiveNegative Birth Rate
NEGATIVE or NO GROWTH
Low Death RateResult: No growth, even
population lossPopulation begins to
shrink, usually has a high standard of living
Found In “Post-Developed” CountriesGermanySwedenNorwayItaly
43
DEMOGRAPHIC TRANSITION MODEL
44
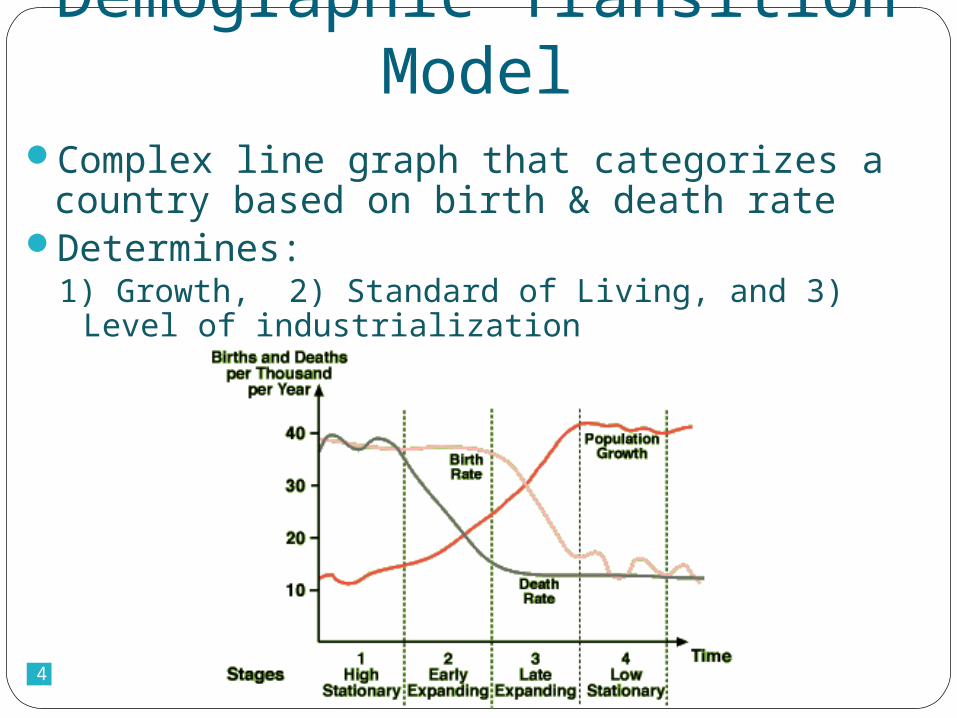
Demographic Transition Model
Complex line graph that categorizes a country based on birth & death rate
Determines:1) Growth, 2) Standard of Living, and 3) Level of
industrialization
45
Demographic Transition Model

• Analyzing Populations
• Warm-Up
– What things would cause people to leave a certain place?
– What factors would cause people to move to a certain place?

Key Understandings• People are not distributed equally on
the earth’s surface• The world’s population continues to
grow, but at different rates in different regions

What is Population Distribution?
• Habitable Lands - 2/3 of population between 20*N and 60*N
• Urban-Rural Mix – ½ of population lives in cities, more each year
• Migration – people moving, causes change in population
• Push Factors – reasons people leave home
• Pull Factors – reasons people come to new home
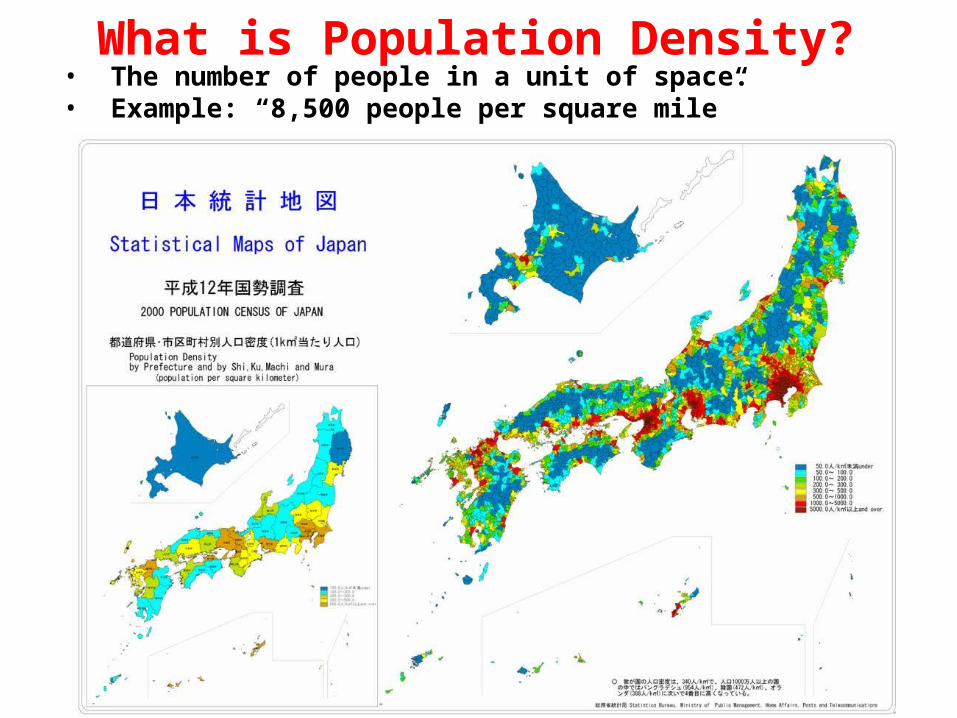
What is Population Density?• The number of people in a unit of space.• Example: “8,500 people per square mile”

How do demographers determine who is
growing?• Birth rates and Death rates, for starters

What are Birth Rates?
• Birth Rate – number of live births per 1000 people
• Fertility Rate – average number of children a woman will have in her lifetime

What are Death Rates?• Death (Mortality) Rate – number of deaths per 1000
people
• Infant Mortality Rate – number of deaths among infants under 1 year old, per 1000 live births

What is Rate of Natural Increase?
Rate of Natural Increase- % a population grows in one year
Birth Rate minus Death Rate =
Rate of Natural Increase

Who is having the kids?
Based on 2006 CIA Estimates
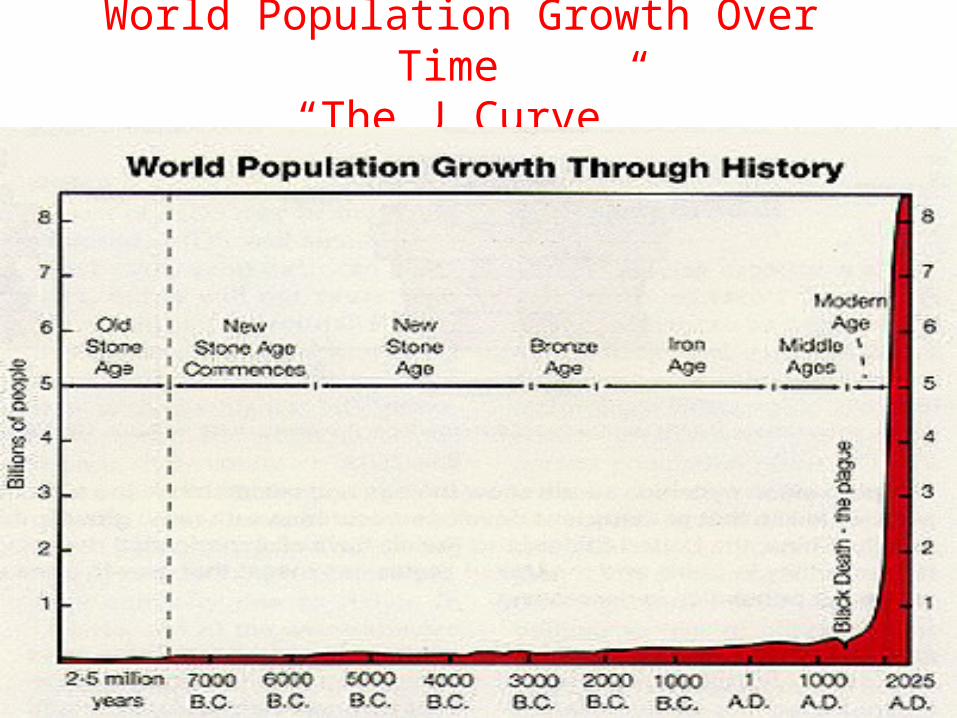
World Population Growth Over Time “The J Curve”

What caused the growth rate to increase?
• Technology- Any invention,
• innovation (new idea) or tool that increases production.

What is over population?• number of people exceeds available
resources
• Carrying capacity – the # of organisms a piece of land can support without negative effects.

Population Pyramids
• Graph that shows the percentage of population in certain age groups
• Separates Male and Female
• Allows you to make predictions

Related Documents