1 The Threat of Uncertainty in Service- Oriented Architecture Yuhui Chen, Anatoliy Gorbenko, Vyacheslav Kharchenko, Alexander Romanovsky, Olga Tarasyuk Newcastle University (UK) National Aerospace University "KhAI“ (Ukraine)

1 The Threat of Uncertainty in Service-Oriented Architecture Yuhui Chen, Anatoliy Gorbenko, Vyacheslav Kharchenko, Alexander Romanovsky, Olga Tarasyuk.
Dec 26, 2015
Welcome message from author
This document is posted to help you gain knowledge. Please leave a comment to let me know what you think about it! Share it to your friends and learn new things together.
Transcript

1
The Threat of Uncertainty
in Service-Oriented Architecture
Yuhui Chen,
Anatoliy Gorbenko, Vyacheslav Kharchenko,
Alexander Romanovsky, Olga Tarasyuk
Newcastle University (UK)
National Aerospace University "KhAI“ (Ukraine)

OBJECTIVE
The objective of the study
is to investigate the uncertainty of response time
and performance of Web Services and instability
of a communication medium (the Internet) as well
as their influence on SOA dependability

OVERVIEW
Setting the Experiments
TCP Workflow Overview
Delay Analysis
Invocation Delay Analysis
PINGing Delay Analysis
Tracing Route Analysis
WS Performance Assessment
Summary

Setting the Experiments
DNA Databank, Japan (DDBJ)
http://xml.nig.ac.jp
Newcastle University, UK
*.ncl.ac.uk
KhAI University, Ukraine*.khai.edu
Fasta WS
Blast WS...
Web Server
Clients
pingping
ping
...Invoke Fasta
Invoke Blast
(every 2 second)
...
(every 10 minutes)
Start time: Jun 04 20:01:24
End time: Jun 09 08:02:51
Total number of invokes: > 650
Total number of pings: > 200000

TCP Workflow Overview
Invoke WS
Get response
Get request
Send response
Request Processing
Time (RPT)
Web Service
RTT
RPT
Round Trip Time
(RTT)
WS Client
RTT
RTT
RTT
Res
pons
e T
ime
(RT
)
RPT RT – 2*RTTRPT - Request Processing TimeRT - Response Time RTT - Round Trip Time

Response Delay Analysis (1)
Invoking FASTA WS from NU
Fasta WS - ResponseTime
900
1100
1300
1500
1700
1900
0 50 100 150 200 250 300 350 400 450 500 550 600 650Invocation No
RT, ms
Time slot 2

Response Delay Analysis (2)
Invoking FASTA WS from NU
Fasta WS - Probability distribution series of RT
0
0.1
0.2
0.3
0.4
0.5
0.6
RT, ms
P 0.3492 0.562 0.0168 0.0107 0.0061 0.0107 0.0046 0.0077 0.0245 0.0031 0.0031 0.0015
<950 1050 1150 1250 1350 1450 1550 1650 1750 1850 1950 >1950

Response Delay Analysis (3)
Invoking BLAST WS from NU
Blast WS - ResponseTime
900
1100
1300
1500
1700
1900
0 50 100 150 200 250 300 350 400 450 500 550 600 650Invocation No
RT, ms
Time slot 2

Response Delay Analysis (4)
Invoking BLAST WS from NU
Blast WS - Probability distribution series of RT
0
0.1
0.2
0.3
0.4
0.5
0.6
RT, ms
P 0.1776 0.5574 0.0123 0.0184 0.0904 0.0444 0.0276 0.0092 0.0444 0.0031 0.0077 0.0077
<950 1050 1150 1250 1350 1450 1550 1650 1750 1850 1950 >1950

Response Delay Analysis (5)
Summary
Invocation response time (RT), ms
Time slot min. max. av. std. dev. Fasta WS
Time slot 1 937 1953 996.91 163.28
Time slot 2 937 4703 1087.28 171.12
Blast WS Time slot 1 1000 1750 1071.17 291.57
Time slot 2 1015 3453 1265.72 572.70
Deviation takes from 15 to 50% (!!!) of average RT

PINGing Delay Analysis (1)
Time Slots
Jun
05 2
3:23
:48
Jun
06 0
2:31
:30
Jun
07 1
7:00
:00
Jun
07 1
7:19
:55
Jun
04 2
0:01
:24
Jun
09 0
8:02
:51
Stable network
Stable network
Stable network
Testing Interval
309ms 309ms 309ms333ms
Time_slot_1 2 1 3 1
PINGing Delay Analysis (2)
Time Slot_1 (network delay is high stable)
PING from Newcastle University (Time_slot_1) - Probability distribution series of RTT
0
0.2
0.4
0.6
0.8
RTT, ms
P 0.855 0.121 0.012 0.005 0.003 0.002 3E-04 5E-04 1E-04 0 0 5E-04
309 310 311 312 313 314 315 316 317 318 319 >319
Total duration was about 105 hours
Number of intermediate hosts was 17

PINGing Delay Analysis (3)
Time Slot_2 (network delay is stable enough)
PING from Newcastle University (Time_slot_2) - Probability distribution series of RTT
0
0.1
0.2
0.3
0.4
0.5
0.6
RTT, ms
P 0.362 0.604 0.023 0.006 0.003 0.002 4E-04 2E-04 9E-05 0 9E-05 2E-04
332 333 334 335 336 337 338 339 340 341 342 >342
The duration was about 3 hours
Number of intermediate hosts was 20

PINGing Delay Analysis (4)
Time Slot_3 (network delay is unstable)
PING from Newcastle University (Time_slot_3) - Probability distribution series of RTT
0
0.1
0.2
0.3
0.4
RTT, ms
P 0.025 0.037 0.061 0.107 0.107 0.265 0.354 0.032 0.005 0.002 0.003 0.003
309 310 311 312 313 314 315 316 317 318 319 >319
The duration was about 20 min
Number of intermediate hosts was 17 (= TimeSlot_1)

PINGing Delay Analysis (5)
PINGing DDBJ host from KhAI
PING - Probability distribution series of RTT
0
0.1
0.2
0.3
0.4
RTT, ms
P 0.395 0.165 0.077 0.08 0.069 0.058 0.04 0.029 0.032 0.021 0.011 0.023
<351 371 391 411 431 451 471 491 511 531 551 >551
The duration was about 2 days
Number of intermediate hosts was 26
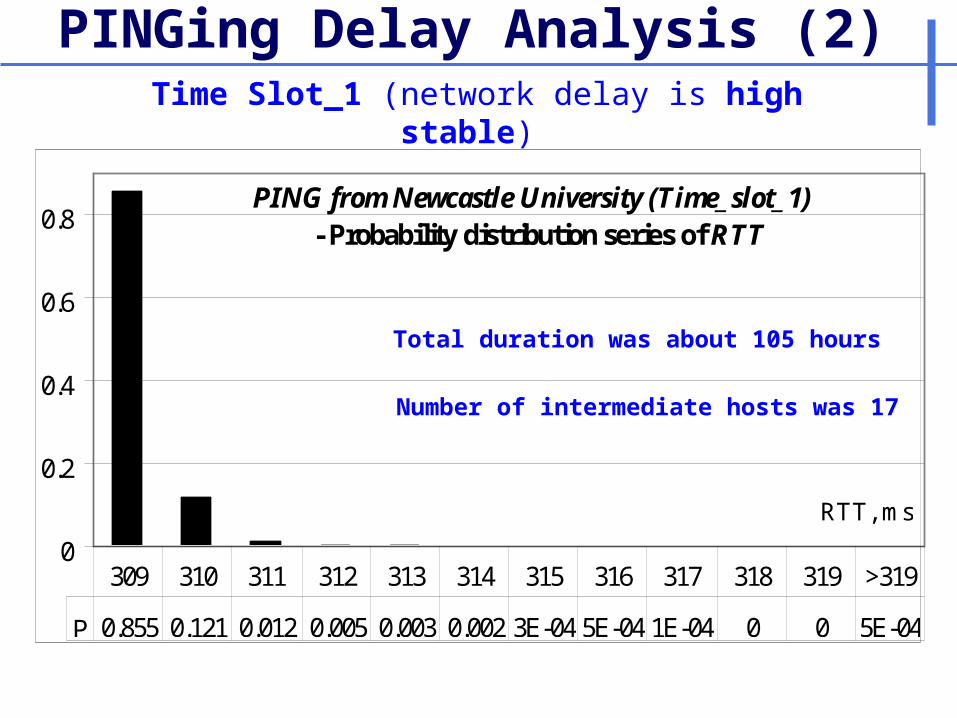
PINGing Delay Analysis (6)
Summary
Ping’s round trip time (RTT), ms
Time slot min. max. av. std. dev. PINGing from Newcastle University’s LAN (UK)
Time slot 1 309 422 309.21 1.40
Time slot 2 332 699 332.72 3.48
Time slot 3 309 735 312.94 12.73
PINGing from KhAI University’s LAN (Kharkiv, Ukraine) - 341 994 396.27 62.14

Tracing Route Analysis
Route length
DNA Databank, Japan (DDBJ)
http://xml.nig.ac.jp
Newcastle University, UK
*.ncl.ac.uk
KhAI University, Ukraine
*.khai.edu
...
...
26 intermediate hosts (routers)
17 routers

TRACERT Delay Analysis (1) Tracing Route from KhAI
min av max std dev IP DNS4 44.22 126 44.43 10.3.128.1 proxy.khai.edu4 31.28 117 36.92 80.249.231.121 121.231.249.80.customer.teleportsv.net4 39.72 155 49.85 217.112.212.69 69.212.112.217.unknown.teleportsv.net4 43.50 175 55.71 80.249.224.55 IPTN-SW02-1.teleportsv.net5 80.39 365 98.49 80.249.224.97 IP-RT00.teleportsv.net15 168.72 436 117.94 80.91.177.85 teleportsv.tr1-v180.ua-kiev.datagroup.ua50 121.17 281 73.27 80.91.160.206 tr1-v454.de-fra.datagroup.ua50 95.06 225 56.13 217.28.250.41 r9-ge-0-0-3-23-Fra-Anct.DE.DataBone.net53 108.75 342 86.13 212.162.25.553 101.17 188 48.78 4.68.118.94 ae-31-53.ebr1.Frankfurt1.Level3.net57 75.00 116 27.53 4.69.132.126 ae-1-100.ebr2.Frankfurt1.Level3.net64 116.94 222 46.98 4.69.132.137 ae-2.ebr1.Dusseldorf1.Level3.net55 79.22 115 18.14 4.69.132.130 ae-1-100.ebr2.Dusseldorf1.Level3.net62 86.56 129 21.84 4.69.133.89 ae-2.ebr1.Amsterdam1.Level3.net63 84.72 155 30.68 4.69.133.86 ae-1-100.ebr2.Amsterdam1.Level3.net
69 114.50 250 57.31 4.69.132.133 ae-2.ebr2.London1.Level3.net
138 158.33 203 18.86 4.69.137.74 ae-43.ebr1.NewYork1.Level3.net137 151.83 210 15.53 4.69.134.74 ae-81-81.csw3.NewYork1.Level3.net137 153.61 196 22.17 4.68.16.142 ae-3-89.edge1.NewYork1.Level3.net140 165.17 333 52.06 4.78.132.18 JAPAN-TELEC.edge1.NewYork1.Level3.net313 327.50 391 20.49 150.99.20357 tokyo1-dc-RM-P-2-3-0-11.sinet.ad.jp323 347.67 445 33.21 150.99.203.26 nagoya-dc-RM-AE-0-11.sinet.ad.jp341 355.67 460 27.69 150.99.197.158 nig-Lan.sinet.ad.jp343 374.00 518 44.77 133.39.27.21 fwb-1.nig.ac.jp341 370.00 458 39.11 133.39.28.1342 374.72 482 41.96 133.39.105.31 oak.genes.nig.ac.jp
Round Trip Time, ms Intermediate host
Min Std DevAv IP DNS-nameMax
4 44.43126 10.3.128.1 proxy.khai.edu44.22

TRACERT Delay Analysis (2)
Tracing Route
DNA Databank, Japan (DDBJ)
http://xml.nig.ac.jp
Newcastle University, UK
*.ncl.ac.uk
KhAI University, Kharkiv, Ukraine
*.khai.edu
Frankfurt
Dusseldorf
Amsterdam
London
New-York
TokioNagoya
Kiev
Ukraine
Germany
Holand
UK
USA
Japan
Unstable Network High-Stable Network
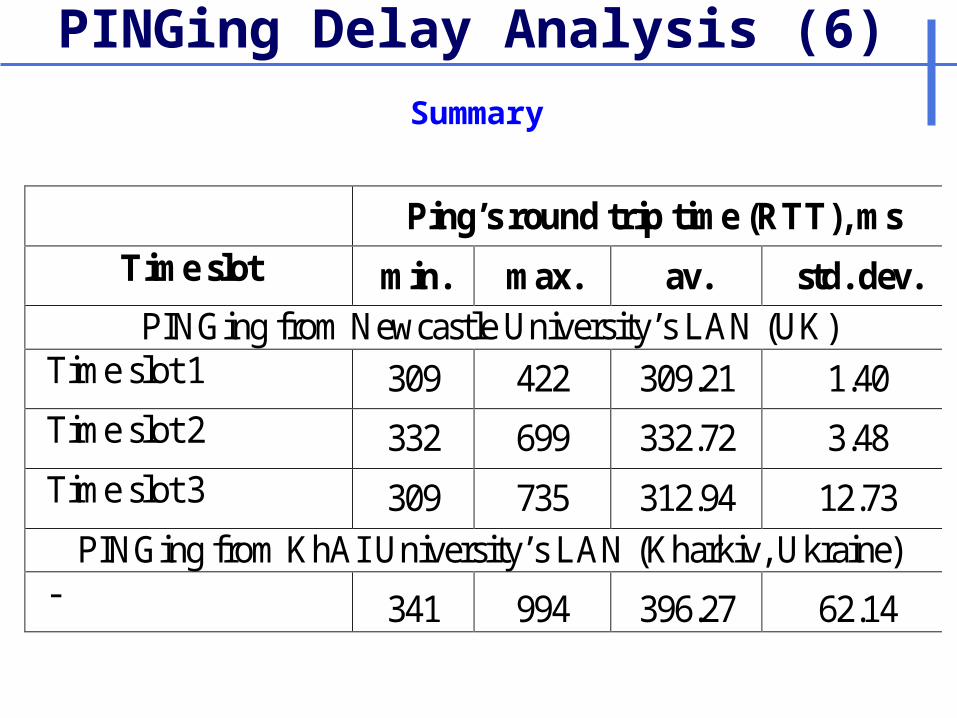
TRACERT Delay Analysis (3)
London
New-Y ork
Tokio
K harkivFrankfurt
Newcastle
Tracing Route
Peking
Moscow

WS Performance Assessment
Approximate estimation of Web Service’s Request Processing Time (RPT) taking of
networks delay
RPT RT – 2*RTTRPT - Request Processing TimeRT - Response Time (Invocation)RTT - Round Trip Time (Ping)
Fasta WS Blast WS
Time_Slot_1 319 319.00
Time_Slot_2 336 351.00
divergence, % 5.06 9.12
Minimal RPT, ms

Summary
Deviation of Response Time (RT) takes from 15 to 50% (!!!) of average one for Fasta and Blast WSs
It is noteworthy that even in spite of sufficiently stable network delay during Time_slot_1 and Time_slot_2 a response time of the Fasta and, especially, Blast WSs has significant instability that can be explained only by internal reasons or unstable WS loading.
6.3% (Blast) and 4% (Fasta) of the requests had the response time 1.5 times greater than the average one, and for several responses it took even 5 times greater. These cases would potentially cause timing errors
Network brings additional uncertainty into response time
Discussion
Network instability significantly depends on the QoS of a local Internet Service Provider (ISP) and network route.
Occasional transient and long-term Internet congestions, packet losses and network route changes that are difficult-to-predict also reduce stability of SOS operation.

Solutions
Uncertainty existing in SOA should be treated as a threat to dependability (similar and in addition to the faults, errors and failures).
This issue will require developing new resilience-explicit techniques and end-to-end QoS mechanisms.
Good measurement of uncertainty is important
but this is only the beginning.

Solutions
The future solutions will need to deal with a number of issues such as uncertainty of fault assumptions, uncertainty of components behaviour and dependability, uncertainty of error detection, etc.
One of the possible solutions for resisting the uncertainty is to use service and path redundancy and diversity inherent to SOA.
The traditional adaptive techniques based on the control feedback will not be directly applicable in the current form as they are intended for predictable behaviour.
Related Documents