1 The Potential Impacts of a Shrinking State Budget VACO Finance Steering Committee Updated August 19, 2009

1 The Potential Impacts of a Shrinking State Budget VACO Finance Steering Committee Updated August 19, 2009.
Dec 16, 2015
Welcome message from author
This document is posted to help you gain knowledge. Please leave a comment to let me know what you think about it! Share it to your friends and learn new things together.
Transcript
1
The Potential Impacts of a Shrinking State Budget
VACO Finance Steering Committee
Updated August 19, 2009
2
State Budget Summary• Governor announced $300 mil. FY09 GF revenue shortfall and expected
additional $1.2 billion FY10 GF shortfall, with only $287 mil. in Rainy Day funds available to cushion reduction. Governor will announce FY10 state budget cuts by Labor Day using executive authority.
• Reduced federal stimulus in FY11 (and expiring after) and a weak economic recovery will result in even tougher 2010-12 state budget.
- $1,304 mil. ARRA for FY10; $811 mil. ARRA for FY11.*
• Despite recent federal match rate increase, Medicaid and other HHS cost pressures continue, putting additional strain on the state budget.
• Because of falling real estate and car values, and reduced sales and business taxes and fees, it will be difficult for localities to continue backfilling declining state support.
• Major policy changes will be required to align funding levels with revenues, unless state and/or local taxes are raised significantly.
- Even with little re-benchmarking increases, K-12 funding policies will most likely be modified.
* Includes state appropriated ARRA that effectively supplants GF
3
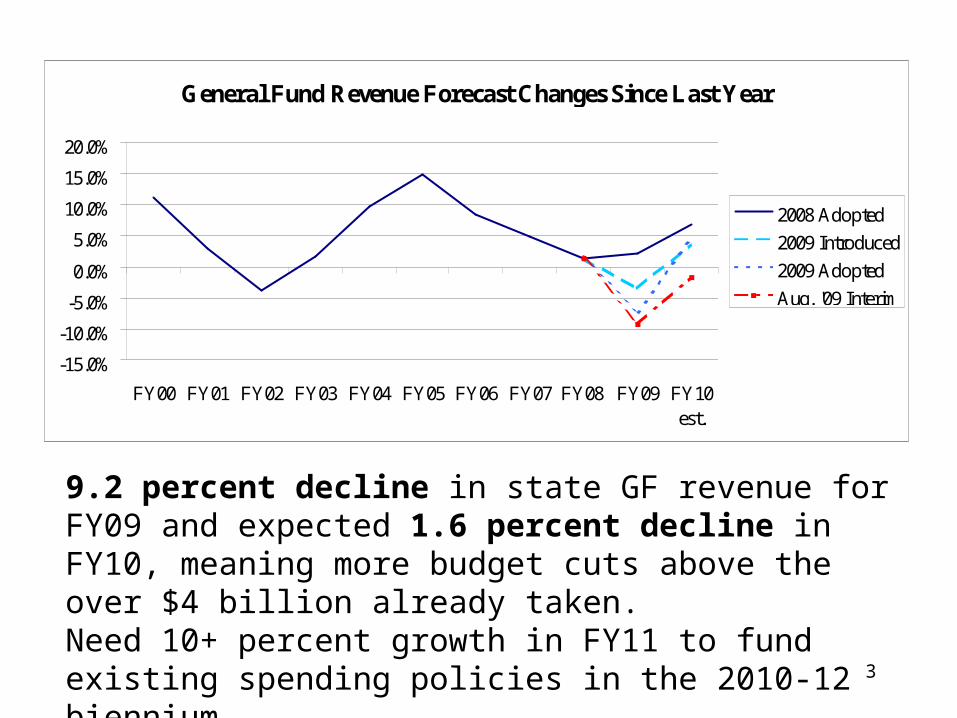
9.2 percent decline in state GF revenue for FY09 and expected 1.6 percent decline in FY10, meaning more budget cuts above the over $4 billion already taken.Need 10+ percent growth in FY11 to fund existing spending policies in the 2010-12 biennium.
General Fund Revenue Forecast Changes Since Last Year
-15.0%
-10.0%
-5.0%
0.0%
5.0%
10.0%
15.0%
20.0%
FY00 FY01 FY02 FY03 FY04 FY05 FY06 FY07 FY08 FY09 FY10est.
2008 Adopted
2009 Introduced
2009 Adopted
Aug. '09 Interim
4
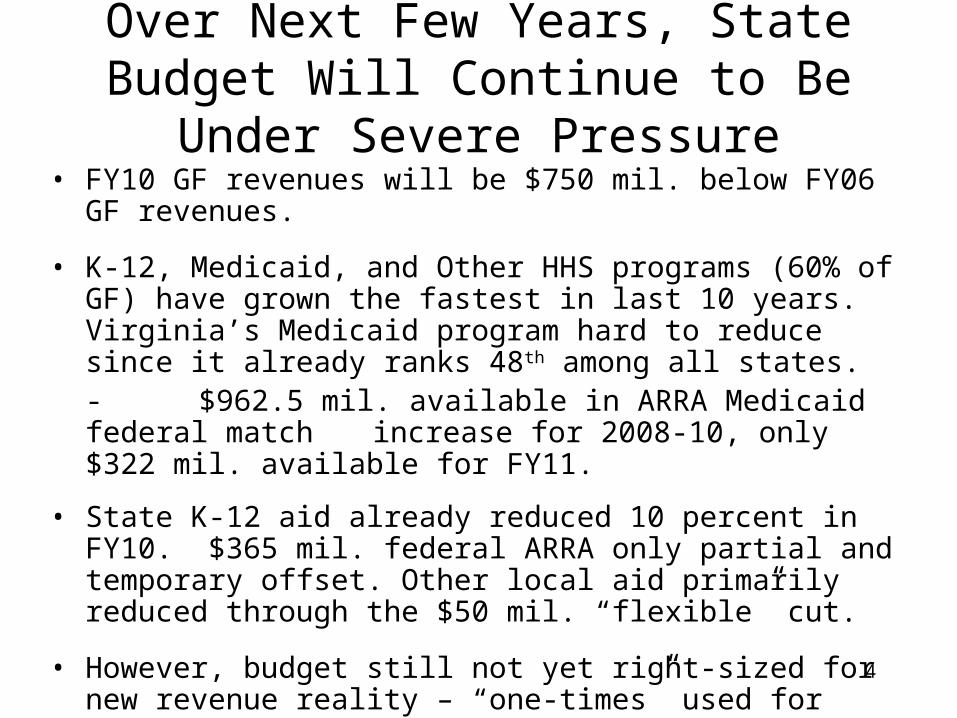
Over Next Few Years, State Budget Will Continue to Be Under Severe Pressure
• FY10 GF revenues will be $750 mil. below FY06 GF revenues.
• K-12, Medicaid, and Other HHS programs (60% of GF) have grown the fastest in last 10 years. Virginia’s Medicaid program hard to reduce since it already ranks 48th among all states.- $962.5 mil. available in ARRA Medicaid federal match increase for 2008-10, only $322 mil. available for FY11.
• State K-12 aid already reduced 10 percent in FY10. $365 mil. federal ARRA only partial and temporary offset. Other local aid primarily reduced through the $50 mil. “flexible” cut.
• However, budget still not yet right-sized for new revenue reality – “one-times” used for half of 2008-10 budget balancing.
• Transportation program also shrinking rapidly and big concern.
5
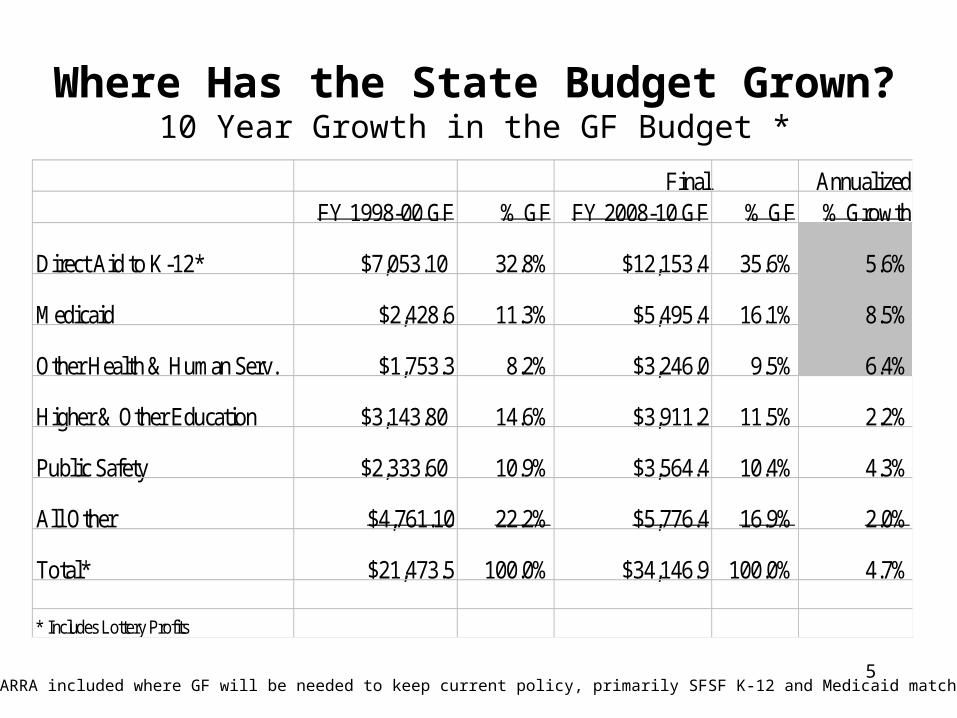
Where Has the State Budget Grown? 10 Year Growth in the GF Budget *
Final AnnualizedFY 1998-00 GF % GF FY 2008-10 GF % GF % Growth
Direct Aid to K-12* $7,053.10 32.8% $12,153.4 35.6% 5.6%
Medicaid $2,428.6 11.3% $5,495.4 16.1% 8.5%
Other Health & Human Serv. $1,753.3 8.2% $3,246.0 9.5% 6.4%
Higher & Other Education $3,143.80 14.6% $3,911.2 11.5% 2.2%
Public Safety $2,333.60 10.9% $3,564.4 10.4% 4.3%
All Other $4,761.10 22.2% $5,776.4 16.9% 2.0%
Total* $21,473.5 100.0% $34,146.9 100.0% 4.7%
* Includes Lottery Profits
* Appropriated ARRA included where GF will be needed to keep current policy, primarily SFSF K-12 and Medicaid match increase
6
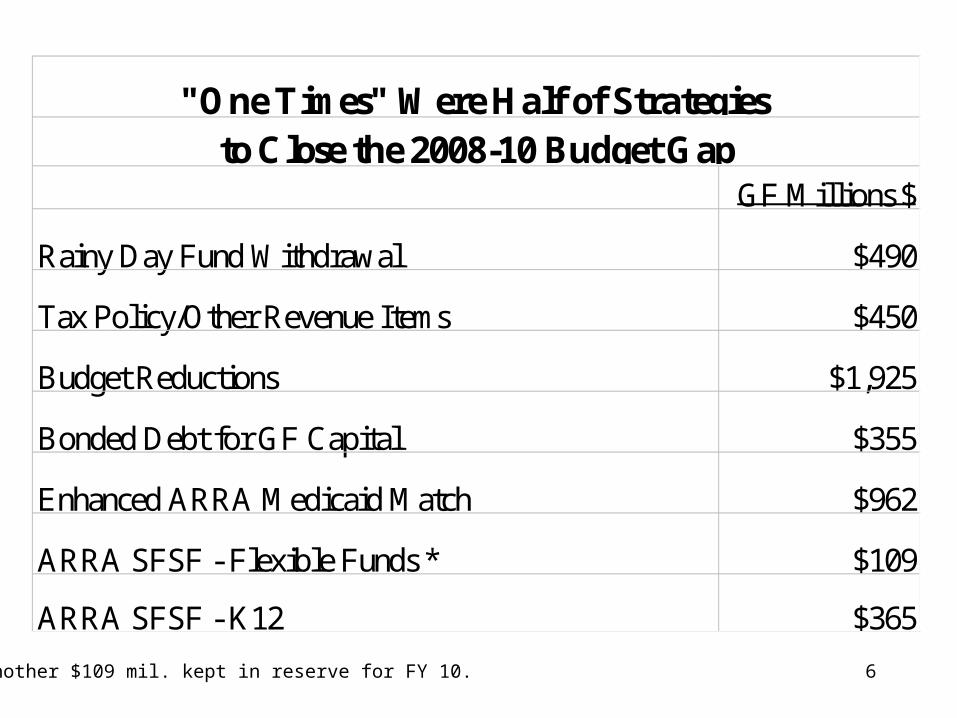
GF Millions $
Rainy Day Fund Withdrawal $490
Tax Policy/Other Revenue Items $450
Budget Reductions $1,925
Bonded Debt for GF Capital $355
Enhanced ARRA Medicaid Match $962
ARRA SFSF - Flexible Funds * $109
ARRA SFSF - K12 $365
"One Times" Were Half of Strategies to Close the 2008-10 Budget Gap
* Another $109 mil. kept in reserve for FY 10.
7
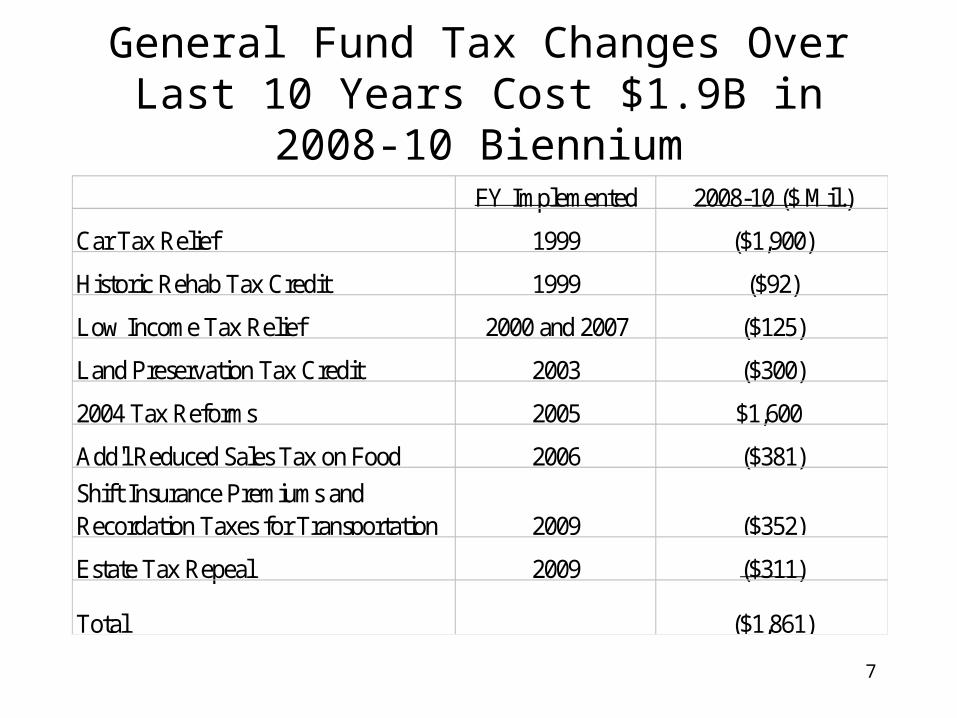
General Fund Tax Changes Over Last 10 Years Cost $1.9B in 2008-10 Biennium
FY Implemented 2008-10 ($ Mil.)
Car Tax Relief 1999 ($1,900)
Historic Rehab Tax Credit 1999 ($92)
Low Income Tax Relief 2000 and 2007 ($125)
Land Preservation Tax Credit 2003 ($300)
2004 Tax Reforms 2005 $1,600
Add'l Reduced Sales Tax on Food 2006 ($381)
Shift Insurance Premiums and Recordation Taxes for Transportation 2009 ($352)
Estate Tax Repeal 2009 ($311)
Total ($1,861)
8
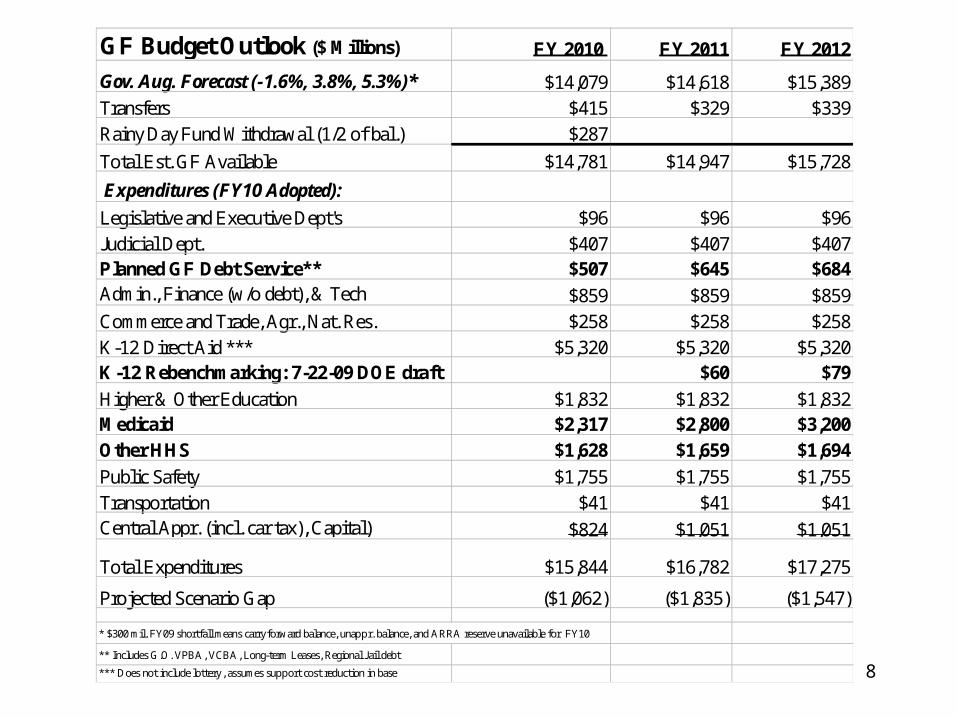
GF Budget Outlook ($ Millions) FY 2010 FY 2011 FY 2012
Gov. Aug. Forecast (-1.6%, 3.8%, 5.3%)* $14,079 $14,618 $15,389Transfers $415 $329 $339Rainy Day Fund Withdrawal (1/2 of bal.) $287
Total Est. GF Available $14,781 $14,947 $15,728
Expenditures (FY10 Adopted):
Legislative and Executive Dept's $96 $96 $96Judicial Dept. $407 $407 $407Planned GF Debt Service** $507 $645 $684Admin., Finance (w/o debt), & Tech $859 $859 $859Commerce and Trade, Agr., Nat. Res. $258 $258 $258K-12 Direct Aid *** $5,320 $5,320 $5,320K-12 Rebenchmarking: 7-22-09 DOE draft $60 $79
Higher & Other Education $1,832 $1,832 $1,832Medicaid $2,317 $2,800 $3,200Other HHS $1,628 $1,659 $1,694
Public Safety $1,755 $1,755 $1,755Transportation $41 $41 $41Central Appr. (incl. car tax), Capital) $824 $1,051 $1,051
Total Expenditures $15,844 $16,782 $17,275
Projected Scenario Gap ($1,062) ($1,835) ($1,547)
* $300 mil. FY09 shortfall means carryforward balance, unappr. balance, and ARRA reserve unavailable for FY10
** Includes G.O. VPBA, VCBA, Long-term Leases, Regional Jail debt
*** Does not include lottery, assumes support cost reduction in base
9
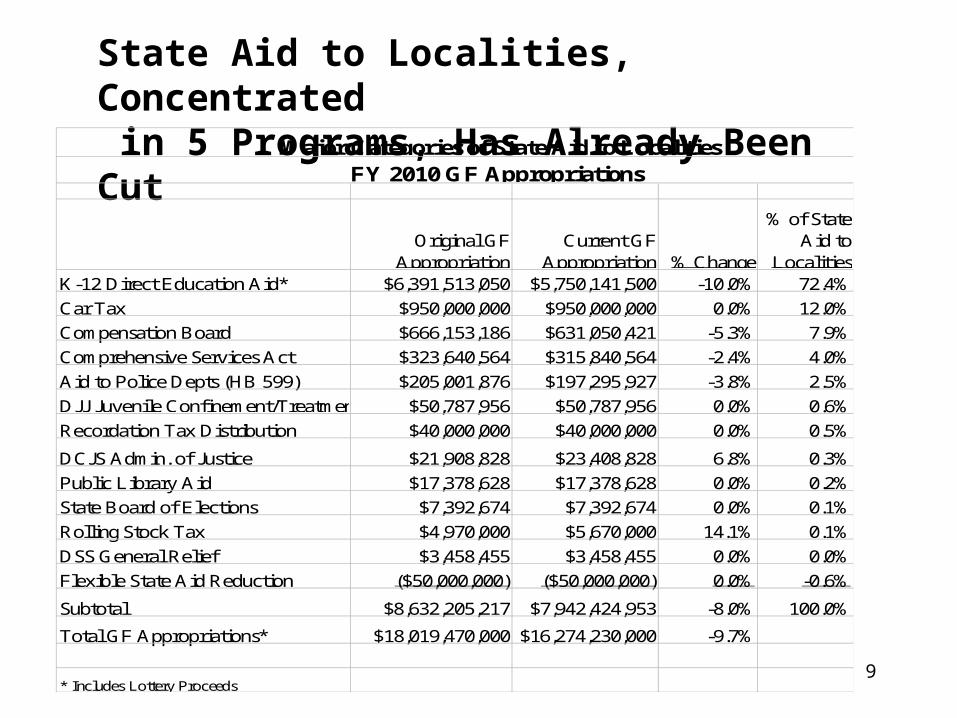
State Aid to Localities, Concentrated in 5 Programs, Has Already Been Cut
Original GF Appropriation
Current GF Appropriation % Change
% of State Aid to
LocalitiesK-12 Direct Education Aid* $6,391,513,050 $5,750,141,500 -10.0% 72.4%
Car Tax $950,000,000 $950,000,000 0.0% 12.0%
Compensation Board $666,153,186 $631,050,421 -5.3% 7.9%
Comprehensive Services Act $323,640,564 $315,840,564 -2.4% 4.0%
Aid to Police Depts (HB 599) $205,001,876 $197,295,927 -3.8% 2.5%
DJJ Juvenile Confinement/Treatment $50,787,956 $50,787,956 0.0% 0.6%
Recordation Tax Distribution $40,000,000 $40,000,000 0.0% 0.5%
DCJS Admin. of Justice $21,908,828 $23,408,828 6.8% 0.3%
Public Library Aid $17,378,628 $17,378,628 0.0% 0.2%
State Board of Elections $7,392,674 $7,392,674 0.0% 0.1%
Rolling Stock Tax $4,970,000 $5,670,000 14.1% 0.1%
DSS General Relief $3,458,455 $3,458,455 0.0% 0.0%
Flexible State Aid Reduction ($50,000,000) ($50,000,000) 0.0% -0.6%
Subtotal $8,632,205,217 $7,942,424,953 -8.0% 100.0%
Total GF Appropriations* $18,019,470,000 $16,274,230,000 -9.7%
* Includes Lottery Proceeds
Major Categories of State Aid to LocalitiesFY 2010 GF Appropriations
10
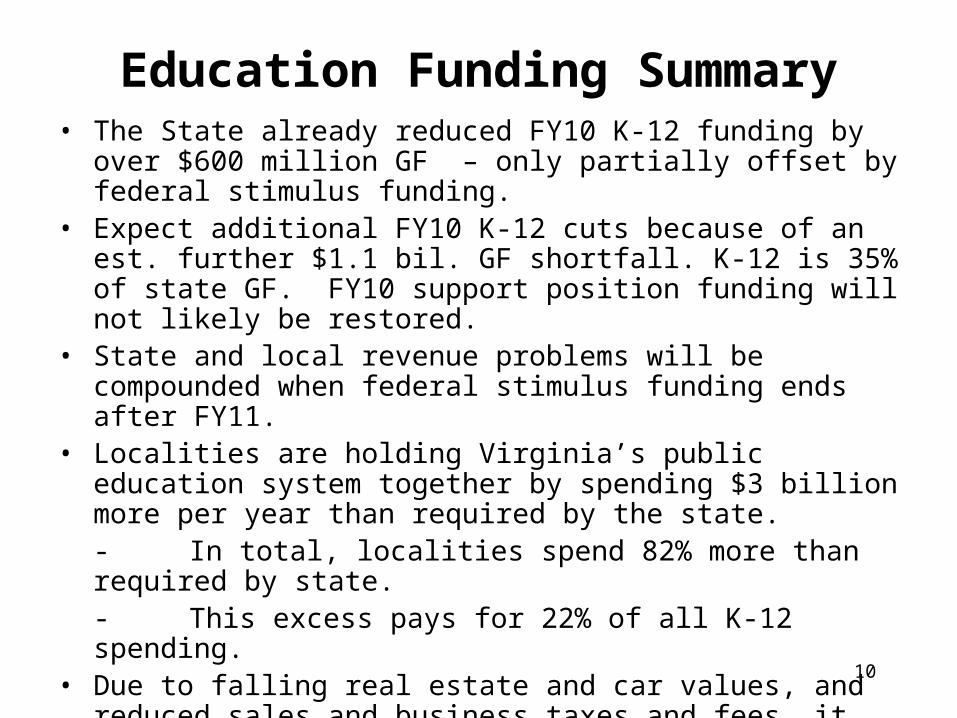
Education Funding Summary• The State already reduced FY10 K-12 funding by over $600 million
GF – only partially offset by federal stimulus funding.• Expect additional FY10 K-12 cuts because of an est. further $1.1 bil.
GF shortfall. K-12 is 35% of state GF. FY10 support position funding will not likely be restored.
• State and local revenue problems will be compounded when federal stimulus funding ends after FY11.
• Localities are holding Virginia’s public education system together by spending $3 billion more per year than required by the state. - In total, localities spend 82% more than required by state.- This excess pays for 22% of all K-12 spending.
• Due to falling real estate and car values, and reduced sales and business taxes and fees, it will be difficult for localities to continue backfilling declining state support.
• Even with only minimal preliminary rebenchmarking costs ($138 mil.), major policy changes will be required to align funding levels with revenues, unless state and/or local taxes are significantly raised.
11
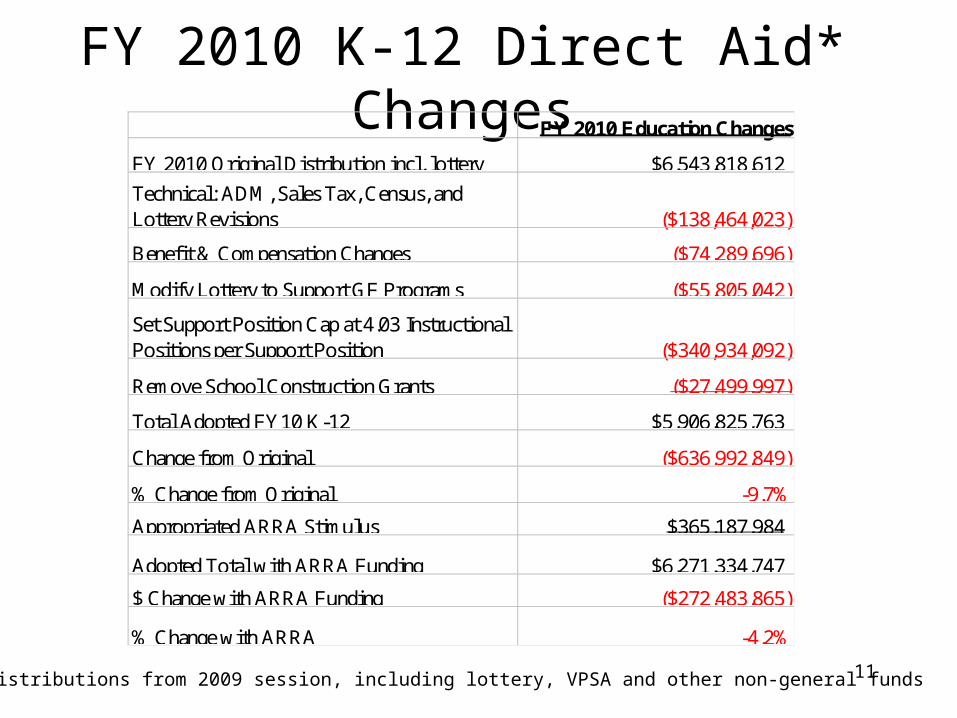
FY 2010 K-12 Direct Aid* ChangesFY 2010 Education Changes
FY 2010 Original Distribution incl. lottery $6,543,818,612
Technical: ADM, Sales Tax, Census, and Lottery Revisions ($138,464,023)
Benefit & Compensation Changes ($74,289,696)
Modify Lottery to Support GF Programs ($55,805,042)
Set Support Position Cap at 4.03 Instructional Positions per Support Position ($340,934,092)
Remove School Construction Grants ($27,499,997)
Total Adopted FY10 K-12 $5,906,825,763
Change from Original ($636,992,849)
% Change from Original -9.7%
Appropriated ARRA Stimulus $365,187,984
Adopted Total with ARRA Funding $6,271,334,747
$ Change with ARRA Funding ($272,483,865)
% Change with ARRA -4.2%
*DOE distributions from 2009 session, including lottery, VPSA and other non-general funds
12
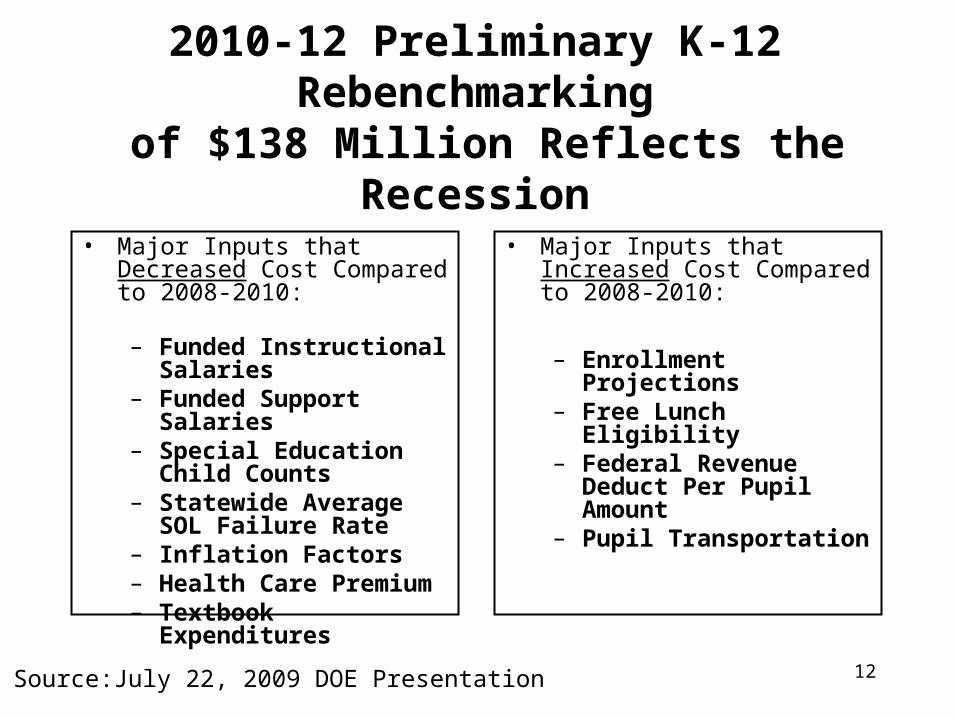
2010-12 Preliminary K-12 Rebenchmarking of $138 Million Reflects the Recession
• Major Inputs that Increased Cost Compared to 2008-2010:
– Enrollment Projections– Free Lunch Eligibility– Federal Revenue Deduct
Per Pupil Amount– Pupil Transportation
• Major Inputs that Increased Cost Compared to 2008-2010:
– Enrollment Projections– Free Lunch Eligibility– Federal Revenue Deduct
Per Pupil Amount– Pupil Transportation
• Major Inputs that Decreased Cost Compared to 2008-2010:
– Funded Instructional Salaries
– Funded Support Salaries– Special Education Child
Counts– Statewide Average SOL
Failure Rate– Inflation Factors– Health Care Premium– Textbook Expenditures
• Major Inputs that Decreased Cost Compared to 2008-2010:
– Funded Instructional Salaries
– Funded Support Salaries– Special Education Child
Counts– Statewide Average SOL
Failure Rate– Inflation Factors– Health Care Premium– Textbook Expenditures
Source:July 22, 2009 DOE Presentation
13
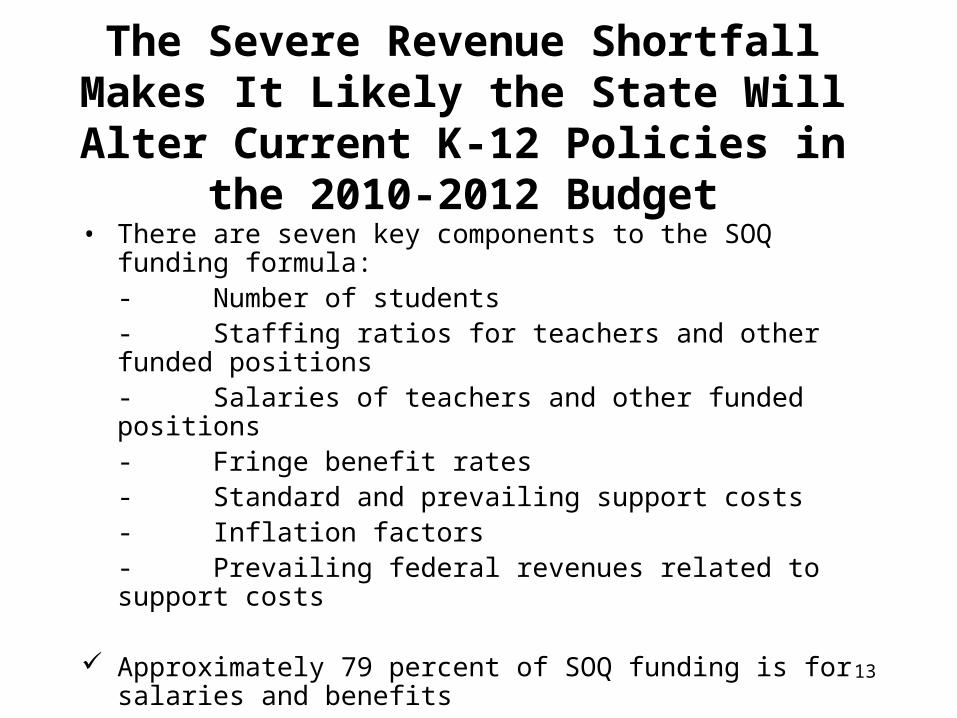
The Severe Revenue Shortfall Makes It Likely the State Will Alter Current K-12
Policies in the 2010-2012 Budget• There are seven key components to the SOQ funding formula:
- Number of students- Staffing ratios for teachers and other funded positions- Salaries of teachers and other funded positions- Fringe benefit rates- Standard and prevailing support costs- Inflation factors- Prevailing federal revenues related to support costs
Approximately 79 percent of SOQ funding is for salaries and benefits
FY10 budget already reduced support cost funding by $341 mil. per year
14
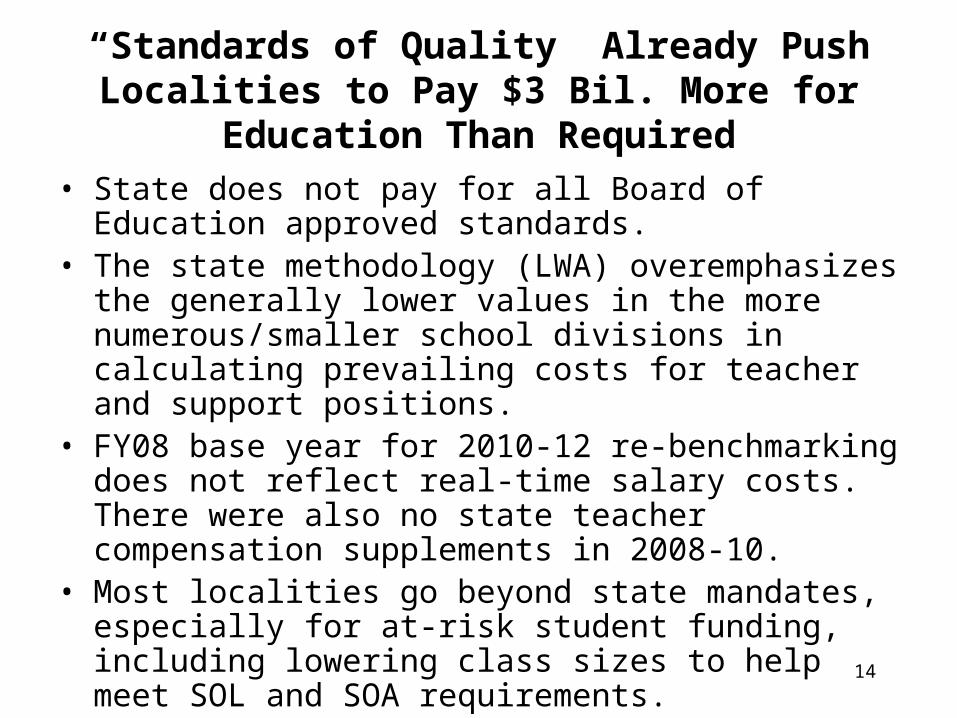
“Standards of Quality” Already Push Localities to Pay $3 Bil. More for Education Than Required
• State does not pay for all Board of Education approved standards.
• The state methodology (LWA) overemphasizes the generally lower values in the more numerous/smaller school divisions in calculating prevailing costs for teacher and support positions.
• FY08 base year for 2010-12 re-benchmarking does not reflect real-time salary costs. There were also no state teacher compensation supplements in 2008-10.
• Most localities go beyond state mandates, especially for at-risk student funding, including lowering class sizes to help meet SOL and SOA requirements.
• Expect the new state support position cap to increase local overfunding.
15
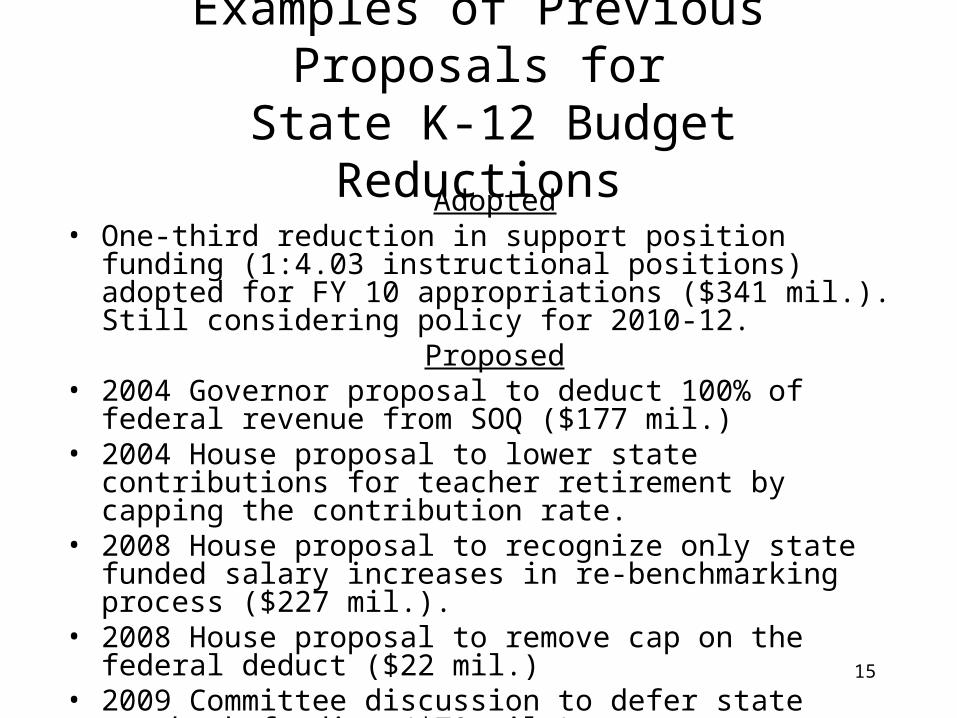
Examples of Previous Proposals for State K-12 Budget Reductions
Adopted• One-third reduction in support position funding (1:4.03 instructional
positions) adopted for FY 10 appropriations ($341 mil.). Still considering policy for 2010-12.
Proposed• 2004 Governor proposal to deduct 100% of federal revenue from
SOQ ($177 mil.) • 2004 House proposal to lower state contributions for teacher
retirement by capping the contribution rate.• 2008 House proposal to recognize only state funded salary increases
in re-benchmarking process ($227 mil.). • 2008 House proposal to remove cap on the federal deduct ($22 mil.)• 2009 Committee discussion to defer state textbook funding ($79 mil.)• 2009 Governor’s proposal to supplant remaining additional lottery
support for school construction and operating costs ($61 mil.)
16
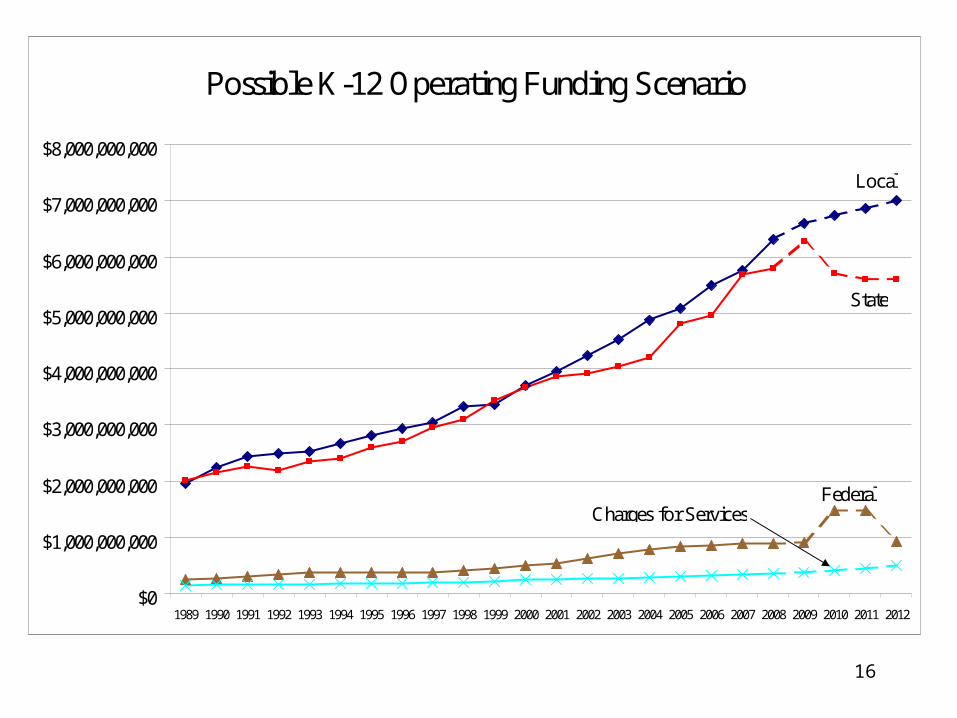
Possible K-12 Operating Funding Scenario
$0
$1,000,000,000
$2,000,000,000
$3,000,000,000
$4,000,000,000
$5,000,000,000
$6,000,000,000
$7,000,000,000
$8,000,000,000
1989 1990 1991 1992 1993 1994 1995 1996 1997 1998 1999 2000 2001 2002 2003 2004 2005 2006 2007 2008 2009 2010 2011 2012
State
Local
FederalCharges for Services
17
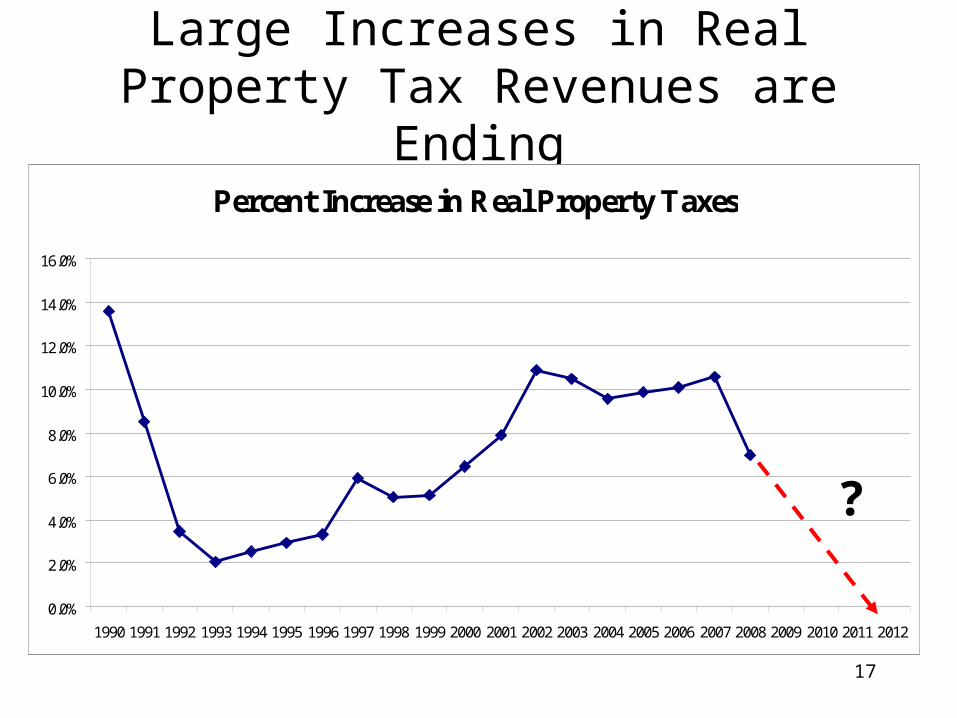
Large Increases in Real Property Tax Revenues are Ending
Percent Increase in Real Property Taxes
0.0%
2.0%
4.0%
6.0%
8.0%
10.0%
12.0%
14.0%
16.0%
1990 1991 1992 1993 1994 1995 1996 1997 1998 1999 2000 2001 2002 2003 2004 2005 2006 2007 2008 2009 2010 2011 2012
?
18
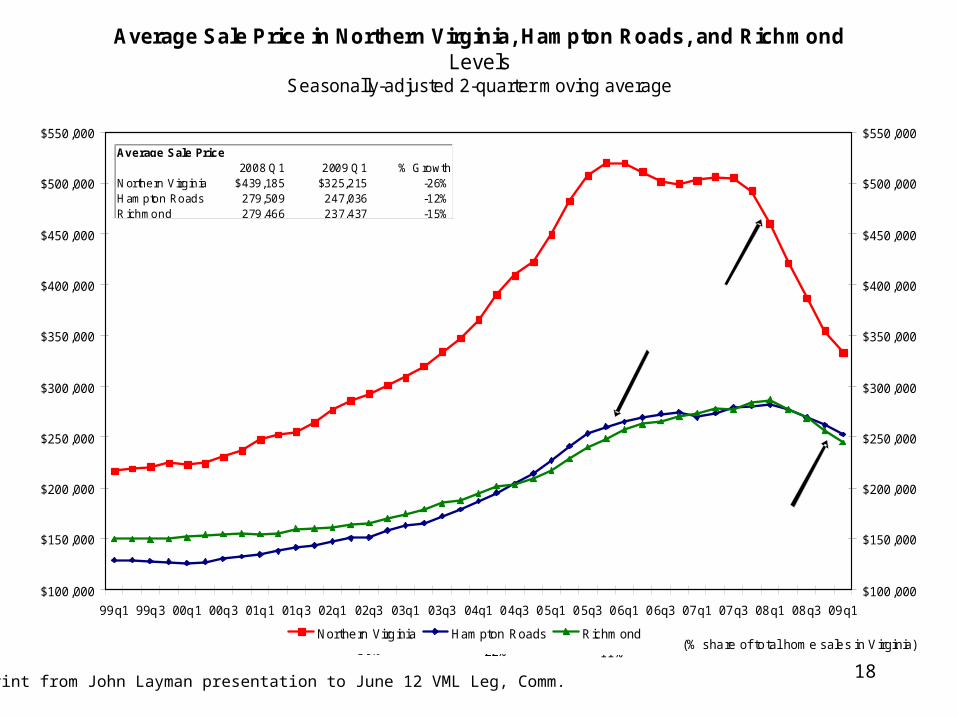
Average Sale Price in Northern Virginia, Hampton Roads, and RichmondLevels
Seasonally-adjusted 2-quarter moving average
$100,000
$150,000
$200,000
$250,000
$300,000
$350,000
$400,000
$450,000
$500,000
$550,000
99q1 99q3 00q1 00q3 01q1 01q3 02q1 02q3 03q1 03q3 04q1 04q3 05q1 05q3 06q1 06q3 07q1 07q3 08q1 08q3 09q1
$100,000
$150,000
$200,000
$250,000
$300,000
$350,000
$400,000
$450,000
$500,000
$550,000
Northern Virg inia Hampton Roads Richmond39% 22% 11%
Northern Virginia
Ham pton Roads
Richm ond
(% share of to tal home sales in V irginia)
Average Sale Price2008 Q1 2009 Q1 % Growth
Northern Virginia $439,185 $325,215 -26%Hampton Roads 279,509 247,036 -12%Richmond 279,466 237,437 -15%
Reprint from John Layman presentation to June 12 VML Leg, Comm.
19
Shrinking Transportation Program
• In June, the CTB approved a budget and new six-year improvement program for 2010-2015 that:
– Had $3.2 billion less for highway construction than the 2008-2013 program
– 20% less transit operating support than the 2008-2013 program
• On August 19, the Governor announced an additional $900 million six-year reduction in transportation revenues.
20
Major Policy Changes Proposed for FY09 - FY15 Six-Year VDOT Program
• Construction program primarily a federal match program and largely eliminates state formula distributions for unpaved roads, primary, secondary and urban systems.
• Adequate secondary road maintenance funding no longer available if all federal funds are to be matched.
• Surface Transportation Program federal formula funding will no longer be distributed by locality starting in FY11. CTB will do the programming.
• State can support no more than $2 billion in debt - unable to issue all $3 billion in bonds authorized in 2007.
Related Documents