1 The Askøy bridge A before and after study

Welcome message from author
This document is posted to help you gain knowledge. Please leave a comment to let me know what you think about it! Share it to your friends and learn new things together.
Transcript

1
The Askøy bridge
A before and after study

2
Motive:
Test a transport model Frequently used model, test assumptions in the transport model Describe challenges of ferry modeling What kind of effects (general, because of the bridge) are captured
by the model
3
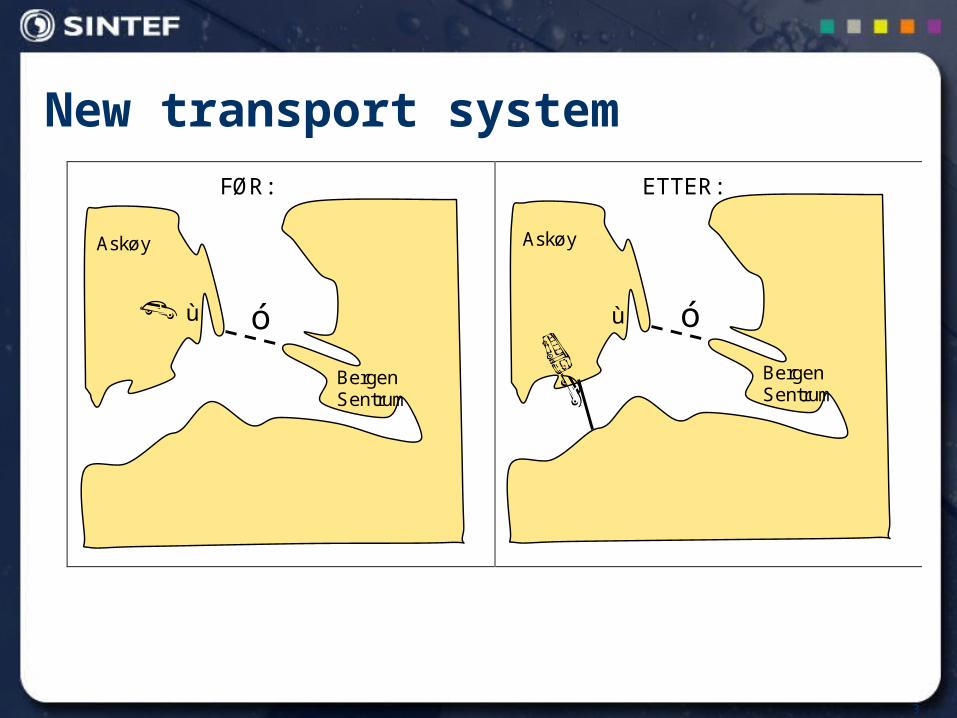
New transport system
FØR:
ETTER:
Askøy
Bergen Sentrum
ù
Askøy
Bergen Sentrum
ù ó ó
4
Three travel surveys
1992 Bergen 1993 only on Askøy 2000 Bergen
Correspond well to the project, the Askøy bridge opened dec. 1992.

5
Model
TASS 5 design –the newest at the time of this study Model area as in an earlier model Bigger zones Three scenarioes TM92, TM93 and TM2k Zonal data for TM92 and TM93 from 1990 and for TM2k
2000 (from TASS 5) Road network from older models Not parking, few crossings coded
6
Result themes
Trip production Travel (OD-) pattern Mode choice Traffic flows
7
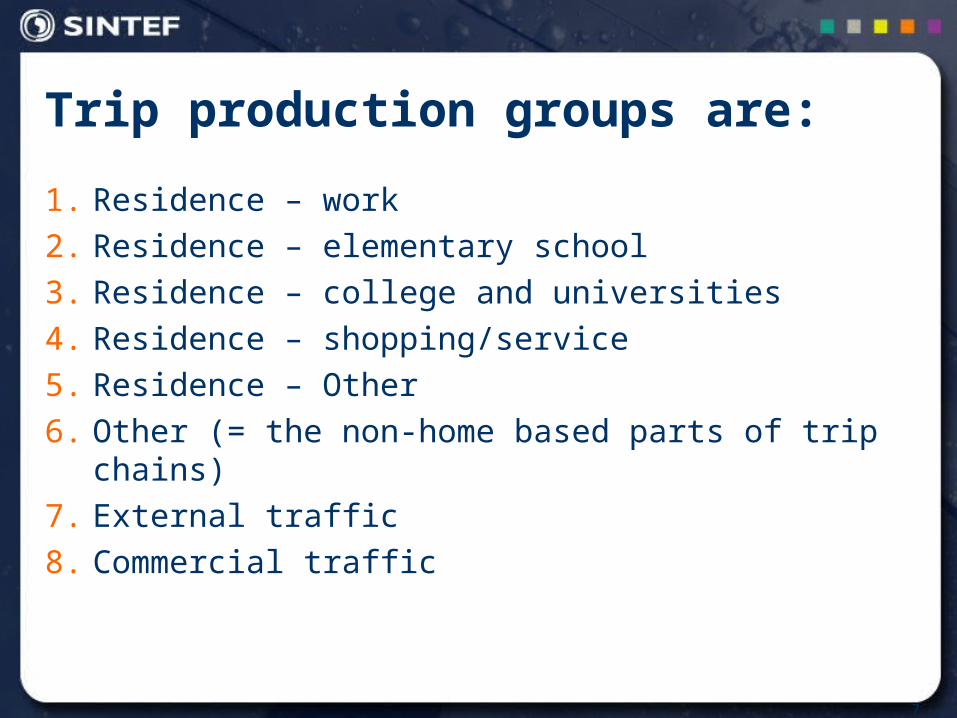
Trip production groups are:
1. Residence – work
2. Residence – elementary school
3. Residence – college and universities
4. Residence – shopping/service
5. Residence – Other
6. Other (= the non-home based parts of trip chains)
7. External traffic
8. Commercial traffic
8
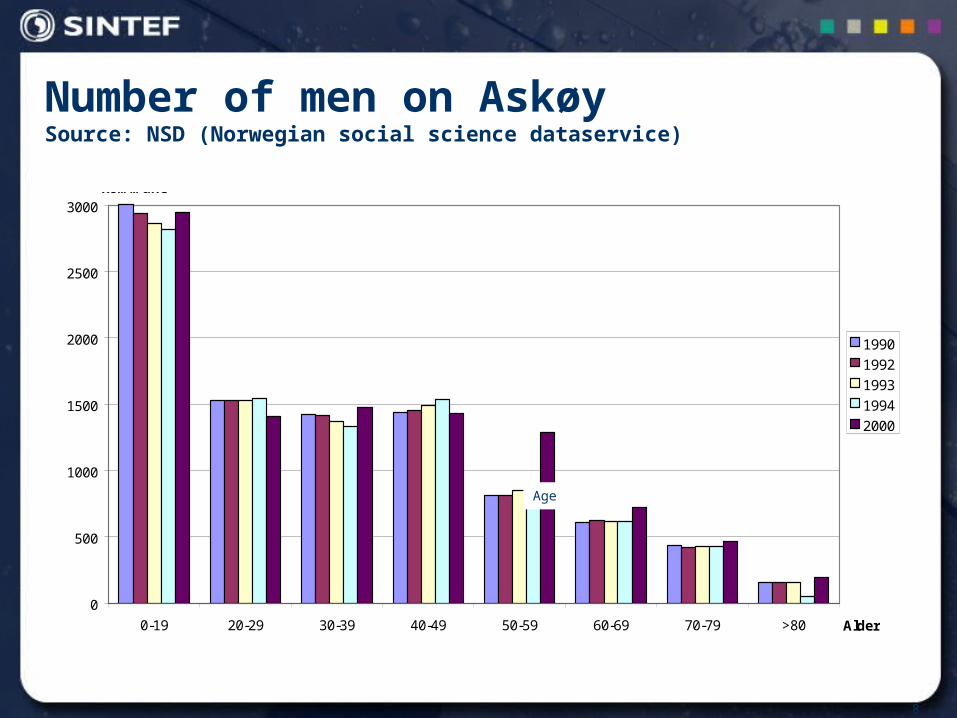
Number of men on AskøySource: NSD (Norwegian social science dataservice)
0
500
1000
1500
2000
2500
3000
0-19 20-29 30-39 40-49 50-59 60-69 70-79 >80 Alder
Antall menn i Askøy kommune
1990
1992
1993
1994
2000
Age

9
Number of women in Askøy Source: NSD (Norwegian social science dataservice)
0
500
1000
1500
2000
2500
3000
0-19 20-29 30-39 40-49 50-59 60-69 70-79 >80 Alder
Antall kvinner i Askøy kommune
1990
1992
1993
1994
2000
10
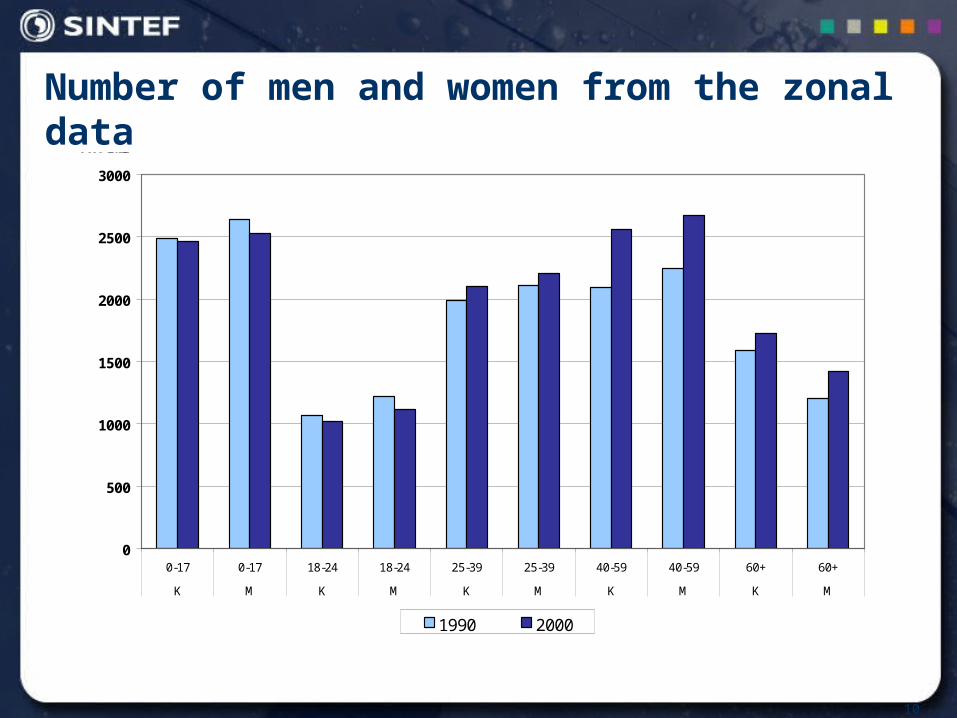
Number of men and women from the zonal data
0
500
1000
1500
2000
2500
3000
0-17 0-17 18-24 18-24 25-39 25-39 40-59 40-59 60+ 60+
K M K M K M K M K M
Antall
1990 2000
11
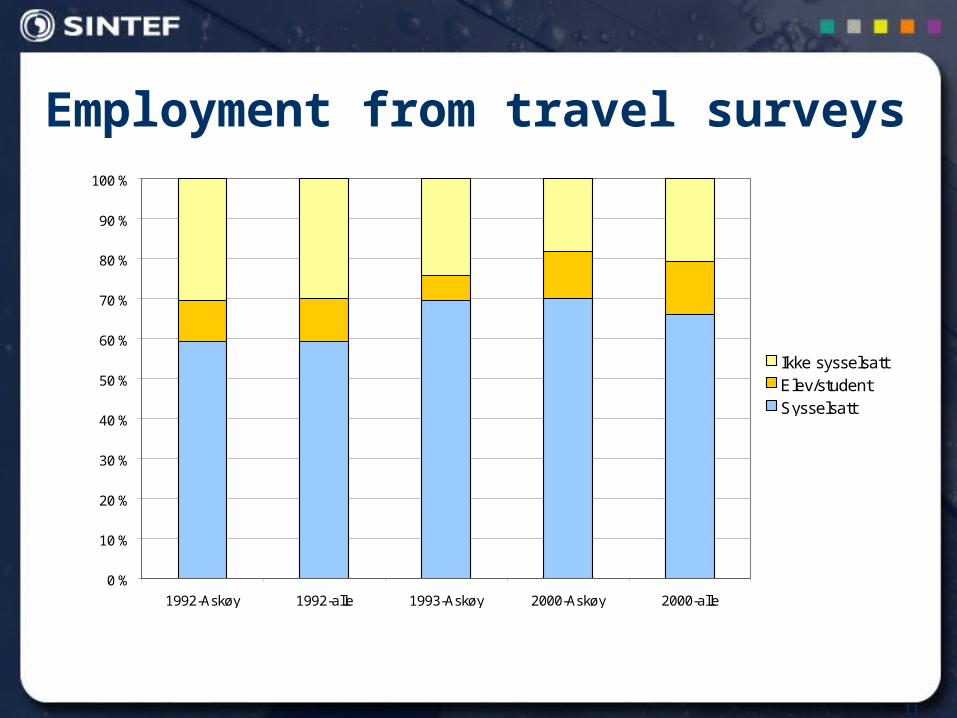
Employment from travel surveys
0 %
10 %
20 %
30 %
40 %
50 %
60 %
70 %
80 %
90 %
100 %
1992-Askøy 1992-alle 1993-Askøy 2000-Askøy 2000-alle
Ikke sysselsattElev/studentSysselsatt

12
Employment (2)
0 %
10 %
20 %
30 %
40 %
50 %
60 %
70 %
80 %
90 %
100 %
1992 1993 2000
Annet
Deltid
Heltid
13
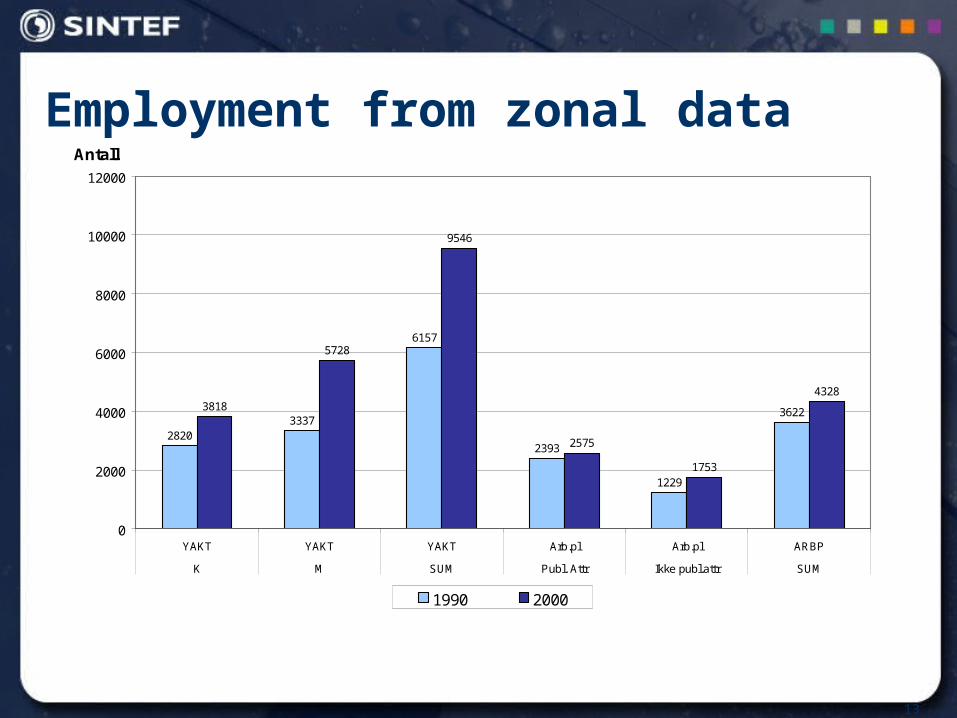
Employment from zonal data
28203337
6157
2393
1229
36223818
5728
9546
2575
1753
4328
0
2000
4000
6000
8000
10000
12000
YAKT YAKT YAKT Arb.pl Arb.pl ARBP
K M SUM Publ. Attr Ikke publ.attr SUM
Antall
1990 2000

14
Car ownership
0 %
10 %
20 %
30 %
40 %
50 %
60 %
70 %
1992 1993 2000 År
1 A
1 rvu
2 A
2 rvu
0 rvu
0 A
≥3 A
≥3 rvu
1 bil
2 biler
0 biler
3 eller flere biler
A=Askøy
15
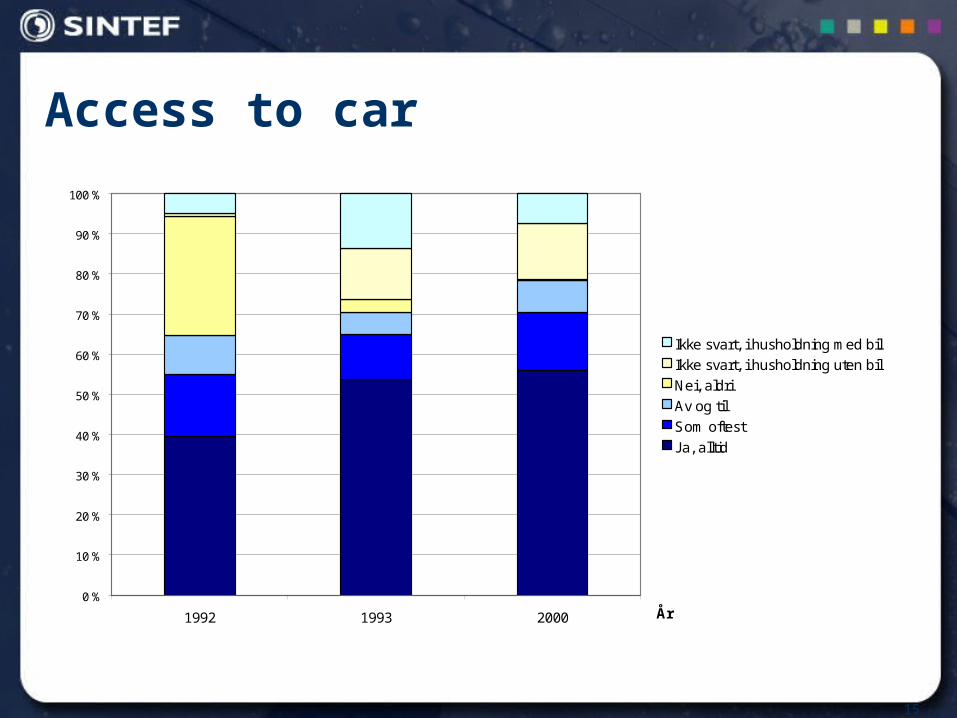
Access to car
0 %
10 %
20 %
30 %
40 %
50 %
60 %
70 %
80 %
90 %
100 %
1992 1993 2000 År
Ikke svart, i husholdning med bil
Ikke svart, i husholdning uten bil
Nei, aldri
Av og til
Som oftest
Ja, alltid

16
Trip production
Travel survey: Trip Frequency not changed for Residence – shopping/service
and Residence – Other (depended on number of people resided in Askøy)
Trip Frequency changed for Residence – work and Other (depended on number of jobs and number of people resided in Askøy)
Induced traffic ?
17
Trip distribution
The travel survey reported a change in Trip distribution, The Transport model reported other changes, but small changes
Generalised Cost (time) are too high for the trips between Askøy-Bergen with the ferry
18
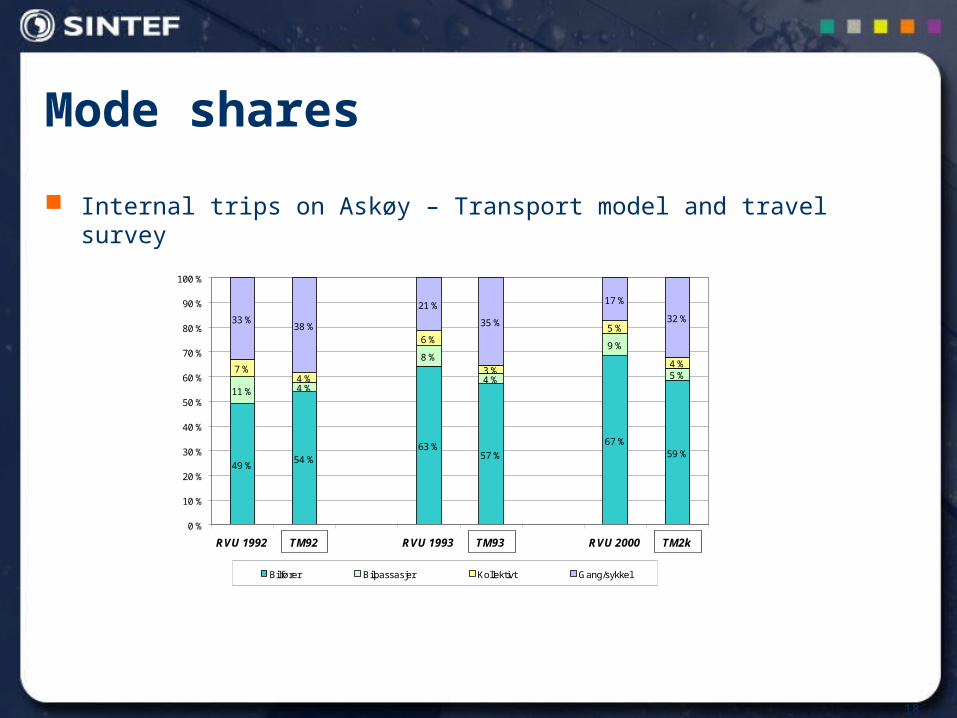
Mode shares
Internal trips on Askøy – Transport model and travel survey
49 %54 %
63 %57 %
67 %59 %
11 % 4 %
8 %
4 %
9 %
5 %7 %
4 %
6 %
3 %
5 %
4 %
33 %38 %
21 %
35 %
17 %
32 %
0 %
10 %
20 %
30 %
40 %
50 %
60 %
70 %
80 %
90 %
100 %
RVU 1992 TM92 RVU 1993 TM93 RVU 2000 TM2k
Bilfører Bilpassasjer Kollektivt Gang/sykkel

19
Holder de mot RVU
Trips to -and from Askøy – Transport model and travel survey
46 %
18 %
47 %
18 %
50 %
27 %
8 %
3 %
13 %
7 %
12 %
10 %
46 %
79 %
36 %
65 %
35 %
57 %
0 % 0 % 2 %9 %
2 % 3 %
0 %
10 %
20 %
30 %
40 %
50 %
60 %
70 %
80 %
90 %
100 %
RVU 1992 TM92 RVU 1993 TM93 RVU 2000 TM2k
Bilfører Bilpassasjer Kollektivt Gang/sykkel
20
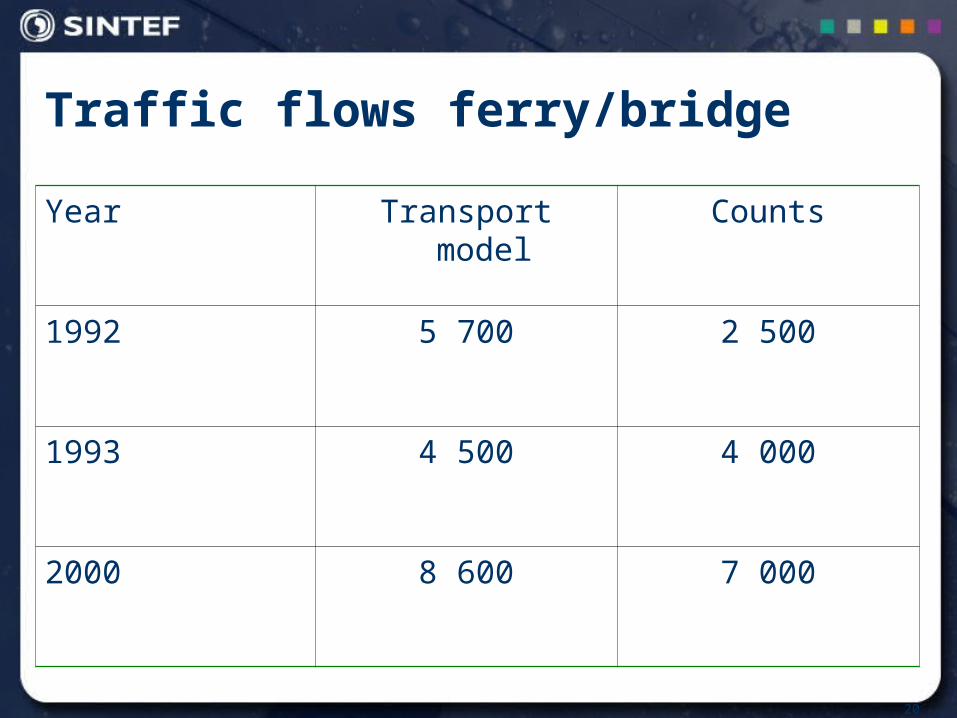
Traffic flows ferry/bridge
Year Transport model Counts
1992 5 700 2 500
1993 4 500 4 000
2000 8 600 7 000

21
Traffic flows ferry/bridge
Year Transport model Counts
1992 2 000 2 500
1993 1 600 4 000
2000 5100 7 000

22
Net assignment (3)
Ferry passengers Aadt Share
With car (light vehichles) 2 179 18 %
Without car 9 748 82 %
23
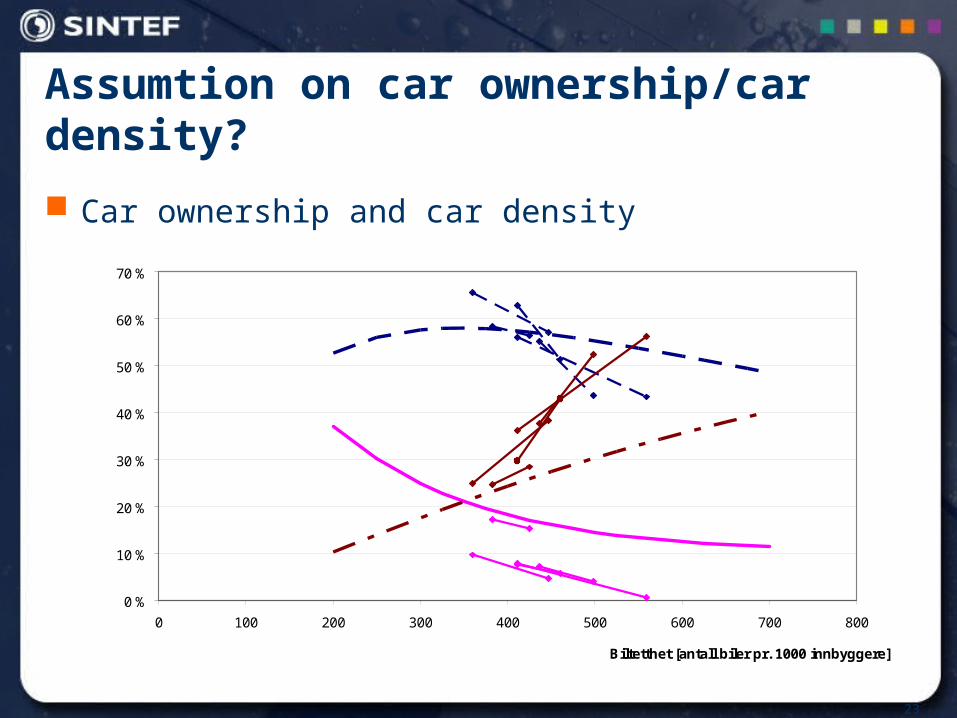
Assumtion on car ownership/car density?
Car ownership and car density
0 %
10 %
20 %
30 %
40 %
50 %
60 %
70 %
0 100 200 300 400 500 600 700 800
Biltetthet [antall biler pr. 1000 innbyggere]
B0
B2+
B1
24
Assumptions in the TM
Trip frequency Shows that changes only follow increased activity in the work
marked and only affects work-trips and trip-chains in connection with the work-trips
Trips distribution You can not use distance as the only variable into TD-calculation!
Not even for external traffic or commercial traffic
Mode shares Costs connected to trips with the ferry seems too high
Car ownership Erroneous assumption about the relation between car ownership
and car density
25
Further ……
Use other cost function for ferry in Trip Distribution and Mode choice calculations
Combined trips (in TS and in TM) Change zonal data (job marked) Hierarchical logit models? Commercial traffic Test the new regional transport models
Related Documents


