1 Summarizing Performance Data Confidence Intervals Important Easy to Difficult Warning: some mathematical content

1 Summarizing Performance Data Confidence Intervals Important Easy to Difficult Warning: some mathematical content.
Dec 19, 2015
Welcome message from author
This document is posted to help you gain knowledge. Please leave a comment to let me know what you think about it! Share it to your friends and learn new things together.
Transcript

1
Summarizing Performance DataConfidence Intervals
ImportantEasy to Difficult
Warning: some mathematical content

Contents
1. Summarized data2. Confidence Intervals
3. Independence Assumption4. Prediction Intervals
5. Which Summarization to Use ?
2

3
1 Summarizing Performance Data
How do you quantify: Central valueDispersion (Variability)
old new

4
Histogram is one answer
old new

5
ECDF allow easy comparison
oldnew

6
Summarized Measures
Median, QuantilesMedian QuartilesP-quantiles
Mean and standard deviationMean
Standard deviation
What is the interpretation of standard deviation ?
A: if data is normally distributed, with 95% probability, a new data sample lies in the interval

Example
7
mean and standard deviationquantiles

8
Coefficient of Variation Summarizes Variability
Scale freeSecond order
For a data set with n samples
Exponential distribution: CoV =1
What does CoV = 0 mean ?

Lorenz Curve Gap is an Alternative to CoV
Alternative to CoV
For a data set with n samples
Scale free, index of unfairness
9

Jain’s Fairness Index is an Alternative to CoV
Quantifies fairness of x;
Ranges from 1: all xi equal
1/n: maximum unfairness
Fairness and variability are two sides of the same coin
10
Lorenz Curve
Old code, new code: is JFI larger ? Gap ?Gini’s index is also used; Def: 2 x area between diagonal and Lorenz curve
More or less equivalent to Lorenz curve gap
11
Lorenz Curve gap
Perfect equality (fairness)

12

Which Summarization Should One Use ?
There are (too) many synthetic indices to choose fromTraditional measures in engineering are standard deviation, mean and CoV
Traditional measures in computer science are mean and JFIJFI is equivalent to CoV
In economy, gap and Gini’s index (a variant of Lorenz curve gap)
Statisticians like medians and quantiles (robust to statistical assumptions)
We will come back to the issue after discussing confidence intervals
13

14
2. Confidence Interval
Do not confuse with prediction intervalQuantifies uncertainty about an estimation

15
mean and standard deviationquantiles
16
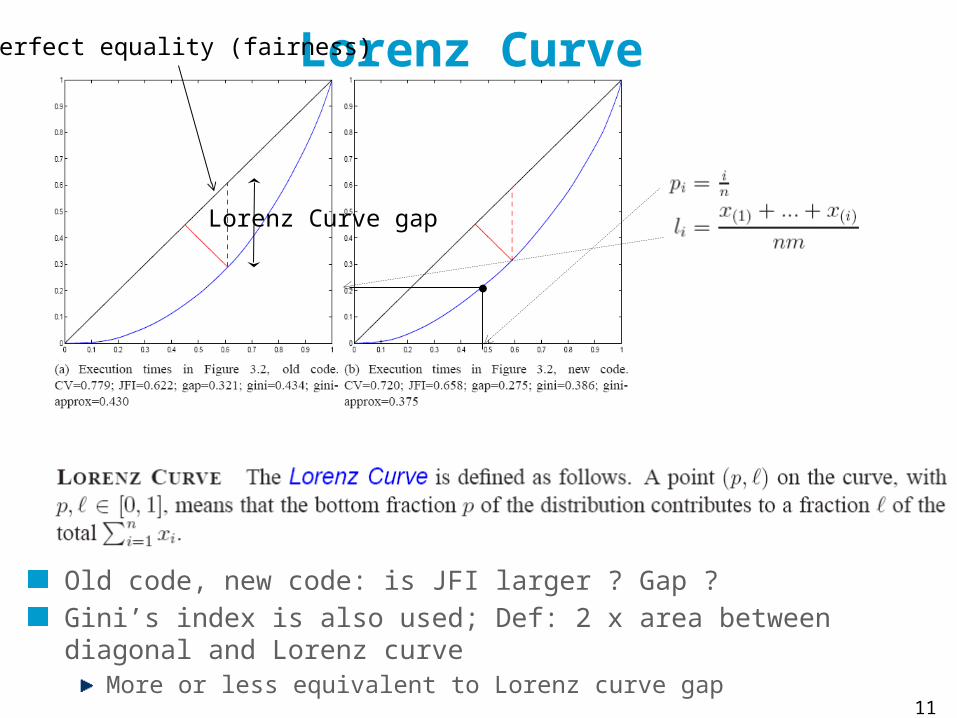
Confidence Intervals for Mean of Difference
Mean reduction =
0 is outside the confidence intervals for mean and for median
Confidence interval for median
17
Computing Confidence Intervals
This is simple if we can assume that the data comes from an iid model
Independent Identically Distributed

18
CI for median
Is the simplest of allRobust: always true provided iid assumption holds
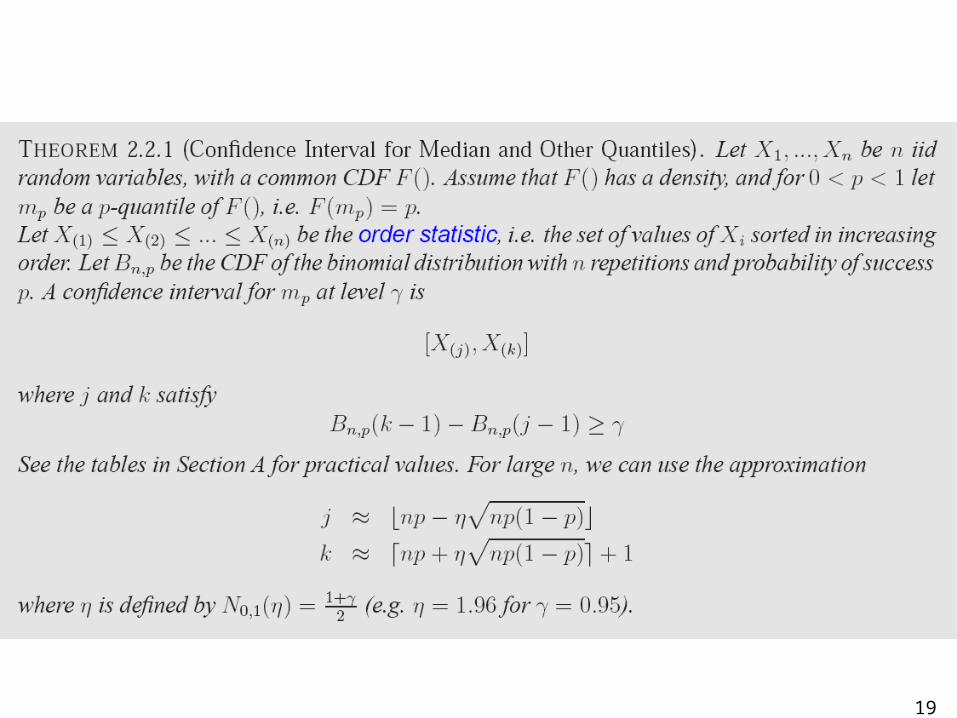
19

20
Confidence Interval for Median, level 95%
n = 31
n = 32
21
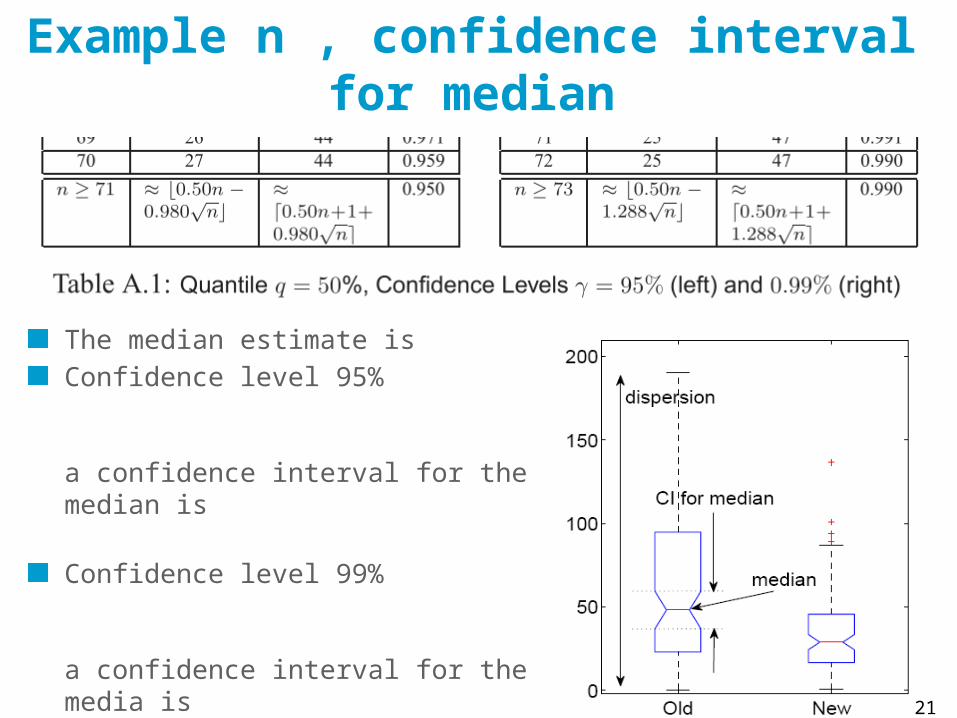
Example n , confidence interval for median
The median estimate is Confidence level 95%
a confidence interval for the median is
Confidence level 99%
a confidence interval for the media is

22
CI for mean and Standard Deviation
This is another method, most commonly used method…But requires some assumptions to hold, may be misleading if they do not holdThere is no exact theorem as for median and quantiles, but there are asymptotic results and a heuristic.

23
CI for mean, asymptotic case
If central limit theorem holds(in practice: n is large and distribution is not “wild”)
24
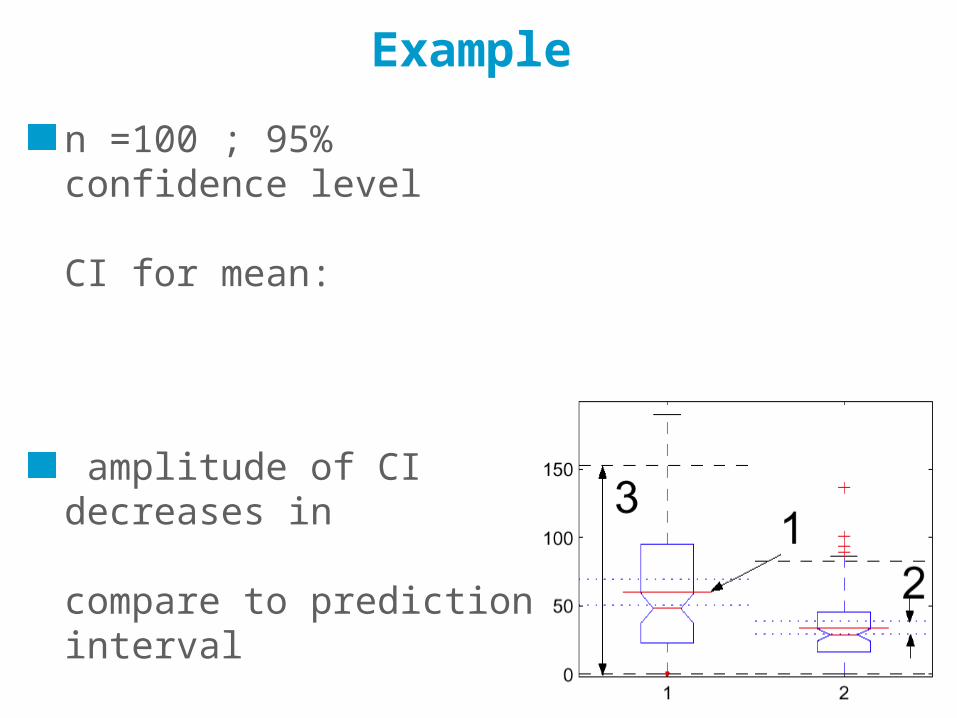
Example
n =100 ; 95% confidence level
CI for mean:
amplitude of CI decreases in
compare to prediction interval

25
Normal CaseAssume data comes from an iid + normal distributionUseful for very small data samples (n <30)

26
Example
n =100 ; 95% confidence level
CI for mean:
CI for standard deviation:
same as before except s instead of 1.96 for all n instead of 1.98 for n=100
In practice both (normal case and large n asymptotic) are the same if n > 30But large n asymptotic does not require normal assumption
27
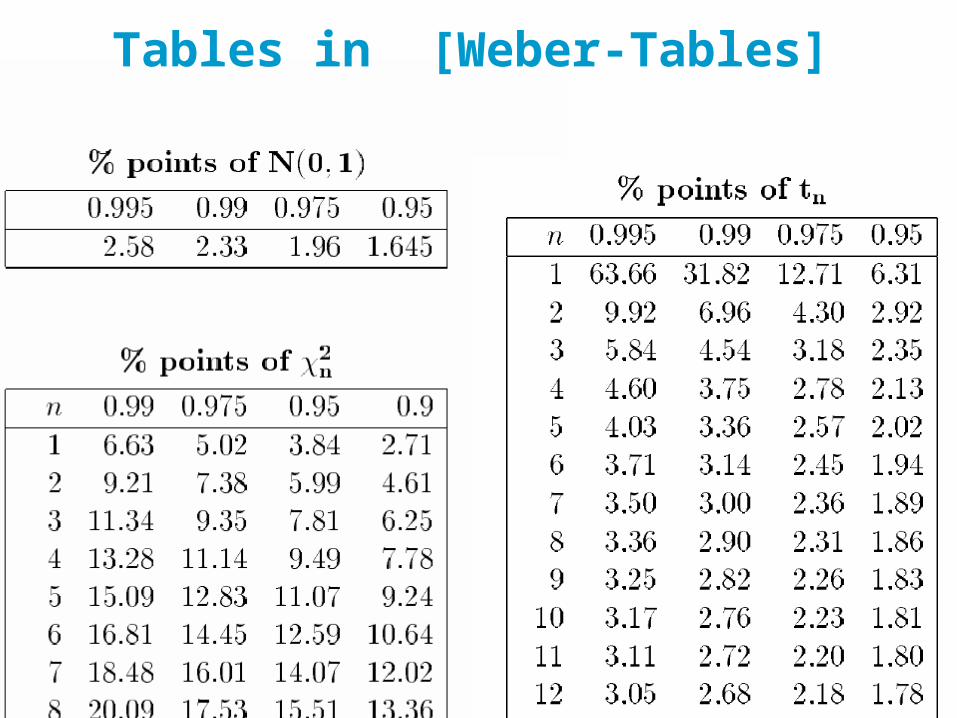
Tables in [Weber-Tables]

28
Standard Deviation: n or n-1 ?

29
Bootstrap Percentile Method
A heuristic that is robust (requires only iid assumption)But be careful with heavy tail, see next
but tends to underestimate CISimple to implement with a computerIdea: use the empirical distribution in place of the theoretical (unknown) distribution
For example, with confidence level = 95%:the data set is S= Do r=1 to r=999
(replay experiment) Draw n bootstrap replicates with replacement from SCompute sample mean Tr
Bootstrap percentile estimate is (T(25), T(975))

30
Example: Compiler Options
Does data look normal ?No
Methods 2.3.1 and 2.3.2 give same result (n >30)Method 2.3.3 (Bootstrap) gives same result
=> Asymptotic assumption valid
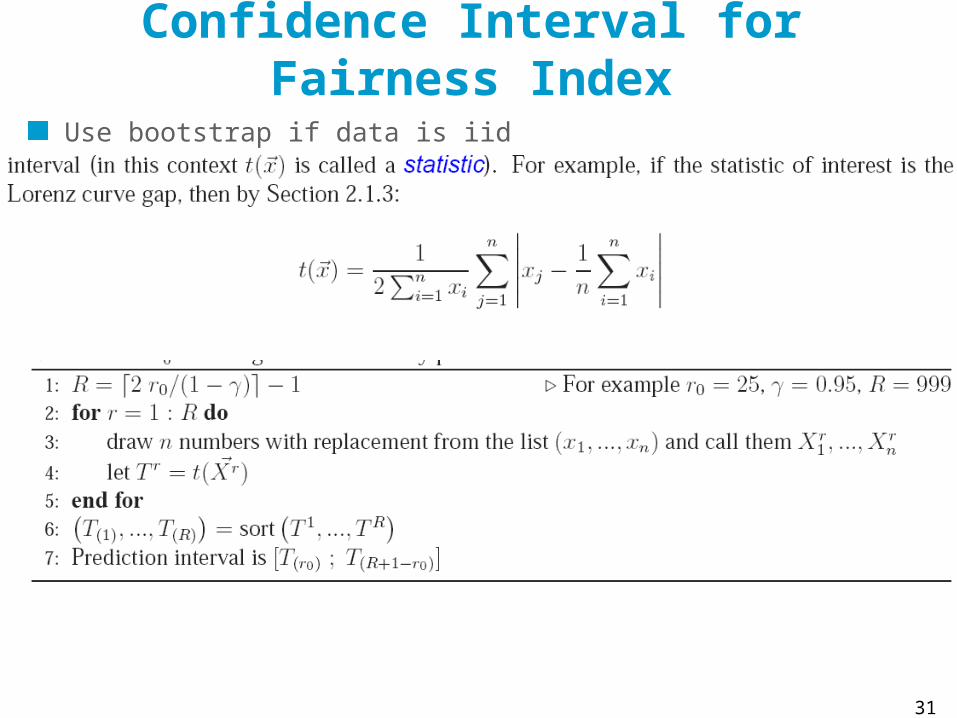
Confidence Interval for Fairness Index
Use bootstrap if data is iid
31

32

We test a system 10’000 time for failures and find 200 failures: give a 95% confidence
interval for the failure probability .
33

We test a system 10’000 time for failures and find 200 failures: give a 95% confidence
interval for the failure probability .
Let or (failure / success); So we are estimating the mean. The asymptotic theory applies (no heavy tail)
Confidence Interval: at level 0.95
34

We test a system 10 time for failures and find 0 failure: give a 95% confidence interval for
the failure probability .
1. [0 ; 0]2. [0 ; 0.1]3. [0 ; 0.11]4. [0 ; 0.21]5. [0; 0.31]
35

Confidence Interval for Success Probability
Problem statement: want to estimate proba of failure; observe n outcomes; no failure; confidence interval ?Example: we test a system 10 time for failures and find 0 failure: give a 95% confidence interval for the failure probability .Is this a confidence interval for the mean ? (explain why)The general theory does not give good results when mean is very small
36

37

38
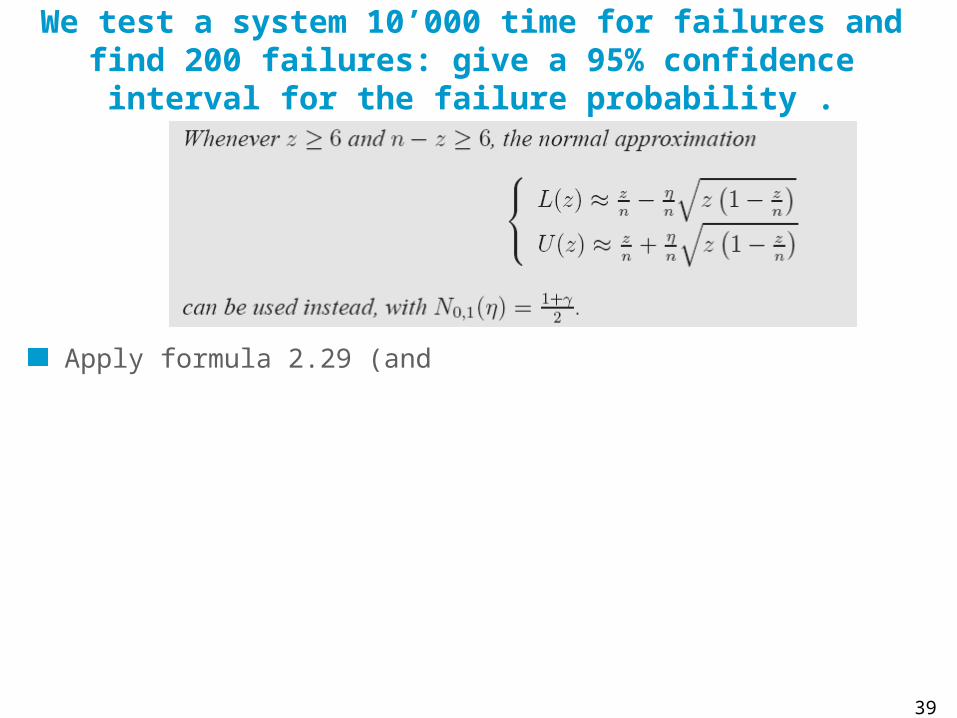
We test a system 10’000 time for failures and find 200 failures: give a 95% confidence interval for the failure probability .
Apply formula 2.29 (and
39

40
Take Home Message
Confidence interval for median (or other quantiles) is easy to get from the Binomial distribution
Requires iidNo other assumption
Confidence interval for the meanRequires iidAnd
Either if data sample is normal and n is smallOr data sample is not wild and n is large enough
The boostrap is more robust and more general but is more than a simple formula to applyConfidence interval for success probability requires special attention when success or failure is rareTo we need to verify the assumptions

3. The Independence Assumption
41
Confidence Intervals require that we can assume that the data comes from an iid model
Independent Identically Distributed
How do I know if this is true ?Controlled experiments: draw factors randomly with replacementSimulation: independent replications (with random seeds)
Else: we do not know – in some cases we will have methods for time series

42
What does independence mean ?

Example
Pretend data is iid: CI for mean is [69; 69.8]
Is this biased ?
43
data ACF

What happens if data is not iid ?
If data is positively correlatedNeighbouring values look similarFrequent in measurementsCI is underestimated: there is less information in the data than one thinks
44
45
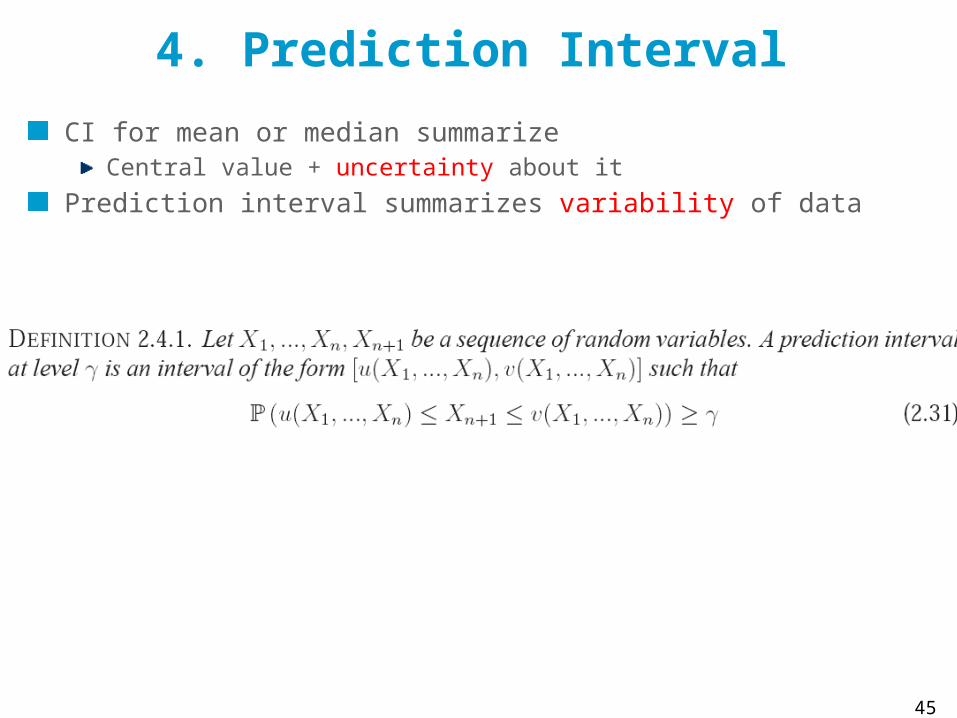
4. Prediction Interval
CI for mean or median summarizeCentral value + uncertainty about it
Prediction interval summarizes variability of data

46
Prediction Interval based on Order Statistic
Assume data comes from an iid modelSimplest and most robust result (not well known, though):
47
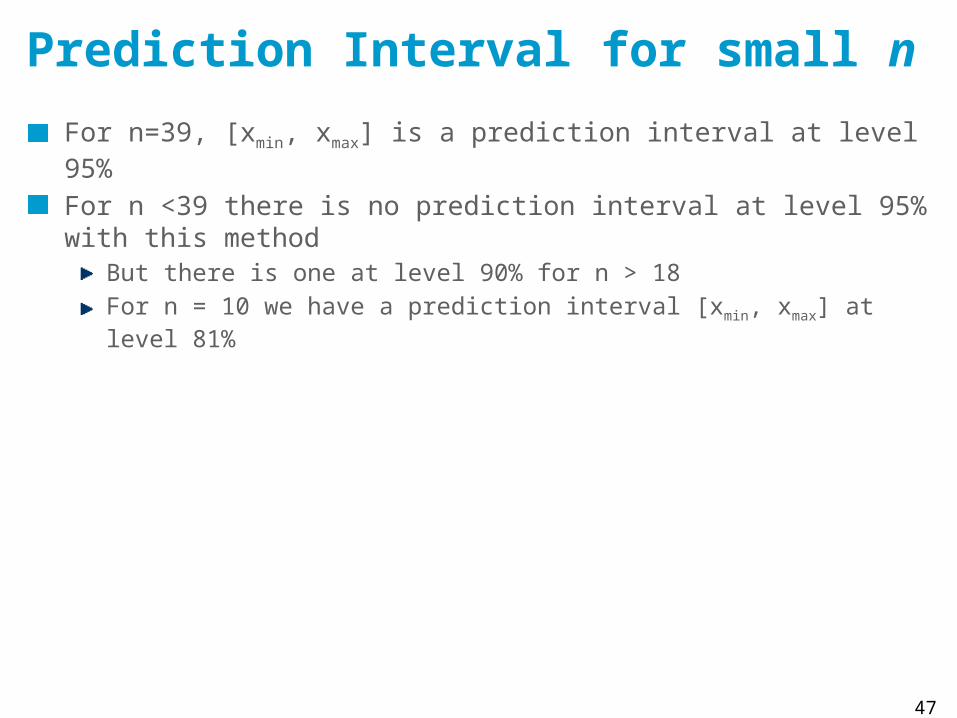
Prediction Interval for small n
For n=39, [xmin, xmax] is a prediction interval at level 95%
For n <39 there is no prediction interval at level 95% with this methodBut there is one at level 90% for n > 18For n = 10 we have a prediction interval [xmin, xmax] at level 81%

Prediction Interval based on Mean
48

Prediction Interval based on Mean
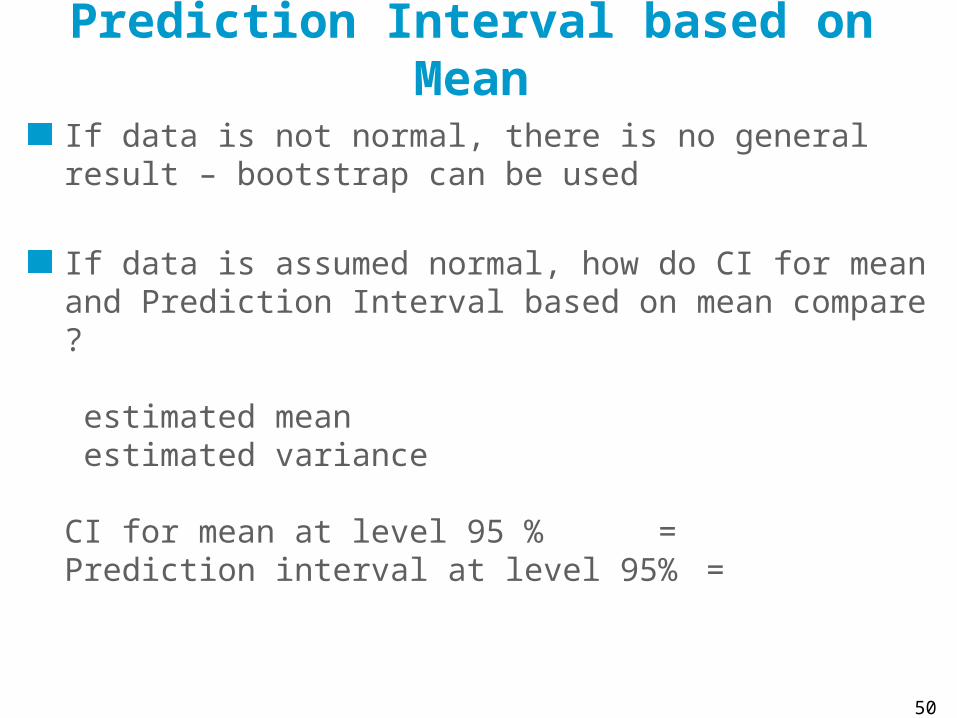
If data is not normal, there is no general result – bootstrap can be used
If data is assumed normal, how do CI for mean and Prediction Interval based on mean compare ?
49
Prediction Interval based on Mean
If data is not normal, there is no general result – bootstrap can be used
If data is assumed normal, how do CI for mean and Prediction Interval based on mean compare ?
estimated mean estimated variance
CI for mean at level 95 % = Prediction interval at level 95% =
50

51
Re-Scaling
Many results are simple if the data is normal, or close to it (i.e. not wild). An important question to ask is: can I change the scale of my data to have it look more normal.
Ex: log of the data instead of the data
A generic transformation used in statistics is the Box-Cox transformation:
Continuous in ss=0 : logs=-1: 1/xs=1: identity

52
Prediction Intervals for File Transfer Times
mean andstandard deviationon rescaled data
mean andstandard deviationorder statistic

53
Which Summarization Should I Use ?
Two issuesRobustness to outliersCompactness
54
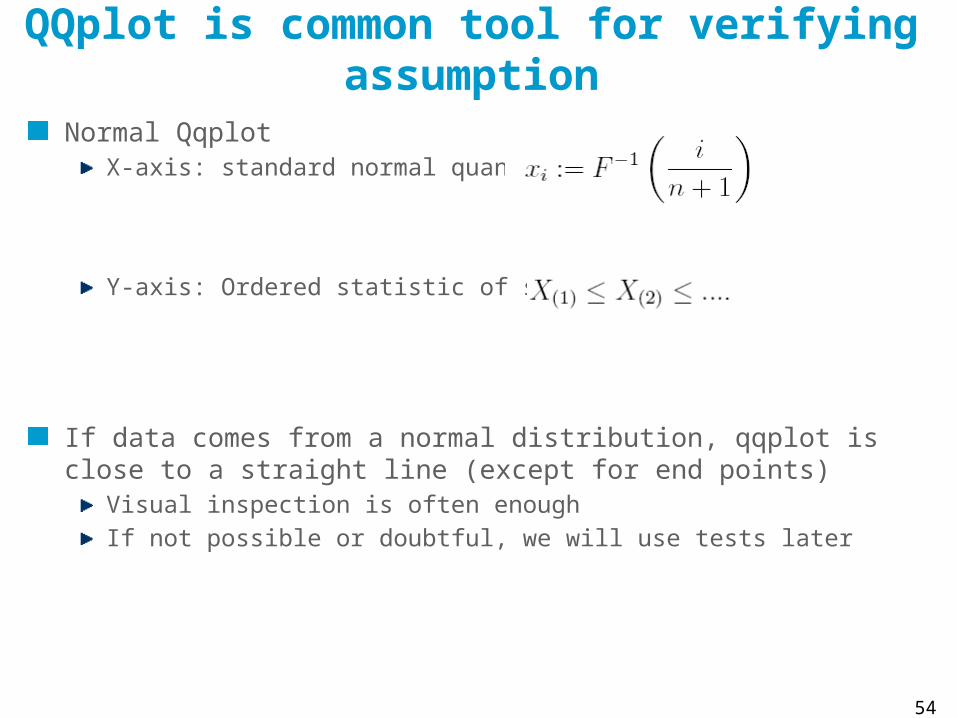
QQplot is common tool for verifying assumption
Normal QqplotX-axis: standard normal quantiles
Y-axis: Ordered statistic of sample:
If data comes from a normal distribution, qqplot is close to a straight line (except for end points)
Visual inspection is often enoughIf not possible or doubtful, we will use tests later

55
QQPlots of File Transfer Times

56
Take Home Message
The interpretation of as measure of variability is meaningful if the data is normal (or close to normal). Else, it is misleading. The data should be best re-scaled.

5. Which Summarization to Use ?
IssuesRobustness to outliersDistribution assumptions
57

A Distribution with Infinite Variance
58
True mean
True median
True mean
True median
CI based on std dv CI based on bootsrp
CI for median

59
Outlier in File Transfer Time

60
Robustness of Conf/Prediction Intervals
mean + std dev
CI for median geom mean
Outlier removedOutlier present
Order stat
Based onmean + std dev
Based onmean + std dev
+ re-scaling

Fairness Indices
Confidence Intervals obtained by BootstrapHow ?
JFI is very dependent on one outlierAs expected, since JFI is essentially CoV, i.e. standard deviation
Gap is sensitive, but lessDoes not use squaring ; why ?
61

62
Compactness
If normal assumption (or, for CI; asymptotic regime) holds, and are more compact
two values give both: CIs at all levels, prediction intervalsDerived indices: CoV, JFI
In contrast, CIs for median does not give information on variability
Prediction interval based on order statistic is robust (and, IMHO, best)

63
Take-Home Message
Use methods that you understandMean and standard deviation make sense when data sets are not wild
Close to normal, or not heavy tailed and large data sample
Use quantiles and order statistics if you have the choiceRescale

Questions
64

Questions
65

Questions
66
Related Documents