1 Southeast – Cape & Islands Regional Health Dialogue Massachusetts Department of Public Health June 7, 2007

1 Southeast – Cape & Islands Regional Health Dialogue Massachusetts Department of Public Health June 7, 2007.
Jan 01, 2016
Welcome message from author
This document is posted to help you gain knowledge. Please leave a comment to let me know what you think about it! Share it to your friends and learn new things together.
Transcript

1
Southeast – Cape & Islands Regional Health Dialogue
Massachusetts Department of Public Health
June 7, 2007

2
Goals for Holding Regional Dialogues
• Introduce new DPH leadership
• Present latest health data on your particular region
• Talk with residents and providers about data and identify areas of need
• Gather feedback to inform process of setting DPH priorities

3
Goals of New DPH leadership
• Use data and community input to set new priorities & reshape the Department
• Rely on science and evidence-based process to guide the work
• Strengthen ties with and support for local health and local agencies
• Increase resources to and visibility of Public Health in Massachusetts

4
Timetable
• Hold 8 regional dialogues with comprehensive data review and identification of key health concerns (by July)
• Identify short list of top priorities by end of August
• Hold second round of community dialogues to discuss action plans/results by end of calendar year

5
Socio-Demographic Indicators and Health Care Access
6
WesternRegion Central
Region
SoutheastRegion
Metro WestRegion
NortheastRegion
BostonRegion
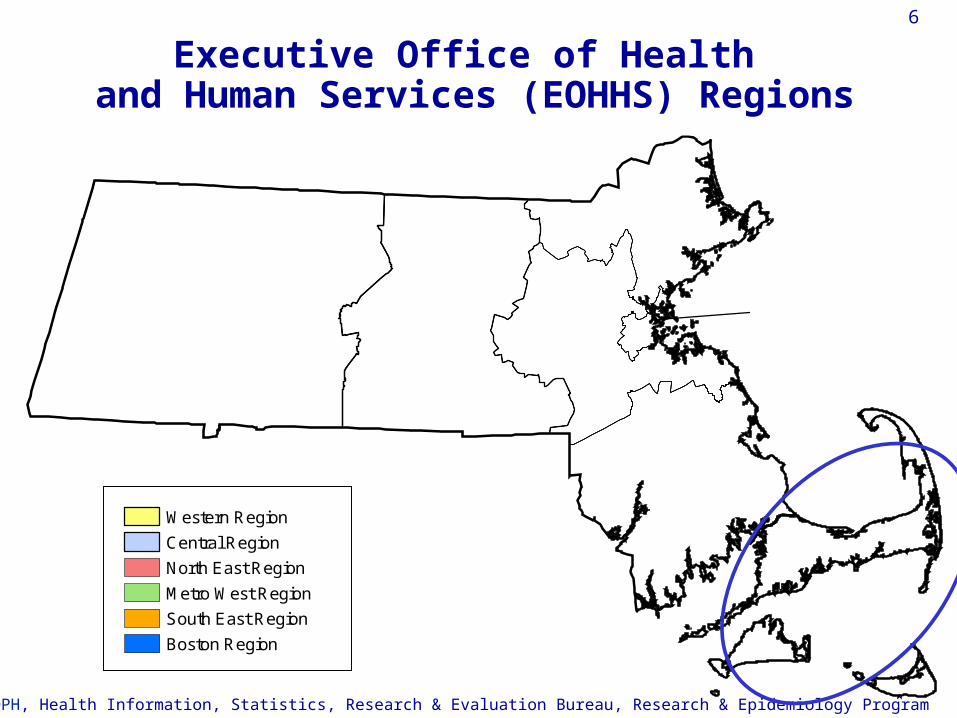
Executive Office of Healthand Human Services Regions
Western Region
Central Region
North East Region
Metro West Region
South East Region
Boston Region
Source: MDPH, Health Information, Statistics, Research & Evaluation Bureau, Research & Epidemiology Program
Executive Office of Health and Human Services (EOHHS) Regions

7
A few comments about the limitations of this presentation
• A regional analysis has its drawbacks
• Variability within a region – urban vs. rural/suburban (i.e. Cape vs. the rest of the region)
• Variability by sub-population – race matters, poverty matters
• Our data don’t reflect all the important health indicators

8
FREETOWNROCHESTER
TRURO
DIGHTON
EDGARTOWN
HALIFAX
CHILMARK
HANSON
BERKLEY
WEST TISBURY
MARION
WELLFLEET
ORLEANS
EASTHAM
PLYMPTON
CHATHAM
MATTAPOISETT
AVON
TISBURY
GOSNOLD
WEST BRIDGEWATER
PROVINCETOWN
OAK BLUFFS
GAY HEAD (AQUINNAH)
PLYMOUTH
TAUNTON
CARVER
BARNSTABLE
FALMOUTH
SANDWICH
NANTUCKET
WAREHAM
EASTON
FALL RIVER
LAKEVILLE
NORTON
SWANSEA
ATTLEBORO
BREWSTER
DARTMOUTHWESTPORT
REHOBOTH
MIDDLEBOROUGH
BOURNEDENNIS
MASHPEE
HARWICH
DUXBURY
YARMOUTH
MARSHFIELD
RAYNHAM
PEMBROKE
BRIDGEWATER
SEEKONK
BROCKTON
KINGSTON
MANSFIELD
ACUSHNET
HANOVER
NEW BEDFORD
STOUGHTON
FAIRHAVEN
ABINGTONROCKLAND
EAST BRIDGEWATER
NORTH ATTLEBOROUGH
SOMERSET
WHITMAN
HOLBROOK
2005 Population by Communities Southeast Region: 2005
SmallestGosnold: 86
LargestBrockton:100,366
Source: MDPH, Health Information, Statistics, Research & Evaluation Bureau, Research & Epidemiology Program
Population > 10,000

9
Race and Ethnic Breakdown of PopulationCape & Islands and Massachusetts: 2005
Cape & Islands Massachusetts
White*
94.3%
Black*
2.6%
Hispanic
1.7%
Asian*
0.9%
* Non-Hispanics
White*
81.0%
Black*
6.0%
Hispanic
7.9%
Asian*
4.9%
Source: MDPH, Health Information, Statistics, Research & Evaluation Bureau, Research & Epidemiology Program
American Indian*
0.6%
American Indian*
0.2%
Total = 252,204 Total = 6,436,940

10
TOLLAND1.2%
MASHPEE3.1%
LAWRENCE2%
TISBURY: 1.4%
GAY HEAD (AQUINNAH)39.5%
OAK BLUFFS1.5%
American Indian Populationby Cities and Towns, Massachusetts 2000
American Indian Population by Town
> 1% of Total Population
<= 1% of total population
Towns by Percent Native American Population Massachusetts: 2000
> 1% MA population
<= 1% MA population
Source: MDPH, Health Information, Statistics, Research & Evaluation Bureau, Research & Epidemiology Program

11
Language Spoken at HomeSoutheast Region and Massachusetts: 2000
Cape & Islands
Southeast (not including
Cape & Islands)
Southeast Region
Massachusetts Overall
Only English 93.0 83.7 85.4 81.3
Spanish or Spanish Creole 1.5 2.7 2.5 6.2
Portuguese or Portuguese Creole
1.8 8.7 7.4 2.7
French 1.0 1.3 1.3 1.4
Chinese 0.1 0.2 0.2 1.2
Italian 0.4 0.3 0.4 1.0
French Creole 0.1 0.8 0.7 0.7
Russian 0.1 0.1 0.1 0.6
Vietnamese - 0.1 0.1 0.5
Polish 0.1 0.2 0.2 0.5
Other languages 1.9 1.9 1.7 3.9
Source: MDPH, Health Information, Statistics, Research & Evaluation Bureau, Research & Epidemiology Program

12
Cape & Islands Massachusetts
0-19 years 20.4%
Source: MDPH, Health Information, Statistics, Research & Evaluation Bureau, Research & Epidemiology Program
Population by Age Group Cape & Islands and Massachusetts: 2005
20-24 years 5.0%
25-44 years
25.2%
45-64 years
27.4%
65+ years 21.9%
0-19 years 25.5%
20-24 years 6.7%
25-44 years
29.4%
45-64 years
25.3%
65+ years 13.3%
Total = 252,204 Total = 6,436,940
20-24 years 5.0% Southeast
(non-Cape)
0-19 years 26.5%
20-24 years 5.9%
25-44 years
29.1%
45-64 years
25.8%
65+ years 12.7%
Total = 1,026,041

13
Socio-Demographic IndicatorsSoutheast Region and Massachusetts
Cape & Islands
Southeast (not including
Cape & Islands)
Southeast Region
Massachusetts Overall
Per Capita Income (2000) $25,619
$21,520
$22,273
$25,952
Persons living below 100% poverty (2000)
6.9% 8.5% 8.3% 9.3%
Children < 18 living below 100% poverty (2000)
8.5% 10.9% 10.5% 11.6%
Less than a High School Education (2000)
8.3% 20.4% 18.0% 15.2%
Foreign born (2000) 5.1% 9.5% 8.7% 12.2%
Speak language other than English at home (2000)
7.0% 16.3% 14.6% 18.7%
Unemployed (2004) 4.6% 5.7% 5.5% 5.1%
Source: MDPH, Health Information, Statistics, Research & Evaluation Bureau, Research & Epidemiology Program
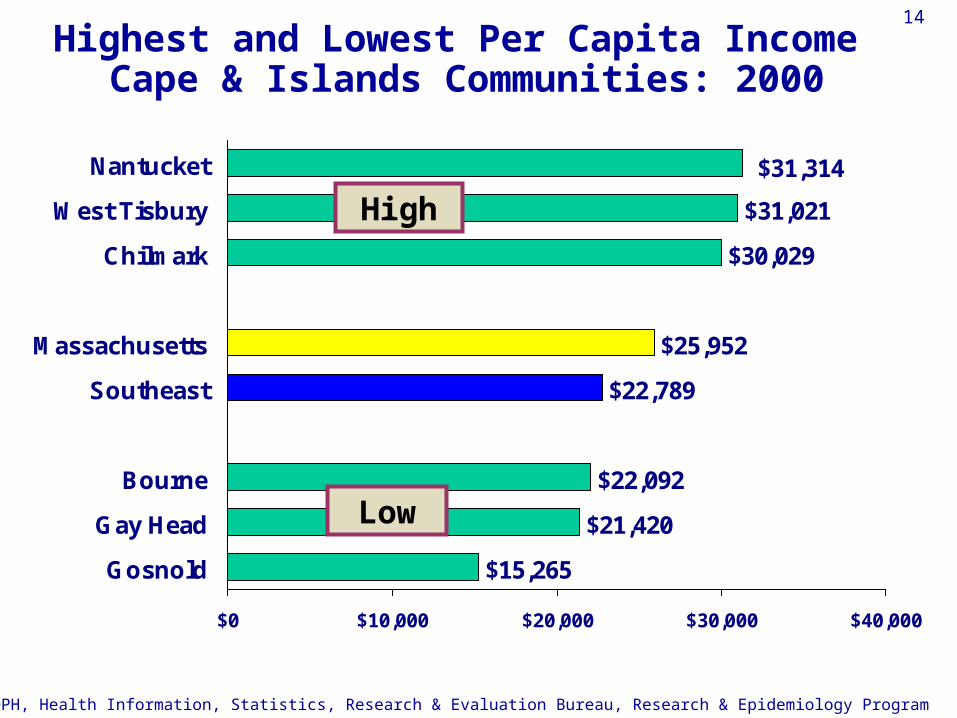
14
$15,265
$21,420
$22,092
$22,789
$25,952
$30,029
$31,021
$31,314
$0 $10,000 $20,000 $30,000 $40,000
Gosnold
Gay Head
Bourne
Southeast
Massachusetts
Chilmark
West Tisbury
Nantucket
Highest and Lowest Per Capita Income Cape & Islands Communities: 2000
High
Low
Source: MDPH, Health Information, Statistics, Research & Evaluation Bureau, Research & Epidemiology Program

15
Birth Indicators

16
Infant Mortality Rates by EOHHS Region Massachusetts: 2002-2005
4.8 4.7
5.7
4.9
4.0**
4.7
5.6 5.44.8
0
2
4
6
8
Western Central Northeast MetroWest
Southeast Cape &Islands
Southeast(Non-Cape)
Boston MA
Infa
nt
De
ath
s
pe
r 1
,00
0 L
ive
Bir
ths
Source: MDPH, Health Information, Statistics, Research & Evaluation Bureau, Research & Epidemiology Program
Infant Mortality Rate: deaths of infants less than one year of age per 1000 live births
Statistically different from State (p ≤.05) Red (*) = Statistically worse; Green (**) = Statistically better

17
Indicator (as % of race group births)
MA Total (n=76,824) Southeast
(n=14,681)
Southeast (not incl. the
Cape)(n=12,450)
Cape & Islands (n=2,311)
Adequate Prenatal Care (Kotelchuck index)
84.0 83.6 83.0 86.7
Cesareans 32.3 34.6 35.3 30.7
Low Birth weight (<5.5 lb) 7.9 8.3 8.6 6.4
Breastfeeding 79.3 71.5 69.1 83.9
Public Pay for Prenatal Care 32.6 34.7 34.8 33.5
Smoking during pregnancy 7.1 10.2 10.1 10.1
Summary Birth Indicators Southeast Region and Massachusetts: 2005
Source: MDPH, Health Information, Statistics, Research & Evaluation Bureau, Research & Epidemiology Program
Better Outcome (significantly different from state) Worse Outcome (significantly different from state)
18
Leading Causes of Death

19Leading Causes of Death
Cape & Islands and Massachusetts: 2005
Source: MDPH, Health Information, Statistics, Research & Evaluation Bureau, Research & Epidemiology Program
MassachusettsN=53,776
Heart Disease
13,248 24.6%
Cancer
13,159 24.5%
Stroke 2,979 5.5%
All Injuries 2,657 4.9%
Chronic Lower Respiratory Disease (formerly COPD)
2,643 4.9%
Influenza and pneumonia 1,932 3.6%
Alzheimer's 1,635 3.0%
Nephritis 1,403 2.6%
Diabetes 1,271 2.4%
Septicemia
982 1.8%
Cape & IslandsN=2,869
Heart Disease 721 25.1%
Cancer 707 24.6%
Stroke 168 5.9%
Chronic Lower Respiratory Disease (formerly COPD) 145 5.1%
Alzheimer's 135 4.7%*
All Injuries 128 4.5%
Influenza and pneumonia 96 3.3%
Nephritis 64 2.2%
Diabetes 60 2.1%
Parkinson's Disease 36 1.3%Statistically different from State (p ≤.05) Red (*) = Statistically worse; Green (**) = Statistically better

20
Chronic Disease Outcomes and Overweight/Obesity

21
Adults who are Overweight1 by EOHHS Region, Massachusetts: 1995 and 2005
57.8
45.1
35.7
50.244.643.545.7
49.5
56.152.655.9
60.857.5
52.0
0
10
20
30
40
50
60
70
Western Central Northeast MetroWest
Southeast Boston MA
Per
cen
t
1995 2005
Source: MDPH, Health Information, Statistics, Research and Evaluation Bureau, Massachusetts Behavioral Risk Factor Surveillance System (BRFSS), Health Survey Program
1 Overweight: BMI greater than or equal to 25
Statistically different from State (p ≤.05) Red (*) = Statistically worse; Green (**) = Statistically better

22
Cancer

23
7.3
10.1
3.9
10.2
3.2
7.2
13.5
7.6
10.1
0
5
10
15
20
25
Western Central Northeast Metro West Southeast Cape &Islands
Southeast(Non-Cape)
Boston MA
Pe
rce
nt
Source: MDPH, Health Information, Statistics, Research & Evaluation Bureau, Research & Epidemiology Program
Statistically different from State (p ≤.05) Red (*) = Statistically worse; Green (**) = Statistically better
Smoking During Pregnancy by EOHHS Region Massachusetts: 2005
*
**
*
**
* *

24
21.8
7.2
21.9
10.1
0
5
10
15
20
25
1989 1990 1991 1992 1993 1994 1995 1996 1997 1998 1999 2000 2001 2002 2003 2004 2005
Pe
rce
nt
Smoking During PregnancyCape & Islands and Massachusetts: 1990-2005
Massachusetts
Cape & Islands
Source: MDPH, Health Information, Statistics, Research & Evaluation Bureau, Research & Epidemiology Program

25Smoking During Pregnancy by Race and Ethnicity
Cape & Islands and Massachusetts: 2005
6.1
8.4
10.1
13.0
5.95.2
1.4
0
2
4
6
8
10
12
14
Cape & Islands Massachusetts
Per
cen
t
White non-Hispanic Black non-Hispanic
Hispanic Asian non-Hispanic
Source: MDPH, Health Information, Statistics, Research & Evaluation Bureau, Research & Epidemiology Program
*
Statistically different from State (p ≤.05) Red (*) = Statistically worse; Green (**) = Statistically better
NA
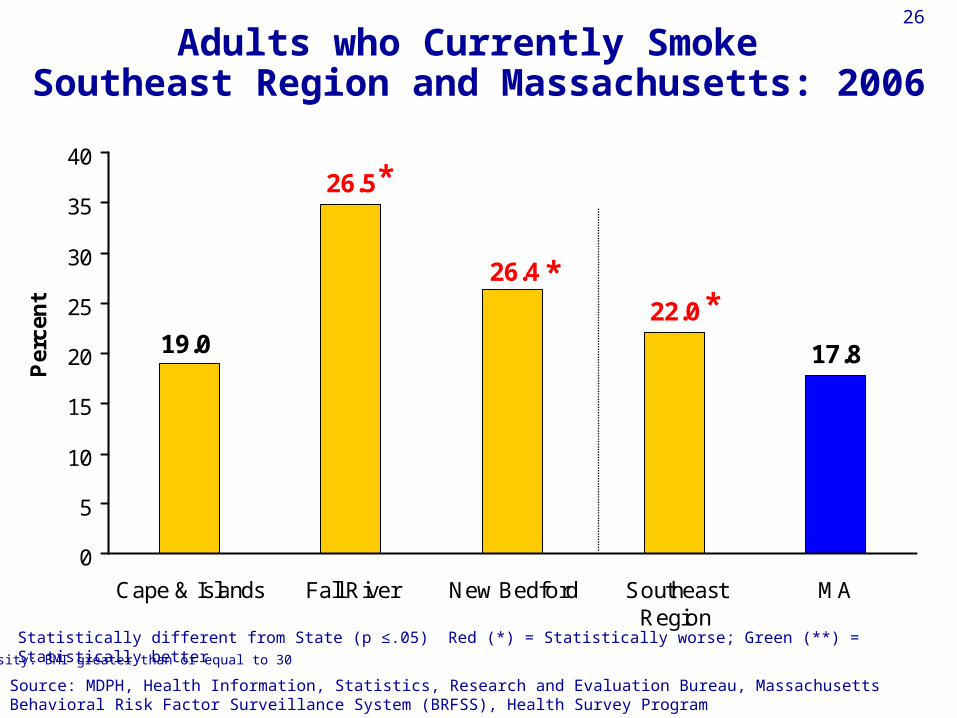
26
Adults who Currently Smoke Southeast Region and Massachusetts: 2006
17.8
22.0
26.4
19.0
26.5
0
5
10
15
20
25
30
35
40
Cape & Islands Fall River New Bedford SoutheastRegion
MA
Per
cen
t
*
Obesity: BMI greater than or equal to 30
Statistically different from State (p ≤.05) Red (*) = Statistically worse; Green (**) = Statistically better
Source: MDPH, Health Information, Statistics, Research and Evaluation Bureau, Massachusetts Behavioral Risk Factor Surveillance System (BRFSS), Health Survey Program
**

27Incidence Rates for Invasive Lung Cancer by EOHHS Region, Massachusetts: 1999-2003
72.078.9 77.776.7
67.2 69.965.1
73.277.5
0
25
50
75
100
Western Central Northeast MetroWest
Southeast Cape &Islands
Southeast(Non-Cape)
Boston MA
Cas
es p
er 1
00,0
00 p
op
ula
tio
n
Age-adjusted to the 2000 US standard population. Source: MDPH, Health Information, Statistics, Research & Evaluation Bureau, Cancer Registry
*
Statistically different from State (p ≤.05) Red (*) = Statistically worse; Green (**) = Statistically better
*** *
**
*
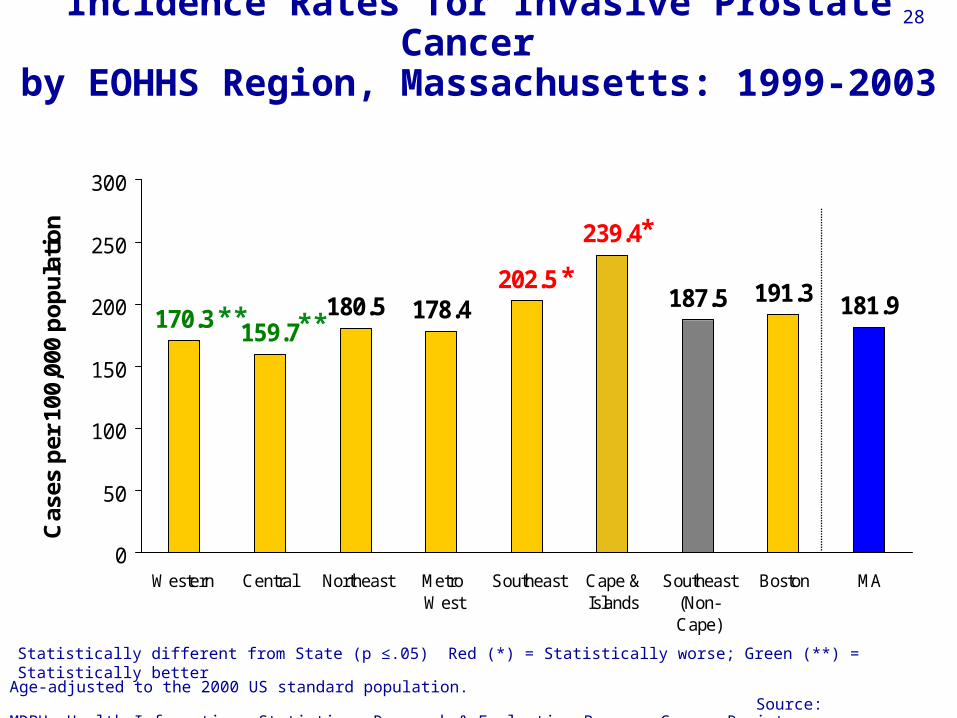
28Incidence Rates for Invasive Prostate Cancer by EOHHS Region, Massachusetts: 1999-2003
180.5 187.5 191.3 181.9170.3 159.7178.4
239.4
202.5
0
50
100
150
200
250
300
Western Central Northeast MetroWest
Southeast Cape &Islands
Southeast(Non-Cape)
Boston MA
Cas
es p
er 1
00,0
00 p
op
ula
tio
n
Age-adjusted to the 2000 US standard population. Source: MDPH, Health Information, Statistics, Research & Evaluation Bureau, Cancer Registry
**
*
Statistically different from State (p ≤.05) Red (*) = Statistically worse; Green (**) = Statistically better
**
*

29
Indicator MA
Total Fall
RiverNew
Bedford
Cape & Islands
Southeast
% Blood Stool Test † 28.4 32.2 33.8 35.2 28.8
% Adults Sigmoidoscopy or
Colonoscopy†
57.4 50.2 48.1 56.5 58.5
% Women* Mammography 84.8 80.6 83.8 85.7 83.4
Summary Indicators for Cancer Screening by Southeast Region and Massachusetts: 2006
Better Outcome (significantly different from state) Worse Outcome (significantly different from state)
*40 years and older, † 50 years and older
Source: MDPH, Health Information, Statistics, Research & Evaluation Bureau, Health Survey Program

30
Indicator
MA
Total Southeast
Southeast (not including
Cape & Islands)
Cape & Islands
Prostate Cancer 181.9 202.5 187.5 239.4
Female Breast Cancer 138.9 139.6 132.8 161.5
Colorectal Cancer 58.9 59.7 59.3 60.6
Lung Cancer 72.0 77.5 78.9 73.2
Total Cancer 517.0 543.1 528.7 582.5
Summary Cancer Incidence Rates Southeast Region and Massachusetts: 1999-2003
Better Outcome (significantly different from state) Worse Outcome (significantly different from state)
Source: MDPH, Health Information, Statistics, Research & Evaluation Bureau, Cancer Registry

31
Substance Abuse

32 Opioid-related Emergency Department Visit Rates by EOHHS Region
Massachusetts: 2003-2005
186.3 181.1
309.3
195.7
126.1
223.5
114.0
168.6
238.0*
0
50
100
150
200
250
300
350
Western Central Northeast Metro West Southeast Cape &Islands
Southeast(Non-Cape)
Boston MA
Vis
its
per
100
,000
**
**
*
*
*
**
Age-adjusted to the 2000 US standard population. Source: Division of Health Care Finance and Policy. Calendar Year 2003-2005. Emergency Department Visits
Statistically different from State (p ≤.05) Red (*) = Statistically higher; Green (**) = Statistically lower

33
Indicator MA
Total Southeast Cape &
Islands
Substance Abuse Treatment Program Admissions Rate (crude rate) 1,601 1,724 2,015
Substance Abuse Treatment Program Admissions Rate—Alcohol (crude rate) 661 821 1,147
Substance Abuse Treatment Program Admissions Rate—Cocaine (crude rate) 62 88 92
Substance Abuse Treatment Program Admissions Rate—Heroin (crude rate) 609 504 389
Summary Substance Abuse Indicators Southeast Region, Cape & Islands and
Massachusetts: 2005
Source: Massachusetts Department of Public Health. BSAS Substance Abuse Treatment Programs 2005.
Statistically lower than state Statistically higher than state
34
Injury and Violence

35
Hospital Discharge Rates for Motor Vehicle-related Injuries by EOHHS Region Massachusetts: 2003-2005
73 74 77
87*93*
88 *
57 **
91 *93 *
0
20
40
60
80
100
Western Central Northeast Metro West Southeast Cape &Islands
Southeast(Non-Cape)
Boston MA
Dis
char
ges
per
100
,000
Statistically different from State (p ≤.05) Red (*) = Statistically worse; Green (**) = Statistically better
Age-adjusted to the 2000 US standard population. Source: Division of Health Care Finance and Policy. Calendar Year 2003-2005. Inpatient Hospital Discharge Database

36 Emergency Department Visit Rates for Fall-related Injuries by EOHHS Region
Massachusetts: 2003-2005
3,191
2,5112,750
3,133
2,410
2,7132,913 2,860
3,414
0
500
1,000
1,500
2,000
2,500
3,000
3,500
4,000
Western Central Northeast Metro West Southeast Cape &Islands
Southeast(Non-Cape)
Boston MA
Vis
its
pe
r 1
00
,00
0
**
*
***
Age-adjusted to the 2000 US standard population. Source: Division of Health Care Finance and Policy. Calendar Year 2003-2005. Emergency Department Visits
*
**
Statistically different from State (p ≤.05) Red (*) = Statistically worse; Green (**) = Statistically better
**

37Emergency Department Visit Rates for Fall-related Injuries by Race/Ethnicity
Cape & Islands and Massachusetts: 2003-2005
2,504
3,169
2,783
4,265
1,870
2,502
896 784
0
500
1,000
1,500
2,000
2,500
3,000
3,500
4,000
4,500
Cape & Islands Massachusetts
Vis
its
pe
r 1
00
,00
0
White non-Hispanic Black non-Hispanic
Hispanic Asian non-Hispanic
*
**
Age-adjusted to the 2000 US standard population. Source: Division of Health Care Finance and Policy. Calendar Year 2003-2005. Emergency Department Visits
Statistically different from State (p ≤.05) Red (*) = Statistically worse; Green (**) = Statistically better
*

38
Suicide Rates by EOHHS Region Massachusetts: 2003-2005
6.9 6.35.5
6.65.3
7.47.9 7.2
9.5*
0
5
10
15
20
Western Central Northeast MetroWest
Southeast Cape &Islands
Southeast(Non-Cape)
Boston MA
Dea
ths
per
100
,000
po
pu
lati
on
**
Age-adjusted to the 2000 US standard population. Source: MDPH, Health Information, Statistics, Research & Evaluation Bureau, Research & Epidemiology Program
Statistically different from State (p ≤.05) Red (*) = Statistically worse; Green (**) = Statistically better

39
Hospital Discharge Indicator Rates
(age-adjusted, per 100,000)
MA
Total Southeast Southeast (not including Cape & Islands)
Cape & Islands
All Injuries 836 859 876 812
Fall-related injury hospitalizations 374 375 378 371
Traumatic Brain Injuries 80 73 73 72
Motor vehicle-related 77 88 87 93
Self-Inflicted 65 66 NA 63
Assault 28 21 NA 18
Summary Injury/Violence Hospitalization Indicators Southeast Region, Cape & Islands and
Massachusetts: 2003-2005
Better Outcome (significantly different from state) Worse Outcome (significantly different from state)
Age-adjusted to the 2000 US standard population. Source: Division of Health Care Finance and Policy. Calendar Year 2003-2005. Inpatient Hospital Discharge Database

40
Infectious Diseases

41
Indicator
Crude rate, per 100,000
MA
Total Southeast
Cape & Islands
Persons living with HIV (2005) 247.1 170.9 235.9
HIV Incidence(2005) 12.6 7.7 10.3
Persons living with AIDS (2005) 133.2 95.2 124.9
AIDS Incidence (2005) 8.0 6.3 7.1
HIV/AIDS Mortality (2003-2005) 3.1 2.5 2.4
Summary HIV/AIDS Indicators Southeast Region, Cape & Islands
and Massachusetts
Better Outcome (significantly different from state) Worse Outcome (significantly different from state)

42Lyme Disease Incidence Cape & Islands, Southeast Region, and
Massachusetts: 2004
30.924.7
4.0
48.5
21.218.427.3
19.7
119.5
0
20
40
60
80
100
120
140
Western Central Northeast MetroWest
Southeast Cape &Islands
Southeast(Non-Cape)
Boston MA
Ca
se
s
pe
r 1
00
,00
0 p
op
ula
tio
n
*
**
Statistically different from State (p ≤.05) Red (*) = Statistically worse; Green (**) = Statistically better
**
Source: MDPH Bureau of Communicable Disease Control, ISIS
**
*

43
Indicator
MA
Total Southeast Southeast
(not including Cape & Islands)
Cape & Islands
Chlamydia Incidence (crude rates, 2005) 225.7 169.7 184.5 103.5
Gonorrhea Incidence (crude rates, 2005) 39.6 35.4 36.2 30.9
Syphilis Incidence (crude rates, 2005) 6.3 2.7 2.1 4.8
Tuberculosis Incidence (crude rates, 2004)
4.4 2.0 NA NA
Lyme Disease Incidence (crude rates, 2004)
24.7 48.4 30.9 119.5
Average Hep C Incidence Infection (crude rates, 2006)
114.0 82.0 NA NA
Pneumonia/ Influenza Hospital Discharges (age-adjusted, 2005)
377.0 406.7 488.8 285.2
Summary Infectious Disease Indicators Southeast Region, Cape & Islands and Massachusetts
Better Outcome (significantly different from state) Worse Outcome (significantly different from state)

44
Asthma

45
Indicator
MA
Total Southeast Southeast
(not including Cape & Islands)
Cape & Islands
Asthma ER Visits Ages 0-4 (age adjusted per100,000)
1,130 854 846 884
Asthma ER Visits Ages 5-9 (age adjusted per100,000)
775 687 656 825
Asthma ER Visits Ages 10-14 (age adjusted per100,000)
533 571 533 755
Asthma ER Visits Ages 0-14 (age adjusted per100,000)
808 697 671 816
Summary Asthma Indicators Southeast Region, Cape & Islands and
Massachusetts: 2005
Source: Division of Health Care Finance and Policy. Calendar Year 2005. Emergency Department Visits
Statistically lower than state Statistically higher than state

46
Summary-Cape & Islands• Socio-demographics difference impact health status
– Older population – Socio-demographic indicators are better than the State – Mostly white non-Hispanics– Majority speak only English
• In general, the Cape & Islands is a relatively healthy place to live:– Birth indicators are better than the State– Heart disease and diabetes mortality are low– Homicides, firearm, STDs lower than the State
• Some indicators are worse than the State :– Cancer incidence is higher for breast and prostate cancer – Higher motor vehicle deaths and suicides than the State– Higher Lyme Disease incidence than the State– Higher Emergency Department Visit rates for opioid-related and for asthma for
children ages 10-14 years– Higher Substance Abuse Treatment Program Admission rates than State
• We need to examine local variation and subgroups in the population to get a more complete picture of the health of the Cape & Islands region
• These are resident data and do not reflect the impact of visitors on the Cape & Islands

47
Health Disparities by Race/Ethnicity Cape & Islands
– Blacks on the Cape & Islands have higher Emergency Visit Rates for fall-related injuries than Blacks in MA
– White mothers on the Cape & Islands have higher rates for smoking during pregnancy than whites in MA

48
How Can You Access these Data?
• Hard Copies: (617) 624-5674
• TDD/TTY: (617) 624-6001
• Questions: (617) 624-6021
• For more detailed community data:http://masschip.state.ma.us
• DPH Website: http://www.mass.gov/dph/comm/health_dialogues.htm

49
Q/A
Related Documents