1 Social Security Disability Insurance Program Why Has Cost Risen So Much, and What Is Next? Steve Goss, Chief Actuary, Social Security Administration MAAC September 12, 2013

Welcome message from author
This document is posted to help you gain knowledge. Please leave a comment to let me know what you think about it! Share it to your friends and learn new things together.
Transcript

1
Social Security Disability Insurance Program
Why Has Cost Risen So Much, and What Is Next?
Steve Goss, Chief Actuary, Social Security Administration
MAAC September 12, 2013

2
How have we done projecting DI Trust Fund solvency? Figure 1: DI Trust Fund Ratio in 1995, 2008, 2012 Trustees Reports
0
50
100
150
200
250
1990 1995 2000 2005 2010 2015 2020 2025
Res
erve
s as
% o
f A
nn
ual
Co
st
1995TR
2008TR
2012TR"New Economy" irrational exuberance
2008 Recession back to reality

Most of the change since 1980 is due to increased population, population aging, and women working more
consistently
3

4
Is DI out of control, taking over OASDI?(Note 5% increase in DI cost for 2010 due to recession)
0
2
4
6
8
10
12
14
16
18
20
1980 2010 2040
Chart 1: DI Cost as a Percent of Total OASDI Cost
1995 TR
2012 TR
12.8
16.917.9
12.6 12.4

5
As usual, it is mostly about aging(Note the progression of the boomers from 1970-2030)
Figure 2: Age Distribution of the Population Age 25+, 1940 to 2100 (2012TR)
0
10
20
30
40
50
60
70
80
90
100
1940 1950 1960 1970 1980 1990 2000 2010 2020 2030 2040 2050 2060 2070 2080 2090 2100
Pe
rce
nt
of
Po
pu
lati
on
at
Ag
es
25
+
25-4425-44
45-64
65-84
85+
Boomers become 25-44
Boomers become 45-64
Boomers become 65-84

6
Increased work by women raised insured; partially offset by more undocumented
35%
40%
45%
50%
55%
60%
65%
70%
75%
80%
85%Figure 5: Percent of Population that is Insured for Disability
Male
Female

7
Incidence rates for women have risen to male level
Figure 8: New Disabled Workers per 1,000 Exposed (Incidence) Age-Adjusted (2000) - 2012 Trustees Report
2
3
4
5
6
7
8
1975
1980
1985
1990
1995
2000
2005
2010
2015
2020
2025
2030
2035
2040
2045
2050
2055
2060
2065
2070
2075
2080
2085
2090
New
Aw
ards
per
1,0
00 E
xpos
ed
Male
Female

8
Then Maybe it is Not all Due to Increased Awards Based on
Mental Impairments and “Back Pain”?

9
Young females: steady distribution by medical impairment
Figure 12: Female Age 30-39 disabled worker new entitlement distribution by primary diagnosis (awarded through June 2012)
9

10
Young males: steady but for HIV bulge in 1986-2000
Figure 13: Male Age 30-39 disabled worker new entitlement distribution by primary diagnosis (awarded through June 2012)
10
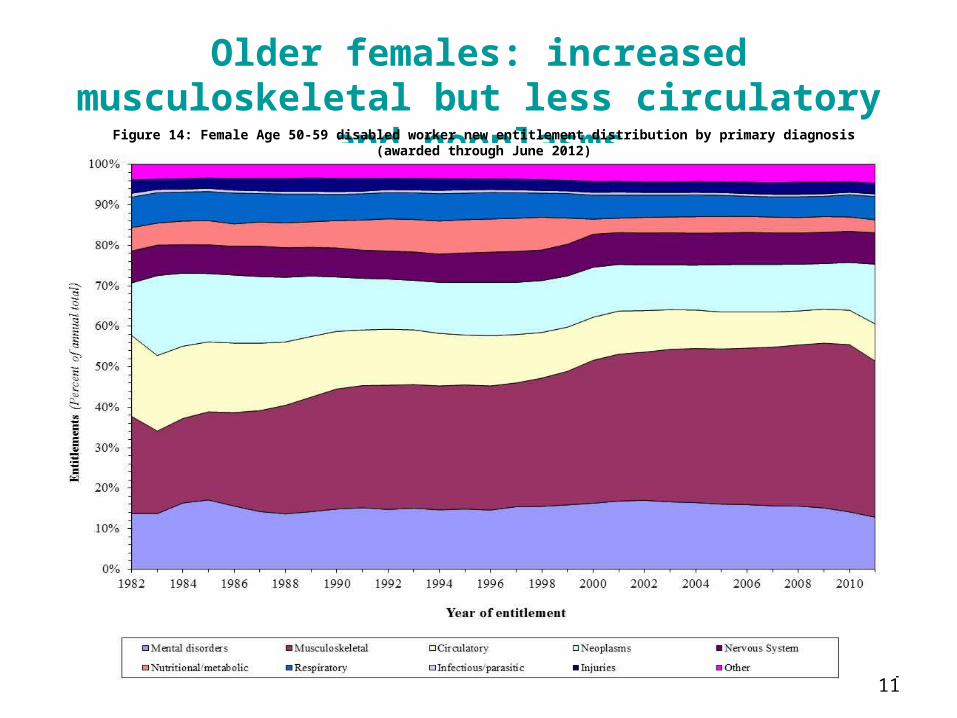
11
Older females: increased musculoskeletal but less circulatory and neoplasms
Figure 14: Female Age 50-59 disabled worker new entitlement distribution by primary diagnosis (awarded through June 2012)
11

12
Older males: increased musculoskeletal impairment; less cardiovascular
Figure 15: Male Age 50-59 disabled worker new entitlement distribution by primary diagnosis (awarded through June 2012)
12
One More Thought
• How will ACA affect Disability cost?– Will low-cost or no-cost health insurance
available to fill the gap until Medicare comes in make more able to stop working earlier to apply for disability?
– Or will near universal medical insurance and preventive care reduce the incidence of progressive disabling impairments???
• Which will be the stronger effect?

14
So where are we on DI? • Is the sky falling, cost out of control? No.
• Or are we following a path foreseen? Yes.
• Actuarial deficit for DI is 0.32 percent of payroll (0.12 percent of GDP) so we could:
• Increase tax rate or eliminate the tax max for DI• Lower the monthly benefit (PIA level)• Time-limit benefits, increase vocational grid ages,
experience rate employers, and/or adversarial ALJ (these would have some small effects)
• Note that increasing NRA shifts cost to DI
Related Documents