1 SIMS 247: Information Visualization and Presentation Politics and Public Policy Visualization Kristine Gual and Maria Lawrence Apr 21, 2004

Welcome message from author
This document is posted to help you gain knowledge. Please leave a comment to let me know what you think about it! Share it to your friends and learn new things together.
Transcript

1
SIMS 247: Information Visualization and Presentation
Politics and Public Policy Visualization
Kristine Gual and Maria Lawrence
Apr 21, 2004

2
Today
• GIS - Geographic Information Systems– Natural and Urban Resource Planning– Crime Mapping– Understanding Global Demographics– Political Strategy and Logistics
• Policy and Planning Simulations
• Visualizing Political Social Networks

3
GIS – Geographic Information Systems
• Systems that enable deeper understanding and analysis of spatially-related information.
• Links maps to databases and interactive features
• Layer multiple data types on top of geographic representations to explore relationships between places, structures, people and natural features
• Two primary image formats– Raster – grids of pixels, aerial
photographs and satellite images– Vector – points, lines, polygons,
showing features and attributes
Source: http://www.gis.com/whatisgis/index.html

4
GIS – Uses of spatial data analysis
• Emergency Services– Fire, Police, Disaster Relief
• Environmental– Monitoring & Modeling
• Business– Site Location, Delivery Systems
• Industries – Transportation, Communication, Mining, Pipelines, Healthcare
• Government – Local, State, Federal, Military– City and Regional Planning
• Education – – Research, Teaching Tool
Source: http://www.gis.com
5
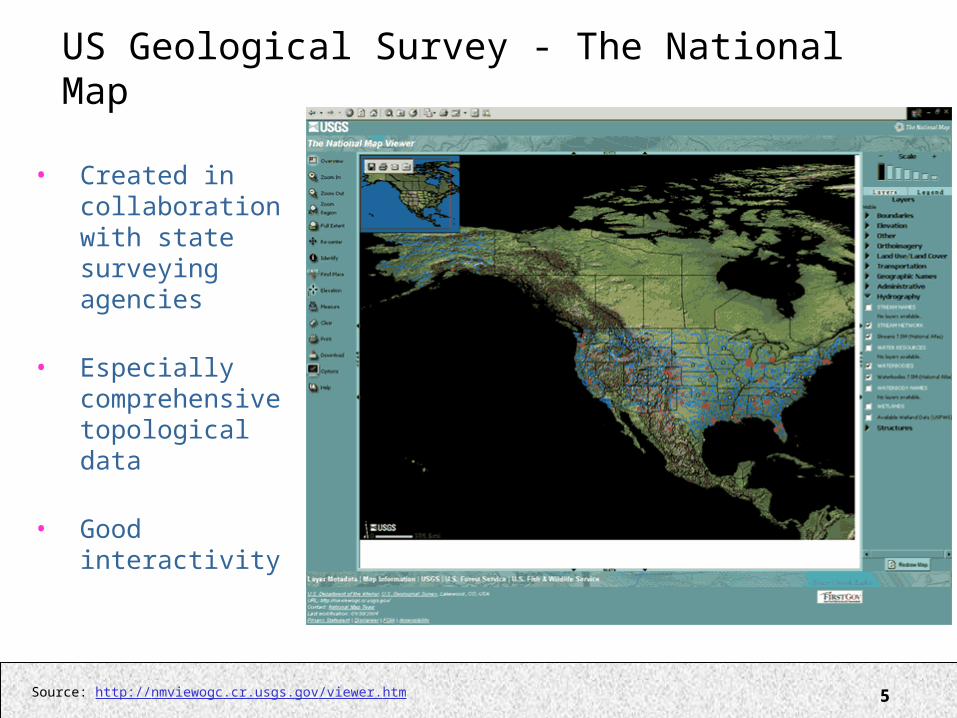
US Geological Survey - The National Map
• Created in collaboration with state surveying agencies
• Especially comprehensive topological data
• Good interactivity
Source: http://nmviewogc.cr.usgs.gov/viewer.htm

6
The UN Environment Programme – PREVIEW IMS
• Project for Risk Evalutation, Vulnerability Indexing and Early Warning
• Uses a GIS to identify risk and human vulnerability to natural hazards in relation to socioeconomic and physical factors.
Source: http://www.grid.unep.ch/activities/earlywarning/preview/ims/index.htm

7
Healthcare Resource Planning
• Mapping population density to hospitals provides decision support for investments in new hospitals
Source: http://gis.esri.com/library/userconf/proc01/professional/papers/pap929/p929.htm
8
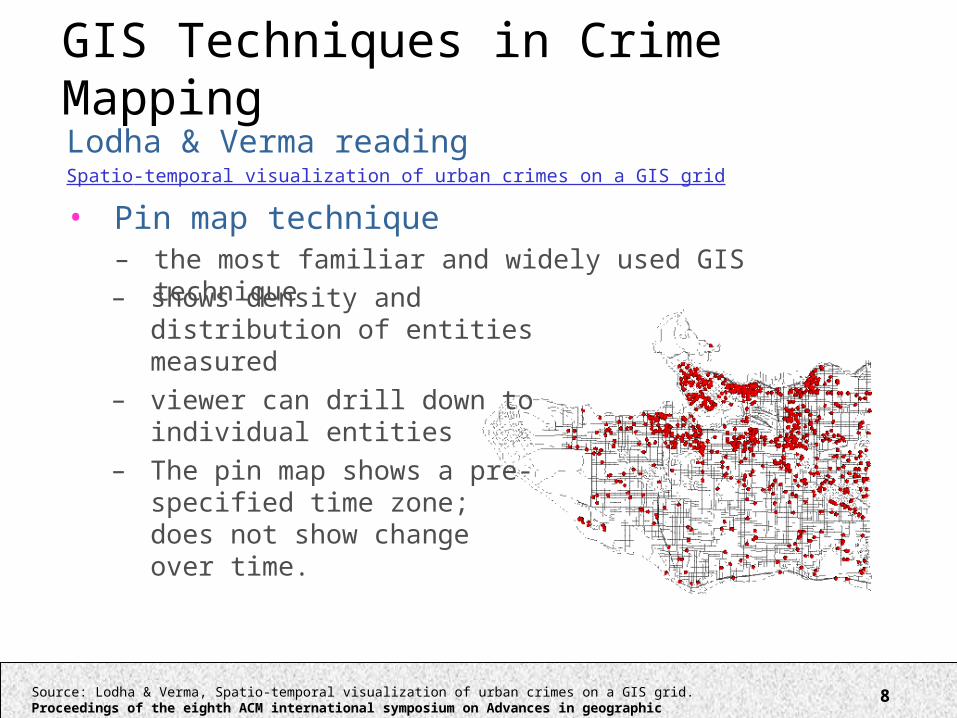
GIS Techniques in Crime MappingLodha & Verma readingSpatio-temporal visualization of urban crimes on a GIS grid
• Pin map technique– the most familiar and widely used GIS technique
Source: Lodha & Verma, Spatio-temporal visualization of urban crimes on a GIS grid. Proceedings of the eighth ACM international symposium on Advances in geographic information systems, 2000.
– shows density and distribution of entities measured
– viewer can drill down to individual entities
– The pin map shows a pre-specified time zone; does not show change over time.

9
GIS Techniques: Pin Map exampleSFPD Crime Mapshttp://gispubweb.sfgov.org/website/san_francisco_community/
• Visualize crime activity by address or neighborhood
Source: http://gispubweb.sfgov.org/website/san_francisco_community/
• Distinguishes between different criminal activity, by date
• Detailed view allows some description of individual incidents
• Allows PD to see crime trends and hotspots
• Allows communities to see the needs of their neighborhood
10
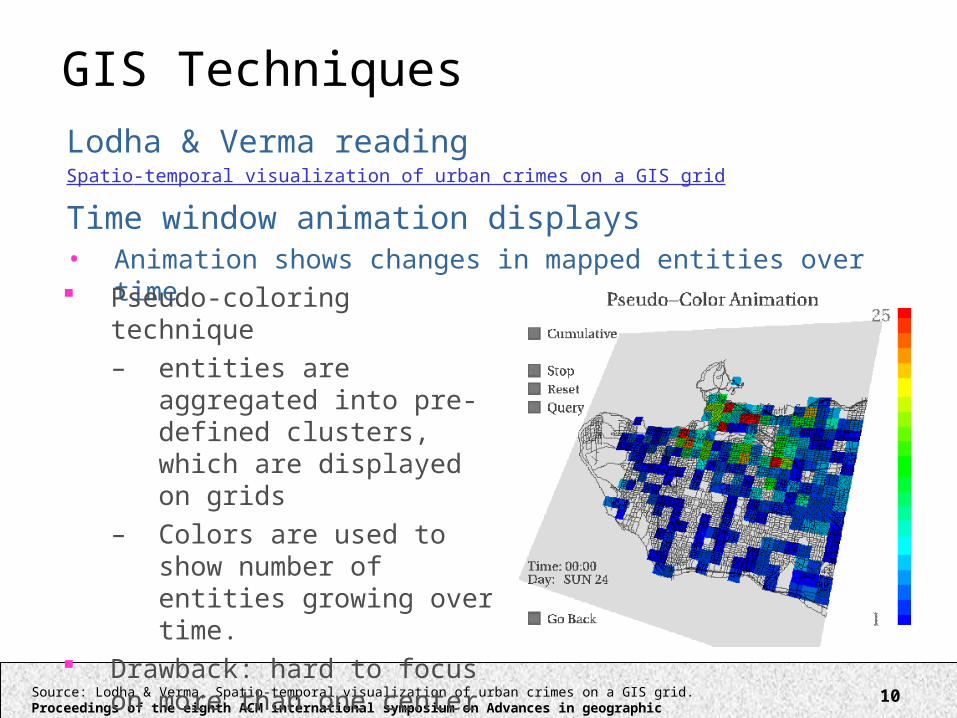
GIS TechniquesLodha & Verma readingSpatio-temporal visualization of urban crimes on a GIS grid
Time window animation displays• Animation shows changes in mapped entities over time
Source: Lodha & Verma, Spatio-temporal visualization of urban crimes on a GIS grid. Proceedings of the eighth ACM international symposium on Advances in geographic information systems, 2000.
Pseudo-coloring technique– entities are aggregated into
pre-defined clusters, which are displayed on grids
– Colors are used to show number of entities growing over time.
Drawback: hard to focus on more than one center of change at a time
Link to animation

11
GIS TechniquesLodha & Verma readingSpatio-temporal visualization of urban crimes on a GIS grid
3-D Time-aggregated bars• Stacked bars indicate aggregated entities in a period of
time, sorted by entity type
Source: Lodha & Verma, Spatio-temporal visualization of urban crimes on a GIS grid. Proceedings of the eighth ACM international symposium on Advances in geographic information systems, 2000.
Colors show types of entities. Height of a color indicates the number of entities within the time period.
Could also sort entities by order they occur within the time period (stacked order-preserving bars)
Could show time as a vertical axis, which would show gaps in event occurences.
12
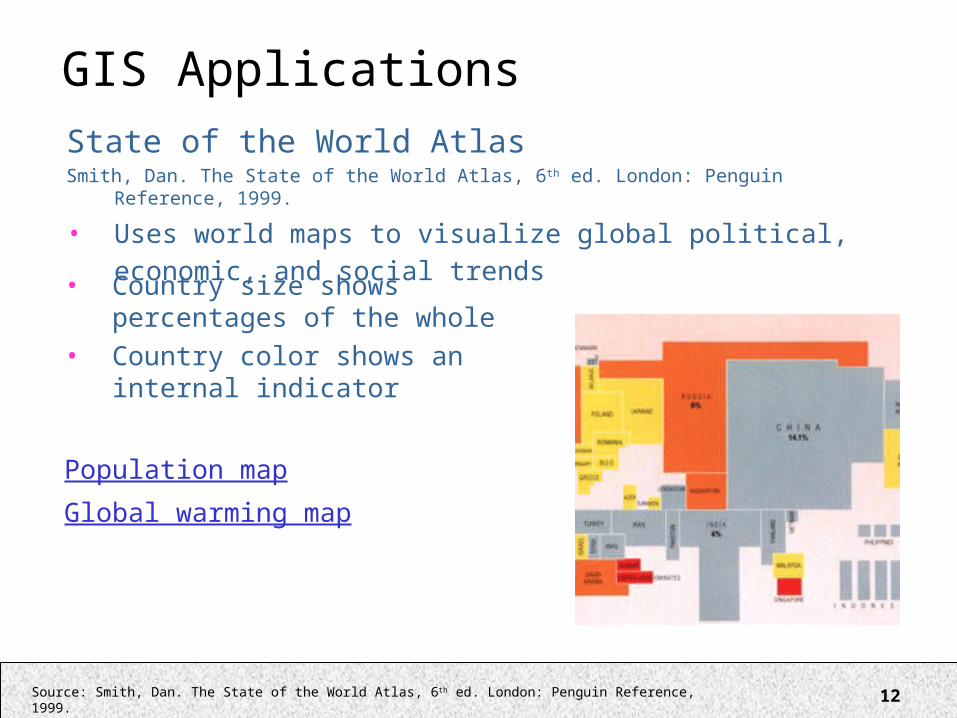
GIS ApplicationsState of the World AtlasSmith, Dan. The State of the World Atlas, 6th ed. London: Penguin Reference, 1999.
• Uses world maps to visualize global political, economic, and
social trends
Source: Smith, Dan. The State of the World Atlas, 6th ed. London: Penguin Reference, 1999.
• Country size shows percentages of the whole
• Country color shows an internal indicator
Population map
Global warming map

13
Caliper’s Maptitude
• Redistricting is a classic political activity
• GIS allows political strategists to tweak various characteristics such as race, average income and party affiliation
• System redraws districts accordingly
Source: http://www.caliper.com/Redistricting/citycounty_edition.htm
14
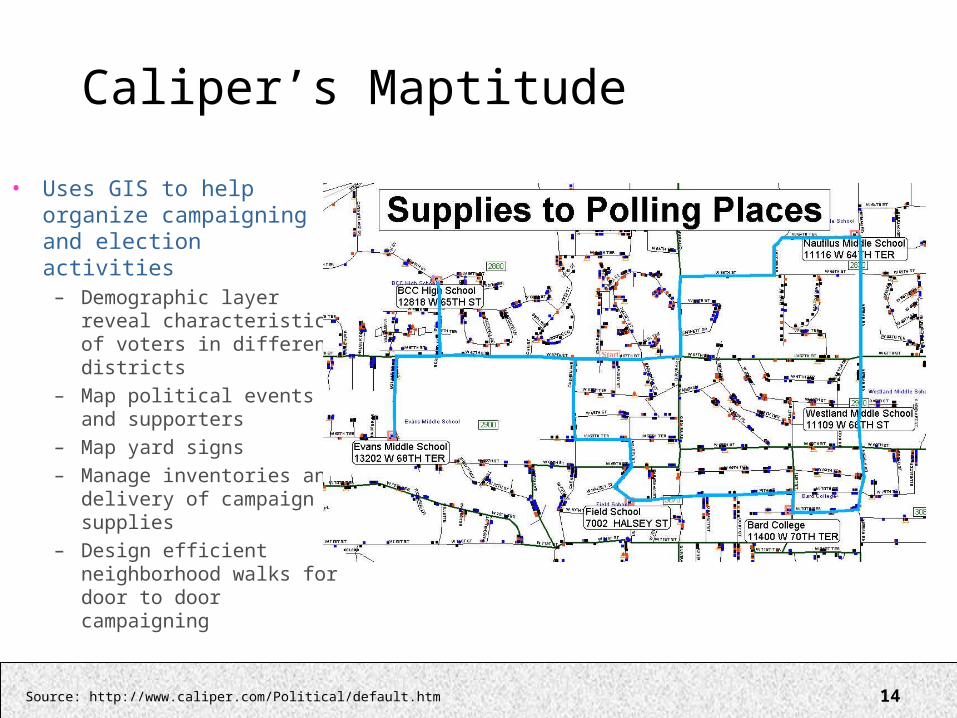
Caliper’s Maptitude
• Uses GIS to help organize campaigning and election activities– Demographic layer
reveal characteristics of voters in different districts
– Map political events and supporters
– Map yard signs– Manage inventories
and delivery of campaign supplies
– Design efficient neighborhood walks for door to door campaigning
Source: http://www.caliper.com/Political/default.htm

15
SimulationsSimulations allow users to see the future impact of possible scenarios for decision-making (policy and
other fields).
• Simulation modeling has traditionally relied on UML modeling• Accuracy and validity are major issues in simulation model design
– Is the conceptual model valid?– Are the scenarios and accompanying data accurate?
• There has been some recent work in visualized, interactive simulations for policy decision-making• Examples:
– Urban Planning Traffic flow simulation applet– Effects of Different Policies – US Oil Policy Simulation
Source: Law & McComas, Building valid models: how to build valid and credible simulation models. ACM Winter Simulation Conference, 2001.
16
Visualization of Political Networks
Visualizing political networks is useful because it:• Makes invisible relationships and transactions
visible• Helps viewers understand complex
relationships between political forces

17
Visualization of Political NetworksVisualizations are often hand-drawn graphics:
Source: From Conason, “Notes on a Native Son,” Harper’s Magazine, February 2000.
18
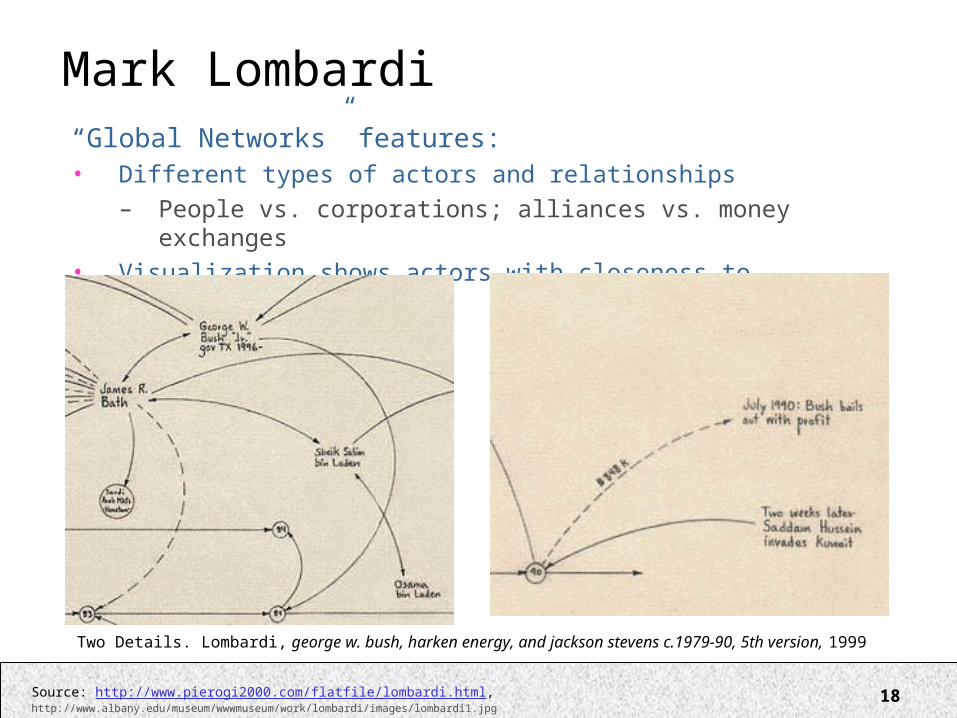
Mark Lombardi“Global Networks” features:• Different types of actors and relationships
– People vs. corporations; alliances vs. money exchanges• Visualization shows actors with closeness to different groups
Source: http://www.pierogi2000.com/flatfile/lombardi.html, http://www.albany.edu/museum/wwwmuseum/work/lombardi/images/lombardi1.jpg
Two Details. Lombardi, george w. bush, harken energy, and jackson stevens c.1979-90, 5th version, 1999

19
Mark Lombardi“Global Networks” features, cont.:• Hundreds of nodes and relationships
Source: http://www.pierogi2000.com/flatfile/lombardi.html
Lombardi, chicago outfit and satellite regimes, c.1981-83, 1998

20
Mark Lombardi“Global Networks” features, cont.:• Timelines• Symmetrical, aesthetically pleasing displays
Source: http://www.pierogi2000.com/flatfile/lombardi.html
Lombardi, george w. bush, harken energy, and jackson stevens c.1979-90, 5th version, 1999

21
Mark LombardiReactions to “Global Networks”:• Excellent tool for capturing thousands of pages of disparate
sources and research• But the complete view of the visualizations was very
overwhelming. It’s impossible to absorb all the information!• Detailed view, while smaller, was possible to digest
Source: http://www.pierogi2000.com/flatfile/lombardi.html, http://www.albany.edu/museum/wwwmuseum/work/lombardi/
Would it be possible to generate “Global Networks” dynamically?
Lombardi, “ george w. bush, harken energy, and jackson stevens c.1979-90”

22
Community decision-making toolsExample: Healthy Communities application
• Uses gauges to indicate optimal and sub-optimal measures of different quality of life indicators– Economic, environmental, health, public safety indicators
• User can drill down to detailed view of information– Historical views– Comparisons to other communities
• Healthy Communities prototype
Related Documents