1 SELECTRODIALYSIS AND BIPOLAR MEMBRANE ELECTRODIALYSIS 1 COMBINATION FOR INDUSTRIAL PROCESS BRINES TREATMENT: 2 MONOVALENT-DIVALENT IONS SEPARATION AND ACID AND BASE 3 PRODUCTION 4 5 Mònica Reig 1,* , César Valderrama 1 , Oriol Gibert 1,2 , José Luis Cortina 1,2 6 7 1 Chemical Engineering Dept., UPC-Barcelona TECH, Av. Diagonal 647, 08028 Barcelona, Spain 8 2 CETAQUA Carretera d'Esplugues, 75, 08940 Cornellà de Llobregat, Spain 9 *Corresponding author: Tel.:+34 93 4016997; E-mail address: [email protected] 10 11 12 ABSTRACT 13 Chemical industries generate large amounts of wastewater rich in different chemical 14 constituents. Amongst these, salts at high concentrations are of major concern, making 15 necessary the treatment of saline effluents before discharge. Because most of these rejected 16 streams comprise a combination of more than one salt at high concentration, it is reasonable 17 to try to separate and revalorize them to promote circular economy at industry site level. For 18 this reason, ion-exchange membranes based technologies were integrated in this study: 19 selectrodialysis (SED) and electrodialysis with bipolar membranes (EDBM). Different 20 process brines composed by Na 2 SO 4 and NaCl at different concentrations were treated first by 21 SED to separate each salt, and then by EDBM to produce base (NaOH) and acids (HCl and 22 H 2 SO 4 ) from each salt. The optimum of both electrolyte nature and concentration of the SED 23 stack streams was evaluated. Results indicated that it was possible to separate Cl - and SO 4 2- 24 depending on the anionic membrane, initial electrolytes and concentrations of each stream. 25 Pure NaOH and a mixture of HCl and H 2 SO 4 with different purities could be obtained. Energy 26 consumption evolutions were plotted and an optimal zone work was found where the 27 consumption values were acceptable. 28 Keywords: Divalent-monovalent ion fractionation, Acid-base production, Monovalent ion 29 selectivity, High and low concentration, Valorization, Circular economy 30

Welcome message from author
This document is posted to help you gain knowledge. Please leave a comment to let me know what you think about it! Share it to your friends and learn new things together.
Transcript
1
SELECTRODIALYSIS AND BIPOLAR MEMBRANE ELECTRODIALYSIS 1
COMBINATION FOR INDUSTRIAL PROCESS BRINES TREATMENT: 2
MONOVALENT-DIVALENT IONS SEPARATION AND ACID AND BASE 3
PRODUCTION 4
5
Mònica Reig1,*, César Valderrama1, Oriol Gibert1,2, José Luis Cortina1,2 6
7 1Chemical Engineering Dept., UPC-Barcelona TECH, Av. Diagonal 647, 08028 Barcelona, Spain 8 2CETAQUA Carretera d'Esplugues, 75, 08940 Cornellà de Llobregat, Spain 9
*Corresponding author: Tel.:+34 93 4016997; E-mail address: [email protected] 10
11
12
ABSTRACT 13
Chemical industries generate large amounts of wastewater rich in different chemical 14
constituents. Amongst these, salts at high concentrations are of major concern, making 15
necessary the treatment of saline effluents before discharge. Because most of these rejected 16
streams comprise a combination of more than one salt at high concentration, it is reasonable 17
to try to separate and revalorize them to promote circular economy at industry site level. For 18
this reason, ion-exchange membranes based technologies were integrated in this study: 19
selectrodialysis (SED) and electrodialysis with bipolar membranes (EDBM). Different 20
process brines composed by Na2SO4 and NaCl at different concentrations were treated first by 21
SED to separate each salt, and then by EDBM to produce base (NaOH) and acids (HCl and 22
H2SO4) from each salt. The optimum of both electrolyte nature and concentration of the SED 23
stack streams was evaluated. Results indicated that it was possible to separate Cl- and SO42- 24
depending on the anionic membrane, initial electrolytes and concentrations of each stream. 25
Pure NaOH and a mixture of HCl and H2SO4 with different purities could be obtained. Energy 26
consumption evolutions were plotted and an optimal zone work was found where the 27
consumption values were acceptable. 28
Keywords: Divalent-monovalent ion fractionation, Acid-base production, Monovalent ion 29
selectivity, High and low concentration, Valorization, Circular economy 30
2
1. INTRODUCTION/BACKGROUND 1
Process industries (e.g., chemical, metallurgical, mining, petrochemical, food and beverage, 2
etc.) use established wastewater treatments to reduce the organic load by using biological 3
technologies. However, treated waters are still characterized by high total inorganic dissolved 4
solids (sodium chloride (NaCl), sodium sulfate (Na2SO4), calcium chloride (CaCl2), sodium 5
nitrate (NaNO3), etc.) and direct discharge to the medium is not a disposal option. These 6
brines formed during processing or especially by neutralization of acid/base streams contain 7
high strong electrolytes concentrations and therefore their treatment and disposal routes are 8
limited and new treatment technologies are need. Traditionally, the industrial concentrates are 9
discharged into natural water bodies (with or without dilution depending on the discharge 10
regulations) [1–2] although this method is not environmentally friendly due to the needs to 11
fulfill the higher requirements on water quantities and quality [3]. Then, under the fact that 12
environmental protection and industrial sustainability has become a priority worldwide, 13
considerable efforts have been made to develop new brine management technologies with the 14
aim to avoid or at least minimize any discharge of high salinity streams into the environment 15
when possible. 16
Brine management reviews [4–6] show that thermal processes (e.g., evaporation and 17
distillation) have been widely researched for water recovery and brine volume reduction. 18
These solutions allow brine volume reduction after water recovery for reuse and generation of 19
a dry salt waste, when a zero liquid discharge (ZLD) scheme is reached, or a wet salt waste, 20
when a ZLD scheme is not achieved. However, the high associated capital expenditures 21
(CAPEX) and operating expenditures (OPEX) of these treatment solutions make them limited 22
[4,7]. Moreover, under the new paradigm of circular economy, postulated through, the 23
sustainable process industry resource and energy efficiency (SPIRE) program of the European 24
union industry, resource recovery is the objective to be achieved [8]. Solutions pursued are 25
focused not only on the recovery of water but also on the recovery of the salts present in the 26
brines as pure byproducts. Successful production of pure salts will be achieved only if tailor-27
made separation processes are implemented. 28
Ion exchangers, widely used in industrial applications for decades, accomplish the separation 29
of salts by exhibiting different affinity towards the salts to be separated [9,10]. However, for 30
the case of the couple chloride/sulfate most of the anion exchange resins commercialized give 31
3
limited possibilities. Alternatively, membrane technologies have become a key separation 1
process when salinity removal is the target objective. Their applications, particularly of 2
reverse osmosis (RO) and nanofiltration (NF), have increased significantly compared to other 3
water treatment technologies. Both are widely used to produce water with low salinity content 4
[11] and to improve the quality of process waters. However, RO use is limited when the 5
objective is the selective recovery of a given target species. In this case, the alternative 6
separation process is directed to the use of schemes where only a given component or group 7
of components are removed specifically. When the selected or target group are charged 8
species (anions and cations) ion-exchange materials and processes as electrodialysis (ED) are 9
the most appropriate options [4]. ED and its related technologies are electrochemical 10
membrane separation processes in which ions are transferred through selective ion-exchange 11
membranes from one solution to another using an electric field as the driving force [12]. 12
Under the influence of an electrical potential difference, the overall result is an enrichment of 13
ions in a concentrate stream and a depletion of ions in a diluate stream. The major application 14
of conventional ED has historically been concentration of NaCl from seawater prior to 15
evaporation to produce table salt in Japan for decades [13–16]. Nowadays, ED and RO are 16
competing techniques for the production of potable water from brackish water sources 17
[12,17]. In addition, ED is having a growth implementation in bio-based process industries to 18
purify, separate and concentrate byproducts (e.g. whey demineralization [18] and 19
deacidification of fruit juice [19]). 20
If selective ion separation is the objective, a conventional ED stack presents limitations for 21
ions with the same size and charge sign. However, a new combination of membranes referred 22
to as selectrodialysis (SED) can be used to separate monovalent from divalent ions as it was 23
postulated by Zhang et al. [20]. This membrane configuration has an anionic monovalent 24
membrane between the standard cationic and anionic membranes [21]. Then, once the 25
monovalent and divalent streams have been separated, an ED system including a bipolar 26
membrane (EDBM) between the two standards cationic and anionic can be used to produce 27
acid and base chemicals. A bipolar membrane is formed by an anionic exchange membrane 28
and a cationic one, and when current density is applied in the electrodes, water splitting takes 29
place. Under such arrangement, EDBM is able to produce acid and base from the feed salt due 30
to the water splitting in the bipolar membrane during the EDBM process [22]. EDBM has 31
4
shown successful applications, mainly situated in the biotechnology and chemical process 1
industries. The largest potential application includes the recovery of organic acids and bases 2
from salts obtained in synthesis steps, e.g., the recovery of aminoacids, tartaric acid and 3
succinic acid from fermentation broths [23–25], which is accompanied by the production of 4
NaOH as a byproduct, which is in turn recycled to the fermenter to control the pH of the 5
process. However, the main challenge on EDBM application is the recycling of salt brines as 6
acids and bases to avoid a waste disposal problem. Moreover, the on-site production of 7
chemicals could be economically beneficial as the market prices of the raw materials are 8
gradually increasing. 9
In this study, a mixture of NaCl and Na2SO4 have been treated by a combination of SED, to 10
achieve the separation of chloride /sulfate, and EDBM, to produce acid and base from the 11
SED products. A three-compartment configuration has been used to produce acid and base 12
from the feed salt due to the water splitting in the bipolar membrane during the EDBM 13
process. 14
15
16 2. EXPERIMENTAL 17
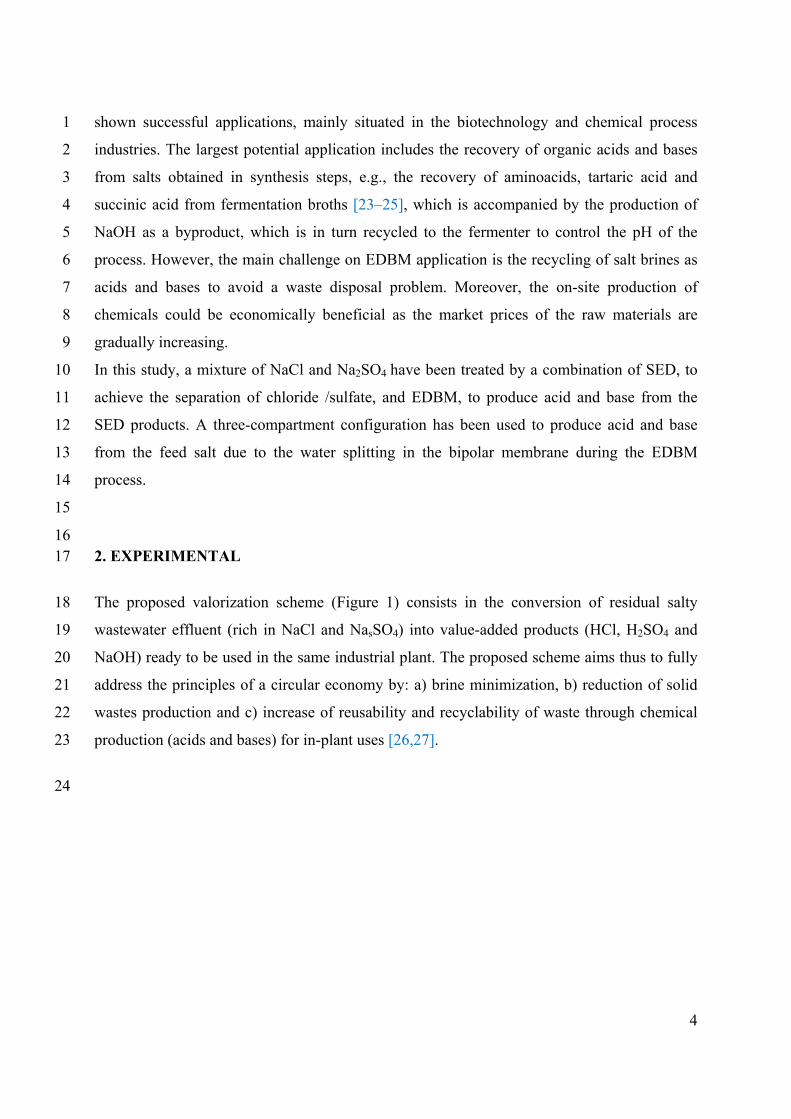
The proposed valorization scheme (Figure 1) consists in the conversion of residual salty 18
wastewater effluent (rich in NaCl and NasSO4) into value-added products (HCl, H2SO4 and 19
NaOH) ready to be used in the same industrial plant. The proposed scheme aims thus to fully 20
address the principles of a circular economy by: a) brine minimization, b) reduction of solid 21
wastes production and c) increase of reusability and recyclability of waste through chemical 22
production (acids and bases) for in-plant uses [26,27]. 23
24
5
1
Figure 1. Schematic illustration of the wastewater effluent valorization by ED processes 2
3
Sodium chloride- and sodium sulfate-rich industry process brines were obtained from a 4
chemical company, kept anonymous by a confidentiality agreement. These brines were 5
generated in a dye synthesis step where initially sodium chloride and sodium thiosulfate 6
brines were produced. After a chemical oxidation process using sulfuric solutions, thiosulfate 7
was oxidized to sulfate producing a precipitated elemental S(s) byproduct, which was 8
removed by filtration. 9
Experiments with feed solutions consisting of different concentration wastewater effluents 10
from the chemical company were conducted by a lab-scale SED stack to produce two separate 11
streams (NaCl-rich stream and Na2SO4-rich stream) followed by EDBM to produce HCl and 12
H2SO4 as it is shown in Figure 1. 13
14
2.1 Experimental set-up description and operation 15
The ED set-up used was a PCCell ED 64-004 (PCCell GmbH, Germany) with a cell of 11 x 16
11 cm. The stack consisted of a 4 chambers system with 3 cell triplets with an active 17
membrane area of 64 cm2 per membrane. By means of this equipment it was possible to 18
perform the SED and also the EDBM experiments only by changing the membranes 19
employed in each case. Main characteristics of the membrane as functional group type, 20
6
electrical resistance, burst strength and thickness are listed in Table 1. 1
2
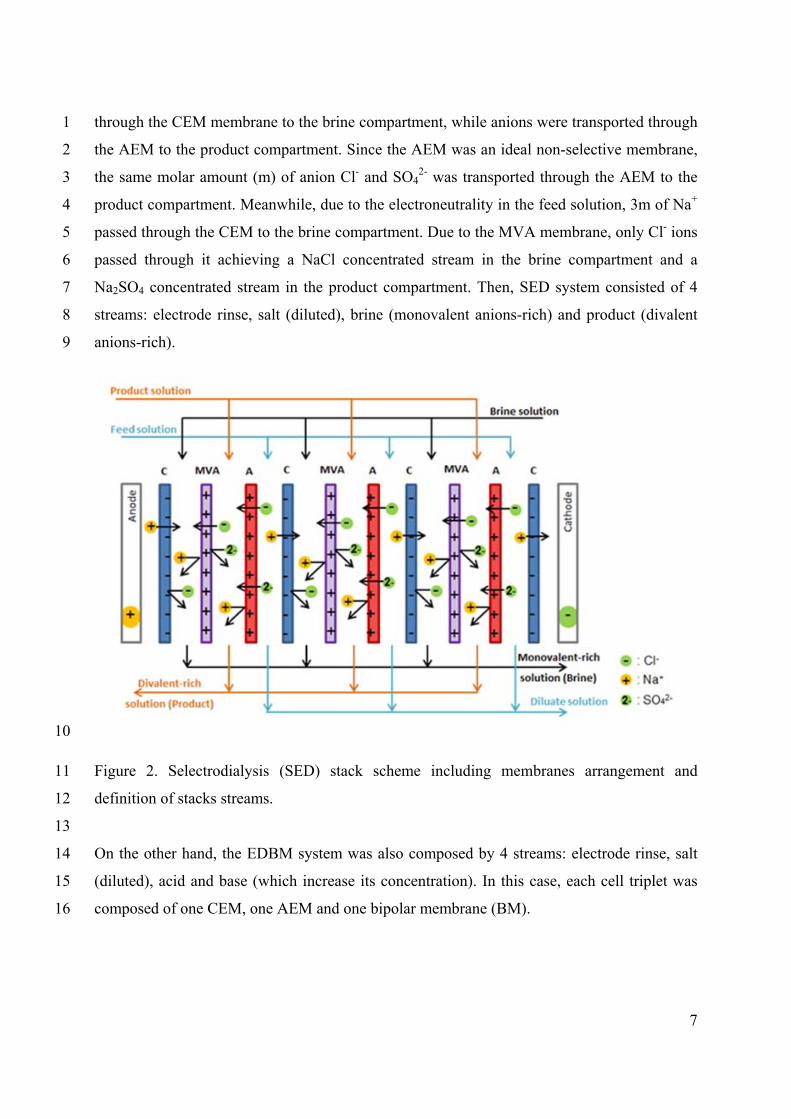
Table 1. Main characteristics of the SED and EDBM membrane used 3
Standard anionic and cationic
membranes (AEM, CEM)
Selective membrane
(MVA)
Bipolar membrane (BP)
PC SA PC SK PC MVA PC BP
Type Strongly alkaline
(ammonium) Strongly acidic (sulfonic acid)
Strongly alkaline (ammonium) Water splitting
efficiency > 95 %
Water splitting voltage: 0.8 – 1 V
General use Standard
desalination Standard
desalination Monovalent
anion selective Electric resistance
(Ω cm2) ~ 1.8 ~ 2.5 ~ 20
Burst strength (MPa)
0.4 – 0.5 0.4 – 0.5 0.2
Maximum operating
temperature (ºC) 60 50 40 40
Thickness (mm) 0.18 – 0.22 0.16 – 0.20 0.11 0.20 – 0.35 4
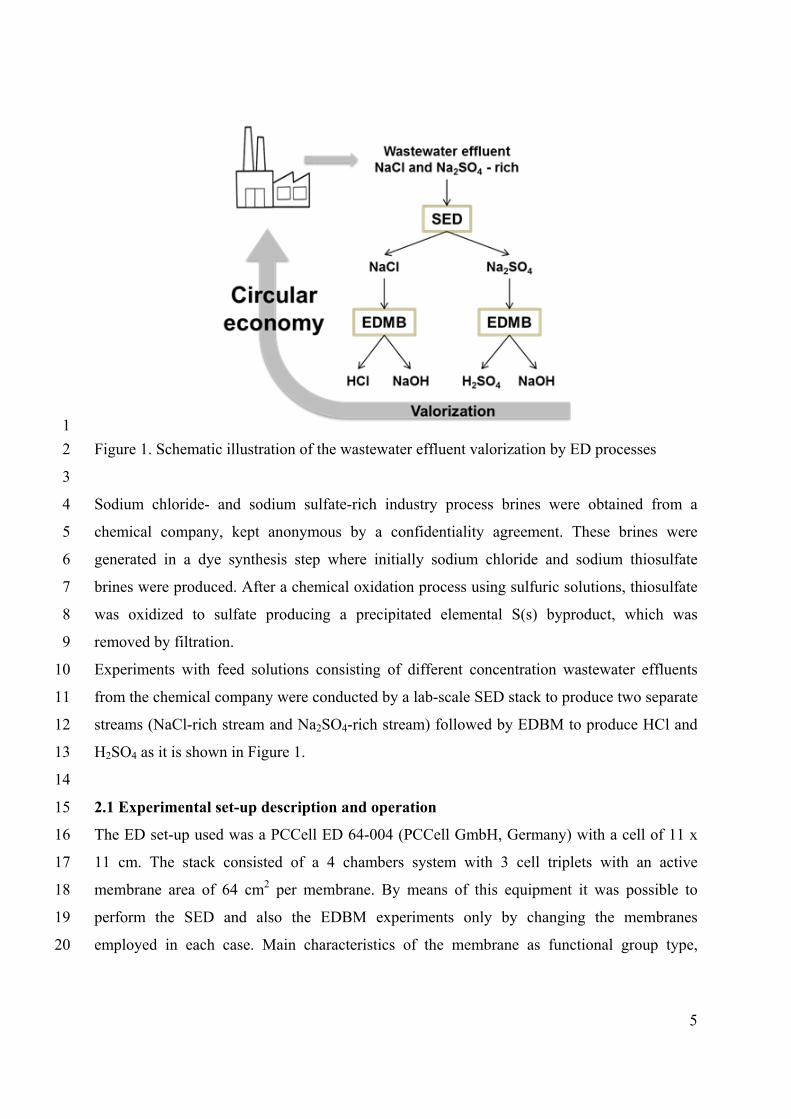
The membrane configuration in the SED stack was based on a conventional ED but 5
incorporating one monovalent selective anion exchange membrane (MVA) between a 6
standard anion exchange membrane (AEM) and a standard cation one (CEM). All the 7
membranes were supplied by PCCell. CEM and AEM were regarded as having no selectivity 8
to their counter-ions (they were assumed to be an ideal non-selective CEM and an ideal non-9
selective AEM, respectively) whereas the MVA had a limited selectivity to monovalent 10
anions, i.e., monovalent anions (e.g., Cl-) have a higher transport number than multivalent 11
anions (e.g., SO42-). The proposed configuration for the Cl-/SO4
2- separation is shown in 12
Figure 2, the feed and the product streams comprised a Cl-/SO42- mixture with cation Na+. The 13
purpose of such configuration was to enrich SO42- while removing Cl- in the product 14
compartment. The MVA was a monovalent selective anion exchange membrane with a 15
selective factor of “n”. Selective factor (n) is a simplified parameter to reflect membrane 16
selectivity, which is calculated by the ion molar amount ratio which two types of ions are 17
transported through the membrane. This MVA–AEM–CEM unit was a repeating membrane 18
trio in the SED stack which had three compartments (denoted as feed, product and brine). By 19
applying an electrical potential, Cl- and SO42- anions were attracted to the anode whereas Na+ 20
cations were attracted to the cathode. In the feed compartment, cations were transported 21
7
through the CEM membrane to the brine compartment, while anions were transported through 1
the AEM to the product compartment. Since the AEM was an ideal non-selective membrane, 2
the same molar amount (m) of anion Cl- and SO42- was transported through the AEM to the 3
product compartment. Meanwhile, due to the electroneutrality in the feed solution, 3m of Na+ 4
passed through the CEM to the brine compartment. Due to the MVA membrane, only Cl- ions 5
passed through it achieving a NaCl concentrated stream in the brine compartment and a 6
Na2SO4 concentrated stream in the product compartment. Then, SED system consisted of 4 7
streams: electrode rinse, salt (diluted), brine (monovalent anions-rich) and product (divalent 8
anions-rich). 9
10
Figure 2. Selectrodialysis (SED) stack scheme including membranes arrangement and 11
definition of stacks streams. 12
13
On the other hand, the EDBM system was also composed by 4 streams: electrode rinse, salt 14
(diluted), acid and base (which increase its concentration). In this case, each cell triplet was 15
composed of one CEM, one AEM and one bipolar membrane (BM). 16
8
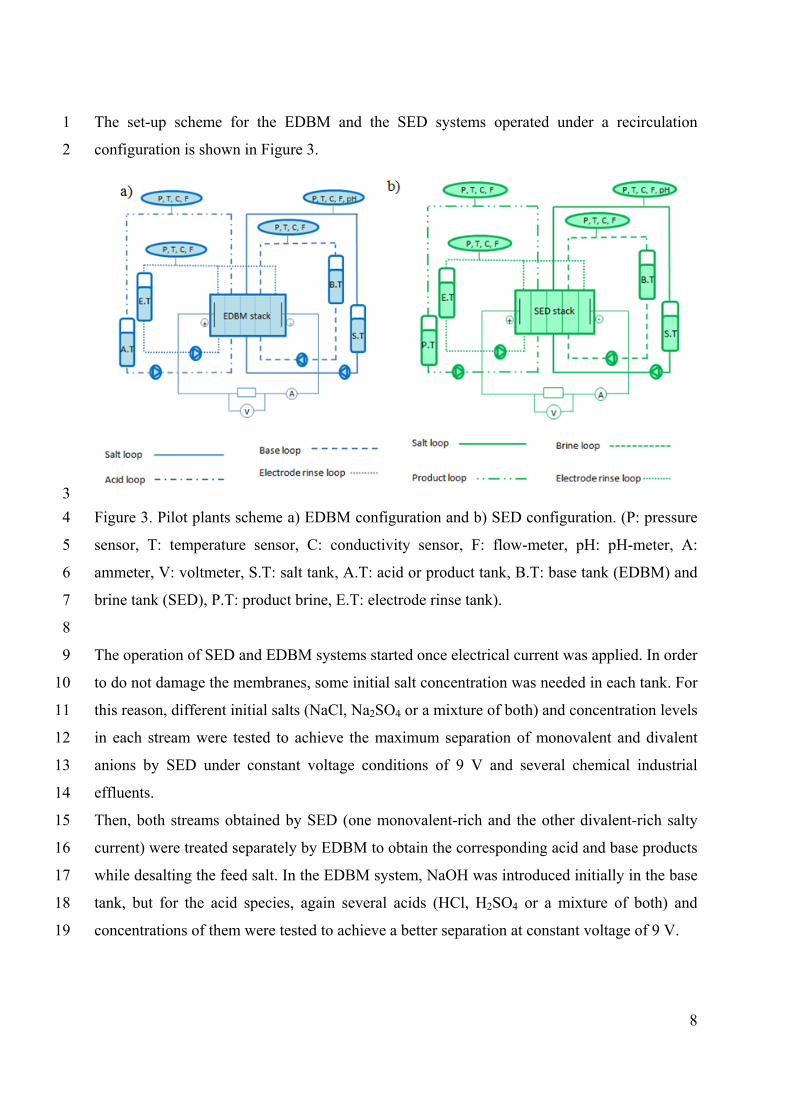
The set-up scheme for the EDBM and the SED systems operated under a recirculation 1
configuration is shown in Figure 3. 2
3
Figure 3. Pilot plants scheme a) EDBM configuration and b) SED configuration. (P: pressure 4
sensor, T: temperature sensor, C: conductivity sensor, F: flow-meter, pH: pH-meter, A: 5
ammeter, V: voltmeter, S.T: salt tank, A.T: acid or product tank, B.T: base tank (EDBM) and 6
brine tank (SED), P.T: product brine, E.T: electrode rinse tank). 7
8
The operation of SED and EDBM systems started once electrical current was applied. In order 9
to do not damage the membranes, some initial salt concentration was needed in each tank. For 10
this reason, different initial salts (NaCl, Na2SO4 or a mixture of both) and concentration levels 11
in each stream were tested to achieve the maximum separation of monovalent and divalent 12
anions by SED under constant voltage conditions of 9 V and several chemical industrial 13
effluents. 14
Then, both streams obtained by SED (one monovalent-rich and the other divalent-rich salty 15
current) were treated separately by EDBM to obtain the corresponding acid and base products 16
while desalting the feed salt. In the EDBM system, NaOH was introduced initially in the base 17
tank, but for the acid species, again several acids (HCl, H2SO4 or a mixture of both) and 18
concentrations of them were tested to achieve a better separation at constant voltage of 9 V. 19
9
For both SED and EDBM systems, 1 L of initial solution was introduced in each tank. All 1
reagents used were of quality analysis (PA-ACS-ISO reagent, PANREAC). For the electrode 2
rinse compartment, 0.42 M Na2SO4 was used in all the tests. Flow rates were set at 100 L/h in 3
the electrode rinse stream and 15-20 L/h in the others. As it can be seen in Figure 3, pressure, 4
temperature and conductivity were monitored during the experimentation by means of sensors 5
located in each stream of the ED set-up. Besides, the pH in the salt stream and the electrical 6
current and voltage for all the system were also monitored. Samples of each tank were taken 7
during the performance until the conductivity in the feed tank was almost zero and then 8
analyzed to know the concentration of each stream. 9
10
2.2 Experimental protocols and methodologies 11
Separation of Cl-/SO42- mixtures was carried out by SED. Three feed solution qualities were 12
assessed, namely: low concentrated effluent (with 63 mM Cl- and 26 mM SO42-), medium 13
concentrated effluent (with 151 mM Cl- and 230 mM SO42-) and high concentrated effluent 14
(with 497 mM Cl- and 840 mM SO42-). Process NaCl/Na2SO4 brines used in this study were 15
characterized by very low levels of divalent cations e.g., Mg(II) and Ca(II) as water used in 16
the synthesis process was demineralized water. Values of both metals were always below 3 17
mg/L (0.075 mM Ca2+; 0.123 mM Mg2+). 18
For the brine compartment an initial pure NaCl solution was used, since this compartment it 19
would become the monovalent-rich during the experiment because of the membrane disposal. 20
The product loop was initially filled with a NaCl, a Na2SO4 or a mixture of both solutions. 21
The product compartment would become the divalent-rich with the experimental time, and 22
due to the membrane disposal the Cl- ions could pass through the MVA and led the 23
compartment without monovalent ions. For this reason, several experiments were carried out 24
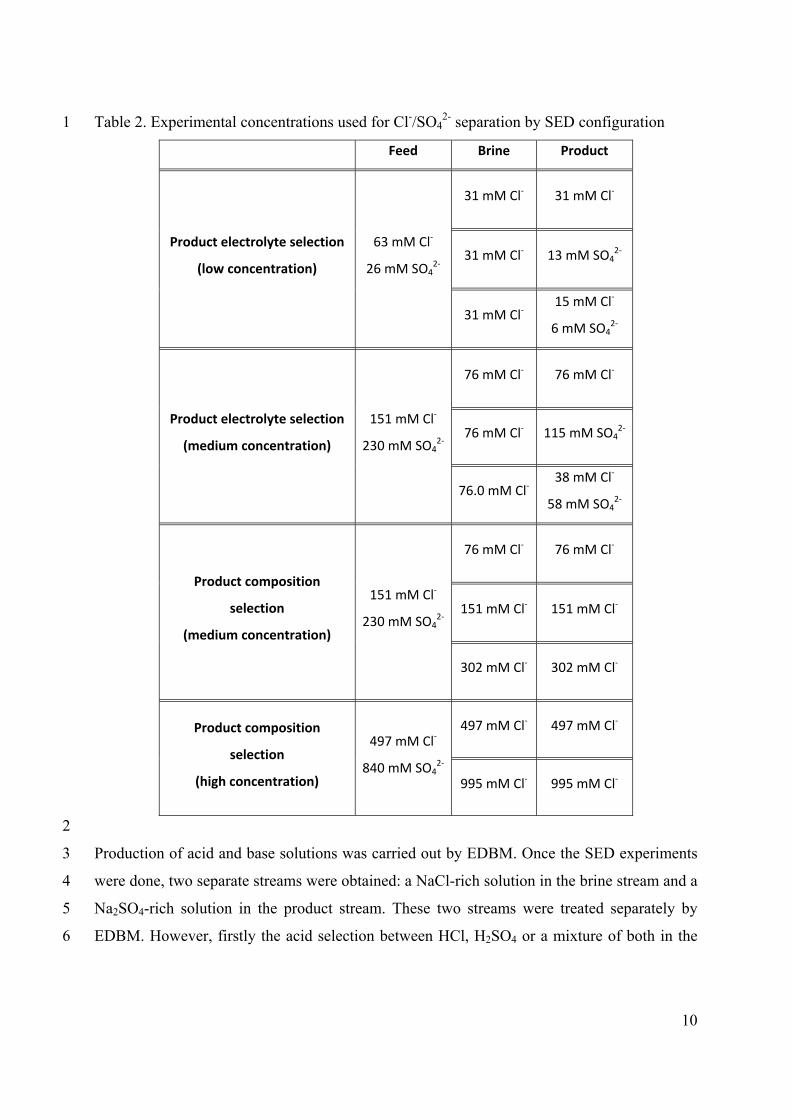
to determine the initial salt that offered the best Cl-/SO42- separation (Table 2). Once the 25
optimal initial salt was determined to be pure NaCl, more experiments were carried out to 26
determine its optimal concentration to achieve the maximum monovalent/divalent anions 27
separation. In this case, the initial brine and product streams concentration were varied. Table 28
2 collects the experimental design for the SED tests for both, product electrolyte and 29
composition selection. 30
31
10
Table 2. Experimental concentrations used for Cl-/SO42- separation by SED configuration 1
Feed Brine Product
Product electrolyte selection
(low concentration)
63 mM Cl‐
26 mM SO42‐
31 mM Cl‐ 31 mM Cl‐
31 mM Cl‐ 13 mM SO42‐
31 mM Cl‐ 15 mM Cl‐
6 mM SO42‐
Product electrolyte selection
(medium concentration)
151 mM Cl‐
230 mM SO42‐
76 mM Cl‐ 76 mM Cl‐
76 mM Cl‐ 115 mM SO42‐
76.0 mM Cl‐38 mM Cl‐
58 mM SO42‐
Product composition
selection
(medium concentration)
151 mM Cl‐
230 mM SO42‐
76 mM Cl‐ 76 mM Cl‐
151 mM Cl‐ 151 mM Cl‐
302 mM Cl‐ 302 mM Cl‐
Product composition
selection
(high concentration)
497 mM Cl‐
840 mM SO42‐
497 mM Cl‐ 497 mM Cl‐
995 mM Cl‐ 995 mM Cl‐
2
Production of acid and base solutions was carried out by EDBM. Once the SED experiments 3
were done, two separate streams were obtained: a NaCl-rich solution in the brine stream and a 4
Na2SO4-rich solution in the product stream. These two streams were treated separately by 5
EDBM. However, firstly the acid selection between HCl, H2SO4 or a mixture of both in the 6
11
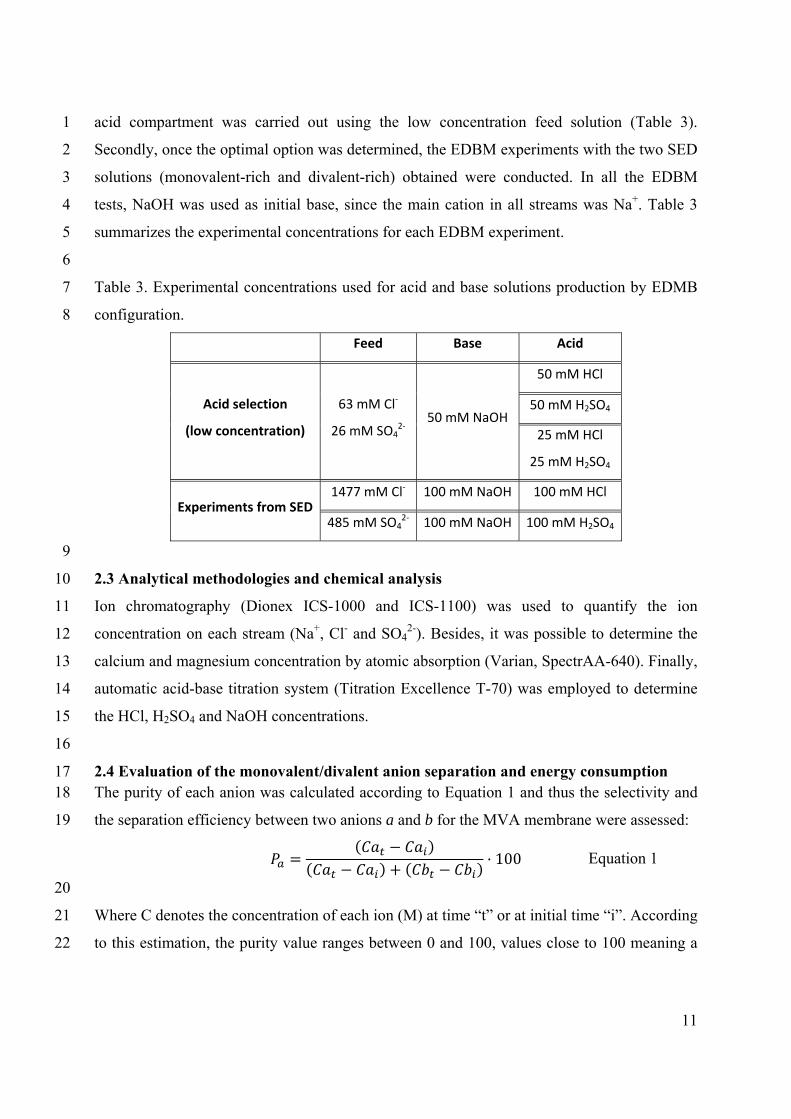
acid compartment was carried out using the low concentration feed solution (Table 3). 1
Secondly, once the optimal option was determined, the EDBM experiments with the two SED 2
solutions (monovalent-rich and divalent-rich) obtained were conducted. In all the EDBM 3
tests, NaOH was used as initial base, since the main cation in all streams was Na+. Table 3 4
summarizes the experimental concentrations for each EDBM experiment. 5
6
Table 3. Experimental concentrations used for acid and base solutions production by EDMB 7
configuration. 8
Feed Base Acid
Acid selection
(low concentration)
63 mM Cl‐
26 mM SO42‐
50 mM NaOH
50 mM HCl
50 mM H2SO4
25 mM HCl
25 mM H2SO4
Experiments from SED 1477 mM Cl‐ 100 mM NaOH 100 mM HCl
485 mM SO42‐ 100 mM NaOH 100 mM H2SO4
9
2.3 Analytical methodologies and chemical analysis 10
Ion chromatography (Dionex ICS-1000 and ICS-1100) was used to quantify the ion 11
concentration on each stream (Na+, Cl- and SO42-). Besides, it was possible to determine the 12
calcium and magnesium concentration by atomic absorption (Varian, SpectrAA-640). Finally, 13
automatic acid-base titration system (Titration Excellence T-70) was employed to determine 14
the HCl, H2SO4 and NaOH concentrations. 15
16
2.4 Evaluation of the monovalent/divalent anion separation and energy consumption 17 The purity of each anion was calculated according to Equation 1 and thus the selectivity and 18
the separation efficiency between two anions a and b for the MVA membrane were assessed: 19
100 Equation 1
20
Where C denotes the concentration of each ion (M) at time “t” or at initial time “i”. According 21
to this estimation, the purity value ranges between 0 and 100, values close to 100 meaning a 22
12
high retention of ion b ion in the diluate side and a high selectivity of ion a; and values close 1
to zero meaning the opposite case [28]. 2
For the SED experiments, the purity was calculated as the percentage of each ion in the 3
product and brine streams. For the EDBM tests, Equation 1 was used to determine the anions 4
behavior in the acid compartment to obtain the maximum separation. The separation of both 5
anions (Cl- and SO42-), the MVA membrane efficiency, the quality of the solutions produced 6
and the separation in the feed stream for both ED systems were evaluated by using the purity 7
value. 8
Another important parameter to determine was the energy consumption (Ec) in the ED stack, 9
and it was calculated by means of Equation 2. 10
Ec
U I t /1000m
Equation 2
Where U (V) and I (A) are the voltage and current applied in the ED stack, respectively, t (h) 11
is the operation time of the operation and mfinal product (kg) is the mass obtained of the desired 12
product (NaCl and Na2SO4 concentrate solutions achieved in the SED study or the acid and 13
base produced by EDBM). 14
15
3. RESULTS 16
Conductivity values measured during the tests were used to confirm that both systems were 17
working as expected. The conductivity of the electrode rinse stream remained constant during 18
each experiment, since there was not any interaction with the others streams. Indeed, the 19
conductivity in the feed solution decreased with time as ions migrated to the brine or product 20
compartments once SED was put in operation or to the base and acid compartments when 21
EDBM was employed. For these last two streams (brine/base and product/acid), the 22
conductivity evolution was different depending on whether SED or EDBM was used. For the 23
SED experiments, the concentration of NaCl in the brine stream increased due to the transport 24
of both Cl- through the MVA membrane and Na+ through the CEM from the feed solution to 25
this compartment. The Na2SO4-rich product stream kept almost constant its concentration, as 26
both Cl- and SO42- anions crossed the AEM from the feed solution, but Cl- leaved this 27
compartment through the MVA. For the EDBM system, acid and base streams increased its 28
13
conductivity, due to the water splitting produced in the BP membrane and the CEM and the 1
AEM disposal in the stack. 2
3 3.1 Chloride/sulfate separation by SED configuration 4
On the basis of the process stream composition (e.g., concentration values of both 5
electrolytes), four sets of experiments were carried out in order to find the optimal electrolyte 6
composition to be introduced in the product stream, and then its optimal initial concentration 7
that provides the highest Cl- /SO42- separation factors. First, NaCl, Na2SO4 and a mixture of 8
both solutions were tested by using electrolyte streams in the low (63 mM Cl- and 26 mM 9
SO42-) and medium concentration range (151 mM Cl- and 230 mM SO4
2-). 10
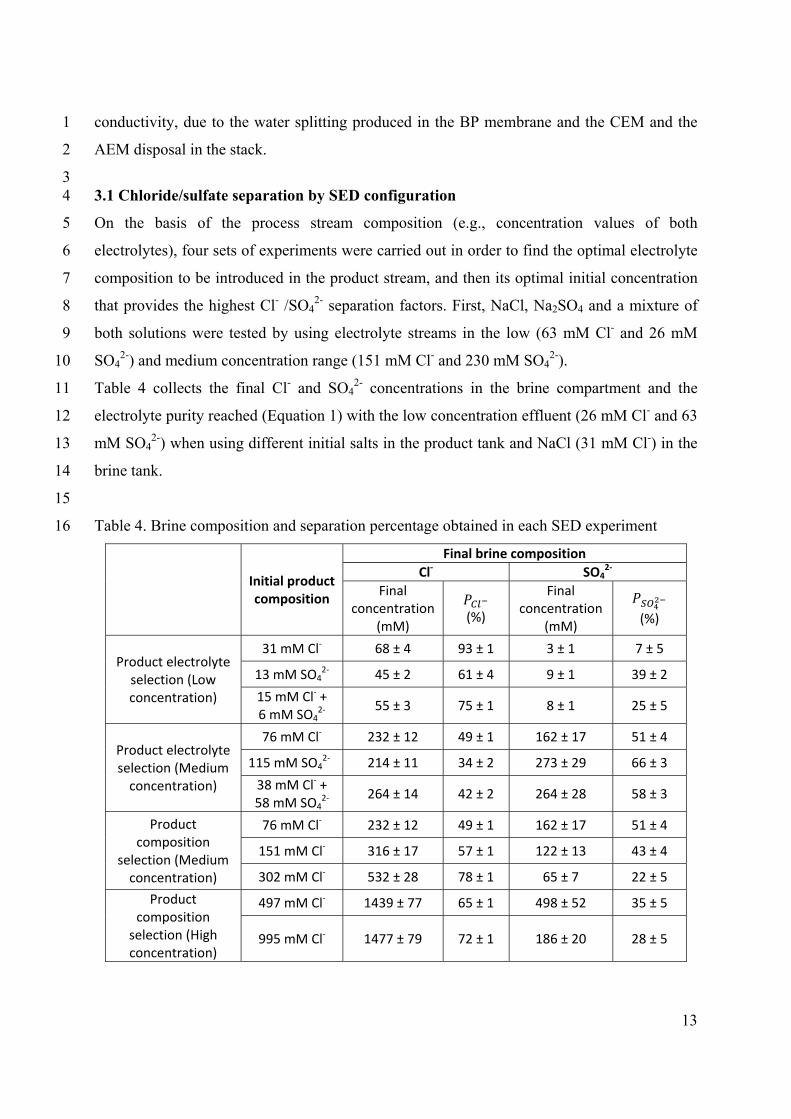
Table 4 collects the final Cl- and SO42- concentrations in the brine compartment and the 11
electrolyte purity reached (Equation 1) with the low concentration effluent (26 mM Cl- and 63 12
mM SO42-) when using different initial salts in the product tank and NaCl (31 mM Cl-) in the 13
brine tank. 14
15
Table 4. Brine composition and separation percentage obtained in each SED experiment 16
Initial productcomposition
Final brine composition
Cl‐ SO42‐
Final concentration
(mM)
(%)
Final concentration
(mM)
(%)
Product electrolyte selection (Low concentration)
31 mM Cl‐ 68 ± 4 93 ± 1 3 ± 1 7 ± 5
13 mM SO42‐ 45 ± 2 61 ± 4 9 ± 1 39 ± 2
15 mM Cl‐ + 6 mM SO4
2‐ 55 ± 3 75 ± 1 8 ± 1 25 ± 5
Product electrolyte selection (Medium concentration)
76 mM Cl‐ 232 ± 12 49 ± 1 162 ± 17 51 ± 4
115 mM SO42‐ 214 ± 11 34 ± 2 273 ± 29 66 ± 3
38 mM Cl‐ + 58 mM SO4
2‐ 264 ± 14 42 ± 2 264 ± 28 58 ± 3
Product composition
selection (Medium concentration)
76 mM Cl‐ 232 ± 12 49 ± 1 162 ± 17 51 ± 4
151 mM Cl‐ 316 ± 17 57 ± 1 122 ± 13 43 ± 4
302 mM Cl‐ 532 ± 28 78 ± 1 65 ± 7 22 ± 5
Product composition selection (High concentration)
497 mM Cl‐ 1439 ± 77 65 ± 1 498 ± 52 35 ± 5
995 mM Cl‐ 1477 ± 79 72 ± 1 186 ± 20 28 ± 5
14
The objective was to obtain a brine stream as pure in NaCl as possible after the SED trials. As 1
can be seen in Table 4, by using only NaCl as initial product it was possible to achieve a 93 % 2
purity of Cl- in the brine compartment when low concentration feed solution was used. Lower 3
Cl- purity values (61 and 75 %) were reached only if Na2SO4 or a mixture of both salts (NaCl 4
and Na2SO4) were initially used as product solutions, thus obtaining lower anions separations 5
than the one achieved when using NaCl as initial product. 6
Moreover, similar trials were carried out again, but in this case by using brine with a medium 7
initial concentration (151 mM Cl- and 230 mM SO42-). Then, the initial brine composition was 8
76 mM Cl-, while varying the initial salt solution (NaCl, Na2SO4 and a mixture of both) in the 9
product tank. Table 4 also lists the results of these tests. In this second set of experiments, 10
separation was not achieved in either case. Purity values between 34 and 49 % were obtained 11
for both streams for Cl- and SO42-, which are clearly lower than those achieved with the first 12
set of experiments at lower concentrations. 13
In both cases, the optimal option was using NaCl as a single salt solution in the product 14
compartment. For this reason, NaCl solutions of different concentrations were used as initial 15
product stream in the third set of experiments. Again, different process brines (medium and 16
high concentration) were used. Table 4 shows the results in the case of using 151 mM Cl- and 17
230 mM SO42- as initial (medium) concentration feed. In this case, the higher the initial NaCl 18
concentration introduced in the product and brine tanks the higher the purities obtained, with 19
purities values reaching almost 80 % Cl- / 20 % SO42- when using the double of the initial 20
NaCl concentration (302 mM Cl-). 21
Experiments were repeated with a higher concentrated brine stream (497 mM Cl- and 840 mM 22
SO42-) as feed solution. Again, almost 80 % Cl- / 20 % SO4
2- was separated when working 23
with the highest initial product and brine NaCl concentration (Table 4). 24
For all the experiments commented above, Cl- and SO42- contents in the product stream were 25
analyzed. As an average, 90.5 % SO42- and 9.5 % Cl- were calculated as final purity of each 26
ion in the product stream. In comparison with the literature reviewed, Zhang et al. [20] 27
reached similar SO42- purity values in the product stream (over 85 %) working with a SED 28
system to separate Cl- and SO42- and using monovalent selective (PC MVA) and non-selective 29
membranes (PC SK and PC SA) from PCCell GmbH, Germany. Moreover, Tanaka et al. [29] 30
also studied the Cl- and SO42- separation and values around 86 % SO4
2- and 14 % Cl- were 31
15
reported using a conventional configuration of ED where only selective monovalent ion 1
exchange resins Aciplex K172 and A172 (Asahi Chemical Co., Japan) were used . 2
Finally, it can be concluded that the optimal option to obtain the higher Cl-/SO42- by means of 3
SED was using the higher initial NaCl brine and product concentration, in this case the double 4
than in the initial feed stream. 5
The reason of this behavior relies on the diffusion phenomena. Working with divalent anions, 6
the concentration gradient in both MVA membrane sides was high, so a decrease of their 7
selectivity was observed and, consequently, the migration of the divalent anions. If some 8
initial SO42- concentration was introduced in the product tank a concentration gradient could 9
appear and divalent diffusion through the MVA membrane could happen. On the other hand, 10
when NaCl was introduced in the product compartment, the diffusion contribution diminished 11
due to the decrease of the concentration gradient in both MVA membrane sides, which 12
delimited the product and brine compartments. Increasing the initial chloride concentration in 13
both streams, hindered the diffusion of sulfate ions through the MVA membrane, which 14
represents a better selectivity and also that a reduced fraction of divalent ions could be 15
transported through it. 16
17
3.2 Production of acid and base solutions by EDBM configuration. 18
Before using the real product and brine obtained by SED, it was necessary to perform some 19
test in order to study, which was the optimal initial base and acid concentrations. Different 20
initial acid combinations were used (HCl, H2SO4 or a mixture of both). The least concentrated 21
brine (63 mM Cl- and 26 mM SO42-) was used as feed solution in this first set of EDBM 22
experiments. Indeed, a mixture of both acids was produced in the acid stream, since the initial 23
feed stream contained both anions, but an HCl-rich solution was the desired product in the 24
acid compartment. The results indicated that 83 % Cl- / 17 % SO42- separation was obtained 25
when using a pure initial HCl stream in the acid compartment, against 45 % Cl- / 55 % SO42- 26
when using pure H2SO4 or 55 % Cl-/ 45 % SO42- when a mixture of both acids was employed. 27
Figure 4 shows the results when only HCl was used in the acid compartment, which was the 28
option that yielded the highest HCl purity. 29
30
16
1
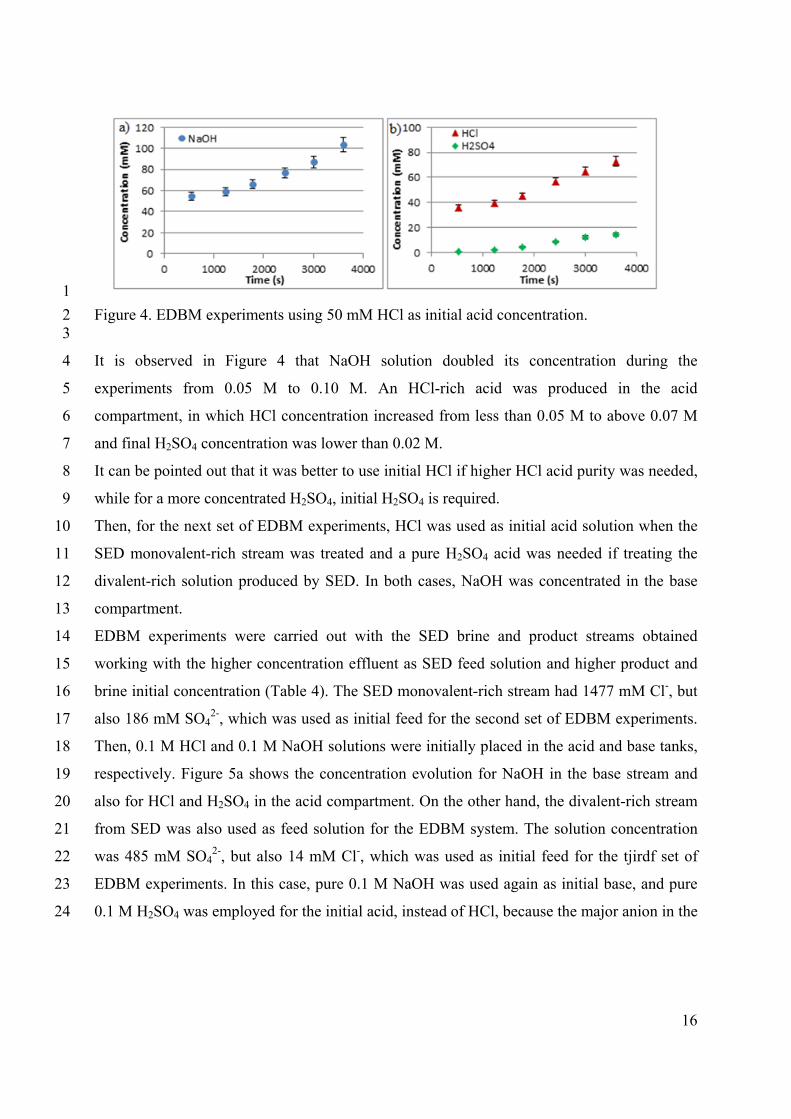
Figure 4. EDBM experiments using 50 mM HCl as initial acid concentration. 2 3
It is observed in Figure 4 that NaOH solution doubled its concentration during the 4
experiments from 0.05 M to 0.10 M. An HCl-rich acid was produced in the acid 5
compartment, in which HCl concentration increased from less than 0.05 M to above 0.07 M 6
and final H2SO4 concentration was lower than 0.02 M. 7
It can be pointed out that it was better to use initial HCl if higher HCl acid purity was needed, 8
while for a more concentrated H2SO4, initial H2SO4 is required. 9
Then, for the next set of EDBM experiments, HCl was used as initial acid solution when the 10
SED monovalent-rich stream was treated and a pure H2SO4 acid was needed if treating the 11
divalent-rich solution produced by SED. In both cases, NaOH was concentrated in the base 12
compartment. 13
EDBM experiments were carried out with the SED brine and product streams obtained 14
working with the higher concentration effluent as SED feed solution and higher product and 15
brine initial concentration (Table 4). The SED monovalent-rich stream had 1477 mM Cl-, but 16
also 186 mM SO42-, which was used as initial feed for the second set of EDBM experiments. 17
Then, 0.1 M HCl and 0.1 M NaOH solutions were initially placed in the acid and base tanks, 18
respectively. Figure 5a shows the concentration evolution for NaOH in the base stream and 19
also for HCl and H2SO4 in the acid compartment. On the other hand, the divalent-rich stream 20
from SED was also used as feed solution for the EDBM system. The solution concentration 21
was 485 mM SO42-, but also 14 mM Cl-, which was used as initial feed for the tjirdf set of 22
EDBM experiments. In this case, pure 0.1 M NaOH was used again as initial base, and pure 23
0.1 M H2SO4 was employed for the initial acid, instead of HCl, because the major anion in the 24
17
feed stream was SO42-. The concentration evolutions for the NaOH in the base stream and also 1
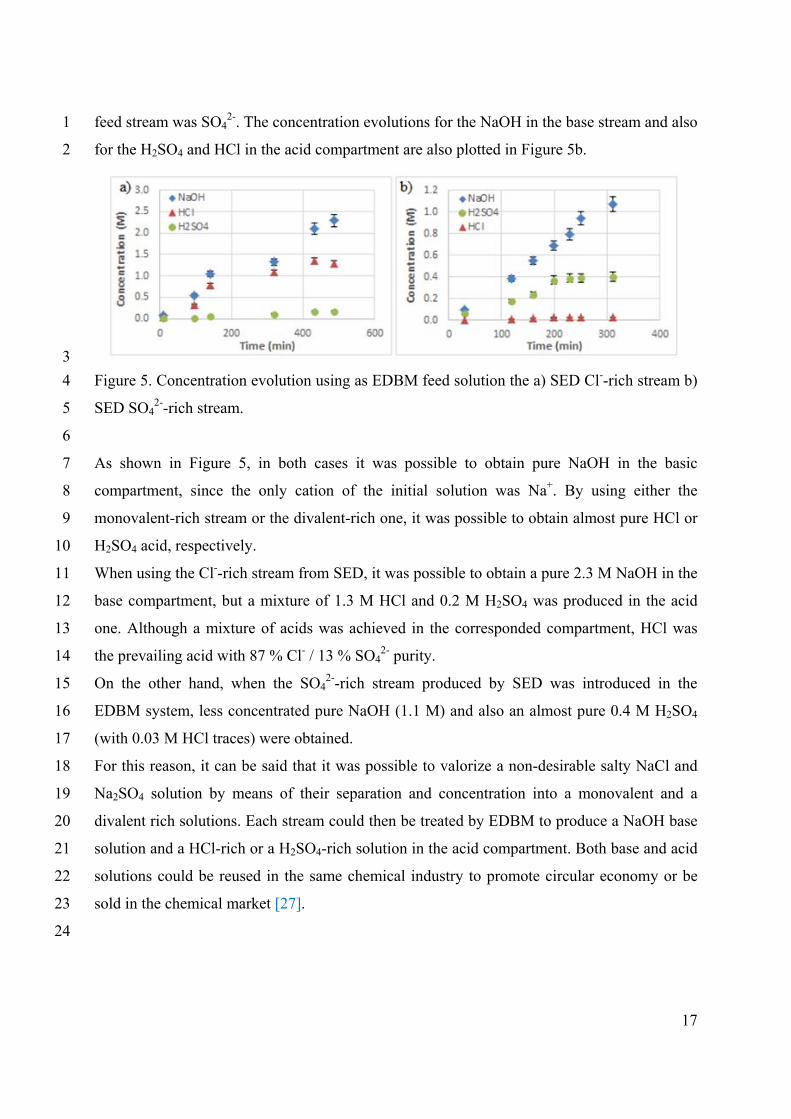
for the H2SO4 and HCl in the acid compartment are also plotted in Figure 5b. 2
3
Figure 5. Concentration evolution using as EDBM feed solution the a) SED Cl--rich stream b) 4
SED SO42--rich stream. 5
6
As shown in Figure 5, in both cases it was possible to obtain pure NaOH in the basic 7
compartment, since the only cation of the initial solution was Na+. By using either the 8
monovalent-rich stream or the divalent-rich one, it was possible to obtain almost pure HCl or 9
H2SO4 acid, respectively. 10
When using the Cl--rich stream from SED, it was possible to obtain a pure 2.3 M NaOH in the 11
base compartment, but a mixture of 1.3 M HCl and 0.2 M H2SO4 was produced in the acid 12
one. Although a mixture of acids was achieved in the corresponded compartment, HCl was 13
the prevailing acid with 87 % Cl- / 13 % SO42- purity. 14
On the other hand, when the SO42--rich stream produced by SED was introduced in the 15
EDBM system, less concentrated pure NaOH (1.1 M) and also an almost pure 0.4 M H2SO4 16
(with 0.03 M HCl traces) were obtained. 17
For this reason, it can be said that it was possible to valorize a non-desirable salty NaCl and 18
Na2SO4 solution by means of their separation and concentration into a monovalent and a 19
divalent rich solutions. Each stream could then be treated by EDBM to produce a NaOH base 20
solution and a HCl-rich or a H2SO4-rich solution in the acid compartment. Both base and acid 21
solutions could be reused in the same chemical industry to promote circular economy or be 22
sold in the chemical market [27]. 23
24
18
3.3 Energy consumption 1
Because both systems are electrical current-driven processes, energy consumption (Ec) was a 2
crucial parameter in order to decide their applicability at the industrial scale. Equation 2 was 3
used to calculate Ec in each experiment. The final mass product on Equation 2 was calculated 4
in a different way depending on the membrane configuration SED or EDBM and the desired 5
product. 6
For the SED trials, two desired products were obtained: the NaCl produced in the brine 7
compartment and the Na2SO4 solution obtained in the product compartment. Then, both 8
masses were taken into account considering also the initial solutions introduced in each 9
compartment. 10
For the EDBM trials, two products were obtained: acid and base. However, as it was seen in 11
Figure 5, a mixture of HCl and H2SO4 was achieved in the acid compartment in every EDBM 12
experiment, although pure NaOH was produced in the base tank. In the chemical market, the 13
NaOH price is higher than for HCl or H2SO4, and therefore this pure NaOH can be easily 14
commercialized in the industry. For this reason, the NaOH produced was the final mass 15
product used in Equation 2. Ec evolution curves obtained for SED and for EDBM systems 16
were similar. Figure 6 shows the EC evolution curves for the SED experiments. Each graph 17
represents the three main selections carried out to determine the optimal initial salt in the 18
product tank and its composition: a) electrolyte selection (Cl-, SO42- or a mixture of both 19
anions) with the medium feed concentration brine, b) composition selection (with the same or 20
the double feed concentration) with the medium feed concentration brine and c) composition 21
selection (with the same or the double feed concentration) with the high feed concentration 22
brine. 23
19
1
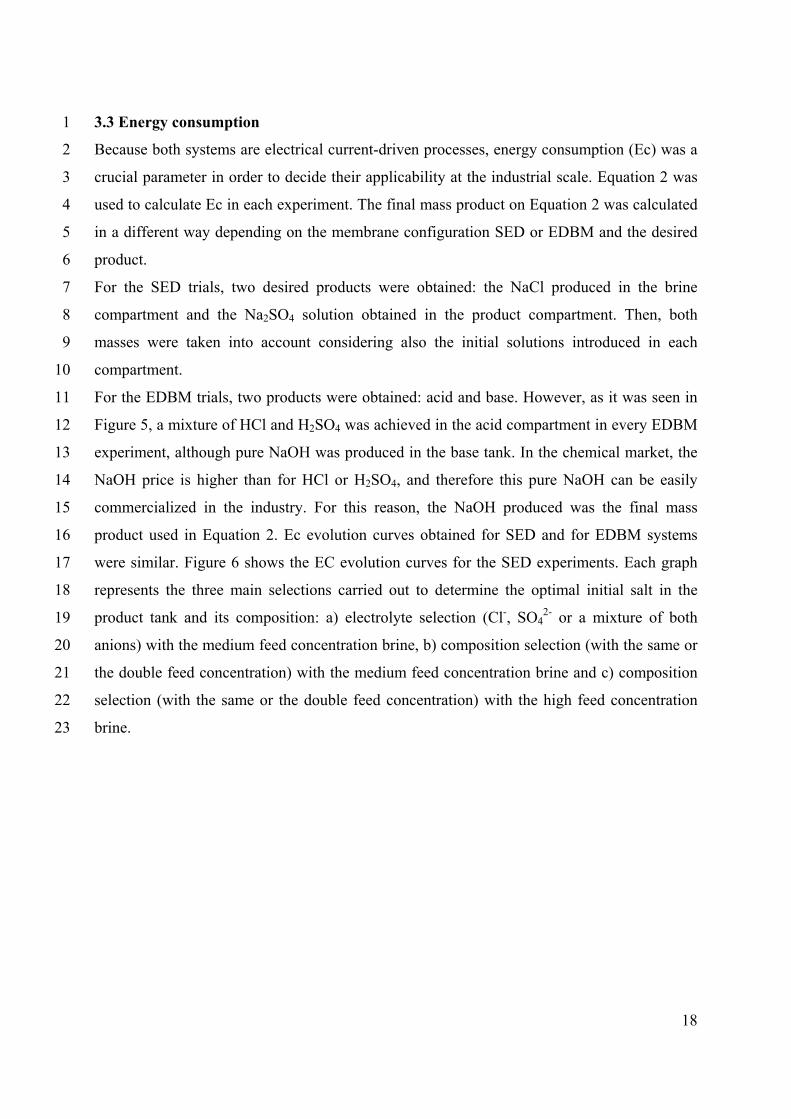
Figure 6. SED energy consumption evolution for product selection of a) electrolyte with 2
medium feed concentration, b) composition at medium feed concentration and c) composition 3
at high feed concentration. 4
5
As it is observed in Figure 6, firstly, a slightly constant Ec value was obtained until the brine 6
and product production achieved a steady value, then the Ec increased drastically. This 7
increase was due to osmosis and ion diffusion fluxes inside the SED stack reach a maximum 8
because of the concentration gradient between the diluate and the concentrated compartments. 9
Once the concentration of brine and product increased really slowly, the energy applied is 10
used to slowly increase their concentrations and then, Ec increases. It can be concluded that it 11
is important to work in the optimal zone to maintain low Ec values. This Ec behavior was 12
reported elsewhere [29,30]. Table 5 reports the Ec experimental values, taken into account the 13
optimal zone work for each experiment. 14
15
16
17
20
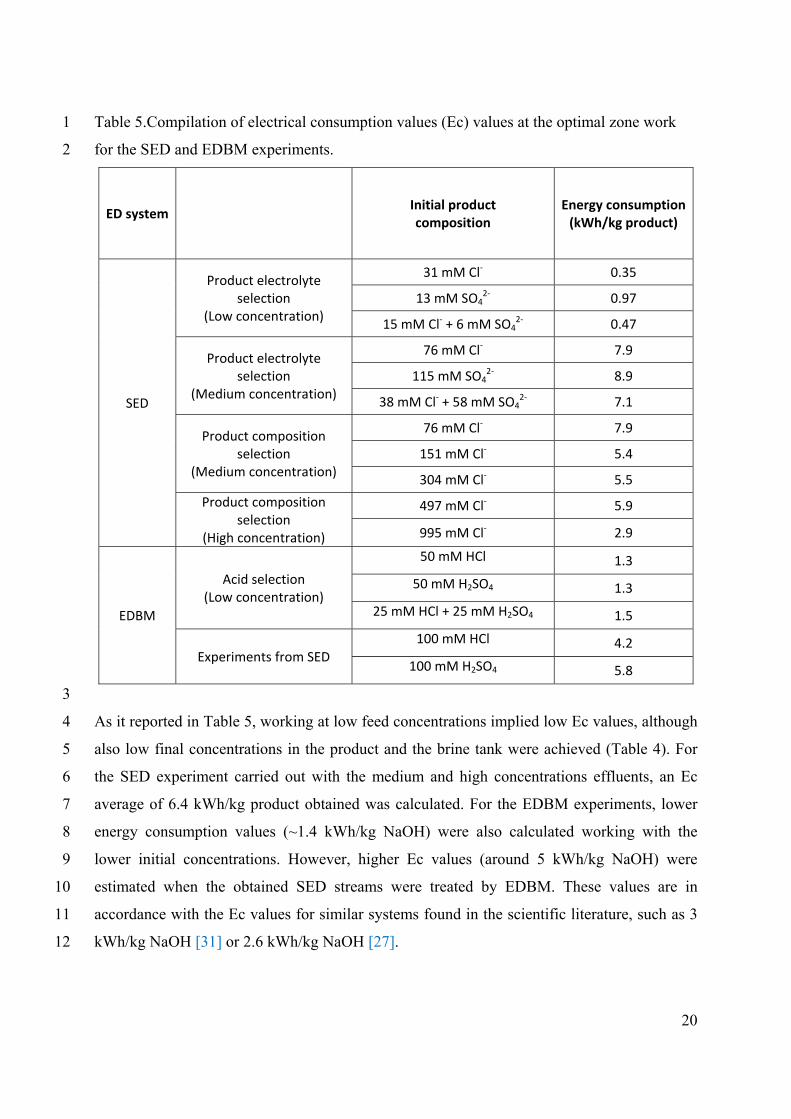
Table 5.Compilation of electrical consumption values (Ec) values at the optimal zone work 1
for the SED and EDBM experiments. 2
ED system Initial product composition
Energy consumption(kWh/kg product)
SED
Product electrolyte selection
(Low concentration)
31 mM Cl‐ 0.35
13 mM SO42‐ 0.97
15 mM Cl‐ + 6 mM SO42‐ 0.47
Product electrolyte selection
(Medium concentration)
76 mM Cl‐ 7.9
115 mM SO42‐ 8.9
38 mM Cl‐ + 58 mM SO42‐ 7.1
Product composition selection
(Medium concentration)
76 mM Cl‐ 7.9
151 mM Cl‐ 5.4
304 mM Cl‐ 5.5
Product composition selection
(High concentration)
497 mM Cl‐ 5.9
995 mM Cl‐ 2.9
EDBM
Acid selection (Low concentration)
50 mM HCl 1.3
50 mM H2SO4 1.3
25 mM HCl + 25 mM H2SO4 1.5
Experiments from SED 100 mM HCl 4.2
100 mM H2SO4 5.8
3
As it reported in Table 5, working at low feed concentrations implied low Ec values, although 4
also low final concentrations in the product and the brine tank were achieved (Table 4). For 5
the SED experiment carried out with the medium and high concentrations effluents, an Ec 6
average of 6.4 kWh/kg product obtained was calculated. For the EDBM experiments, lower 7
energy consumption values (~1.4 kWh/kg NaOH) were also calculated working with the 8
lower initial concentrations. However, higher Ec values (around 5 kWh/kg NaOH) were 9
estimated when the obtained SED streams were treated by EDBM. These values are in 10
accordance with the Ec values for similar systems found in the scientific literature, such as 3 11
kWh/kg NaOH [31] or 2.6 kWh/kg NaOH [27]. 12
21
5. CONCLUSIONS 1
This study demonstrated that it was possible to valorize chemical industry process brines 2
(containing NaCl and Na2SO4) by means of a combination of two current-driven ion-3
exchange membrane technologies: SED and EDBM. 4
First of all, chloride and sulfate ions were separated by SED reaching purities of more than 90 5
% SO42- in the divalent-rich stream and about 90 % Cl- in the monovalent-rich stream. 6
Different initial electrolytes and several concentration values were tested in order to reach the 7
maximum separation efficiency, and the optimal result was to use an initial NaCl solution in 8
the brine and product compartments with a double concentration than the brine feed. 9
EDBM is a suitable process to produce base and acid from the SED monovalent-rich and 10
divalent-rich stream separated by SED. Pure NaOH were produced in both cases, whereas 11
HCl-rich (87 %) and H2SO4-rich (93 %) acids were obtained when the SED monovalent-rich 12
stream or the SED divalent-rich stream were used as EDBM feed, respectively. 13
Finally, Ec evolution curves were calculated for each experiment and it is important to point 14
out that it is better to work by SED or EDBM until the production (brine and product or base 15
and acid streams, respectively) become almost constant, because in that point the Ec increased 16
drastically. 17
18
Acknowledgements 19
This research received support by the ZERO-DISCHARGE project (CTQ2011-26799) and 20
the Waste2Product (CTM2014-57302-R) financed by the Spanish Ministry MINECO and the 21
Catalan Government (Project Ref. SGR2014-50-SETRI), Spain. The work of Mònica Reig 22
was supported by the Spanish Ministry (MINECO) within the scope of the grant BES-2012-23
051914. We would also like to acknowledge to C. Monserrat and A. Lara for their 24
contribution to the project. 25
26
REFERENCES 27
[1] R. Bond, S. Veerapaneni, Zero Liquid Discharge for Inland Desalination, Awwa 28
Research Foundation, Kansas City, 2007. 29
[2] S. Dolnicar, A.I. Schäfer, Desalinated versus recycled water: public perceptions and 30
profiles of the accepters., J. Environ. Manage. 90 (2009) 888–900. 31
22
[3] L.F. Greenlee, D.F. Lawler, B.D. Freeman, B. Marrot, P. Moulin, Reverse osmosis 1
desalination: water sources, technology, and today’s challenges., Water Res. 43 (2009) 2
2317–48. 3
[4] A. Pérez-González, A.M. Urtiaga, R. Ibáñez, I. Ortiz, State of the art and review on the 4
treatment technologies of water reverse osmosis concentrates, Water Res. 46 (2012) 5
267–283. 6
[5] A. Subramani, J.G. Jacangelo, Treatment technologies for reverse osmosis concentrate 7
volume minimization: A review, Sep. Purif. Technol. 122 (2014) 472–489. 8
[6] B. Van Der Bruggen, L. Lejon, C. Vandecasteele, Reuse, treatment, and discharge of 9
the concentrate of pressure-driven membrane processes, Environ. Sci. Technol. 37 10
(2003) 3733–3738. 11
[7] OECD, Managing Water for All: An OECD Perspective on Pricing and Financing, 12
Paris, France, 2009. 13
[8] SPIRE, Sustainable Process Industry through Resource and Energy efficiency, Road 14
Map, (2013). 15
[9] A. Dabrowski, Z. Hubicki, P. Podkościelny, E. Robens, Selective removal of the 16
heavy metal ions from waters and industrial wastewaters by ion-exchange method., 17
Chemosphere. 56 (2004) 91–106. 18
[10] V.S. Soldatov, V.M. Zelenkovskii, L.A. Orlovskaya, Sorption of bivalent ions by a 19
fibrous chelating ion exchanger and the structure of sorption complexes, React. Funct. 20
Polym. 71 (2011) 49–61. 21
[11] Y. Yoon, R. Lueptow, Removal of organic contaminants by RO and NF membranes, J. 22
Memb. Sci. 261 (2005) 76–86. 23
[12] H. Strathmann, Electrodialysis, a mature technology with a multitude of new 24
applications, Desalination. 264 (2010) 268–288. 25
[13] Y. Tanaka, Ion-exchange membrane electrodialysis program and its application to 26
multi-stage continuous saline water desalination, Desalination. 301 (2012) 10–25. 27
[14] Y. Tanaka, M. Reig, S. Casas, C. Aladjem, J.L. Cortina, Computer simulation of ion-28
exchange membrane electrodialysis for salt concentration and reduction of RO 29
discharged brine for salt production and marine environment conservation, 30
Desalination. 367 (2015) 76–89. 31
23
[15] Y. Tanaka, R. Ehara, S. Itoi, T. Goto, Ion-exchange membrane electrodialytic salt 1
production using brine discharged from a reverse osmosis seawater desalination plant, 2
J. Memb. Sci. 222 (2003) 71–86. 3
[16] Y. Tanaka, A computer simulation of feed and bleed ion exchange membrane 4
electrodialysis for desalination of saline water, Desalination. 254 (2010) 99–107. 5
[17] F. Valero, R. Arbós, Desalination of brackish river water using Electrodialysis 6
Reversal (EDR): Control of the THMs formation in the Barcelona (NE Spain) area, 7
Desalination. 253 (2010) 170–174. 8
[18] D.W. Houldsworth, Demineralization of whey by means of ion exchange and 9
electrodialysis, Int. J. Dairy Technol. 33 (1980) 45–51. 10
[19] E. Vera, J. Sandeaux, F. Persin, G. Pourcelly, M. Dornier, J. Ruales, Deacidification of 11
passion fruit juice by electrodialysis with bipolar membrane after different 12
pretreatments, J. Food Eng. 90 (2009) 67–73. 13
[20] Y. Zhang, S. Paepen, L. Pinoy, B. Meesschaert, B. Van der Bruggen, Selectrodialysis: 14
Fractionation of divalent ions from monovalent ions in a novel electrodialysis stack, 15
Sep. Purif. Technol. 88 (2012) 191–201. 16
[21] T. Xu, Electrodialysis processes with bipolar membranes (EDBM) in environmental 17
protection—a review, Resour. Conserv. Recycl. 37 (2002) 1–22. 18
[22] G. Pourcelly, Electrodialysis with Bipolar Membranes: Principles, Optimization, and 19
Applications, Russ. J. Electrochem. 38 (2002) 919–926. 20
[23] P. Pinacci, M. Radaelli, Recovery of citric acid from fermentation broths by 21
electrodialysis with bipolar membranes, Desalination. 148 (2002) 177–179. 22
[24] K. Zhang, M. Wang, D. Wang, C. Gao, The energy-saving production of tartaric acid 23
using ion exchange resin-filling bipolar membrane electrodialysis, J. Memb. Sci. 341 24
(2009) 246–251. 25
[25] C. Huang, T. Xu, Y. Zhang, Y. Xue, G. Chen, Application of electrodialysis to the 26
production of organic acids: State-of-the-art and recent developments, J. Memb. Sci. 27
288 (2007) 1–12. 28
[26] V. Mavrov, H. Chmiel, B. Heitele, F. Rögener, Desalination of surface water to 29
industrial water with lower impact on the environment: Part 4: Treatment of effluents 30
from water desalination stages for reuse and balance of the new technological concept 31
24
for water desalination, Desalination. 124 (1999) 205–216. 1
[27] M. Reig, S. Casas, O. Gibert, C. Valderrama, J.L. Cortina, Integration of nanofiltration 2
and bipolar electrodialysis for valorization of seawater desalination brines: Production 3
of drinking and waste water treatment chemicals, Desalination. 382 (2016) 13–20. 4
[28] B. Van Der Bruggen, a Koninckx, C. Vandecasteele, Separation of monovalent and 5
divalent ions from aqueous solution by electrodialysis and nanofiltration., Water Res. 6
38 (2004) 1347–53. 7
[29] Y. Tanaka, H. Uchino, S. Matsuda, Y. Sato, Batch ion-exchange membrane 8
electrodialysis of mother liquid discharged from a salt-manufacturing process. 9
Experiment and simulation, Sep. Purif. Technol. 156 (2015) 276–287. 10
[30] M. Reig, S. Casas, C. Aladjem, C. Valderrama, O. Gibert, F. Valero, et al., 11
Concentration of NaCl from seawater reverse osmosis brines for the chlor-alkali 12
industry by electrodialysis, Desalination. 342 (2014) 107–117. 13
[31] W. Ye, J. Huang, J. Lin, X. Zhang, J. Shen, P. Luis, et al., Environmental evaluation of 14
bipolar membrane electrodialysis for NaOH production from wastewater: conditioning 15
NaOH as a CO2 absorbent, Sep. Purif. Technol. 144 (2015) 206–214. 16
17
Related Documents