1 SASFAA MI 12/2008--Utilizing Institutional Research---Dr. Barry W. Simmons Sr. www.finaid.vt.edu/Presentations/SASFAA_MANAGEMENT/index.html Utilizing Institutional Research Learning to Love Data Dr Barry W. Simmons Sr. Director USFA, Virginia Tech *With thanks to Bonnie Joerschke, UGA

1 SASFAA MI 12/2008--Utilizing Institutional Research---Dr. Barry W. Simmons Sr. Utilizing.
Jan 01, 2016
Welcome message from author
This document is posted to help you gain knowledge. Please leave a comment to let me know what you think about it! Share it to your friends and learn new things together.
Transcript

1SASFAA MI 12/2008--Utilizing Institutional Research---Dr. Barry W. Simmons Sr. www.finaid.vt.edu/Presentations/SASFAA_MANAGEMENT/index.html
Utilizing Institutional Research
Learning to Love Data
Dr Barry W. Simmons Sr.Director USFA, Virginia Tech
*With thanks to Bonnie Joerschke, UGA

2SASFAA MI 12/2008--Utilizing Institutional Research---Dr. Barry W. Simmons Sr. www.finaid.vt.edu/Presentations/SASFAA_MANAGEMENT/index.html
Presentation Outline
• Need for Research• Basic Principles and Statistics• Data Sources• Tools• Foibles• Examples• Sharing• Questions• The End

3SASFAA MI 12/2008--Utilizing Institutional Research---Dr. Barry W. Simmons Sr. www.finaid.vt.edu/Presentations/SASFAA_MANAGEMENT/index.html
Is There Time for Research?
• Reports are research– FISAP– State Reports– Institutional Reports– Common Data Set (CDS)– U S News and World Reports– National Postsecondary Student Aid Study
(NPSAS)– Others?

4SASFAA MI 12/2008--Utilizing Institutional Research---Dr. Barry W. Simmons Sr. www.finaid.vt.edu/Presentations/SASFAA_MANAGEMENT/index.html
Make Time for Research
• Strategic Planning• Fund Utilization• Grant Applications• Knowing Your Student Body• Evaluation• Compliance• Institutional Quality Assurance Program• Others?

5SASFAA MI 12/2008--Utilizing Institutional Research---Dr. Barry W. Simmons Sr. www.finaid.vt.edu/Presentations/SASFAA_MANAGEMENT/index.html
Basic Principles of Research
• Quantitative research is the systematic scientific investigation of quantitative properties and phenomena and their relationships. The objective of quantitative research is to develop and employ mathematical models, theories and/or hypotheses pertaining to natural phenomena. The process of measurement is central to quantitative research because it provides the fundamental connection between empirical observation and mathematical expression of quantitative relationships.
Source: Wikipedia
6SASFAA MI 12/2008--Utilizing Institutional Research---Dr. Barry W. Simmons Sr. www.finaid.vt.edu/Presentations/SASFAA_MANAGEMENT/index.html
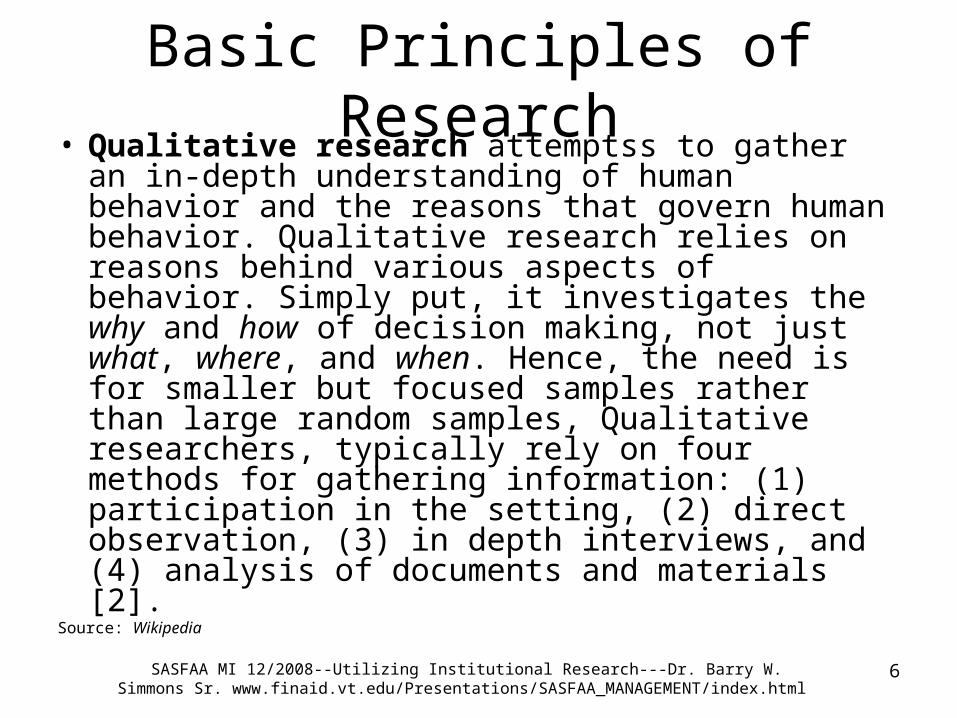
Basic Principles of Research• Qualitative research attemptss to gather an in-
depth understanding of human behavior and the reasons that govern human behavior. Qualitative research relies on reasons behind various aspects of behavior. Simply put, it investigates the why and how of decision making, not just what, where, and when. Hence, the need is for smaller but focused samples rather than large random samples, Qualitative researchers, typically rely on four methods for gathering information: (1) participation in the setting, (2) direct observation, (3) in depth interviews, and (4) analysis of documents and materials [2].
Source: Wikipedia

7SASFAA MI 12/2008--Utilizing Institutional Research---Dr. Barry W. Simmons Sr. www.finaid.vt.edu/Presentations/SASFAA_MANAGEMENT/index.html
BASIC PRINCIPLES OF RESEARCH*
• Descriptive Statistics– Describes the basic features of the data– Simple summaries– Present quantitative descriptions in a
manageable form– Descriptive vs. inferential statistics– Limitations: risk of distorting original data or
losing important detailSource: The Web Center for Social Research Methods,
www.socialresearchmethods.net/kb/statdesc/htm

8SASFAA MI 12/2008--Utilizing Institutional Research---Dr. Barry W. Simmons Sr. www.finaid.vt.edu/Presentations/SASFAA_MANAGEMENT/index.html
DESCRIPTIVE STATISTICS*
• Most often used descriptive statistic is “central tendency or range” of a distribution of values:– Mean– Median– Mode– Range

9SASFAA MI 12/2008--Utilizing Institutional Research---Dr. Barry W. Simmons Sr. www.finaid.vt.edu/Presentations/SASFAA_MANAGEMENT/index.html
DEFINITIONS*
• Mean: the arithmetic average
30 + 80 + 30 + 90 + 30 + 100 = 360/6 = 60
• Median: The number in the middle of an ordered list
30 30 30 80 90 100 ^
• Mode: The number that occurs most often30
• Range: The highest value minus lowest (100 – 30 = 70)
10SASFAA MI 12/2008--Utilizing Institutional Research---Dr. Barry W. Simmons Sr. www.finaid.vt.edu/Presentations/SASFAA_MANAGEMENT/index.html
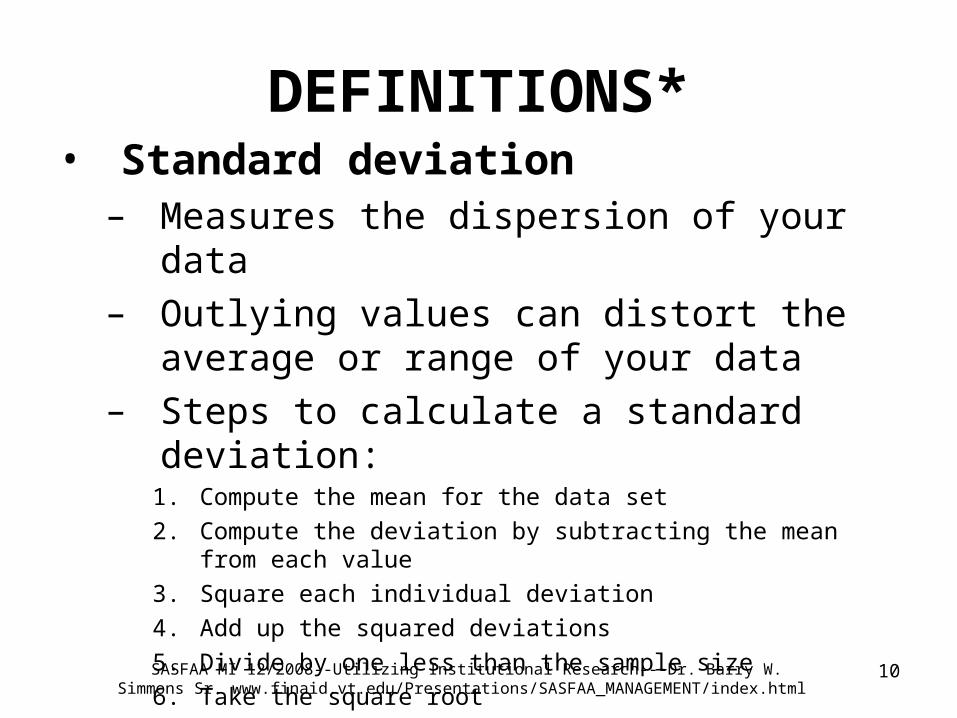
DEFINITIONS*• Standard deviation
– Measures the dispersion of your data– Outlying values can distort the average or
range of your data– Steps to calculate a standard deviation:
1. Compute the mean for the data set
2. Compute the deviation by subtracting the mean from each value
3. Square each individual deviation
4. Add up the squared deviations
5. Divide by one less than the sample size
6. Take the square root

11SASFAA MI 12/2008--Utilizing Institutional Research---Dr. Barry W. Simmons Sr. www.finaid.vt.edu/Presentations/SASFAA_MANAGEMENT/index.html
DEFINITIONS*• Standard deviation (example)
30 – 60 = -30.0002 = 900.000000
30 – 60 = -30.0002 = 900.000000
30 – 60 = -30.0002 = 900.000000
80 – 60 = 20.0002 = 400.000000
90 – 60 = 30.0002 = 300.000000
100 – 60 = 40.0002 = 1600.000000
5000.000000/5 = 1000.0001000= 31.623
12SASFAA MI 12/2008--Utilizing Institutional Research---Dr. Barry W. Simmons Sr. www.finaid.vt.edu/Presentations/SASFAA_MANAGEMENT/index.html
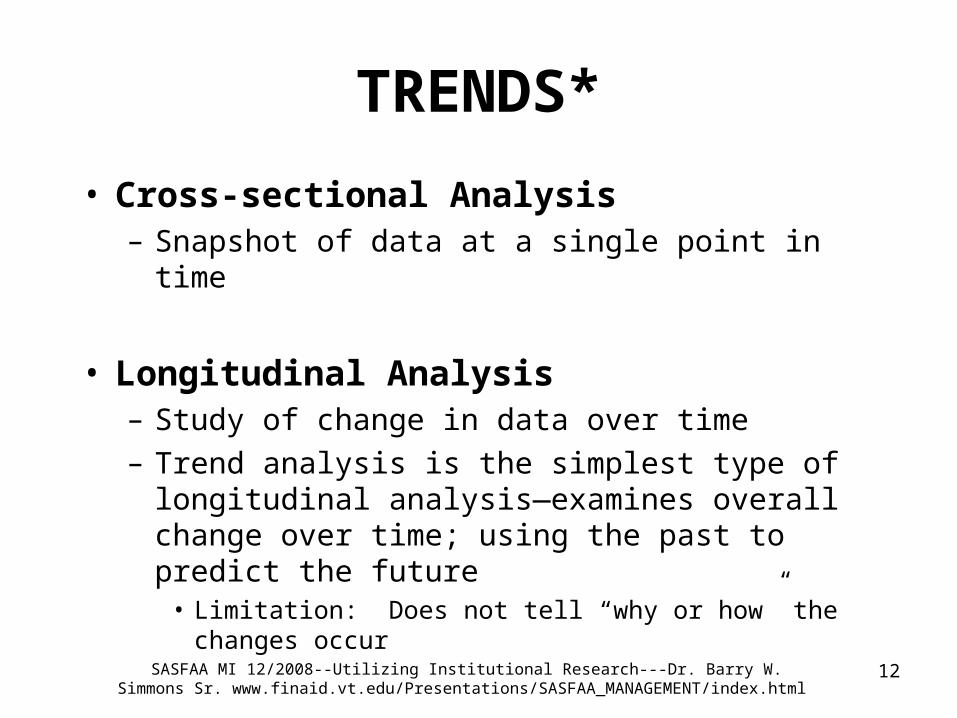
TRENDS*
• Cross-sectional Analysis– Snapshot of data at a single point in time
• Longitudinal Analysis– Study of change in data over time– Trend analysis is the simplest type of longitudinal
analysis—examines overall change over time; using the past to predict the future
• Limitation: Does not tell “why or how” the changes occur

13SASFAA MI 12/2008--Utilizing Institutional Research---Dr. Barry W. Simmons Sr. www.finaid.vt.edu/Presentations/SASFAA_MANAGEMENT/index.html
CONSTANT DOLLARS*
• Dollars reported in terms of the value they had on a previous date. Measures data over time while controlling for changes owing to inflation.
• Usually gives a clearer view of how something is performing over time.
• Use Consumer Price Index (CPI) to adjust for inflation.

14SASFAA MI 12/2008--Utilizing Institutional Research---Dr. Barry W. Simmons Sr. www.finaid.vt.edu/Presentations/SASFAA_MANAGEMENT/index.html
CONSTANT DOLLARS*
• Consumer Price Index– Measure used to track change in prices for
common household goods over time– Can be used to compare dollar amounts
between years using “constant dollars”– Produced by the Bureau of Labor Statistics
• www.bls.gov/cpi/
Good reference when updating COA!!!

15SASFAA MI 12/2008--Utilizing Institutional Research---Dr. Barry W. Simmons Sr. www.finaid.vt.edu/Presentations/SASFAA_MANAGEMENT/index.html
Types of Data
• Nominal: Nominal data have no order and thus only gives names or labels to various categories.
• Ordinal: Ordinal data have order, but the interval between measurements is not meaningful.
• Interval: Interval data have meaningful intervals between measurements, but there is no true starting point (zero).
• Ratio: Ratio data have the highest level of measurement. Ratios between measurements as well as intervals are meaningful because there is a starting point (zero).
Source: http://www.andrews.edu/~calkins/math/webtexts/stattoc.htm

16SASFAA MI 12/2008--Utilizing Institutional Research---Dr. Barry W. Simmons Sr. www.finaid.vt.edu/Presentations/SASFAA_MANAGEMENT/index.html
Data Sources
• Institution’s Administrative System• EDE Express Suite• External Databases
– Regional– State– National
• IPEDS• CPS Quarterly Sample
• Surveys• Others?

17SASFAA MI 12/2008--Utilizing Institutional Research---Dr. Barry W. Simmons Sr. www.finaid.vt.edu/Presentations/SASFAA_MANAGEMENT/index.html
Research and Data Resources

18SASFAA MI 12/2008--Utilizing Institutional Research---Dr. Barry W. Simmons Sr. www.finaid.vt.edu/Presentations/SASFAA_MANAGEMENT/index.html
Research Tools
• Excel
• SAS
• SPSS
• Mini-Tab
• Crystal Reports
• Access
• Others?

19SASFAA MI 12/2008--Utilizing Institutional Research---Dr. Barry W. Simmons Sr. www.finaid.vt.edu/Presentations/SASFAA_MANAGEMENT/index.html
Research Foibles
• Quality of data– Reliability– Consistency– Stability
• Understanding of data– Data is data, not information, needs context– Compare and contrast appropriately– If items not well defined, develop your own definition and state it
• Application of Analysis– Use the correct measure/statistic– Don’t confuse association with correlation with causation– Basis of data…define variables

20SASFAA MI 12/2008--Utilizing Institutional Research---Dr. Barry W. Simmons Sr. www.finaid.vt.edu/Presentations/SASFAA_MANAGEMENT/index.html
Affordability Nationwide From:Higher Education
Access and Affordability in Virginia Amid the 2008 Credit Crisis: A Cursory Look, Barry W. Simmons Sr. in testimony 12/4/2008 before the Virginia Senate Finance Committee Education Subcommittee
Improvements in State Investment---state investment in need-based financial aid as a percentage of the federal investment
– Nevada 2% to 48%– North Carolina 3% to 70%– Virginia 6% to 50%– Montana 1% to 9%– Utah 1% to 8%– Washington 24% to 108%– Texas 7% to 32%– Delaware 13% to 49%– Missouri 8% to 29%– West Virginia 12% to 43%
Source: Measuring Up 2008
Needs further protocol explanation

21SASFAA MI 12/2008--Utilizing Institutional Research---Dr. Barry W. Simmons Sr. www.finaid.vt.edu/Presentations/SASFAA_MANAGEMENT/index.html
Affordability From:Higher Education Access and Affordability in Virginia Amid
the 2008 Credit Crisis: A Cursory Look, Barry W. Simmons Sr. in testimony 12/4/2008 before the Virginia Senate Finance Committee Education Subcommittee
State Tax Funds Appropriated for Higher EdOperating Expenses Per $1,000 Personal Income FY07
Virginia $6.53National $7.08North Carolina $12.52
Virginia Change from FY1980 to FY2007
($3.94) National Change from FY1980 to FY2007
($3.39)
Source: Postsecondary Education Opportunity, January 2007
Example of Good Use!!!
22SASFAA MI 12/2008--Utilizing Institutional Research---Dr. Barry W. Simmons Sr. www.finaid.vt.edu/Presentations/SASFAA_MANAGEMENT/index.html
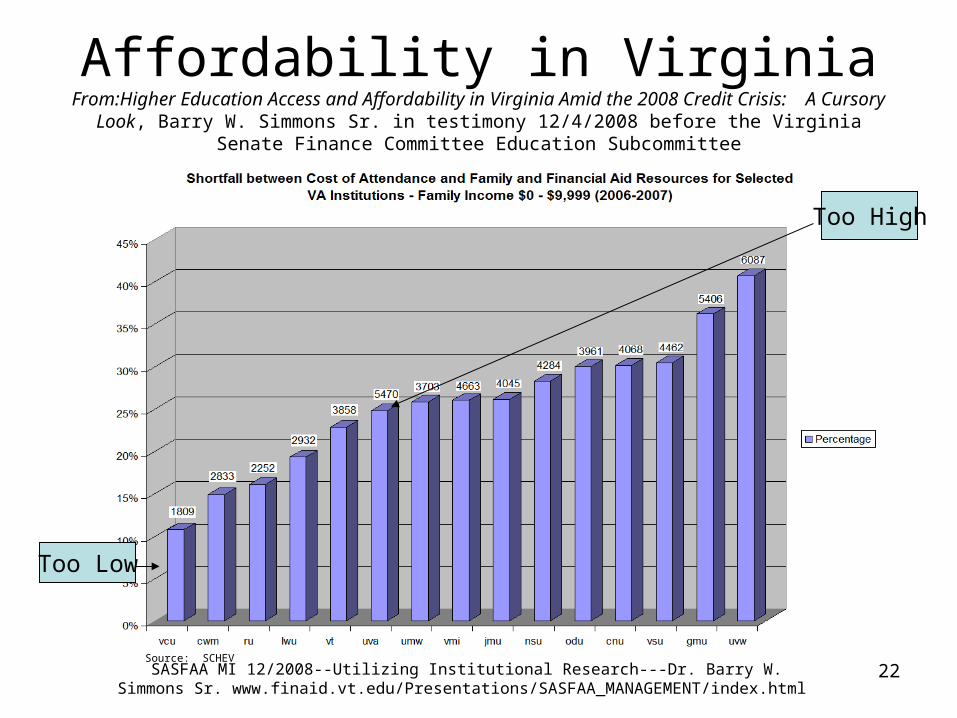
Affordability in Virginia From:Higher Education Access and
Affordability in Virginia Amid the 2008 Credit Crisis: A Cursory Look, Barry W. Simmons Sr. in testimony 12/4/2008 before the Virginia Senate Finance Committee Education Subcommittee
Source: SCHEV
Too Low
Too High

23SASFAA MI 12/2008--Utilizing Institutional Research---Dr. Barry W. Simmons Sr. www.finaid.vt.edu/Presentations/SASFAA_MANAGEMENT/index.html
Affordability in Virginia From:Higher Education Access and
Affordability in Virginia Amid the 2008 Credit Crisis: A Cursory Look, Barry W. Simmons Sr. in testimony 12/4/2008 before the Virginia Senate Finance Committee Education Subcommittee
Source: SCHEV

24SASFAA MI 12/2008--Utilizing Institutional Research---Dr. Barry W. Simmons Sr. www.finaid.vt.edu/Presentations/SASFAA_MANAGEMENT/index.html
Foibles in Research
Others?

25SASFAA MI 12/2008--Utilizing Institutional Research---Dr. Barry W. Simmons Sr. www.finaid.vt.edu/Presentations/SASFAA_MANAGEMENT/index.html
Research ExampleVirginia Financial Aid Related
Metrics for Restructuring5.1 Average annual need-based student borrowing.
10-Year History – Total loans (numerator)
1997-98 1998-99 1999-00 2000-01 2001-02 2002-03 2003-04 2004-05 2005-06 2006-07
20,329,981 19,832,248 19,070,097 18,130,790 15,291,246 15,706,254 16,112,854 15,592,180 15,528,358 15,590,892
Standard Deviation 2,001,330
Minimum 15,291,246
Maximum 20,329,981
10-Year History – Total number of students with need (denominator)
1997-98 1998-99 1999-00 2000-01 2001-02 2002-03 2003-04 2004-05 2005-06 2006-07
6,897 7,276 6,858 6,114 5,675 5,973 5,893 5,726 5,478 5,556
Standard Deviation 636
Minimum 5,478
Maximum 7,276
10-Year History – Average annual need-based student borrowing (ratio)
1997-98 1998-99 1999-00 2000-01 2001-02 2002-03 2003-04 2004-05 2005-06 2006-07
2,948 2,726 2,781 2,965 2,694 2,630 2,734 2,723 2,835 2,806
Standard Deviation 108
Minimum 2,630
Maximum 2,965
2008 Proposed Targets – Average annual need-based student borrowing (ratio)
Year 2008-09 2009-10 2010-11 2011-12 2012-13 2013-14 Target 2,969 3,060 3,103 3,154 3,213 3,279
Threshold 3,400 3,491 3,534 3,585 3,644 3,710

26SASFAA MI 12/2008--Utilizing Institutional Research---Dr. Barry W. Simmons Sr. www.finaid.vt.edu/Presentations/SASFAA_MANAGEMENT/index.html
Research ExampleVirginia Financial Aid Related
Metrics for Restructuring5.2 Percent of I n-state students with need who borrowed.
10-Year History – Number of in-state students with need who borrow (numerator)
1997-98 1998-99 1999-00 2000-01 2001-02 2002-03 2003-04 2004-05 2005-06 2006-07
6,096 6,240 5,855 5,152 4,631 4,402 4,442 4,380 4,301 4,291
Standard Deviation 794
Minimum 4,291
Maximum 6,240
10-Year History – Total number of in-state students with need (denominator)
1997-98 1998-99 1999-00 2000-01 2001-02 2002-03 2003-04 2004-05 2005-06 2006-07
6,897 7,276 6,858 6,114 5,675 5,973 5,893 5,726 5,478 5,556
Standard Deviation 636
Minimum 5,478
Maximum 7,276
10-Year History – Percent of in-state students with need who borrowed
1997-98 1998-99 1999-00 2000-01 2001-02 2002-03 2003-04 2004-05 2005-06 2006-07
88.4% 85.8% 85.4% 84.3% 81.6% 73.7% 75.4% 76.5% 78.5% 77.2%
Standard Deviation 5.1%
Minimum 74%
Maximum 88%
2008 Proposed Targets – Percent of in-state students with need who borrowed
Year 2008-09 2009-10 2010-11 2011-12 2012-13 2013-14 Target 79.5% 80.7% 82.0% 83.2% 84.5% 85.8%
Threshold 84.5% 85.8% 87.0% 88.3% 89.6% 90.9%

27SASFAA MI 12/2008--Utilizing Institutional Research---Dr. Barry W. Simmons Sr. www.finaid.vt.edu/Presentations/SASFAA_MANAGEMENT/index.html
Research Example

28SASFAA MI 12/2008--Utilizing Institutional Research---Dr. Barry W. Simmons Sr. www.finaid.vt.edu/Presentations/SASFAA_MANAGEMENT/index.html
Research ExampleVirginia Financial Aid Related
Metrics for Restructuring

29SASFAA MI 12/2008--Utilizing Institutional Research---Dr. Barry W. Simmons Sr. www.finaid.vt.edu/Presentations/SASFAA_MANAGEMENT/index.html
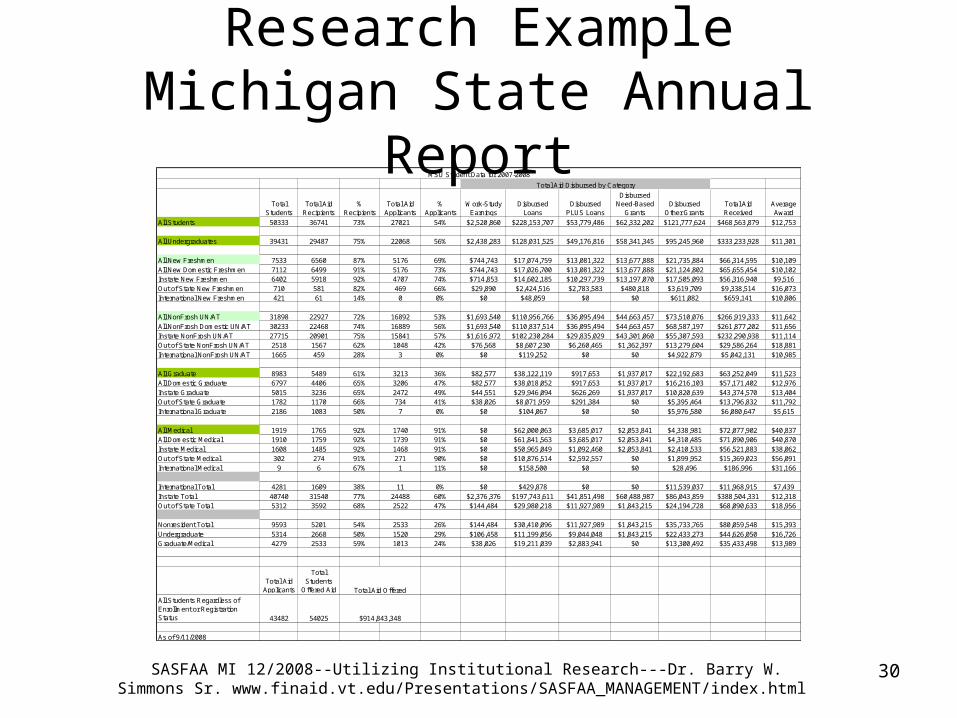
Research ExampleMichigan State Annual Report
2007-08 Annual Expenditure Report MSU Office of Financial Aid
Source Type Program Students Dollars
F S Byrd Scholarship 107 159,563
F S Health Professions Scholarships 45 86,624
F S Americorps 57 115,896
F S Sponsored Research 400 1,127,448
F G Pell Grant 7,004 21,044,541
F G Supplemental Grants 2,348 1,885,734
F G Academic Competitiveness 1,480 1,210,983
F G SMART Grant 382 1,211,675
F L Perkins Loans 4,457 5,115,994
F L Health Professions Loans (HPL, LSD, PCL) 140 853,771
F L Subsidized Stafford 16,497 94,696,292
F L Unsubsidized Stafford 11,736 93,558,152
F L PLUS (Parent) 4,597 48,818,410
F L PLUS (Grad) 293 4,959,639
F W Federal Work Study 1123 1,313,740
F C Controller's Office Awards 311 3,370,488Total of Federal Aid ==> 279,528,950
I S Undergraduate Scholarships 1,046 5,608,637
I S Misc. OAS Scholarships 943 4,903,200
I S Spartan Scholarships 441 2,109,254
I S Athletic Scholarships 528 8,854,413
I S Honors College Scholarships 553 3,259,221
I S MSU National Merit/Achievement 115 99,050
I G Student Aid Grant (UG) 6,974 24,759,476
I G Student Aid Grant (GRAD) 1,085 1,747,970
I G Medical Student Aid Grant 987 2,011,216
I G MSU Student Merit Award 1 500
I G Course Fee Courtesy 539 2,101,250
I G Computer Grant 398 199,000
I G MSU Beaumont Tower Grant 296 408,000
I G Michigan Indian Tuition Waiver 104 759,757
I G MSU Assistance Grant 1941 2,402,167
I G Merge Grant 237 458,748
I G Freshman Grant 1,480 1,447,145
I G Sophomore Grant 986 268,612
I G Spartan Advantage 734 2,845,840
I G Green & White Grant 0 0
I G CAMP Grant 71 182,658
I G Continuing Need Based Rebates 1728 469,172
I L Robert Young Loan 31 253,068
I L MSU Short Term Loans 5,721 4,164,846
I S Misc. Endowments 3,319 7,384,948
I S Misc. Gen.Fund Awards 1,305 1,369,728
I W Professorial Assistantships 695,672
I C Controller's Office Awards 3,205 17,477,696
Total of Institutional Aid ==> 96,241,244
P S National Merit/Achievement 54 107,500
P S Donor Scholarships 4,453 8,870,732
P L Alternative Loans 3,178 30,949,447
P C Controller's Office Awards 1,256 7,815,646
Total of Private Aid ==> 47,743,325
S S Michigan Competitive 4,187 5,049,235
S S Michigan Nursing Scholarship 59 194,000
S S Michigan Merit & Michigan Promise 10,698 13,379,327
S G Adult Part Time Grant & Children of Veterans 59 67,721
S G TIP & Police/Firefighters Act 112 112,851
S G Mich Educational Opportunity Grant 693 136,593
S L Federal Loan Origination Fee Advance 8,246 2,691,117
S W Michigan College Work Study 362 451,230
S C Controller's Office Awards 3,032 27,439,437
Total of State Aid ==> 49,521,511
Total Aid - All Sources ==> 473,035,030
8/22
/200
8
SO
UR
CE
KE
Y:
F =
FE
DE
RA
L,
S
= S
TA
TE
,
I =
IN
ST
ITU
TIO
NA
L,
P
= P
RIV
AT
E
TY
PE
KE
Y:
G =
GR
AN
T,
L =
LO
AN
, S
= S
CH
OLA
RS
HIP
, R
=R
EB
AT
E,
W =
WO
RK
, C
= A
DM
INIS
TE
RE
D B
Y C
ON
TR
OLL
ER
'S O
FF
ICE
30SASFAA MI 12/2008--Utilizing Institutional Research---Dr. Barry W. Simmons Sr. www.finaid.vt.edu/Presentations/SASFAA_MANAGEMENT/index.html
Research ExampleMichigan State Annual Report
Total Students
Total Aid Recipients
% Recipients
Total Aid Applicants
% Applicants
Work-Study Earnings
Disbursed Loans
Disbursed PLUS Loans
Disbursed Need-Based
GrantsDisbursed
Other GrantsTotal Aid Received
Average Award
All Students 50333 36741 73% 27021 54% $2,520,860 $228,153,707 $53,779,486 $62,332,202 $121,777,624 $468,563,879 $12,753
All Undergraduates 39431 29487 75% 22068 56% $2,438,283 $128,031,525 $49,176,816 $58,341,345 $95,245,960 $333,233,928 $11,301
All New Freshmen 7533 6560 87% 5176 69% $744,743 $17,074,759 $13,081,322 $13,677,888 $21,735,884 $66,314,595 $10,109All New Domestic Freshmen 7112 6499 91% 5176 73% $744,743 $17,026,700 $13,081,322 $13,677,888 $21,124,802 $65,655,454 $10,102Instate New Freshmen 6402 5918 92% 4707 74% $714,853 $14,602,185 $10,297,739 $13,197,070 $17,505,093 $56,316,940 $9,516Out of State New Freshmen 710 581 82% 469 66% $29,890 $2,424,516 $2,783,583 $480,818 $3,619,709 $9,338,514 $16,073International New Freshmen 421 61 14% 0 0% $0 $48,059 $0 $0 $611,082 $659,141 $10,806
All NonFrosh UN/AT 31898 22927 72% 16892 53% $1,693,540 $110,956,766 $36,095,494 $44,663,457 $73,510,076 $266,919,333 $11,642All NonFrosh Domestic UN/AT 30233 22468 74% 16889 56% $1,693,540 $110,837,514 $36,095,494 $44,663,457 $68,587,197 $261,877,202 $11,656Instate NonFrosh UN/AT 27715 20901 75% 15841 57% $1,616,972 $102,230,284 $29,835,029 $43,301,060 $55,307,593 $232,290,938 $11,114Out of State NonFrosh UN/AT 2518 1567 62% 1048 42% $76,568 $8,607,230 $6,260,465 $1,362,397 $13,279,604 $29,586,264 $18,881International NonFrosh UN/AT 1665 459 28% 3 0% $0 $119,252 $0 $0 $4,922,879 $5,042,131 $10,985
All Graduate 8983 5489 61% 3213 36% $82,577 $38,122,119 $917,653 $1,937,017 $22,192,683 $63,252,049 $11,523All Domestic Graduate 6797 4406 65% 3206 47% $82,577 $38,018,052 $917,653 $1,937,017 $16,216,103 $57,171,402 $12,976Instate Graduate 5015 3236 65% 2472 49% $44,551 $29,946,094 $626,269 $1,937,017 $10,820,639 $43,374,570 $13,404Out of State Graduate 1782 1170 66% 734 41% $38,026 $8,071,959 $291,384 $0 $5,395,464 $13,796,832 $11,792International Graduate 2186 1083 50% 7 0% $0 $104,067 $0 $0 $5,976,580 $6,080,647 $5,615
All Medical 1919 1765 92% 1740 91% $0 $62,000,063 $3,685,017 $2,053,841 $4,338,981 $72,077,902 $40,837All Domestic Medical 1910 1759 92% 1739 91% $0 $61,841,563 $3,685,017 $2,053,841 $4,310,485 $71,890,906 $40,870Instate Medical 1608 1485 92% 1468 91% $0 $50,965,049 $1,092,460 $2,053,841 $2,410,533 $56,521,883 $38,062Out of State Medical 302 274 91% 271 90% $0 $10,876,514 $2,592,557 $0 $1,899,952 $15,369,023 $56,091International Medical 9 6 67% 1 11% $0 $158,500 $0 $0 $28,496 $186,996 $31,166
International Total 4281 1609 38% 11 0% $0 $429,878 $0 $0 $11,539,037 $11,968,915 $7,439Instate Total 40740 31540 77% 24488 60% $2,376,376 $197,743,611 $41,851,498 $60,488,987 $86,043,859 $388,504,331 $12,318Out of State Total 5312 3592 68% 2522 47% $144,484 $29,980,218 $11,927,989 $1,843,215 $24,194,728 $68,090,633 $18,956
Nonresident Total 9593 5201 54% 2533 26% $144,484 $30,410,096 $11,927,989 $1,843,215 $35,733,765 $80,059,548 $15,393Undergraduate 5314 2668 50% 1520 29% $106,458 $11,199,056 $9,044,048 $1,843,215 $22,433,273 $44,626,050 $16,726Graduate/Medical 4279 2533 59% 1013 24% $38,026 $19,211,039 $2,883,941 $0 $13,300,492 $35,433,498 $13,989
Total Aid Applicants
Total Students
Offered Aid
All Students Regardless of Enrollment or Registration Status 43482 54025
As of 9/11/2008
MSU Student Data for 2007-2008
Total Aid Disbursed by Category
Total Aid Offered
$914,843,348

31SASFAA MI 12/2008--Utilizing Institutional Research---Dr. Barry W. Simmons Sr. www.finaid.vt.edu/Presentations/SASFAA_MANAGEMENT/index.html
Research ExampleVT Financial Statement
UNIVERSITY FINANCIAL HIGHLIGHTS For the years ended June 30, 2004—2008 (all dollars are in millions; square feet in thousands)
2003-04 2004-05 2005-06 2006-07 2007-08 REVENUES, EXPENSES, AND CHANGES IN NET ASSETS (1) Operating revenues $ 459.0 $ 500.9 $ 543.8 $ 595.9 $ 595.9 Operating expenses 97.5 741.9 815.3 883.1 883.1 Operating loss (2) $(238.5) $(241.0) $(271.4) $(287.2) $(287.2)
Non-operating revenues and expenses (2) 239.4 264.4 284.7 313.8 313.8 Other revenues, expenses, gains or losses (3) 60.3 35.5 26.1 122.3 122.3 Net increase (decrease) in net assets $ 61.2 $ 58.8 $ 39.4 $ 148.9 $ 148.9
UNIVERSITY NET ASSETS (1) Invested in capital assets, net of related debt $ 418.7 $ 465.1 $ 496.8 $ 569.7 $ 569.7 Restricted (3) $ 100.6 $ 106.4 $ 100.0 $ 159.4 $ 159.4 Unrestricted $ 49.4 $ 58.2 $ 72.3 $ 88.8 $ 88.8
ASSETS AND FACILITIES Total university assets (1, 3) $ 982.6 $1,046.9 $1,078.1 $1,296.7 $1,296.7 Capital assets, net of accumulated depreciation (1) $ 624.6 $ 698.9 $ 733.2 $ 813.5 $ 813.5 Facilities-owned gross square feet 8,001 8,147 8,454 8,498 8,498 Facilities-leased square feet 609 599 604 682 682 SPONSORED PROGRAMS Number of awards received 2,148 2,086 2,122 2,131 2,131 Value of awards received $ 147.8 $ 189.5 $ 195.9 $ 203.1 $ 203.1 Research expenditures reported to NSF (4) $ 268.8 $ 290.0 $ 321.7 $ 367.0 N/A
VIRGINIA TECH FOUNDATION Gifts and bequests received $ 53.9 $ 71.6 $ 81.8 $ 78.5 $ 78.5 Expended in support of the university $ 86.6 $ 97.8 $ 102.4 $ 107.3 $ 107.3 Total assets and managed funds $ 613.5 $ 670.4 $ 728.0 $ 808.9 $ 940.9
ENDOWMENTS (AT MARKET VALUE) Owned by Virginia Tech Foundation (VTF) $ 325.5 $ 361.7 $ 398.3 $ 469.4 $ 469.4 Owned by Virginia Tech 39.5 40.8 42.6 47.8 47.8 Managed by VTF under agency agreements 6.2 6.4 6.9 7.9 7.9 Total endowments supporting the university $ 371.2 $ 408.9 $ 447.8 $ 525.1 $ 525.1
STUDENT FINANCIAL AID Number of students receiving selected types of financial aid Loans 11,055 10,962 11,140 11,067 11,376 Grants, scholarships and waivers 14,140 14,088 14,481 15,600 16,221 Employment opportunities 7,792 7,923 8,067 8,101 8,699
Total amounts by major category Loans $ 90.7 $ 93.6 $ 101.0 $ 102.2 $ 105.9 Grants, scholarships and waivers (5) 85.4 94.8 104.1 119.8 139.2 Employment opportunities 45.7 48.7 50.5 53.4 58.4 Total financial aid $ 221.8 $ 237.1 $ 255.6 $ 275.4 $ 303.5
(1) The university adopted the new Governmental Accounting Standard Board (GASB) reporting model in fiscal year 2002 as required by GASB Statement Number 35, Basic Financial Statement—and Management's Discussion and Analysis—for Public Colleges and Universities.
(2) The university will always be expected to show an operating loss since significant recurring revenues are shown as non-operating. Major revenue sources reported as non-operating include state appropriations, gifts, and investment income. These revenue sources are used for general operations in support of the learning, discovery, and engagement missions of the university.
(3) Totals for 2006 have been restated to reflect the change in reporting guidelines for appropriations received from the Treasury of Virginia.
(4) Total research expenditures for NSF report were not available at publication date.

32SASFAA MI 12/2008--Utilizing Institutional Research---Dr. Barry W. Simmons Sr. www.finaid.vt.edu/Presentations/SASFAA_MANAGEMENT/index.html
Research Example: VT Funds for the Future

33SASFAA MI 12/2008--Utilizing Institutional Research---Dr. Barry W. Simmons Sr. www.finaid.vt.edu/Presentations/SASFAA_MANAGEMENT/index.html
Research ExampleVT Funds for the Future
In-StateFamily Income Student Count Raw Need Unmet Need % of Unmet Need Average EFC Min EFC Max EFC
$0 - $29,999 1,232 18,305,086 5,269,591 28.8% 1,124 $30,000 - $49,999 747 9,625,822 3,086,708 32.1% 3,853 $50,000 - $74,999 968 8,481,582 2,283,166 26.9% 7,977 $75,000 - $99,999 634 3,627,703 762,538 21.0% 11,129 $100,000 or more 380 1,468,762 231,610 15.8% 13,016 Total 3,961 41,508,955 11,633,613 28.0%
Out-of-StateFamily Income Student Count Raw Need Unmet Need % of Unmet Need Average EFC Min EFC Max EFC
$0 - $29,999 262 6,144,425 1,947,515 31.7% 1,548 $30,000 - $49,999 176 4,014,261 1,451,888 36.2% 3,985 $50,000 - $74,999 252 4,456,513 1,698,759 38.1% 8,662 $75,000 - $99,999 404 5,108,472 2,304,241 45.1% 14,350 $100,000 or more 479 3,823,005 1,466,783 38.4% 19,198 Total 1,573 23,546,676 8,869,186 37.7%
In-StateAll Studentswith Need
ContinuingStudents
% of ContinuingStudents
Students with Need A 5,793 4,245 73% All Students Non-Freshman
Students w/Need Packaged by System B 5,416 3,937 In-State 289 177 Students w/Need Packaged Manually C 43 24 Out-of-State 227 88
Students w/Need, Received Aid D 5,170 3,784 73% Total 516 265 Students w/Need, Enrolled E 5,359 3,902 73%
Students w/Need Packaged (B+C) 5,459 3,961 73%
Out-of-StateAll Studentswith Need
ContinuingStudents
% of ContinuingStudents
Students with Need A 2,536 1,645 65% All Students Non-Freshman
Students w/Need Packaged by System B 2,414 1,558 In-State 623 461 Students w/Need Packaged Manually C 19 15 Out-of-State 330 160
Students w/Need, Received Aid D 2,206 1,485 67% Total 953 621 Students w/Need, Enrolled E 2,316 1,539 66%
Students w/Need Packaged (B+C) 2,433 1,573 65%
Student Count and Need Analysis Components for Continuing Undergraduate Students with Need who were Packaged, 2005-2006
Difference 1:(Packaged - Received Aid)
Difference 2(With Need - Received Aid)

34SASFAA MI 12/2008--Utilizing Institutional Research---Dr. Barry W. Simmons Sr. www.finaid.vt.edu/Presentations/SASFAA_MANAGEMENT/index.html
Research ExampleVT Funds for the Future
In-State Undergraduate StudentsProjected
2003-04 2004-05 2005-06 2006-07 2007-08 2008-09 2009-10 2010-11 2011-12 Increase Tuition & Mandatory E&G Fees $4,228 $4,826 $5,297 $5,813 $6,160 $6,758 $7,413 $8,132 $8,921 9.7%Mandatory Non E&G Fees $867 $1,012 $1,081 $1,160 $1,237 $1,299 $1,364 $1,432 $1,504 5.0%Total Tuition & Fees $5,095 $5,838 $6,378 $6,973 $7,397 $8,056 $8,777 $9,564 $10,424
Dollar Increase of Tuition & Mandatory E&G Fees $516 $347 $598 $655 $719 $789Dollar Increase of Mandatory non E&G Fees $79 $77 $62 $65 $68 $72
Total Dollar Increase of Tuition & Mandatory Fees $595 $424 $659 $720 $787 $860Increase in Tuition and Mandatory Fees 8.5% 5.7% 8.2% 8.2% 8.2% 8.3%
Out-Of-State Undergraduate StudentsProjected
2003-04 2004-05 2005-06 2006-07 2007-08 2008-09 2009-10 2010-11 2011-12 Increase Tuition & Mandatory E&G Fees $14,162 $15,569 $16,756 $17,889 $18,538 $19,780 $21,105 $22,519 $24,028 6.7%Mandatory Non E&G Fees $867 $1,012 $1,081 $1,160 $1,237 $1,299 $1,364 $1,432 $1,504 5.0%Total Tuition & Fees $15,029 $16,581 $17,837 $19,049 $19,775 $21,079 $22,469 $23,951 $25,532
Dollar Increase of Tuition & Mandatory E&G Fees $1,133 $649 $1,242 $1,325 $1,414 $1,509Dollar Increase of Mandatory non E&G Fees $79 $77 $62 $65 $68 $72
Total Dollar Increase of Tuition & Mandatory Fees $1,212 $726 $1,304 $1,390 $1,482 $1,580Increase in Tuition and Mandatory Fees 6.4% 3.7% 6.2% 6.2% 6.2% 6.2%
Residency DescriptionReduce Unmet Need:
Group A: 1.00% each yearGroup B: 0.50% each year
Offsett Tuition & Fee Increase: "Effective" Increase in Tuition & Mandatory Fees (0708)
Group A: 100% 0.0%
Group B: 70% 2.6%
Group C: 30% 6.0%
Group D: 10% 7.7%
Group E: 0% 8.5%
Reduce Unmet Need:Group A: 1.00% each yearGroup B: 0.50% each year
Offsett Tuition & Fee Increase: "Effective" Increase in Tuition & Mandatory Fees
Group A: 60% 2.5%
Group B: 40% 3.8%
Group C: 30% 4.5%
Group D: 20% 5.1%
Group E: 0% 6.4%
Tuition and Fees Assumptions, 2006-2012
Model Scenario
IN-S
TA
TE
T & F Components
Tuition & Fees Projections
Tuition & Fees Projections
OU
T-O
F-S
TA
TE
T & F ComponentsActual Tuition & Fees
Actual Tuition & Fees

35SASFAA MI 12/2008--Utilizing Institutional Research---Dr. Barry W. Simmons Sr. www.finaid.vt.edu/Presentations/SASFAA_MANAGEMENT/index.html
Research ExampleVT Funds for the Future
In-State Undergraduates with Financial Need
2004-05 2005-06 2006-07 2007-08 2008-09 2009-10 2010-11 2011-12
A $0 - $29,999 28.8% 7,047,952 5,269,591 5,339,150 5,409,626 5,481,033 5,553,383 5,626,688 5,700,960B $30,000 - $49,999 32.1% 4,702,807 3,086,708 3,127,453 3,168,735 3,210,562 3,252,942 3,295,880 3,339,386C $50,000 - $74,999 26.9% 3,888,829 2,283,166 2,313,304 2,343,839 2,374,778 2,406,125 2,437,886 2,470,066D $75,000 - $99,999 21.0% 1,475,955 762,538 772,604 782,802 793,135 803,604 814,212 824,959E $100,000 or more 15.8% 519,457 231,610 234,667 237,765 240,903 244,083 247,305 250,570
Total 28.0% 17,635,000 11,633,613 11,787,177 11,942,767 12,100,412 12,260,137 12,421,971 12,585,941
Current Total Raw Need23,296,792 18,305,086 18,546,713 18,791,530 19,039,578 19,290,900 19,545,540 19,803,541
27.79% 26.79% 25.79% 24.79% 23.79% 22.79%5,153,682 5,033,796 4,909,846 4,781,747 4,649,411 4,512,748
Cummulative Reduction Cost 185,467 375,831 571,187 771,636 977,277 1,188,212Annual Reduction Cost 185,467 190,363 195,357 200,449 205,641 210,935
Current Total Raw Need13,626,336 9,625,822 9,752,883 9,881,621 10,012,058 10,144,217 10,278,121 10,413,792
31.57% 31.07% 30.57% 30.07% 29.57% 29.07%3,078,688 3,069,919 3,060,381 3,050,057 3,038,927 3,026,972
Cummulative Reduction Cost 48,764 98,816 150,181 202,884 256,953 312,414Annual Reduction Cost 48,764 50,052 51,365 52,703 54,069 55,461
Out-Of-State Undergraduates with Financial Need
2004-05 2005-06 2006-07 2007-08 2008-09 2009-10 2010-11 2011-12
A $0 - $29,999 31.7% 3,085,545 1,947,515 1,963,095 1,978,800 1,994,630 2,010,587 2,026,672 2,042,885B $30,000 - $49,999 36.2% 2,782,574 1,451,888 1,463,503 1,475,211 1,487,013 1,498,909 1,510,900 1,522,987C $50,000 - $74,999 38.1% 3,181,320 1,698,759 1,712,349 1,726,048 1,739,856 1,753,775 1,767,805 1,781,948D $75,000 - $99,999 45.1% 3,321,562 2,304,241 2,322,675 2,341,256 2,359,986 2,378,866 2,397,897 2,417,080E $100,000 or more 38.4% 2,587,642 1,466,783 1,478,517 1,490,345 1,502,268 1,514,286 1,526,401 1,538,612
Total 37.7% 14,958,643 8,869,186 8,940,139 9,011,661 9,083,754 9,156,424 9,229,675 9,303,513
Current Total Raw Need8,587,408 6,144,425 6,193,580 6,243,129 6,293,074 6,343,419 6,394,166 6,445,319
30.70% 29.70% 28.70% 27.70% 26.70% 25.70%1,901,159 1,853,937 1,805,838 1,756,851 1,706,964 1,656,166
Cummulative Reduction Cost 61,936 124,863 188,792 253,737 319,708 386,719Annual Reduction Cost 61,936 62,927 63,930 64,945 65,972 67,011
Current Total Raw Need7,071,474 4,014,261 4,046,375 4,078,746 4,111,376 4,144,267 4,177,421 4,210,841
35.67% 35.17% 34.67% 34.17% 33.67% 33.17%1,443,271 1,434,424 1,425,342 1,416,024 1,406,465 1,396,662
Cummulative Reduction Cost 20,232 40,787 61,671 82,885 104,436 126,325Annual Reduction Cost 20,232 20,556 20,883 21,215 21,550 21,890
CPI= 1.02
Percentage of Unmet Need
Percentage of Unmet Need
Total Raw Need Projections
Percentage of Unmet Need
Total Raw Need Projections
Adjusted Unmet Need
Unmet Need Projection Family Income
"Reducing Unmet Need" Projections (2006-2012)
Total Raw Need Projections
Unmet Need Projection
GROUP A
Family Income
Adjusted Unmet Need
IncomeGroups
Unmet Needas % of
Raw Need (0405)
Adjusted Unmet Need
IncomeGroups
Unmet Needas % of
Raw Need (0405)
GROUP B
Total Raw Need ProjectionsGROUP A
GROUP B
Adjusted Unmet Need
Percentage of Unmet Need

36SASFAA MI 12/2008--Utilizing Institutional Research---Dr. Barry W. Simmons Sr. www.finaid.vt.edu/Presentations/SASFAA_MANAGEMENT/index.html
Research ExampleVT Funds for the Future
Student Financial Aid Planning"Funds for the Future" Total Cost, 2006-2012
Residency Effect Type 2006-07 2007-08Total
2007-2008Reduce UN - Gr. A 190,363 190,363
Reduce UN - Gr. B 50,052 50,052
Offsett T & F 1,254,677 894,089 2,148,765
Annual Cost 1,254,677 1,134,504 2,389,181
Reduce UN - Gr. A 62,927 62,927
Reduce UN - Gr. B 20,556 20,556
Offsett T & F 465,408 278,784 744,192
Annual Cost 465,408 362,266 827,674
0 323,898 323,898
1,720,085 1,172,873 2,892,957
1,720,085 1,496,770 3,216,855
Funding Strategies
Sources Trend Funding Level2003-2004 ($)
2006-07 2007-08 2008-09 2009-10 2010-11 2011-12
Federal 0.0% - - - - - - - State 4.3% 9,340,287Endowment 2.0% 569,198Private 2.0% 5,032,477Student Loans 2.0% 31,377,935Unfunded Schol. (0506 savings) - - - Institutional (Unfunded Scholarships) - - -
- - - - - -
IN-S
TA
TE
OU
T-O
F-S
TA
TE
Total Funds Needed ($)
"Reduce Unmet Need" Component
"Tuition Increase Protection" Component

37SASFAA MI 12/2008--Utilizing Institutional Research---Dr. Barry W. Simmons Sr. www.finaid.vt.edu/Presentations/SASFAA_MANAGEMENT/index.html
Research ExampleVT Funds for the Future
2006-07 2007-08 2008-09 2009-10 2010-11 2011-12
A $0 - $29,999 1,232 100% 733,040 522,368 812,344 887,560 969,893 1,060,024B $30,000 - $49,999 747 100% 444,465 316,728 492,549 538,155 588,076 642,725C $50,000 - $74,999 968 100% 575,960 410,432 638,270 697,368 762,059 832,876D $75,000 - $99,999 634 100% 377,230 268,816 418,041 456,748 499,117 545,499E $100,000 or more 380 100% 226,100 161,120 250,561 273,760 299,155 326,955
Group A 100% 733,040 522,368 812,344 887,560 969,893 1,060,024Group B 70% 311,126 221,710 344,785 376,709 411,653 449,908Group C 30% 172,788 123,130 191,481 209,211 228,618 249,863Group D 10% 37,723 26,882 41,804 45,675 49,912 54,550Group E 0% 0 0 0 0 0 0
1,254,677 894,089 1,390,414 1,519,154 1,660,075 1,814,344
2006-07 2007-08 2008-09 2009-10 2010-11 2011-12
A $0 - $29,999 262 100% 317,544 190,212 341,621 364,234 388,348 414,064B $30,000 - $49,999 176 100% 213,312 127,776 229,486 244,676 260,875 278,150C $50,000 - $74,999 252 100% 305,424 182,952 328,582 350,332 373,526 398,260D $75,000 - $99,999 404 100% 489,648 293,304 526,774 561,643 598,827 638,480E $100,000 or more 479 100% 580,548 347,754 624,566 665,908 709,996 757,010
Group A 60% 190,526 114,127 204,972 218,540 233,009 248,438Group B 40% 85,325 51,110 91,794 97,870 104,350 111,260Group C 30% 91,627 54,886 98,575 105,100 112,058 119,478Group D 20% 97,930 58,661 105,355 112,329 119,765 127,696Group E 0% 0 0 0 0 0 0
465,408 278,784 500,696 533,839 569,182 606,872
Cost
Family Income
Scenarios
Baseline
Cost
Annual T&F Offsetting Cost
Family Income
ScenariosStudentCount
(2005-06)
OffsettingLevel
Baseline
In-State Undergraduates with Financial Need
IncomeGroup
"Offsetting Tuition & Mandatory Fees Increase" Projections (2006-2012)
Out-Of-State Undergraduates with Financial Need
Tuition & Mandatory Fees StudentCount
(2005-06)
Tuition & Mandatory Fees
OffsettingLevel
IncomeGroup
Annual Offsetting Cost

38SASFAA MI 12/2008--Utilizing Institutional Research---Dr. Barry W. Simmons Sr. www.finaid.vt.edu/Presentations/SASFAA_MANAGEMENT/index.html
Research ExampleVT Funds for the Future
Per Semester Annual Per Semester AnnualTuition & Mandatory E&G Fees Tuition: VA Resident 2,725 5,450 5,772 5.9%Tuition: Non-VA Resident 8,703 17,406 17,980 3.3%Academic Fee 163 325 350 Technology Fee 19 38 38 Capital & Equipment Fee (Non-Resident only 60 120 170
Mandatory Non E&G Fees Student Activity Fee 140 280 297 Health Fee 135 269 290 Atletic Fee 116 232 232 Bus Fee 44 87 95 Recreational Sports Fee 82 163 178 Student Services Fee 65 129 145
Total Comprehensive fee 1,160 1,237
VA Residents Non-VA Residents VA Residents Non-VA ResidentsTuition & Mandatory E&G Fees 5,813 17,889 6,160 18,538 Mandatory Non E&G Fees 1,160 1,160 1,237 1,237 Total Tuition & Fees Annual 6,973 19,049 7,397 19,775
Per semester 3,487 9,525 3,699 9,888
Virginia Tech Tuition & Fee Rates 2007-2008 - Undergraduates
2006-2007
2006-2007
2007-2008
2007-2008

39SASFAA MI 12/2008--Utilizing Institutional Research---Dr. Barry W. Simmons Sr. www.finaid.vt.edu/Presentations/SASFAA_MANAGEMENT/index.html
Research ExampleVT Short Narrative on
Presidential Scholarship Initiative(PSI) New Access Program
Funding Model for Virginia Tech Presidential Scholarship Initiative (PSI)
The funding model for the PSI utilizes existing aid programs with the addition of Virginia Tech funds to equal the direct cost of in-state tuition, required fees and on-campus room and board for each recipient. For 2008-09 that direct cost would be $13,674. Since the focus of the PSI is to assist low income, Pell Grant eligible students, those eligible will qualify for other in-place programs of need-based financial aid at the federal, state and institutional levels. This approach enables Virginia Tech to help the neediest students understand how tuition, fees, room and board can be addressed loan-free. The funding model estimates, on the average, that PSI participants’ direct costs will be covered by 28% federal grants, 41% state grants and 16% institutional grants and scholarships from a variety of sources including general and departmental endowed monies, unfunded scholarships and other miscellaneous sources. The remaining 15% of monies needed to meet the direct cost of each student will be covered with additional expenditures from unfunded scholarships. The bundling of multiple financial aid programs under one umbrella is designed to simplify the complexity of higher education financial aid programs thereby helping individuals more easily understand and access higher education at Virginia Tech.

40SASFAA MI 12/2008--Utilizing Institutional Research---Dr. Barry W. Simmons Sr. www.finaid.vt.edu/Presentations/SASFAA_MANAGEMENT/index.html
Research ExampleVT PSI Access Program

41SASFAA MI 12/2008--Utilizing Institutional Research---Dr. Barry W. Simmons Sr. www.finaid.vt.edu/Presentations/SASFAA_MANAGEMENT/index.html
Research ExampleVT PSI Access Program

42SASFAA MI 12/2008--Utilizing Institutional Research---Dr. Barry W. Simmons Sr. www.finaid.vt.edu/Presentations/SASFAA_MANAGEMENT/index.html
Research ExampleVT PSI Access Program

43SASFAA MI 12/2008--Utilizing Institutional Research---Dr. Barry W. Simmons Sr. www.finaid.vt.edu/Presentations/SASFAA_MANAGEMENT/index.html

44SASFAA MI 12/2008--Utilizing Institutional Research---Dr. Barry W. Simmons Sr. www.finaid.vt.edu/Presentations/SASFAA_MANAGEMENT/index.html
Research ExampleVT College Level Summary
College Level Aid At Vt
Residency No. of Students
with Need Average
Financial Need Average
Unmet Need % of
Unmet NeedIn-State 1,342 12,228 3,372 27.58%Out-of-state 411 17,745 5,938 33.47%LAHS College Total 1,753 13,522 3,974 29.39%
Level No. of Students
with Need Average
Financial Need Average
Unmet Need % of
Unmet NeedUG 1,280 16,080 5,023 31.24%GR 473 12,576 3,586 28.52%LAHS College Total 1,753 13,522 3,974 29.39%
Gender No. of Students
with Need Average
Financial Need Average
Unmet Need % of
Unmet NeedFemale 1,063 13,515 3,993 29.54%Male 690 13,532 3,945 29.15%LAHS College Total 1,753 13,522 3,974 29.39%
Ethnicity No. of Students
with Need Average
Financial Need Average
Unmet Need % of
Unmet NeedAmerican Indian/Alaska Native 11 15,117 3,834 25.36%Asian/Pacific Islander 81 12,847 3,897 30.33%Black 204 15,778 2,940 18.64%Caucasian 1,281 13,224 4,124 31.19%Hispanic 68 14,702 4,587 31.20%Unknown 108 12,395 3,834 30.93%LAHS College Total 1,753 13,522 3,974 29.39%
Parent Marital Status No. of Students
with Need Average
Financial Need Average
Unmet Need % of
Unmet NeedMarried 878 10,963 3,380 30.83%Single 39 18,181 3,287 18.08%Divorced 269 16,117 4,533 28.12%Widowed 37 17,280 4,837 27.99%Unknown 530 15,839 4,665 29.45%LAHS College Total 1,753 13,522 3,974 29.39%
CLASS No. of Students
with Need Average
Financial Need Average
Unmet Need % of
Unmet NeedFreshman 247 13,303 4,770 35.86%Sophomore 298 12,293 3,537 28.77%Junior 350 12,978 3,331 25.66%Senior 385 11,964 3,097 25.89%Masters 416 16,644 5,407 32.48%Doctoral 46 12,938 2,589 20.01%Educational Specialist 11 7,886 688 8.72%LAHS College Total 1,753 13,522 3,974 29.39%

45SASFAA MI 12/2008--Utilizing Institutional Research---Dr. Barry W. Simmons Sr. www.finaid.vt.edu/Presentations/SASFAA_MANAGEMENT/index.html
Research ExampleVT College Level Summary
MAJOR No. of Students
with Need Admin & Superv of Special Ed 3 Apprl, Housing, & Resource Mgt 128 Career and Technical Education 38 Classical Studies 8 Communication 197 Counselor Education 45 Creative Writing 7 Curriculum and Instruction 127 Educ Ldrshp & Policy Studies 41 Educational Research & Evaluat 7 English 166 Foreign Langs, Cultures, & Lit 1 French 3 German 6 Health & Physical Education 47 History 155 Human Development 113 Humanities, Science, & Environ 11 Interdisciplinary Studies 138 International Studies 117 Liberal Arts & Human Sciences 1 Music 37 Philosophy 18 Political Science 174 Rhetoric and Writing 2 Science & Technology Studies 5 Soc, Pol, Ethical, & Cultural 4 Sociology 112 Spanish 20 Theatre Arts 22 LAHS College Total 1,753

46SASFAA MI 12/2008--Utilizing Institutional Research---Dr. Barry W. Simmons Sr. www.finaid.vt.edu/Presentations/SASFAA_MANAGEMENT/index.html
Research Example
Open Floor
Who’s doing what?

47SASFAA MI 12/2008--Utilizing Institutional Research---Dr. Barry W. Simmons Sr. www.finaid.vt.edu/Presentations/SASFAA_MANAGEMENT/index.html
Recap
• Need for Research• Basic Principles and Statistics• Data Sources• Tools• Foibles• Examples• Sharing• Questions• The End
48SASFAA MI 12/2008--Utilizing Institutional Research---Dr. Barry W. Simmons Sr. www.finaid.vt.edu/Presentations/SASFAA_MANAGEMENT/index.html
Questions?
Contact Info:
Dr. Barry W. Simmons Sr.
Related Documents