ORIGINAL ARTICLE MRI diffusion-weighted imaging in intracranial hemorrhage (ICH) Sherif A. Khedr a,b, * , Hassan Mahmoud Kassem a,b,1 , Ahmed M. Hazzou c,2 , Eman Awad c,3 , Mohamed M. Fouad d,4 a Radiology Department, Cairo University, Egypt b Radiology Department, Benh University, Egypt c Depar tement of Neuro logy and Psycha try, Ain Shams Universit y, Egypt d Neurosurgery Department, Cairo University, Egypt Received 16 March 2013; accepted 19 April 2013 Available online 5 June 2013 KEYWORDS DWI; ICH; Hemorrhag ic infarction Abstract Purpose: To assess the role of MRI DWI in detect ion and character ization of ICH. Patients and methods: 61 patients with intracranial hemorrhage who underwent MRI (including DWI, ADC, and GRE) and CT were retrospectively included in this study. MRI DWIs were ana- lyzed for age, type, (primary parenchymal hemor rhage or hemo rrhag ic lesion ) and location of the hemorrhage. The results were compared with conventional MRI sequences, GRE, and CT to assess the diagnostic accuracy of DWI in assessment of patients with intracranial hematoma. Results: We had 61 patients with intracranial hemorrhage, six cases were missed by DWI. MRI DWI was accurate for the detection of hyperacute, medium, large sized acute, early and late sub acute, subdural, hemorrhagic components of arterial and venous infarction, intraventricular hem- orrh age. DWI showed low sensi tivity in detection of subarachno id and small intrap arenc hymal hemorrhage The ADC measurements in hyperacute, acute, early and late subacute hematoma were statistically equivalent and were significantly less than the late subacute hematoma as well as the contralateral white matter. * Corresponding author at: Radiology Department, Cairo University, Jeddah, Saudi Arabia. Tel.: +966 540953377. E-mail addresse s: [email protected] (S.A. Khed r), kassem_ [email protected] (H.M. Kassem), [email protected] (A.M. Hazzou), [email protected] (E. Awad), mmfoad@hotmail. com (M.M. Fouad). 1 Tel.: +966 54108516. 2 Tel.: +966 509706661. 3 Tel.: +966 56411026. 4 Tel.: +20 1005389192. Peer review under responsibility of Egyptian Society of Radiology and Nuclear Medicine. Production and hosting by Elsevier The Egyptian Journal of Radiology and Nuclear Medicine (2013) 44 , 625–634 Egyptian Society of Radiology and Nuclear Medicine The Egyp tian Journal of Radi olo gy and Nucl ear Medi ci ne www.elsevier.com/locate/ejrnm www.sciencedirect.com 0378-603X 2013 Production and hosting by Elsevier B.V. on behalf of Egyptian Society of Radiology and Nuclear Medicine. http://dx.doi.or g/10.1016/j.ejrnm.20 13.04.010 Open access under CC BY-NC-ND license.

Welcome message from author
This document is posted to help you gain knowledge. Please leave a comment to let me know what you think about it! Share it to your friends and learn new things together.
Transcript

7/26/2019 1-s2.0-S0378603X13000508-main.pdf
http://slidepdf.com/reader/full/1-s20-s0378603x13000508-mainpdf 1/10
ORIGINAL ARTICLE
MRI diffusion-weighted imaging in intracranial
hemorrhage (ICH)
Sherif A. Khedr a,b,*, Hassan Mahmoud Kassem a,b,1, Ahmed M. Hazzou c,2,
Eman Awad c,3, Mohamed M. Fouad d,4
a Radiology Department, Cairo University, Egyptb Radiology Department, Benh University, Egyptc Departement of Neurology and Psychatry, Ain Shams University, Egyptd Neurosurgery Department, Cairo University, Egypt
Received 16 March 2013; accepted 19 April 2013
Available online 5 June 2013
KEYWORDS
DWI;
ICH;
Hemorrhagic infarction
Abstract Purpose: To assess the role of MRI DWI in detection and characterization of ICH.
Patients and methods: 61 patients with intracranial hemorrhage who underwent MRI (including
DWI, ADC, and GRE) and CT were retrospectively included in this study. MRI DWIs were ana-
lyzed for age, type, (primary parenchymal hemorrhage or hemorrhagic lesion) and location of the
hemorrhage. The results were compared with conventional MRI sequences, GRE, and CT to assess
the diagnostic accuracy of DWI in assessment of patients with intracranial hematoma.
Results: We had 61 patients with intracranial hemorrhage, six cases were missed by DWI. MRI
DWI was accurate for the detection of hyperacute, medium, large sized acute, early and late sub
acute, subdural, hemorrhagic components of arterial and venous infarction, intraventricular hem-
orrhage. DWI showed low sensitivity in detection of subarachnoid and small intraparenchymal
hemorrhage The ADC measurements in hyperacute, acute, early and late subacute hematoma were
statistically equivalent and were significantly less than the late subacute hematoma as well as the
contralateral white matter.
* Corresponding author at: Radiology Department, Cairo University,
Jeddah, Saudi Arabia. Tel.: +966 540953377.
E-mail addresses: [email protected] (S.A. Khedr), kassem_ [email protected] (H.M. Kassem), [email protected] (A.M.
Hazzou), [email protected] (E. Awad), mmfoad@hotmail.
com (M.M. Fouad).1 Tel.: +966 54108516.2 Tel.: +966 509706661.3 Tel.: +966 56411026.4 Tel.: +20 1005389192.
Peer review under responsibility of Egyptian Society of Radiology and
Nuclear Medicine.
Production and hosting by Elsevier
The Egyptian Journal of Radiology and Nuclear Medicine (2013) 44, 625–634
Egyptian Society of Radiology and Nuclear Medicine
The Egyptian Journal of Radiology and Nuclear Medicine
www.elsevier.com/locate/ejrnmwww.sciencedirect.com
0378-603X 2013 Production and hosting by Elsevier B.V. on behalf of Egyptian Society of Radiology and Nuclear Medicine.http://dx.doi.org/10.1016/j.ejrnm.2013.04.010Open access under CC BY-NC-ND license.

7/26/2019 1-s2.0-S0378603X13000508-main.pdf
http://slidepdf.com/reader/full/1-s20-s0378603x13000508-mainpdf 2/10
Conclusion: MRI DWI was accurate in detection, characterization and staging hyperacute, acute,
subacute hemorrhage as well as hemorrhagic components of arterial and venous infarctions and of
low diagnostic accuracy in subarachnoid and small parenchymal hemorrhage.
2013 Production and hosting by Elsevier B.V. on behalf of Egyptian Society of Radiology and Nuclear
1. Introduction
Non contrast computed tomography (CT) has been the stan-
dard imaging modality for the initial evaluation of patients
presenting with acute stroke symptoms (1,2). The primary
diagnostic advantage of CT in the hyperacute phase (0–6 h)
is its ability to rule out the presence of hemorrhage. Accurate
early detection of blood is crucial since a history of intracere-
bral hemorrhage is a contraindication to the use of thrombo-
lytic agents. However, a major disadvantage of conventional
CT within the first few hours of symptom onset is its limited
sensitivity for identifying early evidence of cerebral ischemia.
Conversely, multimodal magnetic resonance imaging (MRI),
including diffusion-weighted imaging (DWI), has excellent
capacity to delineate the presence, size, location, and extentof hyperacute ischemia (3) but unproven reliability in identify-
ing early parenchymal hemorrhage. The advent of thrombo-
lytic therapy and other interventional therapies for acute
ischemic stroke has led to increasing interest in using MRI
to select and stratify candidates for treatments (4). Currently,
many stroke centers obtain both CT and MRI in the initial
evaluation of patients with stroke. The use of both modalities
is time consuming and expensive (4).
2. Purpose
To assess the role of MRI diffusion weighted imaging in detec-
tion and characterization of intracranial hemorrhage.
3. Patients
Among all consecutive patients admitted to our institution be-
tween March 2008 and Feb. 2011, we retrospectively selected
those who fulfilled the following criteria: (1) Intracranial
hematoma unrelated to neoplasm; (2) patients performed
MRI (including DWI and GRE) and CT with time interval be-
tween the CT and MRI examinations 2–4 h.
61 patients (10 females and 51 males; mean age, 56 years;
range, 19–83) fulfilled these criteria and constituted our study
group.
4. Imaging techniques
MR examination was done for all patients using Magnetom
symphony, syngo, 1.5 T machine. The conventional MR imag-
ing protocol included (a) axial T1-weighted spin-echo (467/9
[repetition time (TR) msec/echo time (TE) msec]), (b) axial
T2-weighted fast spin-echo (3417/102 [effective echo time]),
and (c) axial FLAIR (10000/400/2200 [inversion time]). Theparameters of conventional MR imaging were a 256 192 ma-
trix, a 23-cm field of view, and a 5 mm/2 mm slice thickness/
intersection gap. Singleshot, spin-echo, echo-planar DWI se-
quences were obtained by applying diffusion gradients in three
orthogonal directions at each slice, with two diffusion weigh-
tings (b value = 0 and 900 or 1000 s/mm2). Isotropic DWI
was generated on-line by averaging three orthogonal-axis
images. The DWI examination acquired 20 slices with param-
eters of 6500/96.8 (TR/TE), a 128 128 matrix, a 28-cm field of
view, and 5-mm slice thickness with a 2-mm intersection gap.
gradient-echo imaging (TR/TE = 450/20).
Computed tomographic scans were performed on Light-
speed scanner (General Electric). Images were acquired follow-
ing the orbito-meatal plane with 3 mm thickness for the entire
examination.
5. Imaging analysis
All the MRI and CT examination were reviewed by experi-
enced neuroradiologist. Interpretations for each imaging
Table 1 Signal intensities of intracerebral hematoma-according to the various stages demonstrated on MR images.
Stage of hematoma No of patients T1 WIs T2 WIs DWI GRE
Hyper acute 3 Isointense Hyperintense Heterogeneous hyperintense Iso or hyperintense
Acute 11 Isointense Hypointense Hypo HypointenseSmall parenchymal hemorrhage 4 – Hypo or hyperintense Hypo or hyperintense Hypointense
Early subacute 7 Hyperintense Hypointense Hypointense Hypointense
Late subacute 9 Hyperintense Hyperintense Hyperintense Hyper or iso
Subdural
Early 1 Hyperintense Hypointense Hypointense Hypointense
Late 4 Hyperintense Hyperintense Hypointense Iso or hypointense
Intraventricular 4 Hypointense Hypointense Hypointense Hypointense
Hemorrhagic arterial infarction 8 Heterogeneous hypo
and hyper
Heterogeneous hypo
and hyper
Heterogeneous hypo
and hyper
Heterogeneous hypo
and hyper
Hemorrhagic venous infarction 7 Heterogeneous hypo
and hyperintense
Heterogeneous hypo
and hyperintense
Heterogeneous hypo
and hyperintense
Heterogeneous hypo
and hyperintense
Subarachnoid hemorrhage 3 Hypo or hyperintense Hypointense Hypointense Hypointense
626 S.A. Khedr et al.
Medicine.Open access under CC BY-NC-ND license.

7/26/2019 1-s2.0-S0378603X13000508-main.pdf
http://slidepdf.com/reader/full/1-s20-s0378603x13000508-mainpdf 3/10
modality (CT and MRI) for a single patient were performed on
different days to avoid reader recognition or recall of findings
from the other modality. The order of presentation of the films
was randomized and differed for each modality.
Diffusion weighted imaging was analyzed for
- Type of hemorrhage; parenchymal, intraventricular, sub-
arachnoid, subdural, and epidural.
- Location of the hemorrhage; cortical, subcortical or basal
ganglia.
- Age of the hemorrhage. According to the time interval
between symptom onset and initial MRI, four stages were
categorized: hyperacute, acute, early subacute and latesubacute.
6. Quantitative analysis
It was used to determine the apparent diffusion coefficient
(ADC) of each ICH (hyper acute, acute, early subacute and
late subacute) at its center, as seen at DWI. A region of interest
(ROI) was carefully placed within the hematoma and also in
contralateral normal white matter. The ROI was drawn as
large as possible while using a circular or rectangular ROI
on the workstation, and its area ranged from 14 to 302 mm2.
ADC calculation could not be done in small areas of hemor-
rhage. In each case, the radiologist measured the ROI and
the ADC values were calculated. All data concerning ADC
values are presented as means 1 standard deviation.
7. Statistical analysis
The presence of intracerebral hematomas was proved by CT,
GRE and conventional MRI sequences
8. Results
- Table 1 showed the signal intensities of the different types
of brain hemorrhage
- Hyperacute blood was found in three cases, all were
detected by diffusion weighted imaging,
- Acute intracerebral hematoma was found in 11 cases, all
were detected by diffusion weighted imaging
- Small parenchymal hemorrhage (post traumatic) was found
in four cases, three of them were missed by DWI (Table 2).
- Early subacute hematoma was found in seven cases, all
were detected by diffusion weighted imaging.
- Late subacute hematoma was found in nine cases, all were
detected by diffusion weighted imaging (Table 3).
- Subdural hematoma was found in five cases (1 early and 4
late subacute), all were detected by diffusion weighted
imaging.
- Intraventricular hematoma was found in four cases, all
were equally detected by diffusion weighted imaging.
- Hemorrhagic arterial infarction was found in eight cases,
all were detected by DWI.
- Hemorrhagic venous infarction was found seven cases, one
case was missed by DWI (Table 4).
- Subarachnoid hemorrhage was found in three cases, two of them were missed by DWI (Table 5).
The ADC measurements in hyperacute, acute, early and
late subacute hematoma were statistically equivalent. The
ADC measurements in hyperacute, acute, early and late suba-
cute hematoma were significantly less than the late subacute
hematoma as well as the contralateral white matter (Table 6).
9. Discussion
Neuroimaging plays a crucial role in the evaluation of patients
presenting with acute stroke symptoms. While patient
Table 2 Diagnostic accuracy of DWI, GRE and CT for
detection of small intraparenchymal hemorrhage.
Sensitivity
(%)
Specificity
(%)
PPV
(%)
NPV
(%)
Accuracy
(%)
DWI 25 100 100 95 95.1
GRE 50 100 100 96.6 96.6
CT 100 100 100 100 100
Table 3 Diagnostic accuracy of DWI, GRE and CT fordetection of late subacute hematoma.
Sensitivity
(%)
Specificity
(%)
PPV
(%)
NPV
(%)
Accuracy
(%)
DWI 100 100 100 100 100
CT 55.5 100 100 92.8 93.4
Table 4 Diagnostic accuracy of DWI, GRE and CT for
detection of hemorrhagic brain lesions.
Sensitivity
(%)
Specificity
(%)
PPV
(%)
NPV
(%)
Accuracy
(%)
DWI 93.3 100 100 97.8 98.3GRE 100 100 100 100 100
CT 60 100 100 88.4 90.1
Table 5 Diagnostic accuracy of DWI, GRE and CT for
detection of subarachnoid hemorrhage.
Sensitivity
(%)
Specificity
(%)
PPV
(%)
NPV
(%)
Accuracy
(%)
DWI 33.3 100 100 96.6 96.7
CT 100 100 100 100 100
Table 6 Mean ADC in intracranial hematomas.
Stage of hematoma Mean ADC value
(106 mm2/s)
SD
Hyperacute
(intracellular oxyhemoglobin)
365.21 311.26
Acute
(intracellular deoxyhemoglobin)
354.68 378.23
Early subacute
(intracellular methemoglobin)
398.89 176.87
Subacute-chronic
(extracellular methemoglobin)
1, 121.32 24.61
Normal white matter 780.87 94.33
MRI diffusion-weighted imaging in intracranial hemorrhage (ICH) 627
7/26/2019 1-s2.0-S0378603X13000508-main.pdf
http://slidepdf.com/reader/full/1-s20-s0378603x13000508-mainpdf 4/10
symptoms and clinical examinations may suggest the diagno-
sis, only brain imaging studies can confirm the diagnosis anddifferentiate hemorrhage from ischemia with high accuracy.
This differentiation is critical in making acute treatment deci-
sions, including patient eligibility for thrombolytic therapy
(5,6).
In the current study we had 61 patients with intracranial
hemorrhage, six cases were missed by DWI.
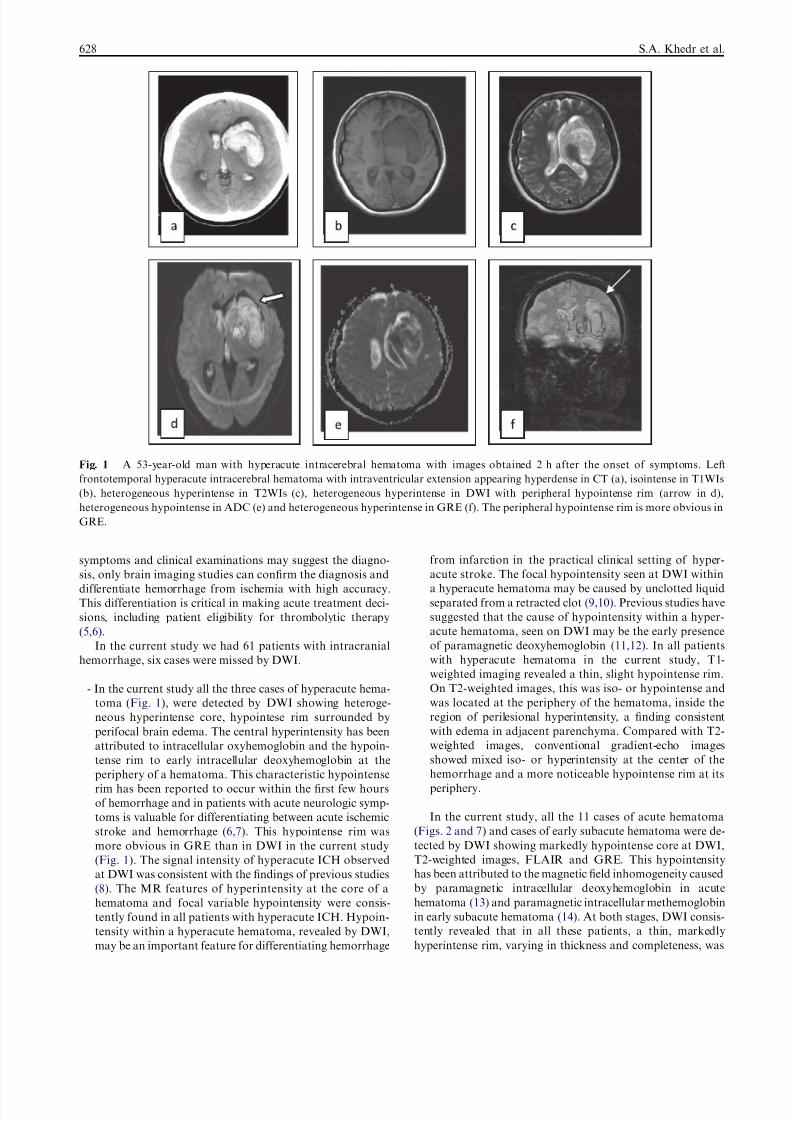
- In the current study all the three cases of hyperacute hema-
toma (Fig. 1), were detected by DWI showing heteroge-
neous hyperintense core, hypointese rim surrounded by
perifocal brain edema. The central hyperintensity has been
attributed to intracellular oxyhemoglobin and the hypoin-
tense rim to early intracellular deoxyhemoglobin at the
periphery of a hematoma. This characteristic hypointenserim has been reported to occur within the first few hours
of hemorrhage and in patients with acute neurologic symp-
toms is valuable for differentiating between acute ischemic
stroke and hemorrhage (6,7). This hypointense rim was
more obvious in GRE than in DWI in the current study
(Fig. 1). The signal intensity of hyperacute ICH observed
at DWI was consistent with the findings of previous studies
(8). The MR features of hyperintensity at the core of a
hematoma and focal variable hypointensity were consis-
tently found in all patients with hyperacute ICH. Hypoin-
tensity within a hyperacute hematoma, revealed by DWI,
may be an important feature for differentiating hemorrhage
from infarction in the practical clinical setting of hyper-
acute stroke. The focal hypointensity seen at DWI within
a hyperacute hematoma may be caused by unclotted liquid
separated from a retracted clot (9,10). Previous studies have
suggested that the cause of hypointensity within a hyper-
acute hematoma, seen on DWI may be the early presence
of paramagnetic deoxyhemoglobin (11,12). In all patients
with hyperacute hematoma in the current study, T1-
weighted imaging revealed a thin, slight hypointense rim.
On T2-weighted images, this was iso- or hypointense and
was located at the periphery of the hematoma, inside the
region of perilesional hyperintensity, a finding consistent
with edema in adjacent parenchyma. Compared with T2-
weighted images, conventional gradient-echo images
showed mixed iso- or hyperintensity at the center of the
hemorrhage and a more noticeable hypointense rim at itsperiphery.
In the current study, all the 11 cases of acute hematoma
(Figs. 2 and 7) and cases of early subacute hematoma were de-
tected by DWI showing markedly hypointense core at DWI,
T2-weighted images, FLAIR and GRE. This hypointensity
has been attributed to the magnetic field inhomogeneity caused
by paramagnetic intracellular deoxyhemoglobin in acute
hematoma (13) and paramagnetic intracellular methemoglobin
in early subacute hematoma (14). At both stages, DWI consis-
tently revealed that in all these patients, a thin, markedly
hyperintense rim, varying in thickness and completeness, was
Fig. 1 A 53-year-old man with hyperacute intracerebral hematoma with images obtained 2 h after the onset of symptoms. Left
frontotemporal hyperacute intracerebral hematoma with intraventricular extension appearing hyperdense in CT (a), isointense in T1WIs
(b), heterogeneous hyperintense in T2WIs (c), heterogeneous hyperintense in DWI with peripheral hypointense rim (arrow in d),
heterogeneous hypointense in ADC (e) and heterogeneous hyperintense in GRE (f). The peripheral hypointense rim is more obvious in
GRE.
628 S.A. Khedr et al.

7/26/2019 1-s2.0-S0378603X13000508-main.pdf
http://slidepdf.com/reader/full/1-s20-s0378603x13000508-mainpdf 5/10
present at the periphery of the hematoma. The bright rims cor-
responded to the areas of hyperintensity seen on T2-weighted
images. In Echo-planar gradient-echo images the signal inten-
sities observed were markedly hypointense, though the hyper-
intense rim seen at DWI was not demonstrated. T1-weightedimages showed the hematoma as heterogeneously isointense
at the acute stage and markedly hyperintense at the early sub-
acute stage.
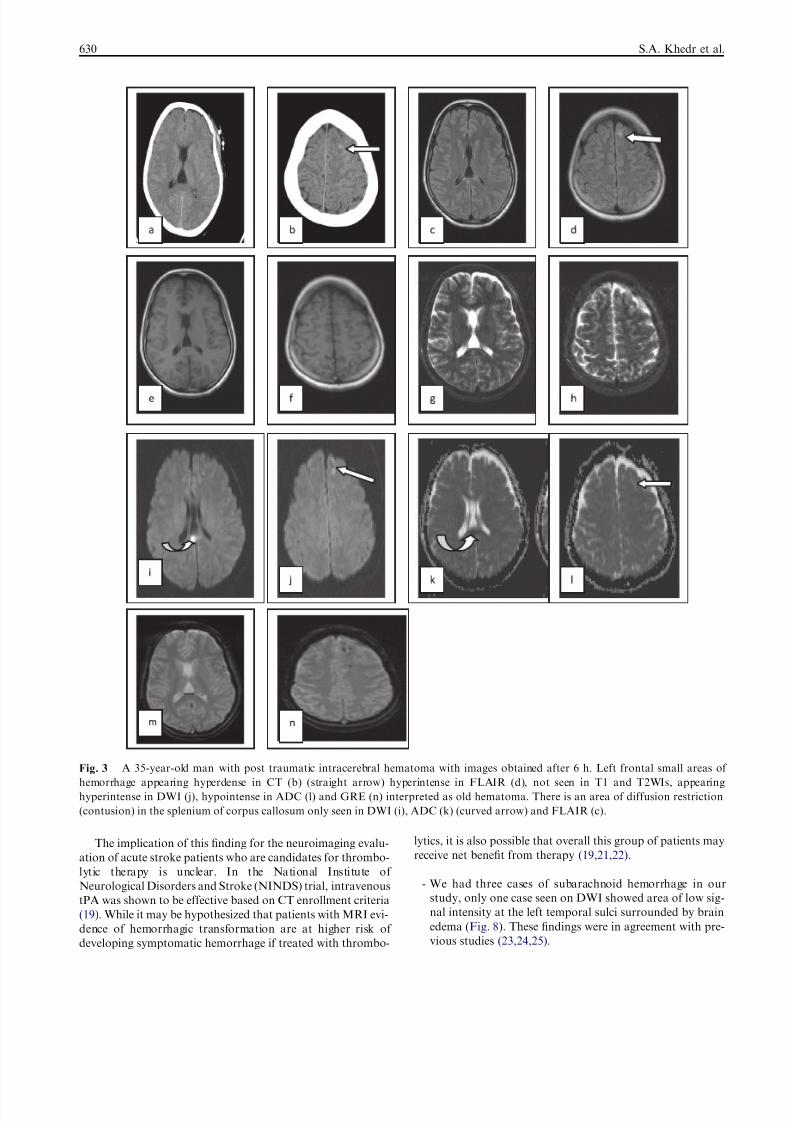
- Small post traumatic parenchymal hemorrhage was found
in four cases in our study, three cases of them were missed
by DWI. DWI showed in the fourth case small areas of
high signal. All these cases were detected by CT showing
small hyperdensity. These focal areas were hypointense by
GRE (we could not confirm if these areas were acute or
chronic hematoma) and missed by T1 and T2WIs. In addi-
tion, the four post traumatic patients in the current study,
showing small areas of restriction on DWI seen in the sple-
nium of corpus callosum not seen by CT and GRE (Fig. 3).
Physicians should be aware that in cases of small hemor-
rhages, it may be difficult to make an exact distinction be-
tween acute and chronic hemorrhage based on GRE images
alone. A noncontrast CT may be necessary in these cases
to determine hemorrhage age. With acute medium-large hem-
orrhages, the characteristic appearance of mixed signal inten-
sity and the surrounding hyperintensity due to edema is very
specific and will make the age of the hemorrhage apparent.
However, small hemorrhages may have similar characteristics
to calcifications and intravascular thrombus and have mini-
mal edema making the determination of hemorrhage age as
well as the distinction of hemorrhage versus nonhemorrhage
more difficult (15,16).
Late subacute hematoma was found in 9 cases in the cur-
rent study, all of these cases showed marked hyper intense core
with hypo-intense rim (Fig. 4). All the cases also showedmarked hyper intensity at T1- and T2-weighted, and FLAIR
images while GRE demonstrated heterogeneous hyperintensity
(16,17).
- We had five cases of Subdural hematoma (1 early subacute
and 4 late subacute), all showing heterogeneous signal at
DWI. This may be explained by the fact that the subdural
hematoma is almost always mixed (acute, early and late
subacute), and the hypointensity is caused by paramagnetic
intracellular deoxyhemoglobin and paramagnetic intracel-
lular methemoglobin (17) (Fig. 5).
- We had 4 cases of intraventricular hematoma ( Fig. 1), all
showing low signal at DWI.
- We had 8 cases of hemorrhagic arterial and 7 cases of hem-orrhagic venous infarction (Figs. 6 and 7) all showing low
signal areas at DWI within the bright infarction.
- In our study all the eight cases of hemorrhagic arterial and
seven cases of hemorrhagic venous infarction (Figs. 6 and
8) appeared heteogenous on DWI showing areas of low sig-
nal intensity within areas of restricted diffusion. These find-
ings were in agreement with previous studies (18,19) and
was explained by the presence of prominent vasogenic
edema associated with mild cytotoxic edema (20). The hem-
orrhagic areas in hemorrhagic arterial and venous infarc-
tions gave the signal intensity of early subacute
hematoma on DWI, T1WIs, and T2WIs.
Fig. 2 A 49-year-old man with acute intracerebral hematoma with images obtained 2 days after the onset of symptoms. Acute right
frontal hematoma appearing hyperdense in CT (a), isointense in T1Wis with small hyperintense areas within (b), hypointense in T2WIs (c),
FLAIR (d), GRE (e), DWI (f), and ADC (g). It is surrounded by perifocal brain edema.
MRI diffusion-weighted imaging in intracranial hemorrhage (ICH) 629
7/26/2019 1-s2.0-S0378603X13000508-main.pdf
http://slidepdf.com/reader/full/1-s20-s0378603x13000508-mainpdf 6/10
The implication of this finding for the neuroimaging evalu-
ation of acute stroke patients who are candidates for thrombo-
lytic therapy is unclear. In the National Institute of
Neurological Disorders and Stroke (NINDS) trial, intravenous
tPA was shown to be effective based on CT enrollment criteria
(19). While it may be hypothesized that patients with MRI evi-
dence of hemorrhagic transformation are at higher risk of
developing symptomatic hemorrhage if treated with thrombo-
lytics, it is also possible that overall this group of patients may
receive net benefit from therapy (19,21,22).
- We had three cases of subarachnoid hemorrhage in our
study, only one case seen on DWI showed area of low sig-
nal intensity at the left temporal sulci surrounded by brain
edema (Fig. 8). These findings were in agreement with pre-
vious studies (23,24,25).
Fig. 3 A 35-year-old man with post traumatic intracerebral hematoma with images obtained after 6 h. Left frontal small areas of
hemorrhage appearing hyperdense in CT (b) (straight arrow) hyperintense in FLAIR (d), not seen in T1 and T2WIs, appearing
hyperintense in DWI (j), hypointense in ADC (l) and GRE (n) interpreted as old hematoma. There is an area of diffusion restriction
(contusion) in the splenium of corpus callosum only seen in DWI (i), ADC (k) (curved arrow) and FLAIR (c).
630 S.A. Khedr et al.

7/26/2019 1-s2.0-S0378603X13000508-main.pdf
http://slidepdf.com/reader/full/1-s20-s0378603x13000508-mainpdf 7/10
The ADC measurements in hyperacute, acute, early and late
subacute hematoma were statistically equivalent. The ADC
measurements in hyperacute, acute, early and late subacute
hematoma were significantly less than the late subacute hema-
toma as well as the contralateral white matter ( p value <.001).
The precise biophysical explanation for the observed restriction
of diffusion in early stages of intracranial hematomas is uncer-
tain. Potential causesinclude,but arenot limited to:(1) a shrink-
age of extracellular space with clot retraction; (2) a change in the
osmotic environment once blood becomes extravascular, which
Fig. 4 A 62-year-old man with late subacute intracerebral hematoma with images obtained 9 days after the onset of symptoms .The
hematoma in the right cerebellar hemisphere appearing hypodense in CT (a), hyperintense in T1WIs (b), T2WIs (c), FlAIR (d), DWI (e),
hypointense in ADC (f) and heterogeneous hyperintense in GRE (g).
Fig. 5 A 56-year-old man with subacute subdural hematoma with images obtained 5 days after the onset of symptoms. The hematoma
appears heterogeneously hypodense in CT (a), hyperintense in T1 and T2WIs (b and c), hypointense in DWI (d), hyperintense in ADC (e),
and heterogeneous hyperintense in GRE (f).
MRI diffusion-weighted imaging in intracranial hemorrhage (ICH) 631

7/26/2019 1-s2.0-S0378603X13000508-main.pdf
http://slidepdf.com/reader/full/1-s20-s0378603x13000508-mainpdf 8/10
altersthe shape of theRBC, a phenomenon related to theforma-
tion of the fibrin network associated with clot; (3) a conforma-
tional change of the hemoglobin macromolecule within the
RBC; and the less likely possibility of (4) contraction of intact
RBCs (thereby decreasing intracellular space) (24,25).
Our study may have implications for the imaging evalua-
tion of patients with acute stroke symptoms. Our findings sup-
port prior studies suggesting that MRI DWI is accurate in
detection characterization and staging of hyperacute, medium
and large sized acute, and early sub acute hemorrhage. Oneimportant caveat is that with small hemorrhages, blood that
appears as acute on CT may appear as ischemic foci on
DWI and as chronic hemorrhage on GRE MRI. A noncon-
trast CT may be required to confirm the diagnosis in these
cases. However in cases of post traumatic axonal injury, small
areas of contusion were detected by DWI in the corpus callo-
sum in our study not detected by CT or GRE. Our study sug-
gests that DWI and GRE MRI may be able to detect regions
of hemorrhagic arterial and venous infarction not evident on
CT. Our findings suggest that DWI was nearly as accurate
as CT for the detection of early subacute hemorrhage and sub-
dural hematoma. Our study confirms the superiority of DWI
for detection of late subacute subdural. DWI was not accurate
in detection of subarachnoid hemorrhage.
10. The limitations of this study
They include the lack of histopathological confirmation and
the small number of cases. Although a complete understanding
of the underlying biophysical basis may require further studies
with a large population, our data suggest that the appearance
of intracerebral hematomas on diffusion-weighted images is
influenced not only by ADC values but also by magnetic sus-
ceptibility and T2 shine-through effects. In addition, our study
corroborates the key features of evolving intracerebral hema-
tomas, as depicted by conventional MR imaging.
11. Conclusion
Due to its advantages in delineating ischemic pathophysiology,
MRI DWI was accurate in detection, characterization and
staging hyperacute, subacute hemorrhage as well as hemor-
rhagic components of arterial and venous infarctions and of
Fig. 6 A 47 year old male with left frontotemporal hemorrhagic arterial infarct with images taken 3 days after symptoms .It appearshypodense in CT (a). The hemorrhagic area is seen in the lentiform nucleus appearing slightly hyperintense in T1WIs (b), hypointense in
T2WIs, GRE, DWI and ADC (c–f). Left middle cerebral artery occlusion in MRA (g).
632 S.A. Khedr et al.

7/26/2019 1-s2.0-S0378603X13000508-main.pdf
http://slidepdf.com/reader/full/1-s20-s0378603x13000508-mainpdf 9/10
low diagnostic accuracy in subarachnoid and small parenchy-
mal hemorrhage.
References
(1) Carhuapoma JR, Wang P, Beauchamp NJ, Hanley DF, Barker
PB. Diffusion-perfusion MR evaluation and spectroscopy before
and after surgical therapy for intracerebral hemorrhage. Neuro-
crit Care 2005;2(1):23–7.
(2) Adams Jr HP, Adams RJ, Brott T, et al. Guidelines for the early
management of patients with ischemic stroke. Stroke
2003;34:1056–83.
(3) Baird AE, Warach S. Magnetic resonance imaging of acute
stroke. J Cereb Blood Flow Metab 1998;18:583–609.
(4) Chabert S, Scifo P. Diffusion signal in magnetic resonance
imaging: origin and interpretation in neuro-sciences. Biol Res
2007;40:385–400. http://dx.doi.org/10.4067/S0716-97602007000
500003.
Fig. 7 A 58 year old female with right occipital hemorrhagic venous infarct appearing hypodense in CT (a). The hemorrhagic area
appears hyperintense in T1WIs (b), hypointense in T2 WIs (c), FLAIR (d), DWI (e), ADC (f), and GRE (g). There was marked
attenuation of the superior saggital sin in MRV (h).
Fig. 8 A 55 year old man with left sided subarachnoid hemorrhage seen by T1, FLAIR, T2WIs, DWI, ADC and GRE (a–f). It appears
hyperintense in T1WIS, hypointense in T2WIs, FLAIR, DWI, ADC and GRE surrounded by brain edema.
MRI diffusion-weighted imaging in intracranial hemorrhage (ICH) 633
7/26/2019 1-s2.0-S0378603X13000508-main.pdf
http://slidepdf.com/reader/full/1-s20-s0378603x13000508-mainpdf 10/10
(5) Fiebach JB, Schellinger PD, Gass A, et al. Strokemagnetic
resonance imaging is accurate in hyperacute intracerebral hem-
orrhage. Stroke 2004;35:502–6.
(6) Hermier M, Nighoghossian N. Contribution of susceptibility-
weighted imaging to acute stroke assessment. Stroke 2004;35:
1989–94.
(7) Attia S, El Khatib MG, Bilal M, Nassar H. Spontaneous
intracerebral hematoma in young people: clinical and radiological
magnetic resonance imaging features by diffusion-weighted
images. Egypt J Neurol Psych Neurosurg 2007;44:561–76.(8) Patel MR, Edelman RR, Warach S. Detection of hyperacute
primary intraparenchymal hemorrhage by magnetic resonance
imaging. Stroke 1996;27:2321–4.
(9) Atlas SW, Thulborn KR. MR detection of hyperacute parenchy-
mal hemorrhage of the brain. AJNR 1998;19:1471–7.
(10) a Gonzalez RG, Schaefer P, Buonanno FS, et al. Diffusion-
weighted MR imaging: diagnostic accuracy in patients imaged
within 6 hours of stroke symptom onset. Radiology 1999;210:
155–62;
b Schellinger PD, Jansen O, Fiebach JB, Hacke W, Sartor K. A
standardized MRI stroke protocol: comparison with CT in
hyperacute intracerebral hemorrhage. Stroke 1999;30:765–8.
(11) Sunshine J, Tarr R, Lanzieri C, Landis D, Selman W, Lewin J.
Hyperacute stroke: ultrafast MR imaging of triage patients prior
to therapy. Radiology 1999;212:325–32.(12) Linfante I, Llinas RH, Caplan LR, Warach S. MRI features of
intracerebral hemorrhage within 2 hours of symptom onset.
Stroke 1999;30:2263–7.
(13) Atlas SW, DuBois P, Singer MB, Lu D. Diffusion measurements
in intracranial hematomas: implications for MR imaging of acute
stroke. Am J Neuroradiol 2000;21:1190–4.
(14) Schaefer PW, Grant PE, Gonzalez RG. Diffusion-weighted MR
imaging of the brain. Radiology 2000;217:331–45.
(15) Maldjian JA, Listerud J, Moonis G, Siddiqi F. Computing
diffusion rates in T2-dark hematomas and areas of low T2 signal.
AJNR Am J Neuroradiol 2001;22:112–8.
(16) Lin DD, Filippi CG, Steever AB, Zimmerman RD. Detection
ofintracranial hemorrhage: comparison between gradient-
echo images and b(0) images obtained from diffusion-
weighted echo-planar sequences. AJNR Am J Neuroradiol
2001;22:1275–81.
(17) Kidwell CS, Warach S. Acute ischemic cerebrovascular syn-
drome. Stroke 2003;34:2995–8.
(18) Packard AS, Kase CS, Aly AS, Barest GD. ‘‘Computed tomog-
raphy-negative’’ intracerebral hemorrhage. Arch Neurol
2003;60:1156–9.(19) Silvera S, Oppenheim C, Touze ´ E, Ducreux D, Page P, Domigo
V, et al. Spontaneous intracerebral hematoma on diffusion-
weighted images: influence of T2-shine through and T2-blackout
effects. Am J Neuroradiol 2005;26:224–36.
(20) Peeters E, Stadnik T, Bissay F, Schmedding E, Osteaux M.
Diffusion-weighted MR imaging of an acute venous stroke.
AJNR Am J Neuroradiol 2001;22:1949–52.
(21) Kang BK, Na DG, Ryoo JW, et al. Diffusion-weighted MR
imaging of intracerebral hemorrhage. Korean J Radiol
2001;2:183–91.
(22) Stadnik T, Demaerel P, Luypaert R, et al. Imaging tutorial:
differential diagnosis of bright lesions on diffusion-weighted MR
images. Radiographics 2003;23:e7.
(23) Wiesmann M, Mayer TE, Yousry I, Medele R, Hamann GF,
Bruckmann H. Detection of hyperacute subarachnoid hemor-rhage of the brain by using magnetic resonance imaging. J
Neurosurg 2002;96:684–9.
(24) Mitchell P, Wilkinson ID, Hoggard N, et al. Detection of
subarachnoid haemorrhage with magnetic resonance imaging. J
Neurol Neurosurg Psychiatry 2001;70:205–11.
(25) Rajeshkannan R, Moorthy S, Sreekumar KP, Rupa R, Prabhu
NK. Clinical applications of diffusion weighted MR imaging: a
review. Indian J Radiol Imaging 2006;16:705–10.
634 S.A. Khedr et al.
Related Documents