A security risk analysis model for information systems: Causal relationships of risk factors and vulnerability propagation analysis Nan Feng a , Harry Jiannan Wang b , Minqiang Li a,⇑ a College of Management and Economics, Tianjin University, 92 Weijin Road, Nankai District, Tianjin 300072, PR China b Department of Accounting and MIS, University of Delaware, Newark, DE, United States article info Article history: Available online 4 March 2013 Keywords: Information systems Security risk Bayesian networks Ant colony optimization Vulnerability propagation abstract With the increasing organizational dependence on information systems, information sys- tems security has become a very critical issue in enterprise risk management. In informa- tion systems, security risks are caused by various interrelated internal and external factors. A security vulnerability could also propagate and escalate through the causal chains of risk factors via multiple paths, leading to different system security risks. In order to identify the causal relationships among risk factors and analyze the complexity and uncertainty of vul- nerability propagation, a security risk analysis model (SRAM) is proposed in this paper. In SRAM, a Bayesian network (BN) is developed to simultaneously define the risk factors and their causal relationships based on the knowledge from observed cases and domain experts. Then, the security vulnerability propagation analysis is performed to determine the propagation paths with the highest probability and the largest estimated risk value. SRAM enables organizations to establish proactive security risk management plans for information systems, which is validated via a case study. Ó 2013 Elsevier Inc. All rights reserved. 1. Introduction As information systems have become more prevalent in business, the consequences of information system security violations have become more and more costly [43]. For example, the 2010 Computer Crime and Security Survey on 738 organizations by the Computer Security Institute reported a total estimated annual loss of $190 million caused by informa- tion systems security incidents [20]. Recent literature [3,6,7,34] has also documented significant costs related to information systems security breaches. As an important part of enterprise risk management (ERM), security risk analysis mainly focuses on analyzing vulnera- bilities and threats to the information resources and deciding what countermeasures to take for reducing risk to an accept- able level. However, security risk analysis for information systems is a very challenging task due to the complex and dynamic environment. For example, there often exist complex interactions among the components of information systems. Therefore, any single vulnerability may have multiple propagation paths, leading to different security risks in information systems. In recent years, the security risk analysis for information systems has attracted much attention of researchers in the field [8,35,28]. The existing approaches for risk analysis can be grouped into three major categories: the quantitative approaches, the qualitative approaches, and the combination of quantitative and qualitative approaches. 0020-0255/$ - see front matter Ó 2013 Elsevier Inc. All rights reserved. http://dx.doi.org/10.1016/j.ins.2013.02.036 ⇑ Corresponding author. Tel./fax: +86 22 27404796. E-mail address: [email protected] (M. Li). Information Sciences 256 (2014) 57–73 Contents lists available at SciVerse ScienceDirect Information Sciences journal homepage: www.elsevier.com/locate/ins

1-s2.0-S0020025513001539-main
Dec 04, 2015
A security risk analysis model for information systems:
Causal relationships of risk factors and vulnerability
propagation analysis
Causal relationships of risk factors and vulnerability
propagation analysis
Welcome message from author
This document is posted to help you gain knowledge. Please leave a comment to let me know what you think about it! Share it to your friends and learn new things together.
Transcript

Information Sciences 256 (2014) 57–73
Contents lists available at SciVerse ScienceDirect
Information Sciences
journal homepage: www.elsevier .com/locate / ins
A security risk analysis model for information systems:Causal relationships of risk factors and vulnerabilitypropagation analysis
0020-0255/$ - see front matter � 2013 Elsevier Inc. All rights reserved.http://dx.doi.org/10.1016/j.ins.2013.02.036
⇑ Corresponding author. Tel./fax: +86 22 27404796.E-mail address: [email protected] (M. Li).
Nan Feng a, Harry Jiannan Wang b, Minqiang Li a,⇑a College of Management and Economics, Tianjin University, 92 Weijin Road, Nankai District, Tianjin 300072, PR Chinab Department of Accounting and MIS, University of Delaware, Newark, DE, United States
a r t i c l e i n f o
Article history:Available online 4 March 2013
Keywords:Information systemsSecurity riskBayesian networksAnt colony optimizationVulnerability propagation
a b s t r a c t
With the increasing organizational dependence on information systems, information sys-tems security has become a very critical issue in enterprise risk management. In informa-tion systems, security risks are caused by various interrelated internal and external factors.A security vulnerability could also propagate and escalate through the causal chains of riskfactors via multiple paths, leading to different system security risks. In order to identify thecausal relationships among risk factors and analyze the complexity and uncertainty of vul-nerability propagation, a security risk analysis model (SRAM) is proposed in this paper. InSRAM, a Bayesian network (BN) is developed to simultaneously define the risk factors andtheir causal relationships based on the knowledge from observed cases and domainexperts. Then, the security vulnerability propagation analysis is performed to determinethe propagation paths with the highest probability and the largest estimated risk value.SRAM enables organizations to establish proactive security risk management plans forinformation systems, which is validated via a case study.
� 2013 Elsevier Inc. All rights reserved.
1. Introduction
As information systems have become more prevalent in business, the consequences of information system securityviolations have become more and more costly [43]. For example, the 2010 Computer Crime and Security Survey on 738organizations by the Computer Security Institute reported a total estimated annual loss of $190 million caused by informa-tion systems security incidents [20]. Recent literature [3,6,7,34] has also documented significant costs related to informationsystems security breaches.
As an important part of enterprise risk management (ERM), security risk analysis mainly focuses on analyzing vulnera-bilities and threats to the information resources and deciding what countermeasures to take for reducing risk to an accept-able level. However, security risk analysis for information systems is a very challenging task due to the complex and dynamicenvironment. For example, there often exist complex interactions among the components of information systems. Therefore,any single vulnerability may have multiple propagation paths, leading to different security risks in information systems.
In recent years, the security risk analysis for information systems has attracted much attention of researchers in the field[8,35,28]. The existing approaches for risk analysis can be grouped into three major categories: the quantitative approaches,the qualitative approaches, and the combination of quantitative and qualitative approaches.
58 N. Feng et al. / Information Sciences 256 (2014) 57–73
The quantitative approaches utilize mathematical and statistical models to represent risk [28]. Security risk exposure isrepresented as a function of the probability of the threats and the expected loss due to the vulnerability to those threats [6].Gordon and Loeb [19] presented a mathematical model to determine the optimal security investment level for informationsystems. Their work and subsequent literatures on security risk analysis focused on a single system or a single type of pro-tection technology. Yue et al. [47] extended those studies by formulating and solving the problem according to the risk man-agement paradigm, and therefore provided manager with additional insights into making optimal decisions. Wu et al. [46]analyzed various risks and challenges in the product development of the concurrent engineering environment and proposeda quantitative approach to systematically identifying the most important risks for accomplishing concurrent engineeringprojects. Grunske and Joyce [21] proposed a risk-based approach that created modular attack trees for each component ininformation systems. These modular attack trees were specified as parametric constraints, which allowed quantifying theprobability of security breaches that occurred due to the internal component vulnerabilities as well as vulnerabilities inthe component’s deployment environment.
There are also many qualitative security risk analysis methods and techniques. The Operationally Critical Threat, Asset,and Vulnerability Evaluation (OCTAVE) approach [1] defines a set of impact evaluation criteria to establish a common basisfor determining the impact values due to threats to the critical assets. Peltier [35] presented a qualitative risk analysis pro-cess using techniques such as Practical Application of Risk Analysis (PARA) and Facilitated Risk Analysis Process (FRAP) toevaluate tangible and intangible risks. This process allowed for the systematic evaluation on risk, threats, hazards, and con-cerns, and provided cost-effective measures for lowering risk to an acceptable level. Some other popular qualitative methodsare CCTA Risk Analysis and Management Method (CRAMM) developed by the UK Government’s Central Computer and Tele-communications Agency (CCTA) and INFOSEC Assessment Methodology (IAM) [15].
Some comprehensive approaches combining both quantitative and qualitative methods have also been proposed [2,38].Chen et al. [9] applied the similarity measures of generalized fuzzy numbers to deal with fuzzy risk analysis problems.Although this approach is good at processing the ambiguous information by simulating the characteristic of human in mak-ing judgments, it is unable to provide the graphical relationships among various security risk factors using flow charts ordiagrams. For representing the relationships among risk factors, Fan and Yu [16] developed a Bayesian networks (BNs) basedprocedure to provide risk analysis support. In their approach, the BN is structured solely based on domain experts’ experi-ence. Sun et al. [43] proposed an evidential reasoning approach under the Dempster–Shafer theory for the risk analysis ofinformation systems security, which provides a rigorous, structured means to incorporate relevant security risk factors, re-lated countermeasures, and their interrelationships when estimating security risk in information systems. In addition, sen-sitivity analyses were performed to evaluate the impact of important parameters on the model’s results in this approach.Models that are implemented incorrectly or developed based on questionable assumptions are vulnerable to model risks[45]. Wu and Olson [45] summarized a series of model risks in financial services industry and demonstrated an effectivemeans to mitigate such risks through predictive scorecards.
The approaches aforementioned have contributed a great deal to the development of security risk analysis. However twoissues need to be further investigated in the field of information systems security risk management. First, in the process ofsecurity risk analysis for information systems, models are built in order to analyze and better understand the security riskfactors and their causal relationships in real-world information systems. Establishing an appropriate model suitable for thetarget security risk problem is a crucial task that ultimately influences the effectiveness of risk analysis results. Existing lit-erature [9,16] either assumes that the structure of the model was provided by domain experts or was chosen from some gen-eral well-known class of model structures. Therefore, how to leveraging both the database of observed cases and domainexperts’ experience to construct a representative model for observed information systems is a critical issue in security riskanalysis.
Second, one security vulnerability could propagate and escalate through the causal chains of security risk factors viamultiple paths, leading to different security risks in information systems. Existing approaches largely focuses on riskprobability and severity without considering vulnerability propagation. Therefore, there is an imperative need for ad-vanced vulnerability propagation analysis tools that can help establish proactive security risk management plans forinformation systems.
To address challenges aforementioned, we propose a security risk analysis model (SRAM) in this paper based on Bayesiannetworks and ant colony optimization. SRAM extends existing work by constructing the BNs using both the database of ob-served cases and domain experts’ experience. Then, security risk assessment is performed to deduce the occurrence proba-bilities and the consequence severities of security risks. After that, the vulnerability propagation paths are calculated usingant colony optimization to provide guidance for developing security risk treatment plans.
The rest of this paper is organized as follows: Section 2 reviews theoretical backgrounds in this study. After that, we dis-cuss the process for developing the SRAM in detail. The model is further demonstrated and validated in Section 4 via a casestudy. We compare our model with other related approaches and discuss its limitations in Section 5. Finally, we summarizeour contributions and point out further research.
2. Theoretical backgrounds
The SRAM is based on Bayesian networks and ant colony optimization, which are introduced in this section.

N. Feng et al. / Information Sciences 256 (2014) 57–73 59
2.1. Bayesian networks
Bayesian networks (BNs) [25,26], also known as probabilistic belief networks or causal networks, are knowledge repre-sentation tools capable of representing dependence and independence relationships among random variables. A BN,N = (X,G,P), over variables, X, consists of a directed acyclic graph G = (V,E) and a set of conditional probability distributionsP. Each node v in G corresponds one-to-one with a discrete random variable Xv 2 X with a finite set of mutually exclusivestates.
A BN encodes a joint probability distribution over a set of random variables, X, of a problem domain. The set of conditionalprobability distributions, P, specifies a multiplicative factorization of the joint probability distribution over X, X = {X1,X2, -. . . ,Xn} as represented:
PðX1;X2; . . . ;XnÞ ¼Yv2V
PðXv jXPaðvÞÞ ð1Þ
where Pa(v) are the parents of variable Xv in the G.BNs have been widely applied in the field of medical diagnostics, classification systems, software agents for personal
assistants, multi-sensor fusion, and legal analysis of trials [29]. In SRAM, a BN is used to simultaneously integrate the factorsrelated to assessing the security risk and their causal mechanisms due to its two advantages. First, a BN can be used to learncausal relationships, and hence can be used to gain understanding about a problem domain and to predict the consequencesof intervention. Second, the BN is an ideal representation for combining prior knowledge (which often comes in causal form)and data because it has both causal and probabilistic semantics.
2.1.1. Learning Bayesian networksRecently, learning BNs from data has become an increasingly active area of research. Although, sometimes experts can
create good BNs from their own experience, it can be a very hard task for domains with large knowledge bases. Therefore,many methods have been developed to automate the creation of BNs using cases collected from past experience [31].
BN learning can be classified based on whether the structure of the network is known or unknown and the variables(data) can be observable (complete) or hidden (incomplete). Consequently there are four classes of learning BNs from data:known structure and observable variables, unknown structure and observable variables, known structure and unobservablevariables, and unknown structure and unobservable variables. In this paper, the problem falls into the third class in which wetry to learn the structure of the BN by using the complete data for security risk analysis in information systems. Learning BNsconsists of structure learning and parameter learning. Structural learning is the estimation of the topology (links) of the net-work. And parameter learning is the estimation of the conditional probabilities in the network.
In the case of unknown structure and complete data, BN structure learning is a much harder problem compared toparameter learning since the number of candidate networks grows exponentially when the number of variables increases[31]. Furthermore, parameter learning, i.e., calculating the conditional probability distributions of each node in the networkfrom the complete data, is an easier task and has been studied extensively. Therefore, we focus on structure learning in theBN development in this paper.
2.1.2. Bayesian network structure learningThere are two main approaches to structure learning: constraint-based and score-based. In the constraint-based ap-
proach, tests of conditional independence on the data are performed, and a search is conducted to find the network thatis consistent with the observed dependencies. The score-based method operates on the principle, i.e., a scoring function thatrepresents how well it fits the data, is defined for each network structure. The goal is to find the highest-scoring networkstructure. Since the score-based method is less sensitive to errors in individual tests, we utilize a score-based method forstructure BN learning in this paper.
A structural BN learning algorithm requires the determination of two components: scoring function for candidate net-work structures and a search algorithm that does the optimization.
Three main scoring functions commonly used to learn BNs are the log-likelihood [24], the minimal description length(MDL) score [32], and Bayesian score [24]. In this paper, we use Bayesian score as the scoring function in structural BN learn-ing. A desirable and important property of a metric is its decomposability in the presence of complete data, i.e., the Bayesianscore function can be decomposed in the following way:
f ðG : DÞ ¼Xn
i¼1
f ðxi; PaðxiÞ : Nxi ;PaðxiÞÞ ð2Þ
f ðxi; PaðxiÞ : Nxi ;PaðxiÞÞ ¼Xqi
j¼1
logððri � 1Þ!=ðNij þ ri � 1Þ!Þ þXri
k¼1
logðNijk!Þ !
ð3Þ
where Nxi ;PaðxiÞ are the statistics of the variable xi and Pa(xi) in D, ri is the number of possible values of the variable xi, qi is thenumber of possible configurations (instantiations) for the variables in Pa(xi), Nijk is the number of cases in D in which variablexi has its kth value and Pa(xi) is instantiated to its jth value, and Nij ¼
Prik¼1Nijk.

60 N. Feng et al. / Information Sciences 256 (2014) 57–73
Having discussed several scoring functions, we now turn to find the network that has the highest score. In other words, adataset, the scoring function, and a set of possible structures are the input to the search algorithm while the desired output isa network that maximizes the score. The most commonly used search-and-scoring algorithm is the exhaustive search algo-rithm which can explore all possible structures of a dataset. But for large datasets, the number of possible structure is huge. Itis impossible to perform an exhaustive search. Therefore, heuristic search methods [37] have been proposed.
There are two kinds of typical heuristic search algorithms for the structural learning problem, K2 algorithm [10] and Hill-climbing algorithm [42]. The idea of K2 algorithm is incrementally adding a node to a parent set and finding the best parentset to maximize the joint probability of the structure and the database. Another most commonly used algorithm is Hill-climbing algorithm. First, a search space is defined in this algorithm firstly. Then, this space is traversed looking for high-scoring functions to complete the optimization. Although these two search algorithms are more efficient, they are proneto getting trapped in local optima [42].
To solve such a problem, genetic algorithm (GA) has been introduced by Larrañaga et al. [33] for learning BNs. In their GAimplementation, a directed acyclic graph (DAG) is represented by a connectivity matrix that is stored as a string. Lam et al.[32] proposed a hybrid evolutionary programming (HEP) algorithm that combined the use of independence tests with a qual-ity-based search. The HEP algorithm evolves a population of DAG to find a solution that minimizes the MDL score. The com-mon drawback to the algorithms proposed by Larrañaga and Lam is that the crossover and mutation operators they used arecomplex and expensive both in memory and runtime.
Ant colony optimization (ACO) was initially used to solve specific problems: the ant system, for example, was successfullyapplied to the traveling salesman problem (TSP) [12,13]. Applications to shortest path problems in graphs were developed inorder to study the behavior of these algorithms on simple problems, but they later become a metaheuristic optimizer thatcan be applied to combinatorial optimization problems which may be represented in the form of a graph [11]. Since the ACOhas an advantage in solving the combinatorial optimization problems, and the space of BNs is a combinatorial space, it isutilized for structure BN learning in this paper.
Comparing with aforementioned algorithms for structure BN learning, ACO’s advantages not only lie in its strong searchcapability in the combinatorial optimization problem but also lie in its easy implementation and good efficiency for discov-ering optimal solutions. In the next section, we briefly describe the concepts related to ACO which is used in SRAM.
2.2. Ant colony optimization
Ant colony optimization (ACO) algorithms [11,13,14] are multi-agent systems in which the behavior of each agent (ant) isinspired by the foraging behavior of real ants. In particular, ACO algorithms model the process followed by real ants whenfinding the shortest path from a food source to their nest. While walking, real ants deposit a chemical substance called pher-omone on the ground when they have successfully found food and are returning to the nest. Ants can smell pheromone and,when choosing their way, they tend to choose, in a probabilistic way, paths marked by strong pheromone concentrations. Inthe absence of pheromone, ants choose randomly, but after a transitory period shortest paths will be more frequently visitedand pheromone will accumulate faster on those paths, which in turn causes more ants to use these paths. This positive feed-back effect means that all ants will eventually use the shortest path. So, although a single ant is capable of building a solution(i.e., a path), the optimal solution comes about solely as a result of the cooperative behavior of the ant colony (which is basedon a simple form of indirect communication through the pheromone, called stigmergy). Besides TSP, ACO has been used tooptimize a wide range of problems, such as the satisfiability problem [36], supply-chain logistics [39,40], and sortingproblems [22].
In this paper, ACO is applied to find the maximal scoring BN structure which is good approximation of the process of secu-rity risk analysis. In addition, it is also used to determine security vulnerability propagation paths and their occurrenceprobabilities.
3. Proposed security risk analysis model
The procedure of the proposed security risk analysis model (SRAM) is defined through three phases (Fig. 1), which are theBayesian network (BN) development, security risk assessment, and vulnerability propagation analysis. In Fig. 1, Database1(DB1) contains the basic information about the BN nodes. Database2 (DB2) stores the case data of the BN nodes, andDatabase3 (DB3) has current observation data.
3.1. Bayesian network development
In this phase, a BN is developed to represent the factors related to assessing the security risk and their causal relationshipsbased on the DB1 and DB2 (see Fig. 1). In addition, the BN will become the basis for security risk assessment and vulnera-bility propagation analysis.
For the representation of the causal relationships among security risk factors, an ACO-based algorithm (Algorithm 1) isdeveloped to learn the BN structure that best fits the DB2. Starting from a candidate network, which may be an emptyone, or has a starting point provided by the experts, the ants iteratively search good single-step changes by adding edges,

Fig. 1. SRAM procedure.
N. Feng et al. / Information Sciences 256 (2014) 57–73 61
removing edges, or reverting edges to build a BN. Therefore, each ant picks randomly two variables and chooses whether anedge (with its direction) should exist between both variables. The best action provided by all ants is applied to the networkstructure.
Algorithm 1 is presented in the Appendix A. Based on a candidate network, the ants collaboratively build a network struc-ture in each iteration. Within one iteration, every ant randomly picks an edge and decides the state of that edge based on thepheromones and heuristics. More specifically, each ant performs the following two steps.
(1) Random selection of the next edge to be evaluated from the set of candidate edges. The set of candidate edges are alledges of the graph.
(2) Assignment of an edge state. This assignment is made probabilistically, in balance between the pheromone informa-tion and the locally computed heuristic information.
The ant that found the assignment with the highest score improvement changes the network if the change does not lead toany cycle in the network structure. If no higher scoring network can be found, the current network G and the best networkfound so far, G⁄, are used to update the pheromone information in order to guide the ants in the next iterations to higherquality networks.
When Niter = Nmax, i. e., the current number of iterations is equal to the max number of iterations, the process of iterationends. Nmax should be set to a value high enough to allow the pheromone matrix to saturate.
As for the BN parameters (i.e., the conditional probability tables), they can be determined by learning the parameters onhistorical data and expert’s knowledge. In this paper, we use maximum likelihood estimation (MLE) [23] to calculate the con-ditional probability tables of each node in the BN from the complete data.
3.2. Security risk assessment
Once the BN of information systems is constructed, it serves as a tool for risk assessment based on real time database (i.e.,DB3 in Fig. 1), which provides updated information about each observable node in the BN as inference evidence. This phaseof SRAM finally yields the occurrence probability and the consequence severity of security risk in the BN. The result from therisk assessment will be used for the decision-making procedure: if the future estimated situation of information systems is astate considered ‘‘secure’’ or ‘‘successful’’, no action should be planned. Otherwise, if the probability of one risk node in theBN exceeds the threshold set in advance, the vulnerability propagation should be further analyzed.
Whenever the new evidence is available in the process of security risk assessment, it should be plugged in the BN to up-date previous estimates by probabilistic inference. In BNs, probabilistic inference can be defined as the task of computing allposterior marginals of non-evidence variables given the evidence [5]. In general, probabilistic inference is a NP-hard task[27]. Therefore, the most critical task related to the risk assessment can be defined as identifying the posterior probabilityof each risk based on the evidence obtained from real time database. In this phase, we develop an inference engine based onjunction tree (also known as a join tree or a Markov tree) [27] to compute the posterior marginal P (X|e) of a variable Xapproximately, given the evidence e.
A junction tree representation T of a Bayesian network N = (X,G,P) is a pair T = (C,S) where C is the set of cliques and S isthe set of separators. The clique set C indicates the nodes of T, whereas the separators S annotate the links of the tree. Each

62 N. Feng et al. / Information Sciences 256 (2014) 57–73
clique C 2 C represents a maximal complete subset of pair wise connected variables of X, i.e., C # X. Once the junction treeT = (C,S) has been constructed, a probability potential is associated with each clique C 2 C and each separator S 2 S betweentwo adjacent cliques Ci and Cj where S ¼ Ci \ Cj.
The inference engine is performed using a message passing algorithm [30] on the junction tree. Its process involves thefollowing steps:
(1) Each item of evidence must be incorporated into the junction tree potentials. For each item of evidence, some poten-tial, containing the variable in target problem, is modified to reflect the evidence.
(2) A clique of the junction tree is selected. This clique is referred to as the root of the inference.(3) Then messages are passed towards the selected root. The messages are passed through the separators of the junction
tree (i.e., along the links of the tree). These messages cause the potentials of the receiving cliques and separators to beupdated.
(4) The messages are passed in the other direction (i.e., from the root towards the leaves of the junction tree).(5) At this point, the junction tree is said to be in equilibrium: The probability P (X|e) can be computed from any clique or
separator containing X. The result will be independent of the chosen clique or separator.
Prior to the initial round of message passing, for each variable Xv 2 X we assign the conditional probability distributionP(Xv|Xpa(v)) to a clique C such that Xpa(v) # C. Once all conditional probability distributions have been assigned to cliques, thedistributions assigned to each clique are combined to form the initial clique potential.
Most risk analysis methods rely on a qualitative judgment of consequence severity, regardless of the analysis rigor ap-plied to the security risk assessment. As the risk analysis is dependent on the estimated occurrence probability and conse-quence severity of security risks, the error associated with the consequence severity evaluation directly impacts theestimated security risk and ultimately the risk reduction requirements. To address the qualitative biases for consequenceseverity estimation, a semi-quantitative approach [41] is adopted to support the assessment of consequence severity ofsecurity risk.
3.3. Vulnerability propagation analysis
In this phase, based on ant colony algorithm, we propose an algorithm (Fig. 2) for vulnerability propagation analysiswhich helps determine the propagation path(s) with highest probability and largest estimated path risk exposure.
In Fig. 2, the algorithm (Algorithm 2) for vulnerability propagation describes the process of finding one propagation pathfrom a source node to a destination node in the BN. The transition probability pk
ijðtÞ of the kth ant moving from node i to nodej is given as
pkijðtÞ ¼ ½sijðtÞ�a½gijðtÞ�
bXn
s¼1
,½sisðtÞ�a½gisðtÞ�
b ð4Þ
where a and b denote the weighting parameters controlling the relative importance of the pheromone amount and the desir-ability respectively, sij(t) is the quantity of pheromone laid on the path (i, j) at time t, s is the selected node of the kth ant inthe next searching step, gij(t) is the heuristic information.
Before the end of each iteration, the residual pheromone on each connective path is re-calculated. The update method[44] for the pheromone is described below. However, before we go any further, several variable definitions must first beunderstood:
(1) sij(t): at time t, the pheromone left on a connective path (i, j).(2) Dsij: between time t and time t + N, the amount of pheromone increased by all ants on a connective path (i, j).(3) Dsk
ij: between time t and time t + N, the strength of pheromone left by the kth ant on a connective path (i, j).
From the above definitions, the extra strength of the pheromone on a particular path can be determined by the sum of thepheromone left by each ant.
Dsij ¼Xm
k¼1
Dskij ð5Þ
The pheromone on a connective path (i, j) left by the kth ant is the inverse of the total length traveled by the ant in a par-ticular path. The formula is as follows:
Dskij ¼ Q=Lk; ð6Þ
where Q is a constant, and Lk is the total path cost traveled by the kth ant.Pheromone strength on a particular path increases with the number of ants that have traveled on it. However, the pher-
omone diminishes and disappears as time elapses. Variable q (0 6 q 6 1) can be used to determine the residual strength of

Fig. 2. The algorithm for vulnerability propagation analysis.
N. Feng et al. / Information Sciences 256 (2014) 57–73 63
pheromone after decay between two iterations, and 1 � q stands for the portion of pheromone that diminishes with time.Therefore at t + N, the residual pheromone is exactly the diminished amount plus the residual pheromone strength left by allthe ants from the last iteration. The formula is as follows:
sijðt þ NÞ ¼ qsijðtÞ þ Dsij: ð7Þ
When Niter = Nmax the process of iteration ends. The output of the Algorithm2 is one vulnerability propagation path and itsprobability.
4. SRAM validation via a case study
4.1. Soundness and completeness of SRAM
In this section, we first validate the soundness of SRAM by explaining in detail the methodology of applying SRAM as de-picted in Fig. 3. In SRAM, since the space of BNs is a combinatorial space, Ant colony optimization (ACO) is utilized for struc-ture BN learning because of its advantage to solving the combinatorial optimization problems. Integrating the database ofobserved cases with expert experience, and based on ACO, a BN is developed to represent the security risk factors and theircausal relationships in the information systems. Whenever the new evidence is available in the process of security riskassessment, it should be plugged in the BN to update previous estimates by BN probabilistic inference, which aims at com-puting all posterior marginals of non-evidence variables given the new evidence. Based on the occurrence probability andthe consequence severity of security risk in the BN, the vulnerability propagation analysis is performed to calculate the prop-agation paths and their probabilities. Finally, a security risk treatment plan can be developed according to the results of vul-nerability propagation analysis. Given that the key components of SRAM, namely Bayesian networks and ant colony

Fig. 3. The methodology of SRAM.
64 N. Feng et al. / Information Sciences 256 (2014) 57–73
optimization, have been widely applied in various research domains and the methodology shown in Fig. 3 is developed sys-tematically and rigorously, we say that our proposed model is sound. In addition, we further validate the soundness of ourmodel via a case study as discussed in the next section.
Completeness is defined as the degree to which the model represents the elements of interest in the problem domain. Interms of SRAM, completeness is related to the set of security risk variables defined in the model. To insure the completenessof variable set, we derive those variables by two means: first, we refer to an authoritative report from National Institute ofStandards and Technology (NIST) to select the base set of security risk variables; then we interview six domain experts toreview, modify, and enhance the initial set of variables based on their knowledge and experience. We believe the set of secu-rity risk variables selected using the two-step procedure aforementioned represent most common security risk factors in realinformation systems and thus is complete for the purpose of analyzing information systems security risk in our researchcontext.
4.2. A case study
In this section, the proposed SRAM is applied to a real company (referred to as AB Company in this paper)’s informationsystem, which has been in service for six years, to assess its security risk status and analyze its vulnerability propagationpaths and related probabilities. The details of the case study are discussed next.
4.2.1. Step 1: data preprocessingAB Company is a financial services firm providing a wide range of services in securities trading and sales, corporate fi-
nance and investment banking, and asset management. Because of its relatively long business history and several years ofe-business history, there is a large number of raw data related to information systems security.
The security risk related variables (i.e., the nodes in BN) are categorized into six groups: physical and environmental secu-rity, network security, host/server computer security, application security, data security and back-up, and communicationand operation security. The basic information about the nodes is stored in DB1 (see Fig. 1).
The raw data related to information systems security is stored in MATLAB files and the data corresponding to the nodes inBN are extracted. The data adjustment is then followed by an equal frequency data binning process, which clusters the datainto bins while ensuring that each bin contains fairly equal number of elements. After the equal frequency binning, the ori-ginal data are represented by the bin numbers associated with them. As a result, the maximum number of states in eachnode in BN is reduced. Moreover, the conditional probability tables (CPTs) of all variables will have manageable sizes becauseeach node will have small number of states.
4.2.2. Step 2: BN developmentIn SRAM, we use preliminary experiments to determine the appropriate values for various parameters. For Algorithm 1,
different parameter levels are examined based on the research presented in [29,18,4,14]. There are six different ant colonysizes m 2 f5;10;20;30;40;50g, four different evaporation rate levels q 2 f0;0:25;0:5;0:75g, three different pheromone
N. Feng et al. / Information Sciences 256 (2014) 57–73 65
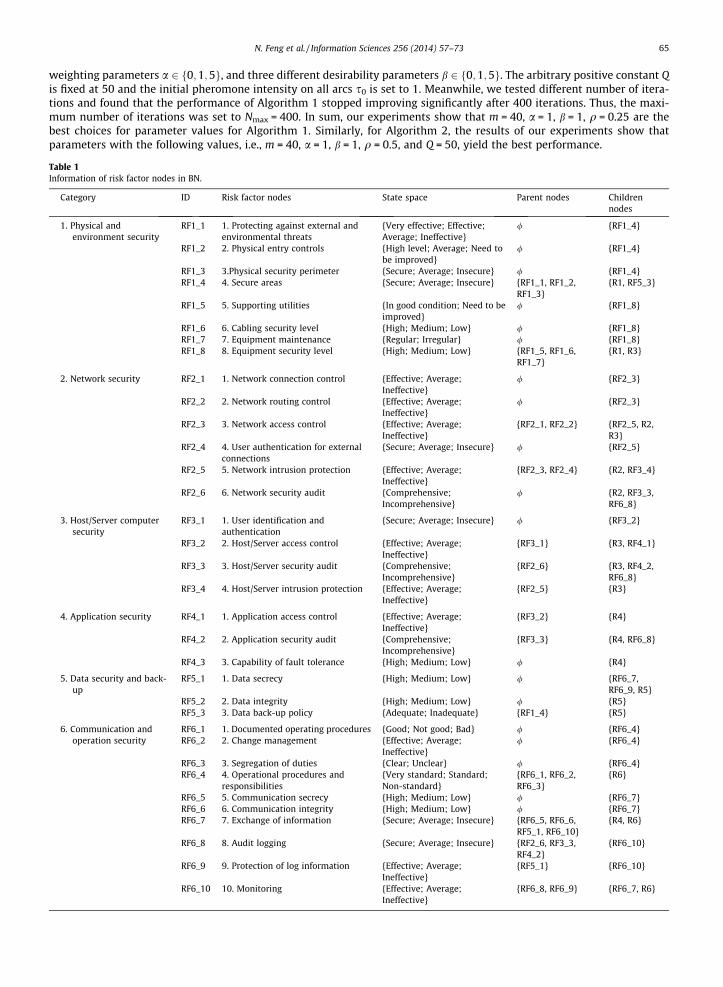
weighting parameters a 2 f0;1;5g, and three different desirability parameters b 2 f0;1;5g. The arbitrary positive constant Qis fixed at 50 and the initial pheromone intensity on all arcs s0 is set to 1. Meanwhile, we tested different number of itera-tions and found that the performance of Algorithm 1 stopped improving significantly after 400 iterations. Thus, the maxi-mum number of iterations was set to Nmax = 400. In sum, our experiments show that m = 40, a = 1, b = 1, q = 0.25 are thebest choices for parameter values for Algorithm 1. Similarly, for Algorithm 2, the results of our experiments show thatparameters with the following values, i.e., m = 40, a = 1, b = 1, q = 0.5, and Q = 50, yield the best performance.
Table 1Information of risk factor nodes in BN.
Category ID Risk factor nodes State space Parent nodes Childrennodes
1. Physical andenvironment security
RF1_1 1. Protecting against external andenvironmental threats
{Very effective; Effective;Average; Ineffective}
/ {RF1_4}
RF1_2 2. Physical entry controls {High level; Average; Need tobe improved}
/ {RF1_4}
RF1_3 3.Physical security perimeter {Secure; Average; Insecure} / {RF1_4}RF1_4 4. Secure areas {Secure; Average; Insecure} {RF1_1, RF1_2,
RF1_3}{R1, RF5_3}
RF1_5 5. Supporting utilities {In good condition; Need to beimproved}
/ {RF1_8}
RF1_6 6. Cabling security level {High; Medium; Low} / {RF1_8}RF1_7 7. Equipment maintenance {Regular; Irregular} / {RF1_8}RF1_8 8. Equipment security level {High; Medium; Low} {RF1_5, RF1_6,
RF1_7}{R1, R3}
2. Network security RF2_1 1. Network connection control {Effective; Average;Ineffective}
/ {RF2_3}
RF2_2 2. Network routing control {Effective; Average;Ineffective}
/ {RF2_3}
RF2_3 3. Network access control {Effective; Average;Ineffective}
{RF2_1, RF2_2} {RF2_5, R2,R3}
RF2_4 4. User authentication for externalconnections
{Secure; Average; Insecure} / {RF2_5}
RF2_5 5. Network intrusion protection {Effective; Average;Ineffective}
{RF2_3, RF2_4} {R2, RF3_4}
RF2_6 6. Network security audit {Comprehensive;Incomprehensive}
/ {R2, RF3_3,RF6_8}
3. Host/Server computersecurity
RF3_1 1. User identification andauthentication
{Secure; Average; Insecure} / {RF3_2}
RF3_2 2. Host/Server access control {Effective; Average;Ineffective}
{RF3_1} {R3, RF4_1}
RF3_3 3. Host/Server security audit {Comprehensive;Incomprehensive}
{RF2_6} {R3, RF4_2,RF6_8}
RF3_4 4. Host/Server intrusion protection {Effective; Average;Ineffective}
{RF2_5} {R3}
4. Application security RF4_1 1. Application access control {Effective; Average;Ineffective}
{RF3_2} {R4}
RF4_2 2. Application security audit {Comprehensive;Incomprehensive}
{RF3_3} {R4, RF6_8}
RF4_3 3. Capability of fault tolerance {High; Medium; Low} / {R4}
5. Data security and back-up
RF5_1 1. Data secrecy {High; Medium; Low} / {RF6_7,RF6_9, R5}
RF5_2 2. Data integrity {High; Medium; Low} / {R5}RF5_3 3. Data back-up policy {Adequate; Inadequate} {RF1_4} {R5}
6. Communication andoperation security
RF6_1 1. Documented operating procedures {Good; Not good; Bad} / {RF6_4}RF6_2 2. Change management {Effective; Average;
Ineffective}/ {RF6_4}
RF6_3 3. Segregation of duties {Clear; Unclear} / {RF6_4}RF6_4 4. Operational procedures and
responsibilities{Very standard; Standard;Non-standard}
{RF6_1, RF6_2,RF6_3}
{R6}
RF6_5 5. Communication secrecy {High; Medium; Low} / {RF6_7}RF6_6 6. Communication integrity {High; Medium; Low} / {RF6_7}RF6_7 7. Exchange of information {Secure; Average; Insecure} {RF6_5, RF6_6,
RF5_1, RF6_10}{R4, R6}
RF6_8 8. Audit logging {Secure; Average; Insecure} {RF2_6, RF3_3,RF4_2}
{RF6_10}
RF6_9 9. Protection of log information {Effective; Average;Ineffective}
{RF5_1} {RF6_10}
RF6_10 10. Monitoring {Effective; Average;Ineffective}
{RF6_8, RF6_9} {RF6_7, R6}

Table 2Information of risk nodes in BN.
ID Risk nodes State space Parent nodes Children nodes
R1 1. Physical and environment security risk {High; Medium; Low} {RF1_4, RF1_8} /R2 2. Network security risk {High; Medium; Low} {RF2_3, RF2_5, RF2_6} /R3 3. Host/Server computer security risk {High; Medium; Low} {RF1_8, RF2_3, RF3_2, RF3_3, RF3_4} /R4 4. Application security risk {High; Medium; Low} {RF4_1, RF4_2, RF4_3, RF6_7} /R5 5. Data security and back-up risk {High; Medium; Low} {RF5_1, RF5_2, RF5_3} /R6 6. Communication and operation security risk {High; Medium; Low} {RF6_4, RF6_7, RF6_10} /
Fig. 4. BN structure of network security risk.
Table 3CPT of P (RF2_3|RF2_1, RF2_2).
RF2_1 RF2_2 RF2_3 = Effective RF2_3 = Average RF2_3 = Ineffective
Effective Effective 0.9862 0.0138 0Average Effective 0.4653 0.4026 0.1321Ineffective Effective 0.1096 0.5592 0.3312Effective Average 0.5024 0.3943 0.1033Average Average 0.0511 0.6785 0.2704Ineffective Average 0.0095 0.2318 0.7587Effective Ineffective 0.0802 0.6121 0.3077Average Ineffective 0 0.2865 0.7135Ineffective Ineffective 0 0.0089 0.9911
Table 4CPT of P (RF2_5|RF2_3, RF2_4).
RF2_3 RF2_4 RF2_5 = Effective RF2_5 = Average RF2_5 = Ineffective
Effective Secure 0.9134 0.0866 0Average Secure 0.3911 0.5101 0.0988Ineffective Secure 0.0782 0.4231 0.4987Effective Average 0.3541 0.4886 0.1573Average Average 0.0911 0.7091 0.1998Ineffective Average 0 0.2806 0.7194Effective Insecure 0.0678 0.5996 0.3326Average Insecure 0.0033 0.2007 0.7960Ineffective Insecure 0 0 1.0000
66 N. Feng et al. / Information Sciences 256 (2014) 57–73
Based on the procedure of the ACO-based algorithm presented in Section 3.1, the BN structure was developed. Table 1demonstrates the information of the security risk factor nodes, i.e., the causes that lead to risks, and Table 2 shows the infor-mation of the security risk nodes, which security risk managers hope to predict ultimately. Taking the network security riskfor example, the BN structure of network security risk is shown in Fig. 4, and the CPTs of the nodes are shown in Tables 3–5.In the above tables and figure, the IDs of BN nodes are explained in Tables 1 and 2.

Table 5CPT of P (R2|RF2_3, RF2_5, RF2_6).
RF2_3 RF2_5 RF2_6 R2 = High R2 = Medium R2 = Low
Effective Effective Comprehensive 0.0102 0.1703 0.8195Average Effective Comprehensive 0.1908 0.3171 0.4921Ineffective Effective Comprehensive 0.5001 0.2988 0.2011Effective Average Comprehensive 0.2103 0.3502 0.4395Average Average Comprehensive 0.2687 0.4333 0.2980Ineffective Average Comprehensive 0.5915 0.2959 0.1126Effective Ineffective Comprehensive 0.5456 0.2845 0.1699Average Ineffective Comprehensive 0.6007 0.2504 0.1489Ineffective Ineffective Comprehensive 0.7301 0.1787 0.0912Effective Effective Incomprehensive 0.4980 0.3501 0.1519Average Effective Incomprehensive 0.5517 0.3448 0.1035Ineffective Effective Incomprehensive 0.6375 0.2508 0.1117Effective Average Incomprehensive 0.5709 0.3303 0.0988Average Average Incomprehensive 0.7011 0.2256 0.0733Ineffective Average Incomprehensive 0.7978 0.1525 0.0497Effective Ineffective Incomprehensive 0.7013 0.2848 0.0139Average Ineffective Incomprehensive 0.8392 0.1608 0Ineffective Ineffective Incomprehensive 0.9806 0.0194 0
Table 6State specification of risk nodes in BN.
Risk nodes State specification
Low Medium High
R1. Physical and environment securityrisk
(1) (2) (5) (9)(12)
(1) (2) (3) (5) (7) (9) (10) (12)(13)
(1) (2) (3) (4) (5) (6) (7) (8) (9) (10) (11) (12) (13)
R2. Network security risk (1) (2) (6) (8)(10)
(1) (2) (3) (6) (7) (8) (9) (10) (1) (2) (3) (4) (5) (6) (7) (8) (9) (10) (11)
R3. Host/Server computer security risk (1) (3) (5) (7) (1) (2) (3) (5) (7) (8) (1) (2) (3) (4) (5) (6) (7) (8)R4. Application security risk (1) (2) (5) (1) (2) (4) (5) (6) (1) (2) (3) (4) (5) (6) (7)R5. Data security and back-up risk (1) (4) (1) (2) (4) (5) (1) (2) (3) (4) (5) (6)R6. Communication and operation
security risk(1) (2) (10) (12)(13)
(1) (2) (4) (6) (8) (9) (10) (12)(13) (15)
(1) (2) (3) (4) (5) (6) (7) (8) (9) (10) (11) (12) (13)(14) (15)
Table 7The evidence obtained from real time database.
Notation Evidence Related nodes
E1 There is no regular equipment maintenance RF1_7 Equipment maintenanceE2 Several internal computer connections breach the access control policy RF2_2 Network routing control
RF2_3 Network connection controlE3 Several manual external tests are performed and do not result in unauthorized access RF2_4 User authentication for external
connectionsE4 During the past two months several suspicious incidents related to network have not been
loggedRF2_6 Network security audit
E5 There are a few other processes aside from normal browser caching, which store, alter orcopy information
RF3_2 Host/Server access control
E6 No restrictions on connection times to provide additional security for high-risk applications RF4_1 Application access controlE7 There is no security policy document that details the procedure of changes to systems RF6_2 Change managementE8 Several requests for data are not channeled through a DBA who then requests from
operation staffRF6_3 Segregation of duties
N. Feng et al. / Information Sciences 256 (2014) 57–73 67
According to the security controls related to each security risk in Appendix B, domain experts and security managers of ABCompany were interviewed to specify the states of the risk nodes in BN in Table 6.
4.2.3. Step 3: security risk assessmentFrom August 2009 to October 2009, the new evidence was obtained from real time database as shown in Table 7, which
gives updated information about each observable node in the BN as inference evidence. Based on the principle presented inSection 3.2, we compute the posterior probability of the nodes in the BN based on the evidence.
For the risk nodes in the BN, the probabilities of risk occurrence and the severities of risk consequence estimated by secu-rity risk assessment are shown in Table 8, from which the probabilities of ‘‘R2 Network security risk’’ and ‘‘R6 Communica-

Table 8The probabilities of risk occurrence and the severities of risk consequence.
Risk nodes State Probability Severity
R1. Physical and environment security risk High 0.2379 0.9Medium 0.5233Low 0.2388
R2. Network security risk High 0.6732 0.7Medium 0.2217Low 0.1051
R3. Host/Server computer security risk High 0.2043 0.7Medium 0.5945Low 0.2012
R4. Application security risk High 0.3512 0.6Medium 0.4920Low 0.1568
R5. Data security and back-up risk High 0.1878 0.7Medium 0.4029Low 0.4093
R6. Communication and operation security risk High 0.5930 0.7Medium 0.2856Low 0.1214
Table 9The result of vulnerability propagation analysis.
No Propagation paths Occurrence probability Consequence severity Path risk exposure
1 hE2,RF2_3,R2i 0.1603 0.7 0.11222 hE3,RF2_4,RF2_5,R2i 0.4101 0.7 0.28713 hE4,RF2_6,R2i 0.0947 0.7 0.06634 hE4,RF2_6,RF6_8,RF6_10,R6i 0.0353 0.7 0.02475 hE7,RF6_2,RF6_4,R6i 0.3474 0.7 0.24326 hE8,RF6_3,RF6_4,R6i 0.1442 0.7 0.1009
Table 10Comparison between SRAM and other approaches.
SRAM Evidential reasoning BBNRM Fuzzy risk analysis
Propagation analysis Yes No No NoLearning capability Yes No No NoProbability updating Yes No Yes NoStructure support Yes Yes Yes NoUncertainty processing No Yes No YesTool support Hugin expert NA BNT NA
68 N. Feng et al. / Information Sciences 256 (2014) 57–73
tion and operation security risk’’ are both higher than the threshold 0.5 set by experts in advance. Thus, for the risk nodes R2and R6 in the BN, the vulnerability propagation should be further analyzed.
4.2.4. Step 4: vulnerability propagation analysisAccording to the parameters mentioned in Section 4.2.2, Algorithm 2 is performed by combining occurrence probability
and consequence severity of all nodes along the vulnerability propagation path. Vulnerability propagation paths with theiroccurrence probabilities and path risk exposures are shown in Table 9, where the path risk exposure = (occurrence probabil-ity) � (consequence severity) and the meaning of the notations is explicated in Tables 1, 2 and 7. As shown in Table 9, both ofthe occurrence probability and path risk exposure of the paths No. 2 and 5 are larger than other paths significantly.
Based on the result of vulnerability propagation analysis, the corresponding security risk treatment plans are developedas follows:
(1) Analyze the unauthorized access-related information based on network logs.(2) Improve the mechanism of authentication.(3) Create the procedure for change management.
N. Feng et al. / Information Sciences 256 (2014) 57–73 69
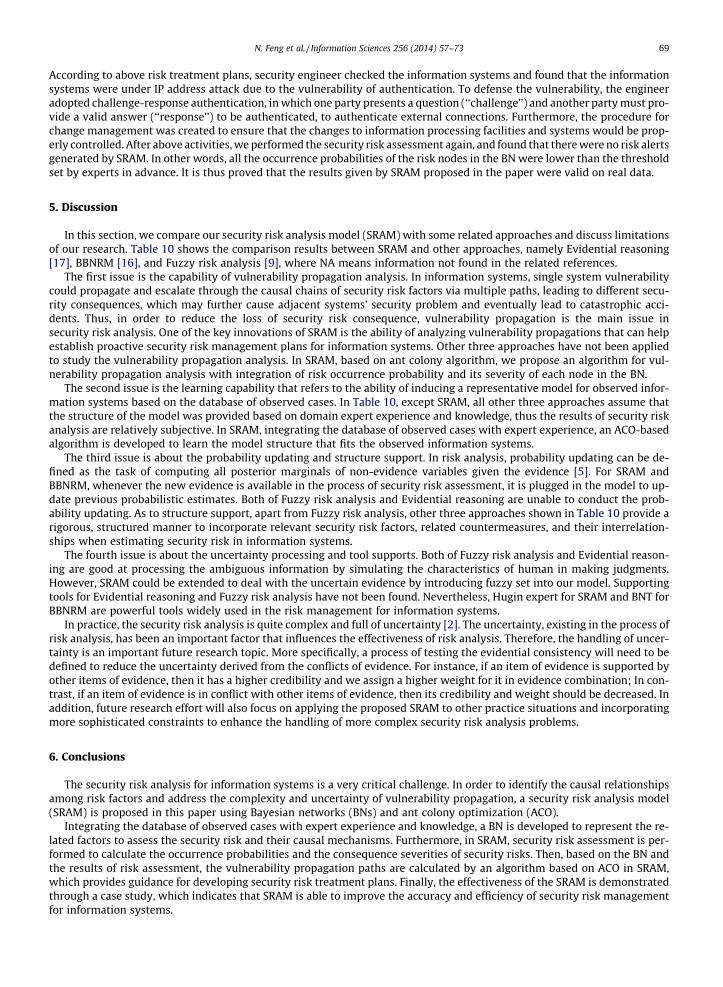
According to above risk treatment plans, security engineer checked the information systems and found that the informationsystems were under IP address attack due to the vulnerability of authentication. To defense the vulnerability, the engineeradopted challenge-response authentication, in which one party presents a question (‘‘challenge’’) and another party must pro-vide a valid answer (‘‘response’’) to be authenticated, to authenticate external connections. Furthermore, the procedure forchange management was created to ensure that the changes to information processing facilities and systems would be prop-erly controlled. After above activities, we performed the security risk assessment again, and found that there were no risk alertsgenerated by SRAM. In other words, all the occurrence probabilities of the risk nodes in the BN were lower than the thresholdset by experts in advance. It is thus proved that the results given by SRAM proposed in the paper were valid on real data.
5. Discussion
In this section, we compare our security risk analysis model (SRAM) with some related approaches and discuss limitationsof our research. Table 10 shows the comparison results between SRAM and other approaches, namely Evidential reasoning[17], BBNRM [16], and Fuzzy risk analysis [9], where NA means information not found in the related references.
The first issue is the capability of vulnerability propagation analysis. In information systems, single system vulnerabilitycould propagate and escalate through the causal chains of security risk factors via multiple paths, leading to different secu-rity consequences, which may further cause adjacent systems’ security problem and eventually lead to catastrophic acci-dents. Thus, in order to reduce the loss of security risk consequence, vulnerability propagation is the main issue insecurity risk analysis. One of the key innovations of SRAM is the ability of analyzing vulnerability propagations that can helpestablish proactive security risk management plans for information systems. Other three approaches have not been appliedto study the vulnerability propagation analysis. In SRAM, based on ant colony algorithm, we propose an algorithm for vul-nerability propagation analysis with integration of risk occurrence probability and its severity of each node in the BN.
The second issue is the learning capability that refers to the ability of inducing a representative model for observed infor-mation systems based on the database of observed cases. In Table 10, except SRAM, all other three approaches assume thatthe structure of the model was provided based on domain expert experience and knowledge, thus the results of security riskanalysis are relatively subjective. In SRAM, integrating the database of observed cases with expert experience, an ACO-basedalgorithm is developed to learn the model structure that fits the observed information systems.
The third issue is about the probability updating and structure support. In risk analysis, probability updating can be de-fined as the task of computing all posterior marginals of non-evidence variables given the evidence [5]. For SRAM andBBNRM, whenever the new evidence is available in the process of security risk assessment, it is plugged in the model to up-date previous probabilistic estimates. Both of Fuzzy risk analysis and Evidential reasoning are unable to conduct the prob-ability updating. As to structure support, apart from Fuzzy risk analysis, other three approaches shown in Table 10 provide arigorous, structured manner to incorporate relevant security risk factors, related countermeasures, and their interrelation-ships when estimating security risk in information systems.
The fourth issue is about the uncertainty processing and tool supports. Both of Fuzzy risk analysis and Evidential reason-ing are good at processing the ambiguous information by simulating the characteristics of human in making judgments.However, SRAM could be extended to deal with the uncertain evidence by introducing fuzzy set into our model. Supportingtools for Evidential reasoning and Fuzzy risk analysis have not been found. Nevertheless, Hugin expert for SRAM and BNT forBBNRM are powerful tools widely used in the risk management for information systems.
In practice, the security risk analysis is quite complex and full of uncertainty [2]. The uncertainty, existing in the process ofrisk analysis, has been an important factor that influences the effectiveness of risk analysis. Therefore, the handling of uncer-tainty is an important future research topic. More specifically, a process of testing the evidential consistency will need to bedefined to reduce the uncertainty derived from the conflicts of evidence. For instance, if an item of evidence is supported byother items of evidence, then it has a higher credibility and we assign a higher weight for it in evidence combination; In con-trast, if an item of evidence is in conflict with other items of evidence, then its credibility and weight should be decreased. Inaddition, future research effort will also focus on applying the proposed SRAM to other practice situations and incorporatingmore sophisticated constraints to enhance the handling of more complex security risk analysis problems.
6. Conclusions
The security risk analysis for information systems is a very critical challenge. In order to identify the causal relationshipsamong risk factors and address the complexity and uncertainty of vulnerability propagation, a security risk analysis model(SRAM) is proposed in this paper using Bayesian networks (BNs) and ant colony optimization (ACO).
Integrating the database of observed cases with expert experience and knowledge, a BN is developed to represent the re-lated factors to assess the security risk and their causal mechanisms. Furthermore, in SRAM, security risk assessment is per-formed to calculate the occurrence probabilities and the consequence severities of security risks. Then, based on the BN andthe results of risk assessment, the vulnerability propagation paths are calculated by an algorithm based on ACO in SRAM,which provides guidance for developing security risk treatment plans. Finally, the effectiveness of the SRAM is demonstratedthrough a case study, which indicates that SRAM is able to improve the accuracy and efficiency of security risk managementfor information systems.

70 N. Feng et al. / Information Sciences 256 (2014) 57–73
Acknowledgements
The research was supported by the National Natural Science Foundation of China (Nos. 70901054, 71271149, and71110107042) and the National Science Fund for Distinguished Young Scholars of China (No. 70925005). It was alsosupported by the Program for Changjiang Scholars and Innovative Research Teams in Universities of China (PCSIRT)and the China Postdoctoral Science Foundation funded project (No. 2012M520025). The authors are very grateful toall anonymous reviewers whose invaluable comments and suggestions substantially helped improve the quality ofthe paper.
Appendix A
To represent the causal relationships among security risk factors, an ACO-based algorithm shown in Fig. A1 is developedto learn the BN structure based on reference [11].
Fig. A1. The ACO-based algorithm for learning the BN structure.

Table B1Security controls for the risk nodes in BN.
NodeID
Security controls
R1 (1) The organization develops, disseminates, and updates documented procedures to facilitate the implementation of the physical andenvironmental protection policy and associated physical and environmental protection controls(2) The organization monitors physical access to the information system to detect and respond to physical security incidents(3) The organization monitors real-time physical intrusion alarms and surveillance equipment(4) The organization employs automated mechanisms to recognize potential intrusions and initiate designated response actions(5) The organization maintains visitor access records to the facility where the information system resides(6) The organization employs automated mechanisms to facilitate the maintenance and review of access records(7) The organization protects power equipment and power cabling for the information system from damage and destruction(8) The organization employs redundant and parallel power cabling paths(9) The organization employs and maintains fire suppression and detection devices/systems for the information system that are supportedby an independent energy source(10) The organization employs fire detection devices/systems for the information system that activate automatically and notify theorganization and emergency responders in the event of a fire(11) The organization employs an automatic fire suppression capability for the information system when the facility is not staffed on acontinuous basis(12) The organization protects the information system from damage resulting from water leakage by providing master shutoff valves thatare accessible, working properly, and known to key personnel(13) The organization positions information system components within the facility to minimize potential damage from physical andenvironmental hazards and to minimize the opportunity for unauthorized access
R2 (1) The organization develops, disseminates, and updates documented procedures to facilitate the implementation of the network accesscontrol policy and associated access controls(2) The organization monitors for unauthorized remote access to the information system(3) The organization employs automated mechanisms to facilitate the monitoring and control of remote access methods(4) The information system routes all remote accesses through a limited number of managed access control points(5) The organization ensures that remote sessions are audited(6) The organization establishes usage restrictions and implementation guidance for wireless access(7) The information system protects wireless access to the system using authentication and encryption(8) The organization establishes usage restrictions and implementation guidance for organization-controlled mobile devices(9) The organization restricts the use of writable, removable media in the information systems(10) The organization reviews and analyzes network audit records for indications of inappropriate or unusual activity(11) The organization analyzes and correlates audit records across different repositories to gain organization-wide situational awareness
R3 (1) The organization identifies specific user actions that can be performed on the host/server computer without identification orauthentication(2) The organization permits actions to be performed without identification and authentication only to the extent necessary to accomplishmission/business objectives(3) The host/server uses multifactor authentication for network access to privileged accounts(4) The organization allows the use of group authenticators only when used in conjunction with an individual/unique authenticator(5) The organization reviews and updates the list of auditable events(6) The organization includes execution of privileged functions in the list of events to be audited by the host/server computer(7) The organization implements an incident handling capability for security incidents that includes preparation, detection and analysis,containment, and recovery(8) The organization employs automated mechanisms to support the incident handling process
R4 (1) The organization develops, disseminates, and updates documented procedures to facilitate the implementation of the application accesscontrol policy and associated access controls(2) The organization manages the application using a development life cycle methodology that includes application security considerations(3) The organization obtains, protects as required, and makes available to authorized personnel, vendor or manufacturer documentationthat describes the security-relevant external interfaces to the application(4) The organization enforces explicit rules governing the installation of software by users(5) The organization requires that providers of external information system services comply with organizational information securityrequirements(6) The organization monitors security control compliance by external service providers(7) The organization conducts an organizational assessment of risk prior to the acquisition or outsourcing of dedicated information securityservices
R5 (1) The organization develops, disseminates, and updates documented data secrecy and integrity policy that addresses purpose, scope, roles,responsibilities, management commitment, and compliance(2) Data stored on the network attached storage appliance will be regularly backed up(3) Backups will be verified periodically(4) In the event of a system failure or user error, on-site backed up data will be made available to users within five working days(5) In the event of a system failure or user error, on-site backed up data will be made available to users within three working days(6) In the event of a system failure or user error, on-site backed up data will be made available to users within one working day
R6 (1) The organization develops, disseminates, and updates a documented communications and operation security policy that addressespurpose, scope, roles, responsibilities, management commitment, and compliance(2) The organization approves configuration-controlled changes to the system with explicit consideration for security impact analyses(3) The organization tests, validates, and documents changes to the information system before implementing the changes on theoperational system
(continued on next page)
N. Feng et al. / Information Sciences 256 (2014) 57–73 71

Table B1 (continued)
NodeID
Security controls
(4) The organization defines, documents, approves, and enforces physical and logical access restrictions associated with changes to theinformation system(5) The organization employs automated mechanisms to enforce access restrictions and support auditing of the enforcement actions(6) The information system protects the integrity of transmitted information(7) The organization employs cryptographic mechanisms to recognize changes to information during transmission unless otherwiseprotected by alternative physical measures(8) The information system protects the confidentiality of transmitted information(9) The organization issues public key certificates under a certificate policy or obtains public key certificates under an appropriate certificatepolicy(10) The information system protects log information from unauthorized access, modification, and deletion(11) The information system uses cryptographic mechanisms to protect the integrity of log information(12) The information system produces audit records that contain sufficient information to, at a minimum, establish what type of eventoccurred, when the event occurred, and the source of the event(13) The organization establishes a continuous monitoring strategy and implements a continuous monitoring program(14) The organization employs an independent assessor or assessment team to monitor the security controls in the information system onan ongoing basis(15) The information system monitors inbound and outbound communications for unusual or unauthorized activities or conditions
72 N. Feng et al. / Information Sciences 256 (2014) 57–73
The equations appearing in the algorithm are as follows:
(1) Heuristic information:
gij ¼ f ðxi; PaðxiÞ [ fxjgÞ � f ðxi; PaðxiÞÞ: ð8Þ
(2) Pheromone updating rule:
sij ð1� qÞsij þ qDsij ð9Þ
where Dsij ¼1=jf ðG� : DÞj if xj ! xi 2 G�
sij if xj ! xi R G�
�, sij is the level of pheromone in the arc xj ? xi, q(0 < q 6 1) is a parameter
that controls the pheromone evaporation, and G⁄ is the best graph found so far.
(3) Probabilistic transition rule:Select xr ? xl such that r; l ¼ argmaxi;j2FGf½sij�a½gij�
bg if q 6 q0I; J if q > q0
�where I, J are two nodes randomly selected according to
the following probabilities:
pkði; jÞ ¼½sij�a½gij�
bX
u;v2FG
,½suv �a½guv �
b if i; j 2 FG
0 otherwise
8><>: ð10Þ
The set FG contains all the arcs which are still candidates for insertion in G (i.e., they do not belong to G, their inclusion in Gdoes not create a directed cycle and gij > 0).
Appendix B
For each security risk, the security controls are listed in Table B1 according to NIST special publication 800-53, whichprovides a recommendation for security controls for the information systems.
References
[1] C. Alberts, A. Dorofee, Managing Information Security Risks: The OCTAVE Approach, Pearson Education, Inc., Upper Saddle River, New Jersey, 2002.[2] S. Alter, S. Sherer, A general, but readily adaptable model of information system risk, Communications of the AIS 14 (1) (2004) 1–28.[3] M. An, Y. Chen, C.J. Baker, A fuzzy reasoning and fuzzy-analytical hierarchy process based approach to the process of railway risk information: a railway
risk management system, Information Sciences 181 (18) (2011) 3946–3966.[4] C. Blum, A. Roli, Metaheuristics in combinatorial optimization: overview and conceptual comparison, ACM Computing Surveys 35 (3) (2003) 268–308.[5] C. Butz, S. Hua, J. Chen, H. Yao, A simple graphical approach for understanding probabilistic inference in Bayesian networks, Information Sciences 179
(6) (2009) 699–716.[6] G. Büyüközkan, D. Ruan, Choquet integral based aggregation approach to software development risk assessment, Information Sciences 180 (3) (2010)
441–451.[7] K. Campbell, L.A. Gordon, M.P. Loeb, L. Zhou, The economic cost of publicly announced information security breaches: empirical evidence from the
stock market, Journal of Computer Security 17 (3) (2009) 431–448.[8] H. Cavusoglu, B. Mishra, S. Raghunathan, The effect of Internet security breach announcements on market value: capital market reactions for breached
firms and Internet security developers, International Journal of Electronic Commerce 14 (3) (2009) 69–104.[9] S.J. Chen, S.M. Chen, Fuzzy risk analysis based on similarity measures of generalized fuzzy numbers, IEEE Transactions on Fuzzy Systems 11 (1) (2003)
45–56.[10] G.F. Cooper, E.A. Herskovits, A Bayesian method for the induction of probabilistic networks from data, Machine Learning 9 (1992) 309–347.

N. Feng et al. / Information Sciences 256 (2014) 57–73 73
[11] L.M. de Campos, J.M. Fernández-Lunab, J.A. Gámezc, J.M. Puerta, Ant colony optimization for learning Bayesian networks, International Journal ofApproximate Reasoning 31 (3) (2002) 291–311.
[12] M. Dorigo, G.D. Caro, The ant colony optimization meta-heuristic, in: D. Corne, M. Dorigo, F. Glover (Eds.), New Ideas in Optimization, McGraw-Hill,1999, pp. 11–33.
[13] M. Dorigo, V. Maniezzo, A. Colorni, Ant system: optimization by a colony of cooperating agents, IEEE Transactions on Systems, Man, and CyberneticsPart B 26 (1) (1996) 29–41.
[14] M. Dorigo, T. Stützle, Ant Colony Optimization, MIT Press, Cambridge, MA, 2004.[15] J.L. Douglas, The Security Risk Assessment Handbook: A Complete Guide for Performing Security Risk Assessments, Auerbach Publications, 2006.[16] C. Fan, Y. Yu, BBN-based software project risk management, Journal of Systems and Software 73 (2) (2004) 193–203.[17] N. Feng, M. Li, An information systems security risk assessment model under uncertain environment, Applied Soft Computing 11 (7) (2011) 4332–
4340.[18] J.A. Gámez, J.M. Puerta, Searching the best elimination sequence in Bayesian networks by using ant-colony optimization, Pattern Recognition Letters 23
(1–3) (2002) 261–277.[19] L.A. Gordon, M.P. Loeb, The economics of information security investment, ACM Transactions on Information and System Security 5 (4) (2002) 438–457.[20] L.A. Gordon, M.P. Loeb, W. Lucyshyn, CSI/FBI Computer Crime and Security Survey, Computer Security Institute, San Francisco, 2010.[21] L. Grunske, D. Joyce, Quantitative risk-based security prediction for component-based systems with explicitly modeled attack profiles, Journal of
Systems and Software 81 (8) (2008) 1327–1345.[22] S.A. Hartmann, T.A. Runkler, Online optimization of a color sorting assembly buffer using ant colony optimization, in: Proceedings of Operations
Research, 2007, pp. 415–420.[23] D. Heckerman, A Tutorial on Learning Bayesian Networks, Technical Report, Microsoft Research, Redmond Washington, 1996.[24] D. Heckerman, D. Geiger, D.M. Chickering, Learning BNs: the combination of knowledge and statistical data, Machine Learning 20 (3) (1995) 197–243.[25] D. Heckerman, M.P. Wellman, Bayesian networks, Communications of ACM 38 (3) (1995) 23–30.[26] F.V. Jensen, An Introduction to Bayesian Networks, Springer-Verlag, New York, 1996.[27] M.I. Jordan, Learning in Graphical Models, MIT Press, Cambridge, MA, 1999.[28] B. Karabacak, I. Sogukpinar, ISRAM: information security risk analysis method, Computers & Security 24 (2) (2005) 147–159.[29] J. Kennedy, R. Eberhart, Swarm Intelligence, Morgan Kaufmann, San Mateo, CA, 2001.[30] U.B. Kjaerulff, A.L. Madsen, Bayesian Networks and Influence Diagrams: A Guide to Construction and Analysis, Springer Science, New York, 2008.[31] K. Kojima, E. Perrier, S. Imoto, Optimal search on clustered structural constraint for learning Bayesian network structure, Journal of Machine Learning
Research 11 (2010) 285–310.[32] W. Lam, F. Bacchus, Learning Bayesian belief networks: an approach based on the MDL principle, Computational Intelligence 20 (2004) 269–293.[33] P. Larrañaga, M. Poza, Y. Yurramendi, R.H. Murga, C. Kuijpers, Structure learning of Bayesian networks by genetic algorithms: a performance analysis of
control parameters, IEEE Transactions on Pattern Analysis and Machine Intelligence 18 (2002) 912–926.[34] J. Li, M. Li, D. Wu, H. Song, An integrated risk measurement and optimization model for trustworthy software process management, Information
Sciences 191 (15) (2012) 47–60.[35] T. Peltier, Information Security Risk Analysis, second ed., Auerbach Publications, Boca Raton, FL, 2007.[36] P. Pinto, T.A. Runkler, J.M.C. Sousa, Ant colony optimization and its application to regular and dynamic MAX-SAT problems, in: Advances in Biologically
Inspired Information Systems: Models, Methods, and Tools, Springer-Verlag, Berlin, Germany, 2007, pp. 283–302.[37] C.R. Reeves, Modern Heuristic Techniques for Combinatorial Problems, Blackwell Scientific Publications, Oxford, 1995.[38] H. Salmela, Analysing business losses caused by information systems risk: a business process analysis approach, Journal of Information Technology 23
(3) (2008) 185–202.[39] C.A. Silva, J.M.C. Sousa, T.A. Runkler, Distributed optimization of logistic systems and its suppliers using ant colony optimization, International Journal
of Systems Science 37 (8) (2006) 503–512.[40] C.A. Silva, J.M.C. Sousa, T.A. Runkler, Distributed supply chain management using ant colony optimization, European Journal of Operational Research
199 (8) (2009) 349–358.[41] A. Summers, W. Vogtmann, S. Smolen, Consistent consequence severity estimation, Process Safety Progress 31 (1) (2012) 9–16.[42] I. Tsamardinos, L.E. Brown, C.F. Aliferis, The max–min hill-climbing Bayesian network structure learning algorithm, Machine Learning 65 (1) (2006)
31–78.[43] L. Sun, R.P. Srivastava, T.J. Mock, An information systems security risk assessment model under the Dempster–Shafer theory of belief functions, Journal
of Management Information Systems 22 (4) (2006) 109–142.[44] S. Weng, Y. Liu, Mining time series data for segmentation by using ant colony optimization, European Journal of Operational Research 173 (3) (2006)
921–937.[45] D. Wu, D.L. Olson, Enterprise risk management: coping with model risk in a large bank, Journal of the Operational Research Society 61 (2) (2010) 179–
190.[46] D.D. Wu, K. Xie, G. Chen, P. Gui, A risk analysis model in concurrent engineering product development, Risk Analysis 30 (9) (2010) 1440–1453.[47] W.T. Yue, M. Çakanyildirim, Y.U. Ryu, D. Liu, Network externalities, layered protection and IT security risk management, Decision Support Systems 44
(1) (2007) 1–16.
Related Documents