ELSEVIER Journal of Volcanology and Geothermal Research 68 (1995) 29-58 Geophysical evidence on the structure of the Taupo Volcanic Zone and its hydrothermal circulation H.M. Bibby *, T.G. Caldwell, F.J. Davey, T.H. Webb Institute of Geological and Nuclear Sciences, Kelbum Research Center, PO Box 1320, Wellington, New Zealand Received20 May 1994;accepted12 December 1994 Abstract The Taupo Volcanic Zone (TVZ) of New Zealand is characterised by extensive volcanism and by high rates of magma production. Associated with this volcanism are numerous high-temperature ( > 250°C) geothermal systems through which the natural heat output of 4200 f 500 MW is channelled. Outside the geothermal fields the heat flow is negligible. The average heat flux from the central 6000 km2 of the TVZ, which contains most of the geothermal fields, is 700 mW/m3. This heat flux appears to be more concentrated along the eastern margin of the TVZ. Schlumberger resistivity measurements (AB/2 of 500 m and 1000 m) have identified 17 distinct geothermal fields with natural heat outputs greater than 20 MW. An additional six, low-heat-output geothermal fields also occur, and may represent formerly more active systems now in decline. Two extinct fields have also been identified. The average spacing between fields is IO-15 km. The distribution of geothermal fields does not appear to be directly associated with individual volcanic features except for the geothermal system that occurs within Lake Taupo and which occupies the vent of the 1800 yr.B.P. Taupo eruption. The positions of the geothermal fields do not appear to have varied for at least the last 200,000 years. These data are consistent with a model of large-scale convection occurring throughout the TVZ, in which the geothermal fields represent the upper portion of the rising, high-temperature, convective plumes. The majority of the recharge to the convection system is provided by the downward movement of cold meteoric water between the fields which suppresses the heat flow in these regions. Gravity measurements indicate that to a depth of about 2.5 km the upper layers of the TVZ consist of low-density pyroclastic infill. A seismic refraction interface with velocity change from 3.2 km/s to 5.5 km/s occurs at a similar depth. The cross- sectional area of the convection plumes (identified electrically) appears to increase at depths of l-2 km, consistent with a decrease in permeability at the depth at which the velocity and density increase. The seismicity is dominated by swarm activity which accounts for about half of all earthquakes and is highly variable in both space and time. The small number of seismic events (and swarms) that have well determined depths show a cut off of seismicity at depths of 7-9 km. The depth of the transition from brittle to ductile behaviour of the rocks is identified with the transition from a regime where heat is transported by (hydrothermal) convection and pore pressures are near-hydrostatic to a regime where heat transport is dominantly conductive and pore pressures are lithostatic. Within the convective region, temperatures are moderated by the circulation of water so that the depth of the transition from convective to conductive heat transfer can be linked to the bottom of the seismogenic zone. Rocks must become ductile within about 1 km of the bottom of the overlying convective zone. Seismic refraction studies suggest that the crust beneath the TVZ is highly thinned with a seismic velocity of about 7.5 km/ s, typical of the upper mantle, occurring at depth of 15 km. Seismological studies indicate the upper mantle is highly attenuating beneath the TVZ. Conductive heat transfer between the bottom of the convective system, at about 8 km, and the base of the * Corresponding author. 0377-0273/95/$09.50 0 1995 Elsevier Science B.V-.-All rights reserved SSDIO377-0273(95)00007-O

1-s2.0-037702739500007H-main
Jan 27, 2016
paper
Welcome message from author
This document is posted to help you gain knowledge. Please leave a comment to let me know what you think about it! Share it to your friends and learn new things together.
Transcript

ELSEVIER Journal of Volcanology and Geothermal Research 68 (1995) 29-58
Geophysical evidence on the structure of the Taupo Volcanic Zone and its hydrothermal circulation
H.M. Bibby *, T.G. Caldwell, F.J. Davey, T.H. Webb Institute of Geological and Nuclear Sciences, Kelbum Research Center, PO Box 1320, Wellington, New Zealand
Received 20 May 1994; accepted 12 December 1994
Abstract
The Taupo Volcanic Zone (TVZ) of New Zealand is characterised by extensive volcanism and by high rates of magma production. Associated with this volcanism are numerous high-temperature ( > 250°C) geothermal systems through which the natural heat output of 4200 f 500 MW is channelled. Outside the geothermal fields the heat flow is negligible. The average heat flux from the central 6000 km2 of the TVZ, which contains most of the geothermal fields, is 700 mW/m3. This heat flux appears to be more concentrated along the eastern margin of the TVZ.
Schlumberger resistivity measurements (AB/2 of 500 m and 1000 m) have identified 17 distinct geothermal fields with natural heat outputs greater than 20 MW. An additional six, low-heat-output geothermal fields also occur, and may represent formerly more active systems now in decline. Two extinct fields have also been identified. The average spacing between fields is IO-15 km. The distribution of geothermal fields does not appear to be directly associated with individual volcanic features except for the geothermal system that occurs within Lake Taupo and which occupies the vent of the 1800 yr.B.P. Taupo eruption. The positions of the geothermal fields do not appear to have varied for at least the last 200,000 years. These data are consistent with a model of large-scale convection occurring throughout the TVZ, in which the geothermal fields represent the upper portion of the rising, high-temperature, convective plumes. The majority of the recharge to the convection system is provided by the downward movement of cold meteoric water between the fields which suppresses the heat flow in these regions.
Gravity measurements indicate that to a depth of about 2.5 km the upper layers of the TVZ consist of low-density pyroclastic infill. A seismic refraction interface with velocity change from 3.2 km/s to 5.5 km/s occurs at a similar depth. The cross- sectional area of the convection plumes (identified electrically) appears to increase at depths of l-2 km, consistent with a decrease in permeability at the depth at which the velocity and density increase.
The seismicity is dominated by swarm activity which accounts for about half of all earthquakes and is highly variable in both space and time. The small number of seismic events (and swarms) that have well determined depths show a cut off of seismicity at depths of 7-9 km. The depth of the transition from brittle to ductile behaviour of the rocks is identified with the transition from a regime where heat is transported by (hydrothermal) convection and pore pressures are near-hydrostatic to a regime where heat transport is dominantly conductive and pore pressures are lithostatic. Within the convective region, temperatures are moderated by the circulation of water so that the depth of the transition from convective to conductive heat transfer can be linked to the bottom of the seismogenic zone. Rocks must become ductile within about 1 km of the bottom of the overlying convective zone.
Seismic refraction studies suggest that the crust beneath the TVZ is highly thinned with a seismic velocity of about 7.5 km/ s, typical of the upper mantle, occurring at depth of 15 km. Seismological studies indicate the upper mantle is highly attenuating beneath the TVZ. Conductive heat transfer between the bottom of the convective system, at about 8 km, and the base of the
* Corresponding author.
0377-0273/95/$09.50 0 1995 Elsevier Science B.V-.-All rights reserved SSDIO377-0273(95)00007-O

30 H. Bibby et ul. / Journul of’ Volcanology und Geothermal Reseurch 68 (1995) 29-58
material with crustal velocities, at I5 km, is not able to provide all the heat that is discharged at the surface. Repeated intrusion from the mantle may provide the additional heat transport required.
1. Introduction
New Zealand lies astride the boundary between the
Pacific and Australian (Indian) plates. In the North
Island, the plate boundary zone is manifest as oblique
westward subduction of the oceanic Pacific plate
beneath the Australian plate with a relative conver-
gence rate of about 50 mm/year. Associated with this
subduction is an onshore region of rapid extension,
extremely active volcanism and high heat output. The
currently active part of this region, the Taupo Volcanic
Zone (TVZ, Fig. 1)) is defined by the envelope of the
0 50 km \\
I 1 1 1 1 I !
P CIFIC
ATE
Fig. I. Location map showing the structural features of the central North Island and their relationship to the plate boundary features (inset).
The Taupo Volcanic Zone (TVZ) is defined by Wilson et al. ( 1995) as the envelope containing all volcanic activity in the central North Island
over the last 2 Ma. The Central Volcanic Region (CVR), of which the TVZ is a part, is defined by the extent of geophysical anomalies and includes older volcanics. Insert shows bathometric contours which outline the offshore structure. Hatched regions show where gmywacke
outcrops.

H. Bibby et al. /Journal of Volcanology and Geothermal Research 68 (1995) 2%_58 31
Fig. 2. Position of known calderas within the TVZ (after Wilson et al., 1995). Andesitic volcanism dominates the regions north of the Okataina Caldera and to the south of the Taupo Caldera (Lake Taupo) . Between these two regions, rhyolitic volcanism is dominant.
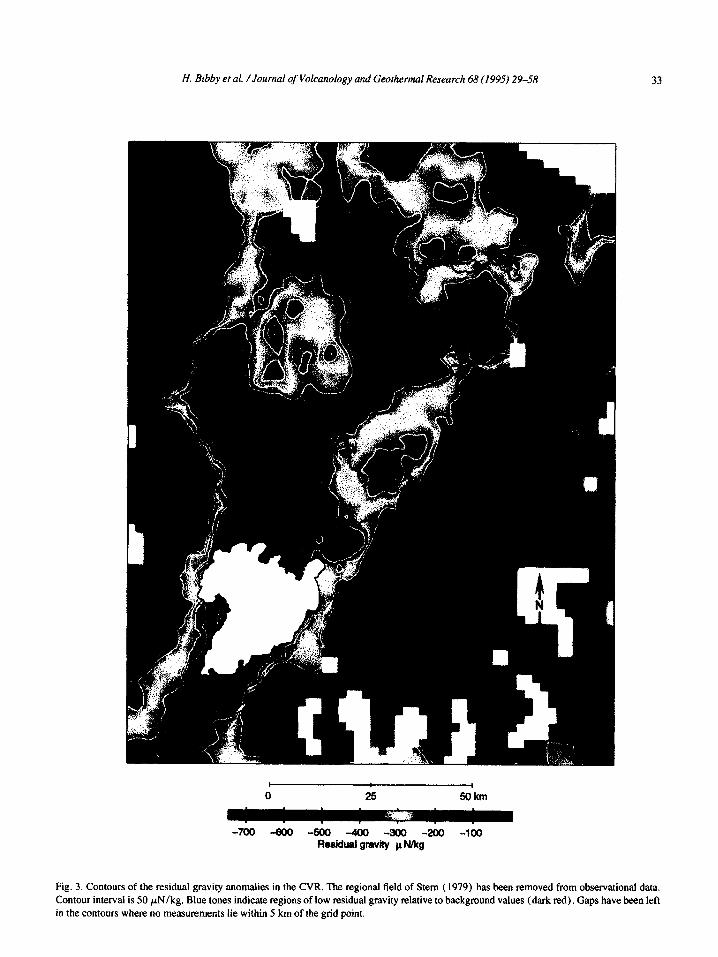
active volcanism over the last 2.0 m.y. (Wilson et al., 1995). To the east, from Ruapehu to Bay of Plenty (Fig. 2) the margins of the volcanism are also marked geophysically by steep gravity gradients (Fig. 3) asso- ciated with downfaulting of the greywacke basement towards the TVZ (Modriniak and Studt, 1959; Hoch- stein and Hunt, 1970). A similar sharp gravity gradient occurs on the west side of the TVZ from Ruapehu to Mangakino (Hatherton, 1974). On the western side north of Mangakino, the margin of the volcanism which defines the TVZ is no longer associated with a clearly defined gravity gradient (Fig. 3). A region of low resid- ual gravity extends to the west of the TVZ, forming a broader zone which includes volcanism older than 2 Ma. This wider region has been termed the Central Volcanic Region (CVR) (Stem, 1985; Cole, 1990). The western edges of neither the TVZ nor the CVR has been defined precisely along the full length by geo- physical means. In describing geophysical features, care needs to be taken to distinguish between the prop- erties of these two regions.
At the northern and southern ends of the TVZ, vol- canism is dominated by andesitic volcanoes: the Rua- pehu-Tongariro complex in the south and Eldgecumbe, Whale Island and White Island to the north (Fig. 1 and Fig. 2). Between these two dominantly andesitic zones the volcanism is predominantly rhyolitic and is char- acterised by numerous rhyolitic domes, ignimbrite sheets and their associated collapse calderas. This cen- tral portion of the TVZ is rated by Wilson et al. ( 1995) as the largest and most frequently active rhyolitic mag- matic system known.
Accompanying the high frequency of volcanic activ- ity is an extremely high natural heat flow which is responsible for the geothermal fields. All the geother- mal fields of the central North Island lie within the TVZ. The energy budget of the TVZ is dominated by the heat discharged at the surface through the geothermal fields with this rate of energy transport being more than dou- ble that associated with volcanism (Hochstein et al., 1993). It is important to recognise that the geothermal systems play a major role in the heat transfer process.
In this study we review the major results from geo- physical studies of the TVZ. Active-source seismic investigations and the seismicity of the volcanic areas define the structure of the crust and the way it is being deformed and provide constraints on the temperatures at depth. Resistivity studies delineate the geothermal systems, and, together with the heat flow, demonstrate that a large-scale convective heat transport process acts within the TVZ. Each of these geophysical techniques provides constraints which helps define the nature of the hydrothermal heat transport processes.
2. Gravity studies
Over 7000 gravity measurements (Reilly, 1972) have been made in the region shown in Fig. 1. Stern (1979) and Rogan (1982) used these data in their studies of the structure of the volcanic region. In order to isolate the gravity effects of the volcanism from the long wave-length signature of the deeper plate margin, both authors removed a regional gravity field derived from the gravity observations made on outcrops of the basement greywacke. (Fig. 1). The residual gravity anomalies (Fig. 3) indicate a broad area of low gravity, with an average residual anomaly about - 350 FN/kg. Superimposed on this broad low-gravity feature are a

32 H. Bibby et al. /Journal of Volcanology and Geothermal Research 68 (1995) 29-58
number of smaller areas of even lower gravity. Many of these coincide with the centres of rhyolitic volcanism
(e.g., Mangakino, Okataina and Maroa). Both the
regional and small scale anomalies have been inter-
preted as being caused by low-density pyroclastic
deposits which fill the TVZ. Assuming a density con-
trast of 0.5 Mg/m3 between greywacke and pyroclas-
tics, Modriniak and Studt (1959) estimated basement
depth within the TVZ to be between 1 and 2 km. The
smaller-scale low-gravity features can be linked to cal-
dera collapse, with subsequent infilling by low-density
material (Stern, 1982; Rogan, 1982). In addition to the calderas recognised at the time, Rogan (1982) identi-
fied a collapse feature at Kapenga (Fig. 2) which
formed the basis for the recognition of the Kapenga
Caldera (Wilson et al., 1984).
Several prominent gravity highs also occur within
the broad-scale gravity low of Fig. 3. There is an inher-
ent ambiguity in the identification of the material which
gives rise to these features, as at least one is associated with a greywacke outcrop; while another is linked to
andesites. This highlights the problem of determining and identifying the basement rocks which have been
interpreted as both greywacke (Modriniak and Studt, 1959) and as andesite (Stern, 1982).
Detailed examination of the density of drillhole sam- ples (Stern, 1986) indicates that large lateral and ver-
tical variations in density occur within the upper 2 km
of volcanics. Thus, interpretations based on assuming
a constant density difference between overburden and
basement will systematically underestimate basement
depths. Furthermore, lateral gravity changes of up to
150 pN/kg can be produced by variations in the vol- canic infill. Consequently, resolution of basement structure from gravity will be poor (Stern, 1986).
3. Seismic studies
3.1. Shallow structure
All attempts to carry out land-based seismic experi- ments in the central part of the TVZ have experienced severe problems with energy absorption and reverber- ation in the surface layer of volcanics. In particular, seismic-reflection investigations of the structure of geothermal fields have met with only limited success. A survey of the Broadlands/Ohaaki geothermal field
(Henrys and Hochstein, 1990) detected only a few
discontinuous reflectors, interpreted as volcanic layers,
at depths of less than 1000 m. Lamarche ( 1992), in a survey of the southern margin of the Rotorua geother-
mal field, was able to image the geometry of the inter-
faces between the main volcanic units to depths of only
about 600 m. Bannister ( 1992) has discussed the nature
of these problems in a report on work attempting to
develop techniques to improve the quality of seismic- reflection data from the TVZ.
Better-quality data have, however, been obtained in areas where the surface layer is alluvium rather than
the recent ashes and pumices that occur over much of
the TVZ (Woodward, 1988, 1989). Shallow seismic- reflection surveys using marine techniques have also
had success within Lake Taupo (Northey, 1982; Davy,
1993) where details of the caldera structure, and erup-
tives have been identified to depths of the order of 1000
m.
Seismic-refraction experiments (Robinson et al., 1981; Sissons and Dibble, 1981; Stern, 1982) using
shots in water and low-frequency earthquake recorders have been more successful. The velocity models
derived from these experiments show consistent struc-
tures with a low-velocity layer (0.8 to 3.2 km/s) over- lying material with velocity of 4.8 to 5.5 km/s below depths of 2 to 2.2 km (Fig. 4). In particular, the results
of both Robinson et al. ( 1981)) who used a widely
dispersed array of seismometers in the area north of
Lake Taupo, and of Stern and Davey (1985) suggest a remarkably uniform velocity structure. Although only
a few geothermal drillholes penetrate below 2.2 km, it
is clear that, at least for the region north of Lake Taupo,
the low-velocity surficial material consists of the prod- ucts of Quaternary rhyolitic volcanism.
The composition of the underlying higher-velocity material is more uncertain. The velocities implied by the refraction experiments are consistent with either
greywacke basement or igneous rocks. In the deep dril- lholes closest to the eastern edge of the TVZ, both greywacke and andesitic rocks have been encountered. Further to the west at Ngatamariki, a diorite intrusion occurs at the bottom of one of the drillholes (Browne et al., 1992). However, at Mokai, the westernmost of the geothermal fields for which deep drillhole data are available, only rhyolite volcanics have been encoun- tered. Thus, it does not seem to be possible to correlate the higher velocities that occur below about 2 km with
H. Bibby et al. /Journal of Volcanology and Geothermal Research 68 (I 995) 29-58 33
I
0 I
25 5Okm
.”
-700 -800 -500 -400 -3w -200 -100 Residual gravily #Wkg
Fig. 3. Contours of the residual gravity anomalies in the CVR. The regional field of Stem (1979) has been removed from observational data. Contour interval is 50 wN/kg. Blue tones indicate regions of low residual gravity relative to background values (dark ted). Gaps have been left in the contours where no measurements lie within 5 km of the grid point.

34 H. Bibby et al. /Journal of Volcanology and Geothermal Research 68 (1995) 29-58
1 I ROTOEHU 2 / MANGAKINO 3 / TAUPO
-0
- 0.5
0.0 4
3.2 km/s
0.0 4
3.2 MS
$ - 1.0
r s 2 -1.5
3.2 kmk
3.2 km/s
- 2.0
4.0 km/s 5.5 km/s
_ 2.5
Island. Sedimentary sequences within the fault zone indicate continued fault development from the late Ter-
tiary to the present. Wright (1992), using swath bathymetry and shallow seismic-reflection data in the
Bay of Plenty, traced the Taupo Volcanic Zone offshore as three main units which, from the east, consist of a frontal graben, a volcanic ridge and a back graben. He
noted a high degree of faulting occurs along the eastern
margin of this zone. Davey and Lodolo ( 1995) used marine seismic-reflectionmethods to show that the sed-
iments are about 2-3 km thick (2.5 s two-way travel
time), and thicken towards an apparent basement ridge (Fig. 5). They also noted that down warping and sed-
iment deposition has progressed eastwards with time in an episodic manner. The implications of these data
are discussed in detail in Davey et al. ( 1995). V,, km/s
4.0 6.0 3.2. Deep structure
\ ‘b
E 1.0 - ‘\ ‘\ -Y i
\\\\
z \‘\ $
2.0 - \ ‘\\
\ \ \ \
3.0 I I I 1 I I I
Fig. 4. Upper part of figure shows velocity models derived from three seismic-refraction lines at different locations within the TVZ (after Stern and Davey, 1985). The lower portion of the figure shows the velocity models derived by Robinson et al. (1981) using a set of widely spaced seismometers in the area immediately north of Lake Taupo. In this case the data have been interpreted using both contin- uous velocity models and a set of discrete layers.
a specific lithology. Since the geological structure is so heterogeneous, the uniformity of the velocity structure suggests that there is a physical rather than lithological
cause for the increase in velocities observed. Stern ( 1986)) using gravity, borehole and seismic-refraction data, reached a similar conclusion suggesting that the high-velocity material north of Lake Taupo was composed of ‘compacted volcanic or igneous rocks’.
In 1983, Stem and Davey (1985, 1987) carried out a crustal-scale seismic-refraction experiment using
explosive sources located in Lake Taupo and near White Island. Data were recorded along a 180~km pro-
file running the length of the TVZ and at the national network seismographs on the margins. Seismic wave
transmission was poor within the TVZ, allowing detec- tion to only about 100 km. The results were interpreted
in terms of a sequence of low-dip, isovelocity-layers, with velocities increasing with depth. The resulting
velocities (central portion of Fig. 6) show that below 15 km the seismic velocity is 7.5 km/s, which was
interpreted to be upper mantle. A set of reflected arri- vals was also detected from the top of the 7.5 km/s
layer. Although this depth is shallow for Moho, it would be consistent with the extensional regime and the high heat flow occurring in the TVZ. The velocity is also
consistent with the upper-mantle seismic velocity
derived by Haines ( 1979) from earthquake data. The results indicate that crustal structure must be fairly uni- form across the wider CVR as arrivals to stations both within and on the margins are consistent. These results provided the first direct indication of highly thinned crust and confirm the low seismic velocity inferred by Haines ( 1979) for the upper mantle.
Offshore, marine surveys have been used to outline Crustal seismic refraction data have also been the sedimentary and basement structure. In the west recorded along a northwest profile from Lake Taupo to Bay of Plenty, Thrasher ( 1986)) using oil industry data, North Cape (Stem et al., 1987). The velocity model identified a NW-trending fault system through Mayor derived from these results (west side, Fig. 6) suggests

H. Bibby et al. /Journal of Volcanology and Geothermal Research 68 (1995) 29-58
Ta;;F t- Central Volcanic Region (CVR)
0
I
White Island Fault
1
6 Lower crustal - Moho reflectors
0 I
1Okm 1
35
Fig. 5. Marine reflection seismic profile crossing the CVR in the Bay of Plenty (from Davey and Lodolo, 1995). Sediments are about 2-3 km
thick. Down warping and sediment deposition have progressed eastward with time. Note the strong lower crustal reflectors, which coincide with
the offshore extension of the TVZ. The deepest reflector is at the same depth as a strong reflector observed from work near Lake Taupo (Stem
and Davey, 1985)
40
I Central Volcanic Region I
axial greywacke ranges I
west
\ 6.2- 6.4 km/s I, _ ~_ _
/ ’ 7.4-7.5kmIs ‘1 / 7
- _ $ho / , ?
--- m-’ ?
7.6 km/s
7.9 km/s
0 50 km I I I
Vertical exaggeration = x 2.5
8.1 km/s (from earthquake
seismology) A Fig. 6. A schematic model of the crustal velocity structure across the central North Island, after Stem aad Davey ( 1987)

36 H. Bibby et ul. /Journul of Volcunolo~y and Geo~herml Research 68 (1995) 29-58
that velocities of 7.6 km/s do not occur until a depth
of 25 km. Thus, although the velocity structure is sim-
ilar to that of the volcanic areas, the crustal thickness
appears to be 10 km deeper to the west. This data set
also suggests velocities in the mantle increase with depth, changing from 7.6 km/s at 25 km to 7.9 m/s at about 50 km.
Crustal-reflection data acquired in the Bay of Plenty
(Davey and Lodolo, 1995; Davey et al., 1995) show a sequence of strong lower-crustal reflectors in the sec-
tion of data offshore of the CVR (see Fig. 5). The
deepest of these reflectors is consistent with the depth
to Moho proposed by Stern and Davey ( 1985) from
the land-based refraction data. This suggests that the
Moho may be strongly reflective under the entire TVZ
and perhaps can be related to the presence of partial
melt in the lower crust.
4. Seismicity within the volcanic region
4.1. The seismic@ data set
Seismicity data from the central North Island have
been routinely collected since about 1940 using the New Zealand National Seismograph Network, a
nation-wide array of seismometers with an average
spacing of about 100 km. A major upgrade of equip- ment and analysis procedures of this network was made around 1964. Since about 1986, an additional network
of seismometers with an average spacing of 25 km has operated within theTVZ (Hurstetal., 1988), providing much improved detection of the lower-magnitude
earthquakes. For any network, there is a threshold of earthquake
magnitude below which not all earthquakes will be detected. The magnitude threshold may change as
microearthquake networks are installed or removed, or National Network stations are relocated, or as analysis
procedures change. The most homogeneous data set available for the TVZ is shown in Fig. 7 which includes locations for all shallow earthquakes (depths less than 40 km) for the time period 1964 to 1993. These data are homogeneous for events with local magnitude (ML) of 4.0 and above. Events have also been included with magnitudes down to ML = 3.7 to give a denser coverage. In the region near Lake Taupo, the uncer- tainties in the epicentral locations are estimated by
” @a SO’km o
. M 2 6.0
0 5.0 I Ms5.9 a
Fig. 7. Locations of all shallow seismicity (depths less than 40 km)
contained in the catalogue of events recorded by the New Zealand
National Seismometer Network, for the time period Jan. 1964 to
Nov. 1993. Data are complete for earthquakes with magnitude
greater than MI. = 4.0, although earthquakes of (local) magnitudes
from IV, = 3.7 are included. Mapped active faults are also shown.
Sherburn ( 1992b) to be less than 2 km and elsewhere
they seldom exceed 5 km.
Epicentres determined since the TVZ seismic net- work was installed are shown in Fig. 8. Events are
shown only if they have been recorded at 4 or more stations and with 5 or more phase readings. Since the configuration of this network was changed during the interval 1987 to 1993, the detection threshold is not
homogeneous over the area shown. Despite this limi-
tation, Fig. 8 gives a more representative picture of the distribution of the seismicity than Fig. 7.

H. Bibby et al. /Journal of Volcanology and Geothermal Research 68 (1995) 29-58 37
0 4.0s MS4.9
0 3.0 S M 5 3.9
Fig. 8. Epicentms of selected earthquakes recorded since the instal- lation of the seismic networks at Taupo and Rotorua (Jan. 1987 to Nov. 1993). Events are included if they have been recorded on 4 or more stations, with 5 or mote phases identified. Note that the net- works have changed considerably during the period so this data does not have a homogeneous detection threshold. Active faults are also shown.
4.2. Distribution of seismic@
The seismicity pattern shown in Fig. 7 is dominated by two large earthquakes and their associated after- shocks -the 1987 Edgecumbe earthquake (ML = 6.3) and the 1992 Bay of Plenty earthquake (ML = 6.1) . In other respects, the distribution of earthquakes shown
in Fig. 7 and Fig. 8 is similar to those shown by Smith and Webb (1986) for the period 1964 to 1983. Two distinct regions of activity are apparent in Fig. 7 and Fig. 8, one to the south of Lake Taupo, and the other on the northern end of the TVZ near the Bay of Plenty coast. The northern region is dominated by aftershocks of the Edgecumbe earthquake (Smith and Oppenhei- mer, 1989; Anderson et al., MO), and is absent in maps of seismicity for earlier periods. The activity in the region to the south of Lake Taupo, however, has been a persisted feature of the seismicity since meas- urements have been available.
The less active central region corresponds to the por- tion of the TVZ that is predominantly rhyolitic in nature (Fig. 2) and contains the majority of the active geo-
C 1. 5.01MIS.SI
50 km J I ,
Fig. 9. Focal mechanisms determined for events within the TVZ. Harvard Centroid Moment Tensor solutions (best double couple) for shallow events ( < 40 km) in the period 1977 to 1992 ate shown in black. Mechanisms given in Smith and Webb ( 1986) are shown in lighter tones The three largest events, which aU occur near the Bay of Plenty coast, show normal faulting mechaniims. The smaller events to the north show large transcurrent components of motion, as do the events within the rhyolitic portion of the Taupo Volcanic Zone.

38 H. Bibby et al. /Journal of Volcanology and Geothermal Research 68 (1995) 29-58
thermal systems. This suggests a correlation may exist
between heat flow and low seismicity along the TVZ.
Smith and Webb ( 1986) noted that very few earth-
quakes occur to the west of the TVZ, although no var- iation is seismicity occurs across the eastern edge of
the TVZ.
4.3. Focal mechanisms and deformation
Faulting within the TVZ (Grindley, 1965; Grindley
and Hull, 1984; Beanland et al., 1990) is predominantly
normal, with strikes parallel to the trend of the TVZ
(Fig. 9). Such faulting implies tension perpendicular
to the TVZ which has also been directly observed by geodetic measurements. From repeated geodetic sur-
veys immediately north of Lake Taupo, Darby and Wil-
liams ( 199 1) derived an extension rate of 18 + 5 mm/
yr (assuming no length change parallel to the strike of
the Taupo Fault Zone). They also found significant
changes in the direction of relative extension across the zone, consistent with a transition from normal to strike-
slip faulting east of the TVZ. Near the Bay of Plenty
coast Sissons (1979) used geodetic data to derive an extension rate of 7 mm/yr assuming deformation
occurred across a 40 km wide zone. However, analyses of GPS data (Darby and Meertens, 1995) indicate high
extension rates to the north, and lower rates near Lake
Taupo, in contrast with the earlier deformation meas- urements suggesting there may be large temporal
changes in deformation. Although the rates vary, all analyses indicate extension of the TVZ.
Focal mechanisms determined from small earth-
quakes (Fig. 9)) and composite mechanisms for series
of earthquakes (Hunt and Latter, 1982; Smith and Webb, 1986), show a nodal plane striking broadly northeast, parallel to the surface faulting. However, mechanisms for smaller events all show strike-slip
components. For larger events this is not the case. Fig. 9 shows all available shallow focal mechanisms
obtained from the Harvard Centroid Moment Tensor catalogue (Dziewonski et al., 1981). The three largest events in Fig. 9 indicate predominantly normal faulting. The smaller-magnitude events all have large transcur- rent components. Thus, while the events of magnitude 6 or greater illustrate how the spreading is being accom- modated, the problem of how to explain the predomi- nance of transcurrent focal mechanisms of small events remains.
4.4. Deformation rates
The rate of deformation can also be obtained by
summing earthquake moments. This summation will be dominated by the largest earthquake, which for the
TVZ, is the 1987 Edgecumbe event. Geodetic (Darby,
1989) and seismological (Priestly, 1989; Anderson
and Webb, 1989) modelling of this event give values
for horizontal extension of 2.1 f0.3 and 1.8 f0.4 m respectively. The length over which this slip is distrib-
uted is not as well defined, but is in the range 10 to 20
km. If the TVZ is widening at a rate within the range 5
to 20 mm/yr, as indicated by geodetic observations, earthquakes of the size of the Edgecumbe event would
be required every 5 to 30 years to relieve all the accu-
mulated strain seismically. Too few large earthquakes
have occurred this century and unless seismicity over the last hundred years is not representative of the long-
term behaviour of the TVZ, it appears that within the
region of high heat flow a large proportion of the strain
is released aseismically. This has been suggested by
Evison et al. ( 1976).
4.5. Swarm activity
One of the characteristics that distinguishes the seis- micity of the TVZ from that of its surroundings is the
predominance of swarm activity. Smith and Webb
(1986) found both the rate of seismic activity and
magnitude distribution of earthquakes (b-values) in the TVZ and the east coast to be similar. For the time
period considered, however, there were nine substantial
swarms (4 or more events per swarm) within the TVZ compared to one in the eastern region. In fact, swarms accounted for about half of the earthquakes in the TVZ.
Smith and Webb ( 1986) suggested widespread crustal heterogeneity and/or fluid movement might account
for the occurrence of swarms in the TVZ. Since 1986, large sequences of aftershocks associated with the two
M, > 6 main shocks have dominated the seismicity. Smith and Oppenheimer (1989) noted that the
sequence of earthquakes associated with the Edge- cumbe earthquake included at least three separate swarms which all occurred within a distance of 35 km from the Edgecumbe epicentre. The background rate of swarm occurrence in the TVZ is 2.8 swarms/ 1000 km’ per year (Sherburn, 1992a). The probability, based on a Poisson distribution, of three swarms occur-
H. Ribby et al. /Journal of Volcanology and Geothermal Research 68 (1995) 29-58 39
ring within 12 days and 35 km of the Edgecumbe earth- quake is extremely small ( -CO.OOl) suggesting a triggering process. Triggering of seismicity in the TVZ must be able to act over distances of up to _ 35 km, but not over larger distances ( > 100 km). Smith and Oppenheimer ( 1989) speculate that swarms are most likely produced by a process analogous to hydrofrac- turing, but this process is not able to relieve significant amounts of regional stress.
4.6. Depth of seismicity
To accurately determine earthquake focal depth, at least one seismograph of the networkneeds to be within about one focal depth of the epicentre. For shallow ( <5 km) events, this requires extremely dense net- works.
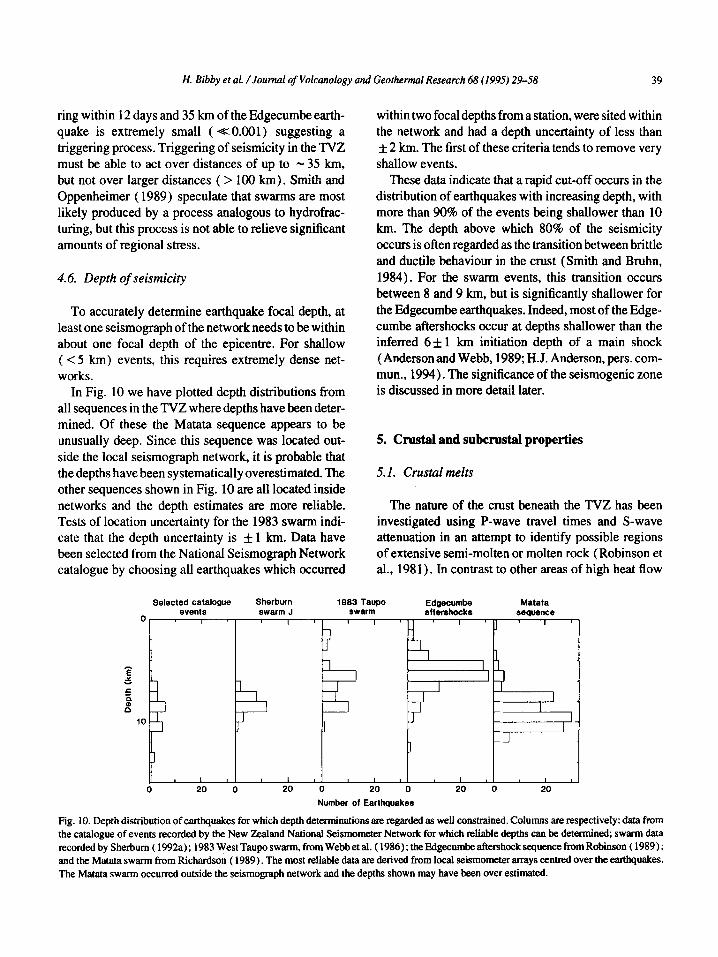
In Fig. 10 we have plotted depth distributions from all sequences in the TVZ where depths have been deter- mined. Of these the Matata sequence appears to be unusually deep. Since this sequence was located out- side the local seismograph network, it is probable that the depths have been systematically overestimated. The other sequences shown in Fig. 10 are all located inside networks and the depth estimates are more reliable. Tests of location uncertainty for the 1983 swarm indi- cate that the depth uncertainty is f 1 km. Data have been selected from the National Seismograph Network catalogue by choosing all earthquakes which occurred
within two focal depths from a station, were sited within the network and had a depth uncertainty of less than f 2 km. The first of these criteria tends to remove very shallow events.
These data indicate that a rapid cut-off occurs in the distribution of earthquakes with increasing depth, with more than 90% of the events being shallower than 10 km. The depth above which 80% of the seismicity occurs is often regarded as the transition between brittle and ductile behaviour in the crust (Smith and Bruhn, 1984). For the swarm events, this transition occurs between 8 and 9 km, but is significantly shallower for the Edgecumbe earthquakes. Indeed, most of the Edge- cumbe aftershocks occur at depths shallower than the inferred 6f 1 km initiation depth of a main shock (Anderson and Webb, 1989; H.J. Anderson, pers. com- mun., 1994). The significance of the seismogenic zone is discussed in more detail later.
5. Crustal and subcrustal properties
5.1. Crustal melts
The nature of the crust beneath the TVZ has been investigated using P-wave travel times and S-wave attenuation in an attempt to identify possible regions of extensive semi-molten or molten rock (Robinson et al., 1981). In contrast to other areas of high heat flow
Selected catalogue Sherburn 1883 Taupo EdQecumbe Matata events swarm J *warm
0 aftershocks sequence
1 I 1 1 ( 1 # 1 0 20 0 20 0 20 0 20 0 20
Number of Earthguakes
Fig. IO. Depth distribution of earthquakes for which depth determinations are regarded as well constrained. Columns are respectively: data from the catalogue of events recorded by the New Zealand National Seismometer Network for which reliable depths can be determined; swarm data recorded by Sherbum ( 1992a) ; 1983 west Taupo swarm, from Webb et al. ( 1986) ; the E!dgemmbe aftershock sequence from Robinson ( 1989) ; and the Matata swarm from Richardson ( 1989). The most reliable data are derived from local seismometer arrays centred over the earthquakes. The Matata swarm occurred outside the seismograph network and the depths shown may have been over estimated.

40 H. Sibby et al. /Journal of’ Volcunology and Geothermal Research 68 (1995) 29-58
N
0 25 50km
2030 50 loo 200300500 loo0 2ooo ResistMy R m
Fig. 1 I Apparent resistivity map of the TVZ. Measurements were made using the Schlumberger array, with electrode spacing (AB/2) of 500 m. Over I 1,000 measurements are included in the data set. Colour grading is based on logarithmic variation, with red tones showing apparent
resistivity values less than 20 L?m, gnding to dark blue tones for apparent resistivity values greater than 1000 L!m.

H. Bibby et al. /Journal of Volcanology and Geothermal Research 68 (1995) 29-58 41
(e.g., Yellowstone), no evidence for extensive melting was found, suggesting that temperatures are largely below the appropriate solidus for the profile chosen (south of Ohaaki). Robinson et al. ( 198 1) put an upper bound on the amount of melt present as 4%. It remains possible that for other parts of the TVZ the melt pro- portion is higher.
5.2. Attenuation
Mooney ( 1970)) using observations of the predom- inant frequency content of deep earthquakes, has sug- gested that the whole of the northwest North Island is underlain by a relatively attenuating region in the man- tle. Although the limits of the region are not well defined, Mooney suggests a mean depth of 100 km, and thickness of 50 km. The eastern boundary of the region is approximately aligned with the eastern margin of the TVZ.
tions of dissolved salts, which provide a conducting electrolyte within the highly porous rock matrix. For example, the addition of 3 g/l of NaCl to typical TVZ groundwater reduces its electrical resistivity from around 100 J2m to about 2 0m. The conductivity of these fluids is also strongly temperature dependent. At 200°C the resistivity is about 10% of that at ambient temperature (Quist and Marshall, 1968; Olhoeft, 1981). In addition, the rock matrix conductivity is important. During the passage of geothermal waters the volcanic rock matrix undergoes hydrothermal altera- tion. The products of the alteration processes are clay- and zeolite-rich and can be very conductive. Typical resistivities of altered volcanic rocks are in the range of 10-50 0m (Caldwell et al., 1986). All three factors tend to reduce the resistivity of geothermal regions relative to their surroundings.
In more recent work, Satake and Hashida (1989) inverted seismic intensity data from 26 earthquakes, to obtain a three-dimensional model for the attenuation structure beneath the North Island. Since their method takes no account of wave propagation effects (such as wave-guiding) their results do not define attenuation alone. However, the broad features of upper mantle attenuation agree with those of Mooney (1970). Although resolution is poor, for crustal depths (O-30 km), Satake and Hashida ( 1989) identified a region of high attenuation which includes both the TVZ and a large area to the northwest.
It is usual to associate highly attenuating upper man- tle with decompressional melting within an ascending mantle flow, which results in both low seismic velocity and high seismic attenuation (Hasegawa et al., in press). Thus, anomalously high temperatures may be expected to occur in the upper mantle beneath the TVZ.
The success of electrical surveys for delineating geo- thermal systems in the TVZ (e.g., Banwell and Mac- donald, 1965; Hatherton et al., 1966), has led to the accumulation of a large body of resistivity data. Although other electrical techniques have been tested (e.g., Lumb and Macdonald, 1970; Whiteford, 1975; Reeves and Ingham, 1991)) the majority of measure- ments have been made using the (imperfect) Schlum- berger array (spacing, AB/2 of 1000 m and 500 m) described by Bibby (1988). For an array spacing of 500 m these measured resistivities can be regarded as weighted averages of the resistivity within the top 300 m (600 m for the 1000 m array). Similar techniques have also been used in water-covered regions (Bennie et al., 1985; Caldwell and Bibby, 1992).
6. Shallow electrical studies
In total, about 24,000 individual resistivity measure- ments have been made within the TVZ. These are not confined to the geothermal systems themselves but extend between these areas to give a near uniform cov- erage of most of the TVZ. Some of these data have been previously published as part of the investigations of specific geothermal areas and in maps at a scale of 1:50,000 (Geophysics Division, 1985; Bibby et al., 1993).
Electrical resistivity techniques have proved to be A compilation of all the publicly available data meas- the most effective geophysical tool for the identifying ured with the 500-m Schlumberger array is shown in the near-surface extent of geothermal waters. This Fig. 11 using colour grading to indicate the resistivity effectiveness relies on a number of separate factors, all values. Coverage is continuous in regions where the of which combine to reduce the resistivity of a geo- density of data is sufficient to contour with confidence, thermal area relative to its surroundings. Geothermal but in areas where no data exist within a 3-km radius, waters are characterised by relatively high concentra- gaps have been left.

42
L
H. Bibby er 01. /Joumtrl of Volcanology and Ceothertnul Reseurch 68 (1995) 29-58
Fig. 12. Summary of the energy output (in MW) of the geothermal systems of the TVZ (see Fig. I 1). Energy output data is from the compilation
of Table 1. Two areas that are commonly included as independent geothermal systems have been included as part of other, larger systems.
Waikite geothermal springs are part of a greater geothermal field that includes Waiotapu thermal features (Bibby et al., in press). Calhaem
( 1973) observed high heat flows and what were believed to be thermal springs within the floor of Lake Rotoiti. These features fall within the
low resistivity region of the Tikitere geothermal field, and are regarded as part of this field. Arrows show inferred drainage of geothermal water.
6.1. Characteristics of the geothermal systems
Each of the low-resistivity zones (red and orange in Fig. 11) is linked to geothermal activity, past or pres- ent, with the exception of the two low resistivity areas near the northern coast which are caused by seawater intrusions. All the surface hydrothermal features either lie within these low resistivity zones (geothermal fields) or can be associated directly with them as near-
surface drainage from the geothermal fields. Thus, Fig. I1 shows the distribution of the geothermal fields within the TVZ. The names and heat outputs of these fields are summarised in Fig. 12.
For almost every geothermal field in the TVZ, abrupt changes in electrical resistivity are observed over a large part of the edge of the field. Examples of such changes (Kawerau and Rotorua geothermal fields) are shown in Fig. 13. In each case, closely spaced meas-
H. Bibby et al. /Journal of Volcanology and Geothermal Research 68 (1995) 29-58 43
.
(4
.
\ . 0 3km c *+a -
300
100
5 .s :_s 50 tj ‘G $ E 2 !x $
10
5
l .
X
IX l I I I
0 1 2 3
04 Distance, km
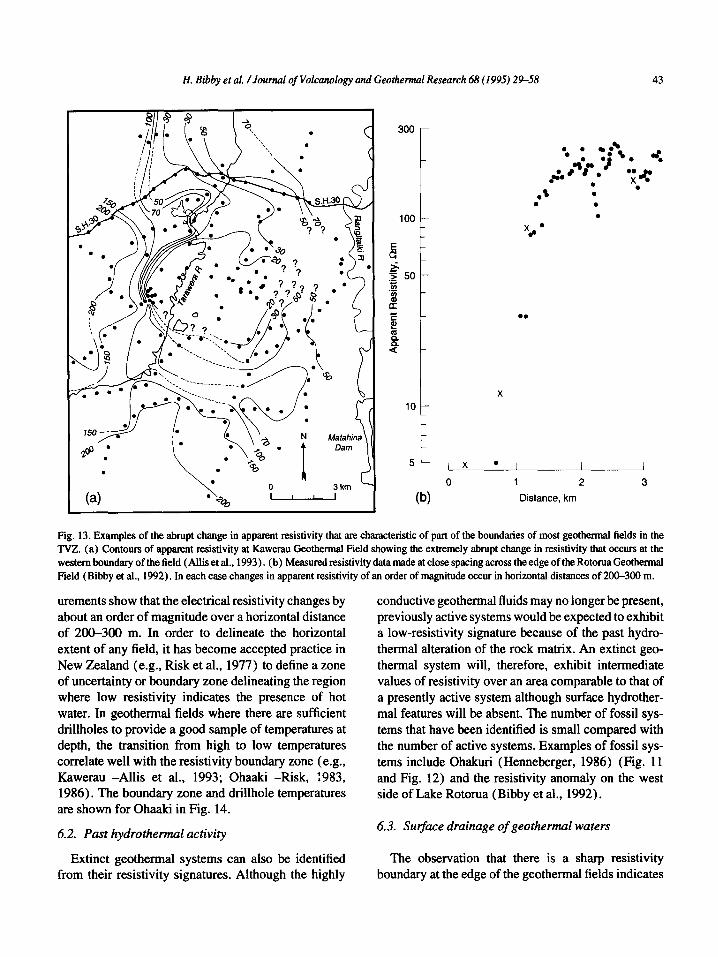
Fig. 13. Examples of the abrupt change in apparent resistivity that are characteristic of part of the boundaries of most geothermal fields in the TVZ. (a) Contours of apparent resistivity at Kawerau Geothermal Field showing the extremely abrupt change in resistivity that occurs at the western boundary of the field (Allis et al., 1993). (b) Measured resistivity data made at close spacing across the edge of the Rotorua Geothermal Field (Bibby et al., 1992). In each case changes in apparent resistivity of an order of magnitude occur in horizontal distances of 200-300 m.
urements show that the electrical resistivity changes by about an order of magnitude over a horizontal distance of 2OG300 m. In order to delineate the horizontal extent of any field, it has become accepted practice in New Zealand (e.g., Risk et al., 1977) to define a zone of uncertainty or boundary zone delineating the region where low resistivity indicates the presence of hot water. In geothermal fields where there are sufficient drillholes to provide a good sample of temperatures at depth, the transition from high to low temperatures correlate well with the resistivity boundary zone (e.g., Kawerau -Allis et al., 1993; Ohaaki -Risk, 1983, 1986). The boundary zone and drillhole temperatures are shown for Ohaaki in Fig. 14.
6.2. Past hydrothermal activity
Extinct geothermal systems can also be identified from their resistivity signatures. Although the highly
conductive geothermal fluids may no longer be present, previously active systems would be expected to exhibit a low-resistivity signature because of the past hydro- thermal alteration of the rock matrix. An extinct geo- thermal system will, therefore, exhibit intermediate values of resistivity over an area comparable to that of a presently active system although surface hydrother- mal features will be absent. The number of fossil sys- tems that have been identified is small compared with the number of active systems. Examples of fossil sys- tems include Ohakuri (Hennebcrger, 1986) (Fig. 11 and Fig. 12) and the resistivity anomaly on the west side of Lake Rotorua (Bibby et al., 1992).
6.3. Surface drainage of geothermal waters
The observation that there is a sharp resistivity boundary at the edge of the geothermal fields indicates

44 H. tlibby et (11. /Joumcrl of Volcatwlogy and Geothermal Research 68 (I 995) 29-58
,-\ \ i _=.; \ \
\
25” -e \ -z=
Fig. 14. Correlation of the boundaxy zone of Broadlands Geothermal Field, determined from tesistivity measurements (hatched zone), with
temperatures measured in drillholes in the geothermal field (after Risk, 1983). Temperature data are seldom available from outside the boundary
zone.
that the interface between hot and cold water is both
sharp and near-vertical. The hot geothermal waters
must rise from depth as a near-vertical plume. As this
plume approaches the surface, the geothermal waters become entrained in the local groundwater flows. In steep terrain, where the groundwater table may be many
metres below ground level, the surface discharge of geothermal water often occurs many kilometres from
the upflow area. Such flows of conductive geothermal waters will also be reflected in the electrical resistivity
pattern. Thus, where a geothermal area occurs on or near a major river, the lateral drainage paths of the
geothermal water will be short, and the low-resistivity
anomaly will mark the position of the upflow zone (Fig.
14). In contrast, the electrical resistivity pattern at
Mokai (Fig. 15) is more diffuse, reflecting both the upflow zone and the near-surface drainage. A tongue of low resistivity can be seen extending down the
hydraulic gradient towards the Waikato River, linking
the largest spring in the area to the inferred upflow zone, 5 km to the south (Bibby et al., I984). Subsurface
waters are believed to reach as far as the Waikato River.
Other examples of subsurface flows are outlined in Fig.
12.

H. Bibby et al. I Journal of Volcanology and Georhenml Research 68 (I 995) 29-58 45
Fig. 15. Schlumberger apparent resistivity map of the Mokai Geothermal Field ( ABR = 500 m) showing subsurface drainage of geothermal fluids. The contours of apparent resistivity show a tongue of low resistivity extending mnthwards, following the dire&on of surface drainage from the position where geothermal waters rise from depth (hatched boundary), towards the Waikato River. The cross-section shows the interpreted fluid flow.
46 H. Bibby et ul. /Journal of‘ Volcanology and Geothermal Research 68 (1995) 29-58
7. Deep electrical resistivity studies
7.1. The geothermal plume
An extensive series of deep resistivity studies, aimed
at defining the detailed structure of geothermal fields
(e.g., Risk et al., 1977, 1984) have been made using
the multiple-source bipoledipole method (Bibby, 1977, 1986; Bibby and Hohmann, 1993). These data
have been modelled to determine the shape of the hot-
cold water interface at depths to about 2 km (e.g., Bibby
and Risk, 1973; Bibby, 1978; Mulyadi and Caldwell,
1979). To a depth of about 500 m, this interface can
(a)
A . T \ \
LOWPERMEAE/L/7YZONE .__:__.__- j
\
? .
-.
(W
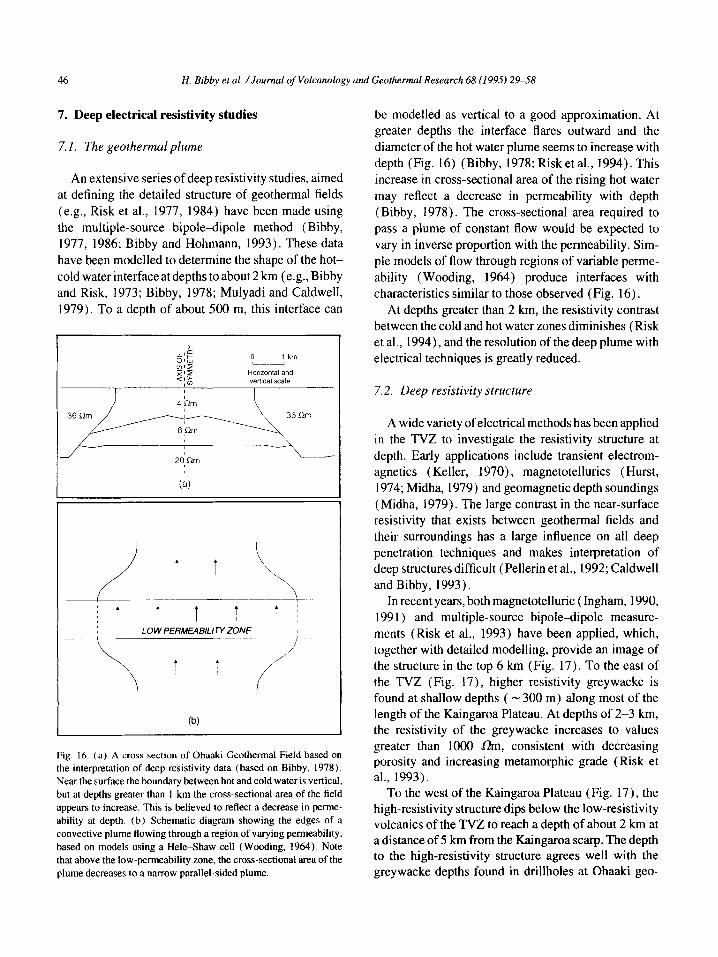
Fig. 16. (a) A cross section of Ohaaki Geothermal Field based on the interpretation of deep resistivity data (based on Bibby, 1978).
Near the surface the boundary between hot and cold water is vertical.
but at depths greater than I km the cross-sectional area of the field
appears to increase. This is believed to reflect a decrease in perme-
ability at depth. (b) Schematic diagram showing the edges of a
convective plume flowing through a region of varying permeability,
based on models using a HeleShaw cell (Wooding. 1964). Note
that above the low-permeability zone, the cross-sectional areaof the
plume decreases to a narrow parallel-sided plume.
be modelled as vertical to a good approximation. At greater depths the interface flares outward and the
diameter of the hot water plume seems to increase with depth (Fig. 16) (Bibby, 1978; Risk et al., 1994). This
increase in cross-sectional area of the rising hot water
may reflect a decrease in permeability with depth
(Bibby, 1978). The cross-sectional area required to
pass a plume of constant flow would be expected to
vary in inverse proportion with the permeability. Sim-
ple models of flow through regions of variable perme-
ability (Wooding, 1964) produce interfaces with
characteristics similar to those observed (Fig. 16).
At depths greater than 2 km, the resistivity contrast
between the cold and hot water zones diminishes (Risk et al., 1994). and the resolution of the deep plume with
electrical techniques is greatly reduced.
7.2. Deep resistivity structure
A wide variety of electrical methods has been applied
in the TVZ to investigate the resistivity structure at
depth. Early applications include transient electrom-
agnetics (Keller, 1970)) magnetotellurics (Hurst,
1974; Midha, 1979) and geomagnetic depth soundings
(Midha, 1979). The large contrast in the near-surface resistivity that exists between geothermal fields and
their surroundings has a large influence on all deep penetration techniques and makes interpretation of deep structures difficult (Pellerin et al., 1992; Caldwell
and Bibby, 1993). In recent years, both magnetotelluric (Ingham, 1990,
199 1) and multiple-source bipoledipole measure-
ments (Risk et al., 1993) have been applied, which, together with detailed modelling, provide an image of
the structure in the top 6 km (Fig. 17). To the east of the TVZ (Fig. 17), higher resistivity greywacke is
found at shallow depths ( - 300 m) along most of the length of the Kaingaroa Plateau. At depths of 2-3 km, the resistivity of the greywacke increases to values greater than 1000 LJm, consistent with decreasing porosity and increasing metamorphic grade (Risk et al., 1993).
To the west of the Kaingaroa Plateau (Fig. 17), the high-resistivity structure dips below the low-resistivity volcanics of the TVZ to reach a depth of about 2 km at a distance of 5 km from the Kaingaroa scarp. The depth to the high-resistivity structure agrees well with the greywacke depths found in drillholes at Ohaaki geo-

H. Bibby et al. /Journal of Volcanology and Geothermal Research 68 (1995) 29-58
W Taupo - Reporoa Basin Kaingaroa E Fault Zone 8 Kaingaroa Plateau E
20 I . . . . . . . . . . .._......__........_........._._....._............,._..,,,. shallow volcanics
deep volcanics
? ????
I300Rm ,, -1
diep gieywacke : ,’ ,:’ .. ,:.. - 8
,:’ -10 km
Fig. 17. Two dimensional resistivity model of the eastern margin of the TV2 based on the interpretation of large-scale bipoledipole resistivity data (from Risk et al., 1993). The high resistivity associated with greywacke to the east cannot be identified beneath the TVZ. Low resistivity extends to depths of the order of 5 km on the eastern side of the TVZ, possibly associated with widespread thermal alteration of the rocks at depth.
thermal field. Of more significance, however, is the fact that the high-resistivity structure cannot be traced fur- ther west. Instead, low resistivities ( ~20 L&n) exist down to depths of 5 km or more. Such resistivity values are not compatible with either greywacke basement rocks, or intrusive rocks in an unaltered state. A com- bination of elevated temperatures and hydrothemal alteration is necessary to account for these low resistiv- ities.
Further west, in the Taupo Fault Belt (Fig. 1) the resistivity again increases, reaching values of the order of 300 0m throughout the upper 3 km (Risk et al., in press) suggesting that the subsurface thermal condi- tions change in this area.
8. Heat flow
Heat transfer in the TVZ is dominated by large-scale convective processes which form the geothermal sys- tems. A variety of techniques have been applied to determining the natural heat output of the geothermal fields. Early assessments were based on summations of the heat output from individual thermal features by way of fluid flow and evaporation. Some of these assess- ments are unreliable. For example, reassessment in 1963 of evaporative heat loss at Waiotapu reduced the 1957 estimate of total heat output by 400 MW (DSIR, 1957,1963). Very few detailed assessments of thermal losses have been made since Allis ( 1980a) assessed
changes in the heat flow at Wairakei due to exploitation. The use of chloride fluxes to estimate geothermal
heat output (Ellis and Wilson, 1955) is now widely used in New Zealand (e.g., Nairn and Findlayson, 1981; Bibby et al., 1984; Glover, 1992). This method is based on the principle of conservation of chloride ions within geothermal flows. The rate of chloride added to the rivers draining any geothermal fluid (above the background level) represents a measure of the total chloride flowing from depth within the upflow zone of the geothermal field. Hence if the enthalpy:chloride ratio is known for the deep geother- mal waters, the chloride flux can be used to estimate the rate of energy transport from depth. Such a heat- flow estimate assumes that all the chloride in the upflowing geothermal waters are discharged into the surface drainage system. The uncertainty in the chlo- ride-flux method results from difficulties in obtaining accurate enthalpy:chloride ratios of the source fluid. Where down hole samples are available, estimates can be made of temperature and chemistry of the source fluid. Although enthalpy:chloride ratios appear to be constant within most geothermal fields, large differ- ences occur between fields. In the TVZ, estimates of enthalpy:chloride ratios range from 0.45 MJ/g at Tokaanu (based on Robinson and Sheppard, 1986) to 2.7 MJ/g at Rotokawa (Krupp et al., 1986). The only field where variations have been identified is Ohaaki, where ratios are 1.4 and 1.1 MJ/g, for the east and west sectors, respectively (Hedenquist, 1983).

48
Table I
H. Bibby et al. /Journal of Volcanology and Geothermal Research 68 (1995) 29-58
Estimates of the areas and total heat output (pre exploitation) from the geothermal fields of the TVZ. Heat flows based on chloride fluxes have
been calculated for enthalpy to chloride ratio of 0.8 & 0.2 MJ/g
Name Area
(km’)
Source of area data Heat output
(MW)
Source of heat flow data
Tokaanu/Waihi
Motuoapa
Lake Taupo
Total lake input
20+5
8
30*6
Tauhara 25 * 8
Wairakei 2554
Rotokawa 18+4
Ohaaki 12-16
Ngatamariki
Orakeikorako
7-l I
9-14
Te Kopia I I-15
Reporoa
Waiotapu
Waikite
12-15
18-24 _
Atiamuri 8*2 Horohoro Springs 4*3
Mokai/Ongaroto 14*4
Mangakino 8*4
Total Waikato River
Rotorua and 23+3
Lake Rotorua 812 Tikitere 15f5
Taheke 2-4
Waimungu 20-26
Rotoma 2055
Kawerau 18-36
Bromley and Mongillo ( 199 1) 42
Caldwell, pers. commun., 1994. 80
Bibbyet al. (1991) 0.3
Caldwell and Bibby ( 1992) 120
425+ 175
Grange (1955). Calhaem (1973)
(quoted without source)
Fisher (1957)
Calhaem (1973)
Chloride flux from Timperley and Vigor-Brown
(1985)
DSIR (1988) 110 Fisher ( 1965)
Risk et al. (1984) 420 Allis (1980a). Fisher ( 1964)
Geophysics Division ( 1985) 219 Gregg ( 1958)
Risk, pers. commun.. 1994 (600) Fisher and Dickinson ( 1960)
Estimated total 300
Risk et al. ( 1977) (97) Gregg ( 1958)
80 NZGS (1974)
(85-190) MWD (1977)
Bennie ( 1983) 38 Bennie (1983)
(53) Gregg (1958)
Geophysics Division ( 1985) 340 Lloyd (1972)
(660) Chloride flux, using Sheppard and Lyon (1984)
‘parent’water.
Geophysics Division ( 1985) (125) Healy in Grange ( 1955)
150 Quoted without source in Allis (1980b)
(250) Quoted without source in Calhaem ( 1973)
Geophysics Division ( 1985) <6.3> IS Bibby et al. (1994)
Bibby et al. (1994)
Bibby et al. (1994) 540 Benseman et al. ( 1963)
Part of Waiotapu (Bibby et al., 70 NZGS ( 1974)
in press)
(50) Glover et al. (1992)
Dawson et al. ( 198 I ) 10 Allis ( 1987)
Bibby et al. ( 1993) 4 Allis (1987)
Bibby et al. (1984) 400+ 160 Bibby et al. ( 1984)
(80+ IO) (into Waipapa alone)
Resistivity files 4 Unpublished estimates
2800+700 Anomalous Cl flux in Wakato (less Wairakei dram)
Bibby et al. (1992) 470 f 50 Glover ( 1992)
Bibby et al. (1992)
Macdonald ( 1974) 120 Dickinson (1972) without lake
(140) Calhaem (1973) -lake floor estimate (part of
Tikitere geothermal field) Estimated total 190
Macdonald (1974) 13 Macdonald ( 1974)
Bibby et al. ( 1994) 325 f 80 Chloride flux from Naim and Findlayson ( 198 1)
Based on Bromley et al. ( 1988) 220 f 60 Chloride flux from Naim and Findlayson ( 198 1)
Allis et al. ( 1993 ) (84) HeaJy in Grange (1955)
(210) (Onepu only) Calhaem ( 1973) -no source
100 Quoted without source in Allis (198Ob)
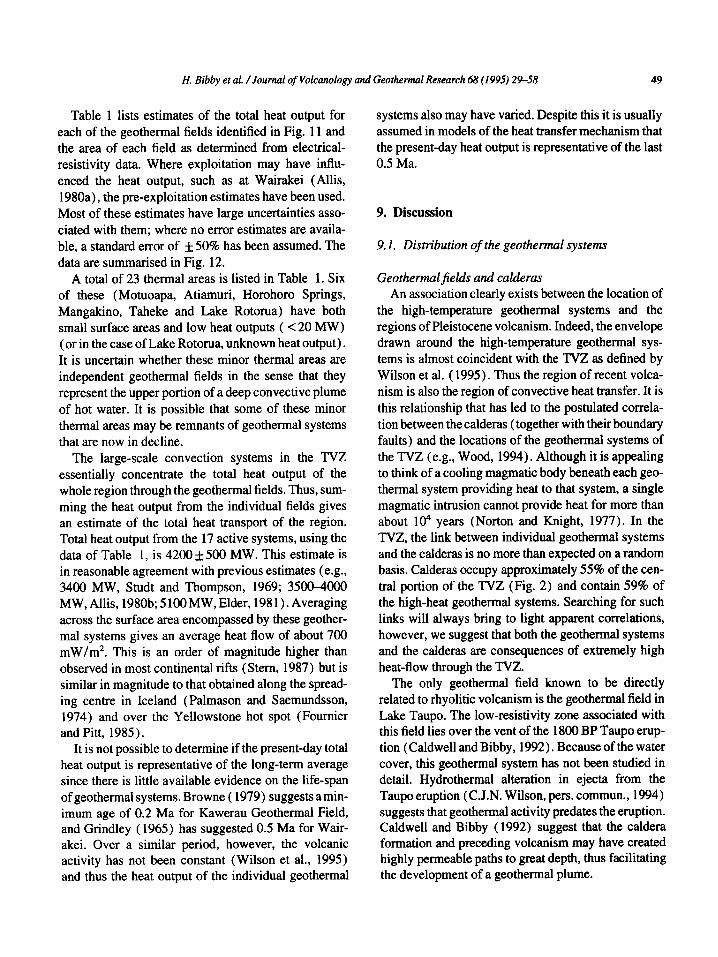
H. Bibby et al. /Journal of Volcanology and Geothermal Research 68 (1995) 29-58 49
Table 1 lists estimates of the total heat output for each of the geothermal fields identified in Fig. 11 and the area of each field as determined from electrical- resistivity data. Where exploitation may have influ- enced the heat output, such as at Wairakei (Allis, 1980a), the pre-exploitation estimates have been used. Most of these estimates have large uncertainties asso- ciated with them; where no error estimates are availa- ble, a standard error of f 50% has been assumed. The data are summarised in Fig. 12.
A total of 23 thermal areas is listed in Table 1. Six of these (Motuoapa, Atiamuri, Horohoro Springs, Mangakino, Taheke and Lake Rotorua) have both small surface areas and low heat outputs ( < 20 MW) (or in the case of Lake Rotorua, unknown heat output). It is uncertain whether these minor thermal areas are independent geothermal fields in the sense that they represent the upper portion of a deep convective plume of hot water. It is possible that some of these minor thermal areas may be remnants of geothermal systems that are now in decline.
The large-scale convection systems in the TVZ essentially concentrate the total heat output of the whole region through the geothermal fields. Thus, sum- ming the heat output from the individual fields gives an estimate of the total heat transport of the region. Total heat output from the 17 active systems, using the data of Table 1, is 4200 + 500 MW. This estimate is in reasonable agreement with previous estimates (e.g., 3400 MW, Studt and Thompson, 1969; 3500-4000 MW, Allis, 1980b; 5 lOOMW, Elder, 1981). Averaging across the surface area encompassed by these geother- mal systems gives an average heat flow of about 700 mW/m2. This is an order of magnitude higher than observed in most continental rifts (Stem, 1987) but is similar in magnitude to that obtained along the spread- ing centre in Iceland (Palmason and Saemundsson, 1974) and over the Yellowstone hot spot (Fournier and Pitt, 1985).
It is not possible to determine if the present-day total heat output is representative of the long-term average since there is little available evidence on the life-span of geothermal systems. Browne ( 1979) suggests amin- imum age of 0.2 Ma for Kawerau Geothermal Field, and Grindley ( 1965) has suggested 0.5 Ma for Wair- akei. Over a similar period, however, the volcanic activity has not been constant (Wilson et al., 1995) and thus the heat output of the individual geothermal
systems also may have varied. Despite this it is usually assumed in models of the heat transfer mechanism that the present-day heat output is representative of the last 0.5 Ma.
9. Discussion
9.1. Distribution of the geothermal systems
Geothermaljelds and calderas An association clearly exists between the location of
the high-temperature geothermal systems and the regions of Pleistocene volcanism. Indeed, the envelope drawn around the high-temperature geothermal sys- tems is almost coincident with the TVZ as defined by Wilson et al. ( 1995). Thus the region of recent volca- nism is also the region of convective heat transfer. It is this relationship that has led to the postulated correla- tion between the calderas (together with their boundary faults) and the locations of the geothermal systems of the TVZ (e.g., Wood, 1994). Although it is appealing to think of a cooling magmatic body beneath each geo- thermal system providing heat to that system, a single magmatic intrusion cannot provide heat for more than about lo4 years (Norton and Knight, 1977). In the TVZ, the link between individual geothermal systems and the calderas is no more than expected on a random basis. Calderas occupy approximately 55% of the cen- tral portion of the TVZ (Fig. 2) and contain 59% of the high-heat geothermal systems. Searching for such links will always bring to light apparent correlations, however, we suggest that both the geothermal systems and the calderas are consequences of extremely high heat-flow through the TVZ.
The only geothermal field known to be directly related to rhyolitic volcanism is the geothermal field in Lake Taupo. The low-resistivity zone associated with this field lies over the vent of the 1800 BP Taupo erup- tion (Caldwell and Bibby, 1992). Because of the water cover, this geothermal system has not been studied in detail. Hydrothermal alteration in ejecta from the Taupo eruption (C.J.N. Wilson, pers. commun., 1994) suggests that geothermal activity predates the eruption. Caldwell and Bibby ( 1992) suggest that the caldera formation and preceding volcanism may have created highly permeable paths to great depth, thus facilitating the development of a geothermal plume.
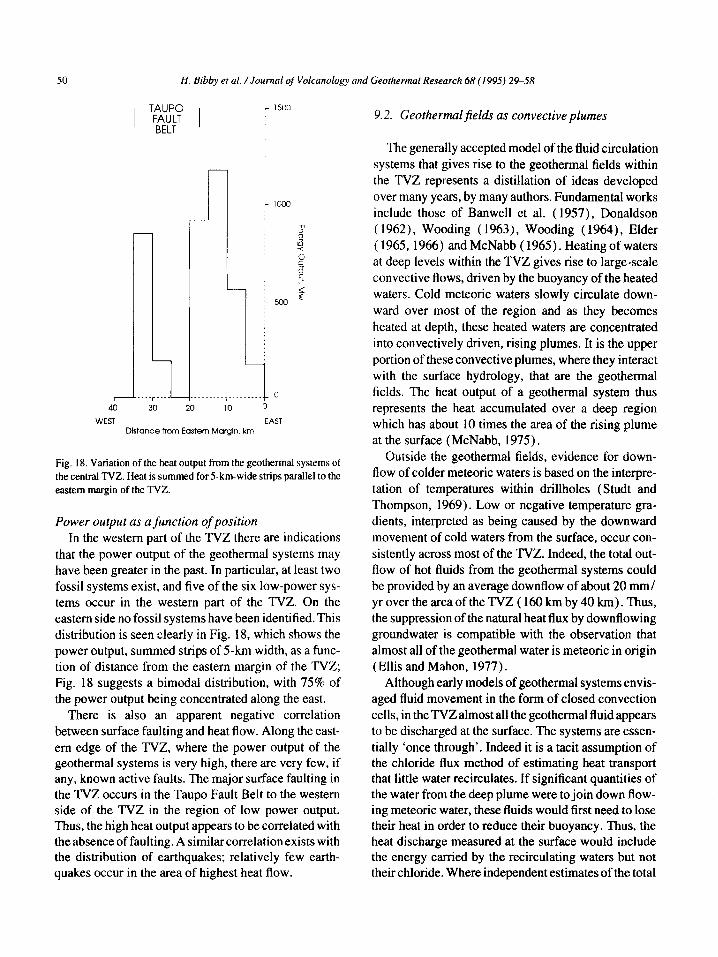
50 H. Bibby er ~1. /Journal of Volcanology and Geothermal Research 68 (I 995) 29-58
TAUPO FAULT BELT
T
40 ,-~--~----~ O 10
WEST EASl -. Ustance from Eastern Margin. km
I
i
Fig. 18. Variation of the heat output from the geothermal systems of the central TVZ. Heat is summed for Skm-wide strips parallel to the eastern margin of the TVZ.
Power output as a function of position In the western part of the TVZ there are indications
that the power output of the geothermal systems may have been greater in the past. In particular, at least two
fossil systems exist, and five of the six low-power sys- tems occur in the western part of the TVZ. On the eastern side no fossil systems have been identified. This
distribution is seen clearly in Fig. 18, which shows the
power output, summed strips of 5km width, as a func- tion of distance from the eastern margin of the TVZ;
Fig. 18 suggests a bimodal distribution, with 75% of
the power output being concentrated along the east. There is also an apparent negative correlation
between surface faulting and heat flow. Along the east-
em edge of the TVZ, where the power output of the geothermal systems is very high, there are very few, if any, known active faults. The major surface faulting in the TVZ occurs in the Taupo Fault Belt to the western side of the TVZ in the region of low power output. Thus, the high heat output appears to be correlated with the absence of faulting. A similar correlation exists with the distribution of earthquakes; relatively few earth- quakes occur in the area of highest heat flow.
9.2. Geothermal fields as convective plumes
The generally accepted model of the fluid circulation systems that gives rise to the geothermal fields within
the TVZ represents a distillation of ideas developed
over many years, by many authors. Fundamental works
include those of Banwell et al. (1957), Donaldson
( 1962), Wooding ( 1963), Wooding ( 1964), Elder
( 1965,1966) and McNabb ( 1965). Heating of waters at deep levels within the TVZ gives rise to large-scale
convective flows, driven by the buoyancy of the heated
waters. Cold meteoric waters slowly circulate down-
ward over most of the region and as they becomes
heated at depth, these heated waters are concentrated
into convectively driven, rising plumes. It is the upper
portion of these convective plumes, where they interact
with the surface hydrology, that are the geothermal fields. The heat output of a geothermal system thus
represents the heat accumulated over a deep region
which has about 10 times the area of the rising plume at the surface (McNabb, 1975).
Outside the geothermal fields, evidence for down- flow of colder meteoric waters is based on the interpre-
tation of temperatures within drillholes (Studt and
Thompson, 1969). Low or negative temperature gra- dients, interpreted as being caused by the downward
movement of cold waters from the surface, occur con-
sistently across most of the TVZ. Indeed, the total out- flow of hot fluids from the geothermal systems could
be provided by an average downflow of about 20 mm/ yr over the area of the TVZ ( 160 km by 40 km). Thus, the suppression of the natural heat flux by downflowing
groundwater is compatible with the observation that almost all of the geothermal water is meteoric in origin (Ellis and Mahon, 1977).
Although early models of geothermal systems envis- aged fluid movement in the form of closed convection
cells, in the TVZ almost all the geothermal fluid appears to be discharged at the surface. The systems are essen-
tially ‘once through’. Indeed it is a tacit assumption of the chloride flux method of estimating heat transport that little water recirculates. If significant quantities of the water from the deep plume were to join down flow- ing meteoric water, these fluids would first need to lose their heat in order to reduce their buoyancy. Thus, the heat discharge measured at the surface would include the energy carried by the recirculating waters but not their chloride. Where independent estimates of the total

H. Bibby er al. / Joumul of Volcanology and Geothermal Research 68 (1995) 29-58 51
heat flow have been made using both direct measure- ment and chloride flux methods, the assessments have been found to agree within their error bounds. At Wair- akei, for example, Ellis and Wilson ( 1955) calculated a total heat input (excluding the bore output) of 385 MW from the increase in chloride flux in the Waikato River as it passes Wairakei and Tauhara geothermal fields. The direct measurement of total natural heat output of Wairakei and Tauhara at the time was about 420 MW (Allis, 1980a), and the drainage from the Tauhara area to the Waikato River a further 40 MW. Thus, the mismatch between the two estimates is about 16% which is within the error bounds of either method, indicating the geothermal flow is ‘once through’.
at adepth of about 2.5 km. This step in seismic velocity appears to be related to a change in density (porosity) and, therefore, in permeability (Stem, 1979). In labo- ratory models, the cross-sectional area of a convection plume in a region of varying permeability has been shown by Wooding ( 1964) to decrease in regions of high permeability, where a narrowing of the plume occurs (Fig. 16).
9.3. Depth of convective system
The nature of the plume near the surface is seen in the resistivity measurements, which show a well defined, near-vertical interface between the hot geo- thermal waters and the cold surrounding groundwaters. Furthermore, this interface appears to have been main- tained over the lifetime of the geothermal systems. Sev- eral mechanisms have been put forward to explain the sharpness of this interface, including the possibility of a physical barrier produced by the precipitation of silica (Facca and Tom&, 1967; Grindley and Browne, 1975). However, it is not necessary to have a physical barrier to maintain a region of large horizontal temper- ature gradient. The detailed study of a convective hydrothermal plume (Wooding, 1963) shows that the upflowing plume of buoyant geothermal fluids is sur- rounded by a narrow boundary-layer region in which the colder fluids surrounding the plume are slowly entrained into the edges of the plume. Thus, the ten- dency of a confined column of hot water to cool by conduction of heat at the edges is counteracted by the advection of surrounding fluids into the column. The dilution of the geothermal fluids at the edge of the plume is such that the conditions required for precipi- tation of silica in the boundary zone are unlikely to be met. The sharp boundaries of the geothermal system are, in fact, maintained by the dynamics of the con- vecting geothermal plume.
Both mathematical and laboratory modelling have been used to investigate the large-scale geothermal con- vection systems (see, for example, Garg and Kassoy, 198 1). McNabb ( 1975) has argued that the near-uni- form distribution of geothermal systems observed in the TVZ is similar to the circulation pattern that would be produced by the heating of a uniform porous medium from below. The aspect ratio of convection cells in a homogeneous porous medium is near unity (Robinson, 1975). Hence, the mean spacing between the geothermal fields in the TVZ of between 10 and 15 km, suggests fluids circulate to depths of 5-8 km. This model of heat transport makes no assumption about the nature of the heat source. In particular, the existence of such a convective system does not require a one-to-one relationship between the surface geothermal fields and specific sources of heat beneath them. Thus, the geo- thermal fields are each just part of the large-scale con- vection system which occupies the entire region. However, some conceptual models (e.g. Henley and Ellis, 1983) still imply that a plutonic body is sited directly beneath each geothermal field to provide its heat. Although some plutonic intrusions certainly occur, convection will distribute any increase in heat throughout the whole convective system. Once estab- lished, deep circulating flow can concentrate heat from a wide area. Thus, replenishment of the heat source by intrusion or other mechanism may take place over a wide region, without necessarily disrupting the estab- lished plumes.
At depths greater than 1 km, deep resistivity studies Because of the temperature dependence of the rhe- suggest the interface between hot and cold water flares ological properties of the crustal rocks (Sibson, 1982)) outwards with increasing depth. The suggestion that an indication of the depth at which the heat transfer this increase in diameter of the hot column results from process changes from convection to conduction can be decrease in permeability (Bibby, 1978) gains support obtained from the thickness of the seismogenic layer. from the seismic refraction results. A large step occurs Within the convective regime, the circulation of mete- in the seismic velocity (3.2 km/s to 5.5 km/s, Fig. 4) oric water will control the temperature. Drillholes have
52 H. Bibby e! al. /Journal of Volcanology and Geothermal Research 68 (199.5) 29-58
encountered temperatures greater than 300°C within
2.5 km of the surface in some of the geothermal systems
of the TVZ. However, within the region in which con-
vection is occurring, temperatures are controlled by that
convecting system. Hence, temperatures deep in the
plume cannot increase rapidly with depth. Down-flow-
ing cold waters between the geothermal plumes will
similarly maintain the temperatures of the downflow to
be less than or equal to those in the plume. At the base of the convection system conductive heat
transfer predominates. To conductively transport the
average heat flux of 700 mW/m* through rock with
thermal conductivity of 2-3 W/m”C requires a tem-
perature gradient of 200 to 3OO”C/km. Consequently,
at the base of the convective system the temperature increases rapidly with depth. The ability of rocks to
undergo brittle fracture is dependent on strain rate, tem- perature and the rock type present (Sibson, 1982; Hill,
1992). With such large temperature gradients within
the conduction zone, the ability of the rocks to sustain shear stress rapidly diminishes with depth. Within 1 km of the base of the convection flow, temperatures
will be greater than 550°C, and brittle fracture will have
ceased. In the overlying convection region, however,
temperatures are buffered to lower values by the cir-
culating fluids, and shear failure is possible. Conse-
quently, the base of the seismogenic zone will mark the depth of the transition between heat transfer by con- vection and conduction. A consequence of this model
is that pore pressures must remain hydrostatic to the depth of this transition.
The data are not well distributed throughout the
TVZ. The distribution of swarm activity (Fig. 7) tends to be concentrated in the western portion of the TVZ,
close to the Taupo Fault Belt (Grindley, 1960). Hence,
it is not possible to determine whether the cut-off depth varies across the area. A microearthquake study by
Evison et al. ( 1976) found very low levels of seismic activity to the east of the Taupo Fault Belt, which led them to suggest that this may reflect a reduction in shear strength in this zone caused by high temperatures. This tower seismic activity in the east may instead indicate a shallowing of the depth to the conductive heat transfer zone from west to east across the TVZ.
The role of convective circulation in moderating temperatures at depth, and hence on the interpretation of the brittleauctile transition has been overlooked in the analysis of other regions where convection plays a
role. Hill (1992) interpreted the base of the seismo-
genie zone at beneath Long Valley (depths of 5 to 9
km) as indicating temperatures in the range 25O”C-
350°C. At Yellowstone, Smith and Braile (1994) sim-
ilarly associate the base of the seismogenic zone with
the 350°C isotherm. Both these regions contain geo-
thermal systems similar to the TVZ, and we would
expect that large-scale convection must also occur. We
suggest that, in both instances, the bottom of the seis- mogenic zone should be identified with the transition
from convective to conductive heat transfer.
9.4. Stability of the hydrothermal systems
The resistivity data suggest that, once established,
the positions of the geothermal fields, and hence the deep plumes, have not changed significantly over time.
In particular the large areas of high resistivity between
the geothermal fields indicate that these areas have never undergone hydrothermal alteration and have
never hosted geothermal fields. Thus, although the amount of heat output may have waxed and waned in
the past, the geothermal systems have remained fixed
in position, once established. This stability does not
support a simple one-to-one relationship between intru-
sive heat sources and geothermal fields. Thus the indi-
vidual geothermal field should be regarded as parts of
the large-scale fluid-circulation system.
This large-scale convection system provides a sta-
bility to the geothermal fields, which, as a consequence,
are insensitive to disruption by volcanic processes. In
1886, Waimangu geothermal field underwent massive
changes in surface structure, brought about by the vol- canic eruption at Tarawera (Simmons et al., 1993).
Perturbations to the surface discharge features are still
evident today. Despite almost total destruction of the
surface features the deeper geothermal plume appears
to have been little influenced (Bibby et al., 1994). In the eruptive history of the TVZ, the Tarawera eruption was a minor event. Clearly, the large-scale caldera- forming events that dominate the eruptive history of the TVZ are of much larger magnitude than Tarawera, and are more likely to have influenced the geothermal fields. However, Wairakei (at least) has survived through massive rhyolitic eruptions in near proximity, including those that occurred from the Taupo Caldera in the last 23,000 years.

H. Bibby et al. /Journal of Volcanology and Geothermal Research 68 (1995) 29-58 53
9.5. Beneath the convective systems
Very little is known about the region below the con- vective cells and no single model of the deeper proc- esses has found general agreement (Hochstein, 1995). At a depth of 15 km, seismic refraction has identified a layer interpreted to be the base of the crust (and the thermal lithosphere). Typical temperatures at this level could be up to 13OO“C. Thus, between the base of the fluid convective system at about 8 km, where the tem- perature is about 35O”C, and 15 km the maximum tem- perature difference is 950°C. Assuming thermal conductivity of 2-3 W/m”C, the maximum conductive heat flux across this region is about 400 mW/m’, which is significantly less than the measured average heat flux of 700 mW/m2. Thus, the temperature gradient cannot be sufficiently great to achieve the required conductive heat flux. Below the levels of the penetration of the convective cells the heat must be transferred more effi- ciently than can be achieved by conduction alone. A possible mechanism for the additional heat flux is repeated intrusion of material into the lower crust. This has been suggested by Evison et al. ( 1976) and quan- titatively analysed by Stern ( 1987). To explain the heat flux, such intrusions must come to within 12 km of the surface, but are more likely to reach much higher levels. It is possible that these intrusions may even penetrate into the lower portions of the convecting system, where they would locally modify the tlow and the chemistry of the convecting fluids, without necessarily modifying the positions of the geothermal fields at the surface.
10. Conclusion
The conceptual model of heat flow in the TVZ as a series of convective hydrothermal plumes is consistent with the geophysical evidence available. The pattern of low-resistivity anomalies provides a picture of the near- surface distribution of hot water and of the upper parts of these plumes. Between the geothermal plumes where relatively low temperatures occur, downward flows of cold water provide the necessary recharge. This occurs over most of the area of the TVZ and is an essential part of the large-scale convection system. The depth at which the seismicity appears to cut off indicates that a convective or hydrothermal regime with a near-hydro- static pressure profile occupies the upper 8 km of the
crust of the TVZ. In the aseismic zone below this we infer that temperatures are too great to support brittle fracture. This model also implies that the pressure- depth profile below the seismogenic zone will be lith- ostatic, and thus hydrothermal convection will be impossible.
The mechanism by which heat enters the hydrother- mal regime is the most poorly known aspect of heat transfer in the TVZ. If the 15-km interface identified from seismic-reflection and refraction work of Stem and Davey ( 1985) does indeed represent the base of the crust, then the temperature at this level could be as great as 1350°C. Conductive heat transport between this level and the bottom of the convective regime, starting at about 8 km, can supply at most 60% of the observed heat flux at the surface. Thus, non-conductive mechanisms by which heat is released into the convec- tive regime must be invoked. Possibilities include dyke intrusion associated with the overall extension of the TVZ, or the emplacement of plutonic bodies in contact or near contact with the convecting water. Repeated intrusion is required to maintain the heat flow.
Large magma chambers have been postulated to exist beneath the TVZ in order to supply material for the huge ignimbrite eruptions that have occurred. There is uncertainty as to the depth at which such large mag- matic bodies accumulate. If, as we argued above, the hydrothermal system extends to at least 8 km we would expect the large magma chambers to lie below this depth. If this is the case then the magma chambers will form part of the aseismic zone and may be identified by studies of the propagation of the seismic waves through this zone.
A direct relationship between the location of geo- thermal systems and possible sources of heat, such as magma bodies at depth, has often been suggested. Over the last 0.5 m.y. there has been widespread volcanic activity with evidence of both extrusive and intrusive volcanism. If a geothermal system existed over each intrusive magmatic body, it would follow that geother- mal systems would be widespread over the T’VZ. The small number of fossil systems that have been observed and the long life span of the active geothermal systems suggest that the T’VZ geothermal systems are essen- tially stable on a time scale of the order of 200,000 years. A single intrusive event would be an order of magnitude too small to supply the total energy dis- charged by a typical TVZ geothermal system.
54 H. Bibby et al. /Journal of‘ Vukanofogy and Georhermal Research 68 (1995) 29-58
Although the geophysical data available to date pro- vide a framework for the model of the geothermal proc-
esses, and constraints on the deep heat sources, there
remain many uncertainties.
Acknowledgements
Many people have contributed to the development
of the ideas and concepts that are presented in this
paper, and the authors acknowledge this considerable
contribution, particularly from the scientists of the for- mer DSIR. Helpful comments on early versions of the
manuscript were made by George Risk, Tim Stern,
Stuart Simmons and Pat Muffler.
This paper is IGNS contribution number 465.
References
Allis, R.G., 1980a. Changes in heat Row associated withexploitation of Wairakei geothermal field, New Zealand. N.Z. J. Geol. Geo- phys., 24: l-19.
Allis, R.G., 1980b. Heat Flow. In: M.P. Hochstein and T.M. Hunt (Editors), Guide to geophysics of the volcanic and geothermal areas of the North Island, New Zealand. N.Z. R. Sot., Misc. Ser., 3: 4749.
Allis, R.G., 1987. Geophysics and geochemical investigations of the Horohoro geothermal prospect. Geophys. Div., DSIR, Welling- ton, Rep. 2 13.78 pp.
Allis, R.G., Christenson, B.W., Nairn, LA., Risk, G.F. and White. S.P., 1993. The natural state of Kawerau geothermal field. Proc. 15th New Zealand Geothermal Workshop, University of Auck- land, pp. 227-233.
Anderson, H. and Webb, T.H., 1989. The rupture process of the I987 Edgecumbe earthquake, New Zealand. N.Z. J. Geol. Geophys.. 32: 43-52.
Anderson, H.. Smith, E. and Robinson. R., 1990. Normal faulting in a back arc basin: Seismological characteristics of the March 2, 1987, Edgecumbe, New Zealand, earthquake. J. Geophys. Res., 95: 47094723.
Bannister, S., 1992. Seismic exploration in geotherma! areas -ffect of the surface layer. Proc. 14th New Zealand Geothermal Work- shop, University of Auckland, pp. 23 l-236.
Banwell, C.J. and Macdonald, W.J.P., 1965. Resistivity surveying in New Zealand. Proc. 8th Commonwealth Mining and Metal- lurgical Congress, Australia and New Zealand, 213: 1-8.
Banwell, C.J., Cooper, R.E., Thompson, G.E.K. and McCree, K.J., 1957. Physics of the New Zealand thermal area. DSIR, Welling- ton, Bull. 123, 109 pp.
Beanland, S.. Blick, G.H. and Darby, D.J., 1990. Normal faulting in a back arc basin: Geological and geodetic characteristics of the 1987 Edgecumbe earthquake, New Zealand. J. Geophys. Res., 95: 4693-4701.
Bennie. S.L., 1983. Geophysical investigations of the Ngatamariki geothermal area. Geophys. Div., DSIR, Wellington, Rep. 192,
35 PP. Bennie, S.L., Stagpoole, V.M. and Bibby, H.M., 1985. Waterborne
resistivity measurements in the Rotorua Lakes area of New Zea- land. Geophys. Div., DSIR, Wellington, Rep. 206.45 pp.
Benseman, R.F., Fisher, R.G. and Dickinson D.J., 1963. Survey of surface heat output at Waiotapu. In: Waiotapu geothermal field. DSIR, Wellington, Bull. 155, 142 pp.
Bibby, H.M., 1977. The apparent resistivity tensor. Geophysics, 42: 1258-1261.
Bibby, H.M., 1978. Direct current resistivity modeling for axially symmetric bodies using the finite element method. Geophysics, 43: 550-562.
Bibby, H.M., 1986. Analysis of multiple-source bipoledipole resis- tivity surveys using the apparent resistivity tensor. Geophysics, 5 1: 972-983.
Bibby, H.M., 1988. Electrical resistivity mapping in the Central Volcanic Region of New Zealand. N.Z. J. Geol. Geophys., 31: 259-214.
Bibby H.M. and Hohmann, G.W., 1993. Three dimensional inter- pretation of multiple-source bipole-dipole resistivity data using the apparent resistivity tensor. Geophys. Prospect., 41: 697-723.
Bibby, H.M. and Risk, G.F., 1973. Interpretation of bipole-bipole resistivity surveys using a hemispheroid model. Geophysics, 38: 719-736.
Bibby, H.M., Dawson, G.B., Rayner, H.H., Stagpoole, V.M. and Graham, D.J., 1984. The structure of Mokai geothermal field based on geophysical observations. J. Volcanol. Geotherm. Res., 20: I-20.
Bibby, H.M., Risk, G.F., and Macdonald, W.J.P., 1991. Resistivity survey of Motuoapa Springs, New Zealand. Proc. 13th Geother- mal Workshop, University of Auckland, pp. 39-44.
Bibby, H.M., Dawson, G.B., Rayner, H.H., Bennie, S.L. and Brom- ley, C.J., 1992. Electrical resistivity and magnetic investigations of the geothermal systems in the Rotorua area, New Zealand. Geothermics, 2 1: 43-64.
Bibby. H.M., Bennie, S.L., Graham, D.J. and Rayner, H.H., 1993. Electrical resistivity map of New Zealand: 150 000, Sheet V16 -Rotorua. Institute of Geological and Nuclear Sciences, Geo- phys. Map 1.
Bibby, H.M., Stagpoole, V.M. Bennie, S.L. and Caldwell, T.G., 1994. Resistivity structure of the Waimangu, Waiotapu, Waikite and Reporoa geothermal areas, New Zealand. Geothermics, 23: 445472.
Bromley, C.J., Bottomley. J.J. and Pearson, C.F., 1988. Geophysical exploration for prospective geothermal resources in the Tarawera Forest. Proc. 10th New Zealand Geothermal Workshop 1988, University of Auckland, pp. 123-128.
Bromley, C.J. and Mongillo, M.A., 1991. Infrared video survey of Tokaanu-Waihi geothermal field. Proc. 13th New Zealand Geo- thermal Workshop 199 1, University of Auckland, pp. 27-32.
Browne, P.R.L., 1979. Minimum age of the Kawerau Geothermal Field, North Island, New Zealand. J. Volcanol. Geotherm. Res., 6: 213-215.
Browne P.R.L., Graham, I.J., Parker, R.J., and Wood, C.P.. 1992. Subsurface andesite lavas and plutonic rocks in tbe Rotokawa

H. Bibby et al. /Journal of Volcanology and Geothermal Research 68 (1995) 29-58 55
and Ngatamariki geothermal systems, Taupo Volcanic Zone, New Zealand. J. Volcanol. Geotherm. Res., 51: 199-215.
Caldwell, T.G. and Bibby, H.M., 1992. Geothermal implications of resistivity mapping on Lake Taupo. Proc. 14th New Zealand Geothermal Workshop 1992, University of Auckland, pp. 207- 212.
Caldwell, T.G. and Bibby, H.M., 1993. A comparison of electro- magnetic methods with the dc resistivity multiple-source bipole dipole method for deep geothermal exploration. Proc. 15th New Zealand Geothermal Workshop 1993, University of Auckland, pp. 187-194.
Elder, J.W., 1965. Physical processes in geothermal areas. In: W.H.K. Lee (Editor), Terrestrial Heat Flow. Am. Geophys. Union, Geophys. Monogr., 8: 21 l-239.
Elder, J.W., 1966. Heat and mass transfer in the earth, hydrothermal systems. DSIR, Bull. 169, 115 pp.
Elder, J.W., 1981. Geothermal Energy. Academic Press, London, 508 pp.
Ellis, A.J. and Wilson, S.H., 1955. The heat from the Wairakei- Taupe thermal region calculated from the chloride output. N.Z. J. Sci. Technol., 36: 622-631.
Caldwell, T.G., Pearson, C. and Zayadi, H., 1986. Resistivity ofrocks in geothermal systems: A laboratory study. Proc. 8th New Zea- land Geothermal Workshop 1986, University of Auckland, pp. 227-28 I.
Calbaem, I.M., 1973. Heat Row measurements under some lakes in North Island, New Zealand. Ph.D. thesis, Victoria University of Wellington, 191 pp. (unpubl.).
Ellis, A.J. and Mahon, W.A.J., 1977. Chemistry and Geothermal Systems. Academic Press, New York, NY, 392 pp.
Evison, F.F., Robinson, R. and Arabasz W.J., 1976. Microearth- quakes, geothermal activity and structure, Central North Island, New Zealand. N.Z. J. Geol. Geophys., 19: 625-637.
Facca, G. and Tonani, F., 1967. The self-sealing geothermal field. Bull. Volcanol., 30: 271-273.
Cole, J.W., 1990. Structural control and origin of volcanism in the Taupo Volcanic Zone, New Zealand. Bull. Volcanol., 52: 445- 459.
Da&y, D.J., 1989. Dislocation modelling of the 1987 Edgecumbe earthquake, New Zealand. N.Z. J. Geol. Geophys., 32: 115-122.
Darby, D.J. and Meertens, C.M., 1995. Terrestrial and GPS meas- urements of deformation across the Taupo back-arc and Hiku- rangi fore-arc regions in New Zealand. J. Geophys. Res., 100: 8221-8232.
Darby, D.J. and Williams, R.O., 1991. A new geodetic estimate of deformation in the Central Volcanic Region of the North Island, New Zealand. N.Z. J. Geol. Geophys., 34: 127-136.
Davey. F.J. and Lodolo, E., 1995. Crustal seismic reflection meas- urements across an ensialic back-arc basin (Bay of Plenty, New Zealand). Boll. Geofis. Teor. Appl., 37: 25-37.
Davey, F.J., Henrys, S.A. and Lodolo, E., 1995. Asymmetric rifting in a continental back-arc environment, North Island, New Zea- land. J. Volcanol. Geotherm. Res., this issue.
Davy, B., 1993. Seismic reflection profiling of the Taupe Caldera, New Zealand. Explor. Geophys., 24: 443-454.
Dawson, G.B., Rayner, H.H. and Hunt, T.M., 1981. Reconnaissance geophysical measurements at Atiamuri geothermal area. Geo- phys. Div., DSIR, Wellington, Rep. 169, 37 pp.
Dickinson, D.J., 1972. The natural heat output of the Tikitem thermal area, 197 I. Geophys. Div., DSIR, Wellington, Rep. 75, 17pp.
Donaldson, LG., 1962. Temperature gradients in the upper layers of the earth’s crust due to convective water flows. J. Geophys. Res., 67: 3449-3460.
Fisher, R.G. and Dickinson, D.J., 1960. The natural heat flow from the Rotokawa area. DSIR. Wellington, Geotherm. Circ. TSG 10,
6 PP. Fisher, R.G., 1957. Initial report on Motuoapa 1 metre te.mperatum
survey. Rep. DSIR, Wairakei, 2 pp. (unpubl.) Fisher, R.G., 1964. Geothermal heat flow at Wairakei during 1958.
N.Z. J. Geol. Geophys., 7: 172-184. Fisher, R.G., 1965. Shallow heat flow survey of Taupe Borough and
adjacent country. N.Z. I. Geol. Geophys., 8: 752-771. Foumier, R.O. and Pitt, A.M., 1985. The Yellowstone magmatic-
hydrothermal system. In: C. Stone (Editor), Geothermal Resource Council 1985. Symposium on Geothermal Energy Transactions, Int. Vol., pp. 319-327.
Garg, S.K. and Kasssoy, D.R., 1981. Convective heat and mass transfer in hydrothermal systems. In: L. Rybach and L.J.P. Muf- fler (Editors), Geothermal Systems: Principles and Case Histo- ries. John Wiley and Son, Chichester, pp. 37-76.
Geophysics Division, 1985. Sheet U17 - Wairakei. Electrical msis- tivity map of New Zealand 1:50 000. DSIR, Wellington.
Glover, R.B., 1992. Chemical fluxes into and out of Lake Rotorua, 1989-90. Geothermics, 21: 89-96.
DSIR, 1957. The Waiotapu Geothermal Field. DSIR, Wellington, Geotherm. Rep. 3, 119 pp.
DSIR, 1963. Waiotapu Geothermal Field. DSIR, Wellington, Bull. 155, 142 pp.
Glover, R.B., Klyen, L.E. and Grump, M.E., 1992. Spring chemistry of the Waikite-Puakohurea thermal area. Proc. 14th New Zea- land Geothermal 1992, University of Auckland, pp. 63-72.
Grange, L.I., 1955. Geothermal steam for power in New Zealand. Bull. 117, DSIR, Wellington, 102 pp.
Gregg, D.R., 1958. Natural heat flow form the thermal areas ofTaupo sheet district (N94). N.Z. J. Geol. Geophys., 1: 65-75.
Grindley, G.W., 1960. Sheet 8 Taupe, Geological map of New Zea- land 1:250 000. DSIR, Wellington, New Zealand.
Grindley, G.W., 1965. The geology, structure and exploitation of the Wairakei geothermal field, Taupe, New Zealand. N.Z. Geol. Surv.. Bull. 75.
DSIR, 1988. Assessment of development impacts and reservoir Grindley, G.W. and Browne, P.R.L., 1975. Structural and hydrolog- response of Tauhara Geothermal Field. Report to Waikato Valley ical factors controlling the permeabilities of some hot-water geo- Authority. DSIR, Wellington, 170 pp. (unpubl). thermal fields. Proc., Second United Nations Symposium on the
Dziewonski, A.M., Chou, T.-A. and Woodhouse, J.H., 198 1. Deter- Development and Use of Geothermal Resources, pp. 377-386. mination of earthquake source parameters from waveform data Grindley, G.W. and Hull, A.G., 1984. Historical Taupe earthquakes for studies of global and regional seismicity. J. Geophys. Res., and earth deformation. In: Recent Crustal Movements of the 86: 2825-2852. Pacific Region. R. Sot. N.Z., Bull., 24: 173-186.

56 H. Bibby et ul. /Journal of Volcanology and Geothermal Research 68 (1995) 29-58
Haines, A.J., 1979. Seismic wave velocities in the uppermost mantle
beneath New Zealand. N.Z. J. Geol. Geophys., 22: 245-257.
Hasegawa A., Horiuchi, S. and Umino, N., in press. Seismic structure
of the northeast Japan convergent margin; a synthesis. J. Geo-
phys. Res.
Hatherton, T., 1974. Basement surface west of Lake Taupo. Rep. 90.
Geophys. Div., DSIR, Wellington, New Zealand, 9 pp.
Hatherton, T., Macdonald, W.J.P. and Thompson, G.E.K., 1966.
Geophysical methods in geothermal prospecting in New Zealand.
Bull. Volcanoi., 29: 484-498.
Hedenquist, J.W.. 1983. Characteristics of Broadlands-Ohaaki water
chemistry and changes subsequent to initial production. Proc. 5th
New Zealand Geothermal Workshop, University of Auckland,
pp. 151-156.
Henley, R.W. and Ellis, A.J., 1983. Geothermal systems ancient and
modern: a geochemical review. Earth-Sci. Rev., 19: l-50.
Henneberger, R.C., 1986. Ohakuri fossilepithermal system. In: R.W.
Henley, J.W. Hedenquist and P.J. Roberts (Editors), Guide to
the Active Epithermal (Geothermal) Systems and Precious
Metal Deposits of New Zealand. Monogr. Ser. Miner. Deposits.
Gebrilder Borntraeger, Berlin, 26: I2 I-128.
Henrys, S.A. and Hochstein, M.P., 1990. Geophysical structure of
the Broadlands-Ohaaki Geothermal Field (New Zealand).
Geothermics, 19: I29- 150.
Hill, D.P., 1992. Temperatures at the base of the seismogenic crust
beneath Long Valley Caldera, California, and the Phlegrean
Fields, Caldera, Italy. In: P. Gasparini, R. Scarpa and K. Aki
(Editors), Volcanic Seismology. Springer-Verlag, Berlin, pp.
432-46 1.
Hochstein, M.P., 1995. Crustal heat transfer in the Taupo Volcanic
Zone (New Zealand) : comparison with other volcanic arcs and
explanatory heat source models, J. VolcanoI. Geotherm. Res.,
this issue.
Hochstein, M.P. and Hunt, T.M., 1970. Seismic, gravity and mag-
netic studies, Broadlands Geothermal Field, New Zealand.
Geothermics, Spec. Issue. 2: 333-346.
Hochstein, M.P., Smith, I.E.M., Regenauer-Lieb, K. and Ehara. S..
1993. Geochemistry and heat transfer processes in Quaternary
rhyolitic systems of the Taupo Volcanic Zone, New Zealand.
Tectonophysics, 223: 213-235.
Hunt, T.M. and Latter, J.H., 1982. A survey of seismic activity near
Wairakei geothermal field, New Zealand. J. Volcanol. Geotherm.
Res., 14: 319-334.
Hurst, A.W., 1974. Magnetic effects in volcanic regions. PhD thesis,
Victoria University, Wellington, 369 pp. (unpubl.).
Hurst, A.W., Sherbum, S. and Stagpoole, V.M., 1988. The Taupo
seismic system. In: J.H. Latter (Editor), Volcanic Hazards. Assessment and Monitoring. Springer-Verlag. Berlin, pp. 5 13-
519.
Ingham, M., 1990. Electrical resistivity structure of the eastern mar-
gin of the Central Volcanic Region. Proc. 12th New Zealand
Geothermal Workshop, University of Auckland, pp. 77-8 1.
Ingham, M.R., 199 1. Numerical modellingof magnetotelluric sound-
ings from the Central Volcanic Region. Proc. 13th New Zealand
Geothermal Workshop 1991, University of Auckland, pp. 15-
20.
Keller, G.V., 1970. Induction methods in prospecting for hot water.
Geothermics, Spec. Issue, 2: 318-332.
Krupp. R., Browne, P.R.L., Henley, R.W. and Seward, T.M., 1986.
Rotokawa Geothermal Field. In: R.W. Henley, J.W. Hedenquist
and P.J. Roberts (Editors) Guide to the Active Epithermal (Geo-
thermal) Systems and Precious Metal Deposits of New Zealand.
Monogr. Ser. Mineral Deposits, Gebrhder Bomtraeger, Berlin,
26: 47-55.
Lamarche, G., 1992. Seismic reflection survey in the geothermal
field of the Rotorua Caldera, New Zealand. Geothermics, 21:
109-I 19.
Lloyd, E.F., 1972. Geology and hot springs of Orakeikokako. N.Z.
Geol. Surv., Bull. 85, 166 pp.
Lumb. J.T. and Macdonald, W.J.P., 1970. Near surface resistivity
surveys of geothermal areas using the electromagnetic method.
Geothermics, Spec. Issue, 2: 3 I l-317.
Macdonald, W.J.P., 1974. Geophysical investigation of the Rotorua
Geothermal district. In: Geothermal Resources of the Rotorua
District. DSIR, Wellington, Geotherm. Rep., 6: 53-77.
McNabb, A., 1965. On convection in a porous medium. Proc. 2nd
Australian Conference on Hydraulics and Fluid Mechanics, pp.
C16l-Cl7l.
McNabb, A., 1975. Geothermal physics. DSIR, Wellington, Appl.
Math. Tech. Rep. 32, 37 pp.
Midha. R.K., 1979. Geoelectromagnetic induction studies in the
North Island volcanic region, New Zealand. PhD thesis, Victoria
University, Wellington. 342~~. (unpubl.).
Modriniak, N. and Studt, F.E.. 1959. Geological structure and vol-
canism of the TaupoTarawera District. N.Z. J. Geol. Geophys.,
2: 654684.
Mooney, H.M., 1970. Upper mantle inhomogeneity beneath New
Zealand: Seismic evidence. J. Geophys. Res., 75: 285-309.
Mulyadi, A. and Caldwell, G., 1979. Analysis of the resistivity
boundary structure of the Broadlands Geothermal Field. Proc.
New Zealand Geothermal Workshop 1979, University of Auck-
land, pp. 298-306.
MWD, 1977. Broadlands geothermal investigation report. Ministry
of Works and Development, Wellington, 235 pp.
Naim, ].A., 1989. Sheet VI6 AC Mount Tarawera, Geological map
of New Zealand I:50 000. DSIR, Wellington, New Zealand.
Naim, IA. and Findlayson, B.F., 1981. Chloride flux measurements
in the Tarawera River system. DSIR, Wellington, Geotherm.
Circ., IBF2, IAN3.
New Zealand Geological Survey (NZGS), 1974. Minerals of New
Zealand Part D. N.Z. Geol. Surv., DSIR, Wellington, Geotherm.
Rep. 38D.
Northey, D.J., 1982. Seismic studies of the structure beneath Lake
Taupo. PhD thesis, Victoria University, Wellington (unpubl.).
Norton, D. and Knight, J., 1977. Transport phenomena in hydro-
thermal systems: cooling plutons. Am. J. Sci., 277: 937-981.
Olhoeft, G.R., 1981. Electrical properties of rock. In: Y.S. Toulou-
kian, W.R. Judd, and R.F. Roy (Editors), Physical Properties of
Rocks and Minerals. McGraw-Hill, New York, NY, pp. 257-
330.
Palmason, G. and Saemundsson, K., 1974. Iceland in relation to the
Mid-Atlantic Ridge. Annu. Rev. Earth Planet. Sci., 2: 25-50.

H. Bibby et al. /Journal of Volcanology and Geothermal Research 68 (1995) 29-58 51
Pelletin, L., Johnston, J.M. and Hohmann, G.W., 1992. Evaluation of electromagnetic methods in geothermal exploration. Expanded abstr., 62nd Annual meeting, Sot. Explor. Geophys., New Orleans, pp. 405-408.
Priestly, K.F., 1989. Source parameters of the 1987 Edgecumbe earthquake, New Zealand. N.Z. J. Geol. Geophys., 32: 53-59.
Quist, AS. and Marshall, W.L., 1968. Electrical conductance of aqueous sodium chloride solution from 0 to 800°C at pressure to 400 bars. J. Phys. Chem., 72: 684-703.
Reeves, R. and Ingham, M., 1991. Electrical structure of the Tokaanu geothermal field. Proc. 13th New Zealand Geothermal Workshop 1991, University of Auckland, pp. 2 l-26.
Reilly, W.I., 1972. The New Zealand gravity map series. N.Z. J. Geol. Geophys., 15: 3-15.
Richardson, W.P., 1989. The Matataearthquake of 1977 May 31: A recent event near Edgecumbe, Bay of Plenty, New Zealand. N.Z. J. Geol. Geophys., 32: 17-30.
Risk, G.F., 1983. Delineation of geothermal fields in New Zealand using electrical msistivity prospecting. Proc. third biennial con- ference of the Australian Society of Exploration Geophysicists, pp. 147-149.
Risk, G.F., 1986. Reconnaissance and follow-up resistivity survey- ing of New Zealand geothermal fields. Proc. 8th New Zealand Geothermal Workshop 1986, University of Auckland, pp. 75 80.
Risk, G.F., Groth, M.J., Rayner, H.H., Dawson, G.B., Bibby, H.M., Macdonald, W.J.P. and Hewson, C.A.Y., 1977. The resistivity boundary of the Broadlands geothermal field. Geophys. Div., DSIR, Wellington, Rep. 123.42 pp.
Risk, G.F., Rayner, H.H., Stagpoole, V.M., Graham, D.J., Dawson, G.B. and Bennie, S.L., 1984. Electrical resistivity survey of the Wairakei geothermal field. Geophys. Div., DSIR, Wellington, Rep. 200,69 pp.
Risk, G.F., Bibby, H.M. and Caldwell, T.G., 1993. DC resistivity mapping with the multiple-source, bipoledipole array in the Central Volcanic Region, New Zealand. J. Geomagn. Geoelectr., 45: 897-913.
Risk, G.F., Caldwell, T.G. and Bibby, H.M., 1994. Deep msistivity surveying of Waiotapu-Waikite-Reporoa region with the mul- tiple source bipole-dipole method. Geothermics, 23: 423-444.
Robinson, B.W. and Sheppard, D.S., 1986. A chemical and isotopic study of the Tokaanu-Waihi Geothermal area. J. Volcanol. Geotherm. Res., 27: 135-151.
Robinson, J.. 1975. Modelling of convecting fluids. DSIR, Welling- ton, Appl. Math. Tech. Rep. 35, 32 pp.
Robinson, R., 1989. Aftershocks of the 1987 Edgecumbe earthquake, New Zealand: seismological and structural studies using portable seismographs in the epicentral region. N.Z. J. Geol. Geophys.. 32: 61-72.
Robinson, R., Smith, E.G.C. and Latter, J.H., 1981. Seismic studies of the crust under the hydrothermal areas of the Taupo Volcanic Zone, New Zealand. J. Volcanol. Geotherm. Res., 9: 253-267
Rogan, M., 1982. A geophysical study of the Taupo Volcanic Zone, New Zealand. J. Geophys. Res., 87: 40734088.
Sat&e, K. and Hashida, T., 1989. Three-dimensional attenuation structure beneath North Island, New Zealand. Tectonophysics, 159: 181-194.
Sheppard, D.S and Lyon, G.L., 1984. Geothermal fluid chemistry of the Orakeikokako field, New Zealand. J. Volcanol. Geotherm. Res., 22: 329-349.
Sherbum, S., 1992a. Characteristics of earthquake sequences in the Central Volcanic Region, New Zealand. N.Z. J. Geol. Geophys., 35: 57-68.
Sherbum, S., 1992b. Seismic@ of the Lake Taupo region, New Zealand, 1985-90. N.Z. J. Geol. Geophys., 35: 331-335.
Sibson, R.H., 1982. Fault zone models, heat flow, and the depth distribution of earthquakes in the continental crust of the United States. Bull. Seismol. Sot. Am., 72: 151-163
Simmons, SF., Keywood, M., Scott, B.J. and Keam. R.F., 1993. Irreversible change of the Rotomahana-Waimangu hydrother- mal system (New Zealand) as a consequence of a volcanic emp- tion. Geology, 21: 643646.
Sissons, B.A., 1979. The horizontal kinematics of the North Island of New Zealand. Ph.D. thesis, Victoria University, Wellington, 118 pp. (unpubl.).
Sissons, B.A. and Dibble, R.R., 1981. A seismic refraction experi- ment southeast off Ruapehu volcano. N.Z. J. Geol. Geophys., 24: 31-38.
Smith, E.G.C. and Oppenheimer, C.M.M., 1989. The Bdgecumbe earthquake sequence: 1987 February 21 to March 18. N.Z. J. Geol. Geophys., 32: 31-42.
Smith, E.G.C. and Webb, T.H., 1986. The seismic&y and related deformation of the Central Volcanic Region, North Island, New Zealand. In: I.E.M. Smith (Editor), Late Cenozoic Volcanism in New Zealand. R. Sot. N.Z., Bull., 23: 112-133.
Smith, R.B. and Braile, L.W., 1994. The Yellowstone hot spot. J. Volcanol. Geotherm. Res., 61: 121-187.
Smith, R.B. and Bruhn, R.L., 1984. Intmplate extensional tectonics of the eastern Basin Range: Inferences on structural style from seismic reflection data, regional tectonics, and thermal-mechan- ical models of brittle-ductile deformation. J. Geophys. Res., 89: 5733-5762.
Stem, T.A., 1979. Regional and residual gravity fields, central North Island, New Zealand. N.Z. J. Geol. Geophys., 22: 479-485.
Stem, T.A., 1982. Seismic and gravity investigations of the Central Volcanic Region, North Island, New Zealand. PhD thesis, Vic- toria University, Wellington, 318 pp.
Stem, T.A., 1985. A back-arc basin formed within continental lith- osphere; The Central Volcanic Region of New Zealand. Tecton- ophysics, 112: 385-409.
Stem, T.A., 1986. Geophysical studies of the upper crust within the Central Volcanic Region, New Zealand. In: I.E.M. Smith (Edi- tor), Late Cenozoic Volcanism in New Zealand. R. Sot. N.Z., Bull., 23: 92-l 11.
Stem, T.A., 1987. Asymmetric back-arc spreading, heat flux and structure of the Central Volcanic Region of New Zealand. Earth Planet. Sci. L&t., 85: 265-276.
Stem, T.A. and Davey, F.J., 1985. Crustal structure studies within tbe central North Island: The Central Volcanic Region. Geophys. Div., DSIR, Wellington, Rep. 207.47 pp.
Stem, T.A. and Davey, F.J., 1987. A seismic investigation of crustal and upper mantle structure within the Central Volcanic Region of New Zealand. N.Z. J. Geol. Geophys., 30: 217-231.

58 H. Bibby et al. /Journal of Volcanology and Geothermal Research 68 (1995) 29-58
Stem, T.A., Smith, E.G.C., Davey, F.J. and Muirhead, K.H., 1987. Crust and upper mantle structure of the northwestern North Island, New Zealand. Geophys. J. R. A&on. Sot., 91: 913-936.
Studt, F.E. and Thompson G.E.K., 1969. Geothermal heatflow in the North Island of New Zealand. N.Z. J. Geol. Geophys., 12: 673- 683.
Thrasher, G.P., 1986. Basement structure and sediment thickness beneath the continental shelf of the Hauraki Gulf and offshore Coromandel region, New Zealand. N.Z. J. Geol. Geophys., 29: 4 I-50.
Timperley, M.H. and Vigor-Brown, R.J., 1985. Weathering of pum- ice in the sediments as a possible source of major ions for the waters of Lake Taupo, New Zealand. Chem. Geol., 49: 43-52.
Webb, T.H., Ferris, B.G. and Harris, J.S., 1986. The Lake Taupo. New Zealand, earthquake swarms of 1983. N.Z. J. Geol. Geo- phys., 29: 377-389.
Whiteford, PC. 1975. Assessment of the audio magnetotelluric method for geothermal resistivity surveying. Proc. Second United Nations Symposium on the Development and Use of Geothermal Resources, pp. 1255-1262.
Wilson, C.J.N., Rogan, A.M., Smith, I.E.M., Notthey, D.J., Naim, LA. and Houghton, B.F., 1984. Caldera volcanoes of the Taupo
Volcanic Zone, New Zealand. J. Geophys. Res., 89: 8463-8484. Wilson, C.J.N., Houghton, B.F., McWilliams, M.O., Lanphere.
M.A.. Weaver, SD. and Briggs, R.M., 1995. Volcanic and struc- tural evolution of Taupo Volcanic Zone, New Zealand: a review. J. Volcanol. Geotherm. Res., this issue.
Wood, C.P., 1994. Aspects of the geology of Waimangu, Waiotapu, Waikite and Reporoa geothermal areas, Taupe Volcanic Zone, New Zealand. Geothermics, 23: 401-422.
Wooding, R.A., 1963. Convection in a saturated porous medium at large Rayleigh number or Peclet number. J. Fluid Mech., 15: 527-544.
Wooding, R.A., 1964. Mixing-layer flows in a saturated porous medium. J. Fluid Mech., 19: 103-l 13.
Woodward D.J., 1988. Seismic reflection survey of the Rangitaiki Plains, Eastern Bay of Plenty. Geophys. Div., DSIR, Wellington, Res. Rep. 218, 14 pp.
Woodward D.J., 1989. Geological structure of the Rangitaiki Plains near Edgecombe, New Zealand. N.Z. J. Geol. Geophys., 32: 15- 16.
Wright, l.c., 1992. Shallow structure and active tectonism of an offshore continental back-arc spreading system: the Taupo Vol- canic Zone, New Zealand. Mar. Geol., 103: 287-309.
Related Documents