1 Reviewing the nomenclature for high-technology trade – the sectoral approach by Alexander Loschky

1 Reviewing the nomenclature for high- technology trade – the sectoral approach by Alexander Loschky.
Dec 18, 2015
Welcome message from author
This document is posted to help you gain knowledge. Please leave a comment to let me know what you think about it! Share it to your friends and learn new things together.
Transcript
1
Reviewing the nomenclature for high-technology trade – the sectoral approach
byAlexander Loschky

2
Current high-tech nomenclature
Two different approaches:– Sectoral approach (by economic sectors, ISIC / NACE)– Product approach (by product groups, SITC)
This presentation concentrates on the sectoral approach.

3
• R&D intensity is used as the sole indicator• Calculating direct and indirect R&D intensities
– Direct R&D intensities:
– Indirect R&D intensities (R&D expenditure embodied in the intermediate goods used in the production of another sector)Calculation: via Input-Output tables
How are high-tech sectors identified?
y
yy output
eexpenditurD&RintensityD&R
4
Why reviewing the sectoral high-tech classification?
Current nomenclature is relatively old:• 1997: OECD working paper by Thomas
Hatzichronoglou (using direct and indirect R&D intensities, but figures date from 1990)
• 2005: OECD Handbook on Economic Globalisation Indicators (minor and partial update using only direct R&D intensities)

5
Calculation of indirect R&D intensities (1)
Brief description in nine steps:1. Conversion of input-output tables (nearest to the year
2000) from national currencies into US-$ (using PPP)2. Estimation of missing output data for certain sectors and
countries (where possible) with production data3. Summing-up of the input-output tables of all countries into
a single table

6
Calculation of indirect R&D intensities (2)
4. Calculation of the direct R&D intensities:= total R&D expenditure of sector Y for all countries / total output in sector Y of all countries
5. Conversion of the unified input-output table of step 3 into a table of input coefficients (A)
6. Formation of the Leontief inverse: (I-A)-1
(The Leontief inverse shows the impact of one unit of final demand on the intermediate products.)

7
Calculation of indirect R&D intensities (3)
7. Transformation of the table into a table of output necessities(showing the amounts of intermediate products needed for one unit of output)
8. Calculation of the total R&D intensities:Calculation of indirect R&D intensities (of sector Y from each sector X):The output necessities of sector Y from each sector X were multiplied with the respective direct R&D intensities of sectors X.
Total R&D intensity of sector Y = direct R&D intensity of sector Y + indirect R&D intensities of Y
8
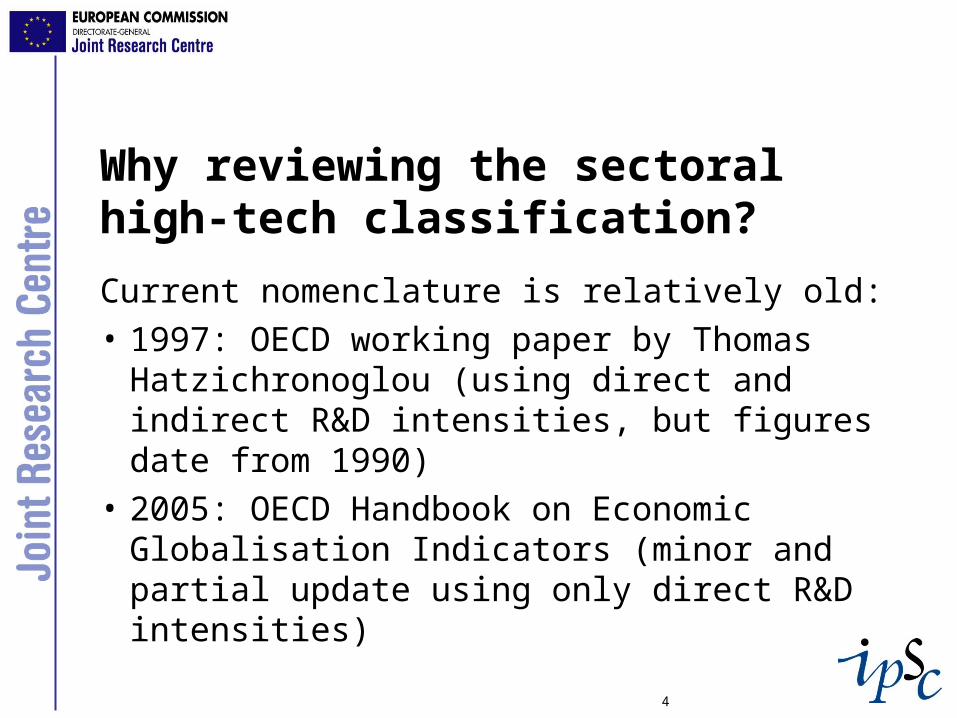
Calculation of indirect R&D intensities (4)
9. The total R&D intensities were used to classify the sectors for its technology intensiveness. The threshold used were:
R&D intensity…• … below 1.0%: low-tech• … between 1.0% and 2.5%: medium-low-tech• … between 2.5% and 7%: medium high-tech• … higher than 7%: high-tech
9
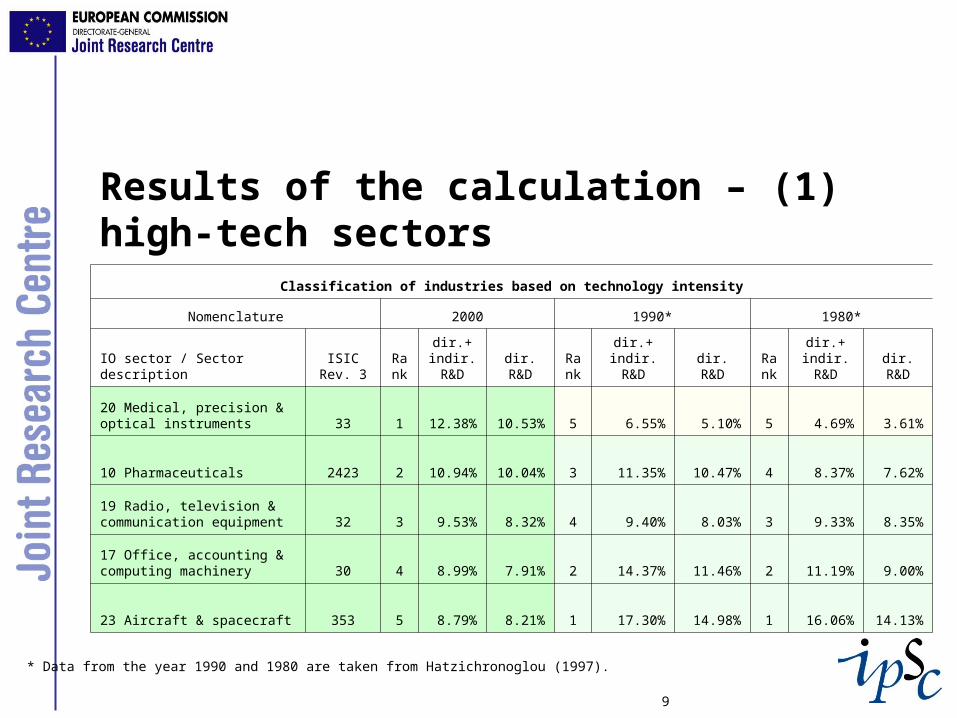
Results of the calculation – (1) high-tech sectors
Classification of industries based on technology intensity
Nomenclature 2000 1990* 1980*
IO sector / Sector descriptionISIC
Rev. 3Rank
dir.+ indir. R&D
dir. R&D
Rank
dir.+indir.R&D dir. R&D
Rank
dir.+ indir. R&D dir. R&D
20 Medical, precision & optical instruments 33 1 12.38% 10.53% 5 6.55% 5.10% 5 4.69% 3.61%
10 Pharmaceuticals 2423 2 10.94% 10.04% 3 11.35% 10.47% 4 8.37% 7.62%
19 Radio, television & communication equipment 32 3 9.53% 8.32% 4 9.40% 8.03% 3 9.33% 8.35%
17 Office, accounting & computing machinery 30 4 8.99% 7.91% 2 14.37% 11.46% 2 11.19% 9.00%
23 Aircraft & spacecraft 353 5 8.79% 8.21% 1 17.30% 14.98% 1 16.06% 14.13%
* Data from the year 1990 and 1980 are taken from Hatzichronoglou (1997).

10
Results of the calculation – (2) medium-high-tech sectors
Classification of industries based on technology intensity
Nomenclature 2000 1990* 1980*
IO sector / Sector descriptionISIC Rev.
3Rank
dir.+ indir. R&D
dir. R&D
Rank
dir.+ indir. R&D
dir. R&D
Rank
dir.+ indir. R&D
dir. R&D
24 Railroad equipment & transport equip nec
352+ 359 6 5.09% 3.68% 9 3.03% 1.58% 11 1.69% 0.98%
21 Motor vehicles, trailers & semi-trailers 34 7 4.28% 3.30% 6 4.44% 3.41% 7 3.68% 2.81%
18 Electrical machinery & apparatus, nec 31 8 3.79% 2.65% 7 3.96% 2.81% 6 4.25% 3.48%
16 Machinery & equipment, nec 29 9 3.31% 2.13% 10 2.58% 1.74% 10 2.00% 1.32%
09 Chemicals excluding pharmaceuticals
24 excl. 2423 10 2.88% 2.38% 8 3.84% 3.20% 8 2.67% 2.15%
11 Rubber & plastics products 25 11 2.37% 1.03% 11 2.47% 1.07% 9 2.20% 1.08%
11
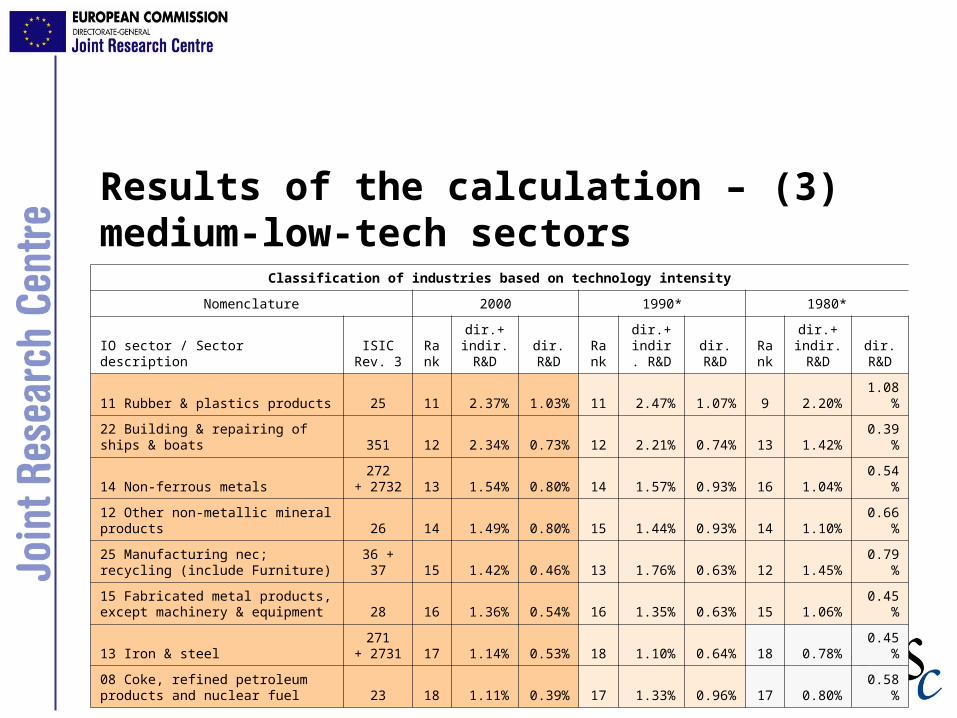
Results of the calculation – (3) medium-low-tech sectors
Classification of industries based on technology intensity
Nomenclature 2000 1990* 1980*
IO sector / Sector descriptionISIC
Rev. 3Rank
dir.+ indir. R&D
dir. R&D
Rank
dir.+ indir. R&D
dir. R&D
Rank
dir.+ indir. R&D
dir. R&D
11 Rubber & plastics products 25 11 2.37% 1.03% 11 2.47% 1.07% 9 2.20% 1.08%
22 Building & repairing of ships & boats 351 12 2.34% 0.73% 12 2.21% 0.74% 13 1.42% 0.39%
14 Non-ferrous metals272
+ 2732 13 1.54% 0.80% 14 1.57% 0.93% 16 1.04% 0.54%
12 Other non-metallic mineral products 26 14 1.49% 0.80% 15 1.44% 0.93% 14 1.10% 0.66%
25 Manufacturing nec; recycling (include Furniture) 36 + 37 15 1.42% 0.46% 13 1.76% 0.63% 12 1.45% 0.79%
15 Fabricated metal products, except machinery & equipment 28 16 1.36% 0.54% 16 1.35% 0.63% 15 1.06% 0.45%
13 Iron & steel 271
+ 2731 17 1.14% 0.53% 18 1.10% 0.64% 18 0.78% 0.45%
08 Coke, refined petroleum products and nuclear fuel 23 18 1.11% 0.39% 17 1.33% 0.96% 17 0.80% 0.58%

12
Results of the calculation – (4) low-tech sectors
Classification of industries based on technology intensity
Nomenclature 2000 1990* 1980*
IO sector / Sector descriptionISIC
Rev. 3Rank
dir.+ indir. R&D
dir. R&D
Rank
dir.+ indir. R&D
dir. R&D
Rank
dir.+ indir. R&D
dir. R&D
07 Pulp, paper, paper products, printing and publishing 21 + 22 19 0.99% 0.40% 19 0.88% 0.31% 19 0.68% 0.23%
05 Textiles, textile products, leather and footwear
17 + 18 + 19 20 0.97% 0.29% 20 0.78% 0.23% 20 0.56% 0.13%
04 Food products, beverages and tobacco 15 + 16 21 0.96% 0.34% 21 0.73% 0.34% 20 0.56% 0.14%
06 Wood and products of wood and cork 20 22 0.83% 0.21% 22 0.65% 0.18% 22 0.55% 0.14%

13
Results – Impact on the high-tech classification:• Almost no changes for the technology classification
compared to the last one, based on 1990 data.• The only major change: precision instruments are
now high-tech and became the sector with the highest R&D intensity.
• But note: The ranking within the high-tech and medium-high-tech groups changed considerably.
14
Outlook (1)
• This exercise should be repeated each time when new OECD Input-Output tables become available.
• Hopefully country coverage (currently 18 countries) can be extended to even more OECD and non-OECD countries.
• Also the classification based on the product approach needs an update (see paper by Florian Eberth, OECD).

15
Outlook (2) – The combined approach
Currently trade by high-tech sectors is calculated using correspondence tables (ISIC SITC).
In the future, this could be replaced by using (detailed) sectoral foreign trade data allowing to identify the goods actually traded by high-tech sectors.
Thank you!


17
Additional slide: Country coverage
• data from 18 countries were used for which R&D intensities could be calculated and for which OECD Input-Output tables were available (compared to 10 countries in 1997)
• The countries were: AU, BE, CA, CZ, DE, DK, ES, FI, FR, UK, IE, IT, JP, KR, NL, NO, PL, SE, US(all 18 countries are OECD members)
Related Documents