1 11 June 2014 Betfair Group plc (“Betfair”) Preliminary results for the year ended 30 April 2014 Summary Underlying 1 Reported FY14 £m FY13 £m Change % FY14 £m FY13 £m Change % Group revenue 393.6 387.0 +2% 393.6 387.0 +2% EBITDA 91.1 73.3 +24% 91.1 51.2 +78% Profit before tax 61.1 38.0 +61% 61.1 (49.4) N/A Basic earnings per share (p) 49.0p 31.2p +57% 49.0p (44.4p) N/A Dividend per share (p) 20.0p 13.0p +54% 20.0p 13.0p +54% 1 Underlying figures in the prior year are stated after making a number of adjustments in order to aid comparability between periods. A reconciliation of reported figures to underlying figures is set out on page 11. Sustainable revenues up 9%, with growth across all products Sustainable mix now 78% of Group revenues (from 72% in FY13) Underlying EBITDA up 24% to £91.1m Underlying free cash flow up 40% to £70.4m and year-end cash of £209.8m Number of customers in sustainable markets up 27% Mobile revenue up 70% and in Q4 represented 64% of Sportsbook revenues Significant new products introduced: Cash Out+ and Price Rush Betfair US revenue up 20%, with improved TVG profitability offset by New Jersey online casino investment Licensed exchanges launched in Italy and Bulgaria Proposed full year dividend up 54% to 20.0 pence per share Breon Corcoran, Betfair’s Chief Executive Officer, said: “Our strategy is working. The emphasis on sustainable revenues and our product and marketing investments are paying off, resulting in record revenues and profits. The focus in FY14 was on creating a competitive Sportsbook and we are now entering an exciting phase of product development to leverage both our Exchange and Sportsbook to stand out in a crowded marketplace. Betfair has always been a unique betting company and our innovative sports betting products such as Cash Out and Price Rush are redefining the ways customers bet. Cash Out+ builds on the success of our Cash Out feature which allows customers to lock in profits before the conclusion of an event and has been used over 30 million times. This enhancement allows customers to partially cash out their bets and further differentiates our product. Price Rush is the first step of integrating our Exchange and Sportsbook and allows the odds on certain Sportsbook bets to be boosted by using the superior value available on the Exchange. Over 500,000 bets have been ‘Rushed’ so far and on average the odds on these bets were boosted by 24%. The introduction of the Sportsbook, increased television advertising spend and the strengthening of our online marketing capability have broadened our customer reach and led to a 54% increase in the number of customers acquired in the UK and Ireland. As a result, we have seen three consecutive quarters of double digit revenue growth in sustainable markets.

Welcome message from author
This document is posted to help you gain knowledge. Please leave a comment to let me know what you think about it! Share it to your friends and learn new things together.
Transcript
1
11 June 2014
Betfair Group plc (“Betfair”)
Preliminary results for the year ended 30 April 2014
Summary
Underlying 1 Reported
FY14 £m
FY13 £m
Change %
FY14 £m
FY13 £m
Change %
Group revenue 393.6 387.0 +2% 393.6 387.0 +2% EBITDA 91.1 73.3 +24% 91.1 51.2 +78% Profit before tax 61.1 38.0 +61% 61.1 (49.4) N/A Basic earnings per share (p) 49.0p 31.2p +57% 49.0p (44.4p) N/A Dividend per share (p) 20.0p 13.0p +54% 20.0p 13.0p +54% 1Underlying figures in the prior year are stated after making a number of adjustments in order to aid comparability between periods. A reconciliation of reported figures to underlying figures is set out on page 11.
Sustainable revenues up 9%, with growth across all products
Sustainable mix now 78% of Group revenues (from 72% in FY13)
Underlying EBITDA up 24% to £91.1m
Underlying free cash flow up 40% to £70.4m and year-end cash of £209.8m
Number of customers in sustainable markets up 27%
Mobile revenue up 70% and in Q4 represented 64% of Sportsbook revenues
Significant new products introduced: Cash Out+ and Price Rush
Betfair US revenue up 20%, with improved TVG profitability offset by New Jersey online casino investment
Licensed exchanges launched in Italy and Bulgaria
Proposed full year dividend up 54% to 20.0 pence per share
Breon Corcoran, Betfair’s Chief Executive Officer, said:
“Our strategy is working. The emphasis on sustainable revenues and our product and marketing investments
are paying off, resulting in record revenues and profits.
The focus in FY14 was on creating a competitive Sportsbook and we are now entering an exciting phase of
product development to leverage both our Exchange and Sportsbook to stand out in a crowded marketplace.
Betfair has always been a unique betting company and our innovative sports betting products such as Cash
Out and Price Rush are redefining the ways customers bet.
Cash Out+ builds on the success of our Cash Out feature which allows customers to lock in profits before the
conclusion of an event and has been used over 30 million times. This enhancement allows customers to
partially cash out their bets and further differentiates our product.
Price Rush is the first step of integrating our Exchange and Sportsbook and allows the odds on certain
Sportsbook bets to be boosted by using the superior value available on the Exchange. Over 500,000 bets have
been ‘Rushed’ so far and on average the odds on these bets were boosted by 24%.
The introduction of the Sportsbook, increased television advertising spend and the strengthening of our online
marketing capability have broadened our customer reach and led to a 54% increase in the number of
customers acquired in the UK and Ireland. As a result, we have seen three consecutive quarters of double digit
revenue growth in sustainable markets.

2
Our focus on efficiency has allowed operating margin expansion at the same time as increasing marketing and
technology investment to approximately £200m.
The flexibility we retain through our strong balance sheet provides a competitive advantage during uncertain
times for the gaming sector. We will continue to review our balance sheet on a regular basis.
We believe the differentiation of our products and uniqueness of our model give us a real competitive
advantage. Our strong trading has continued into the new financial year and we look forward to building on
this positive momentum during the World Cup that kicks off tomorrow and which will be an excellent showcase
for our market leading products.”
For more information, please contact:
Paul Rushton, Investor Relations
Tel: +44 20 8834 6139
James Midmer, Corporate Communications
Tel: +44 20 8834 6843
Victoria Palmer-Moore, Powerscourt
Tel: +44 20 7250 1446
Analyst and investor results webcast
There will be a live webcast of the results presentation at 9.30 a.m. BST. Please pre-register for access to the
webcast by visiting the Group website (http://corporate.betfair.com). A copy of the webcast and slide presentation
given at the meeting will be available on the Group’s website later today.
3
BUSINESS REVIEW
In December 2012 we announced a strategy to turnaround Betfair’s performance: moving the business onto a
more sustainable revenue base; investing in our product and brand so that we could address the wider
recreational market; and using our strong balance sheet to access growth opportunities as and when they
emerge.
Our belief was that Betfair had significant potential but that its product and brand needed adapting to appeal
more to the mass market, and the business itself needed to operate more efficiently to fund the investment
required to grow our customer base and revenues in sustainable markets.
Following the encouraging early developments announced in FY13, we are pleased that Betfair has this year
been able to switch gears and start making significant progress towards our strategic objectives.
Overview of results
Revenue of £393.6m (FY13: £387.0m) reflected strong growth in Sportsbook and Betfair US, partly offset by a
weak Gaming performance. This result included significant adverse impacts from market exits (£13.3m) and
the absence of a major international football tournament (£7.8m from Euro 2012).
Underlying EBITDA was up 24% to £91.1m (FY13: £73.3m). The improvement in profitability was driven
primarily by cost savings, which were in excess of our £30m target. This, along with lower depreciation and
amortisation, resulted in underlying basic earnings per share increasing by 57% to 49.0 pence (FY13: 31.2
pence).
The Group ended the year with a cash balance of £209.8m (FY13: £168.1m) and no debt.
Strategy Update
Sustainable revenues
Betfair’s objective is to achieve profitable scale in sustainable markets and during FY14 we have continued to
focus Betfair’s marketing activities towards licensed operations. As a result the business faces substantially
less regulatory risk. Sustainable markets (defined as the UK, Ireland, Denmark, Malta, Gibraltar and US) now
contribute 78% of Group revenues (FY13: 72%).
Sustainable revenues were up 9% over the year, with growth across all products. This contrasts markedly
with revenue from other markets, which was down 18%.
Investment in product and brand
We believe that the key to winning in our target markets is to create differentiated products that give Betfair
customers unique advantages over those using other brands. Betfair is now in a position to do this through
integrating its Exchange and Sportsbook, both of which possess functionality that, when put together, can
create a truly unique sports betting platform. We are now making significant investment to develop products
that enable every customer to access the full range of both platforms. To this end, this year has seen us
launch new products that are rapidly changing the traditional Sportsbook model:
The ability to Cash Out both singles and accumulator Sportsbook bets brings a concept historically
only available on the Exchange to new customer segments and is redefining the boundaries of how
customers bet on live sport.
Our recent launch of Price Rush, a simple product feature that boosts the odds offered to Sportsbook
customers by matching their bets seamlessly on the Exchange.
Through integrating our products we believe we can restore Betfair to its position as a disruptive frontrunner
within a market where differentiation between operators is otherwise almost non-existent. Integration
provides inherent benefits to our ongoing business. Recreational customers who might not always take the
time to learn the functionality of the Exchange can now access it, and in doing so they increase liquidity on
the Exchange.
4
The ongoing integration of these two products means we will report a combined Sports revenue number in
FY15.
The product successes mean we will continue to invest over £100m in sales and marketing this year, including
entering high profile partnerships with Channel 4 Racing, Sky Sports and ITV Sport, accompanied by
investment in social channels. Our brand messaging seeks to place Betfair at the heart of the excitement
generated around live sport and we are a Gold partner of ITV’s World Cup football coverage, enabling us to
target a significant recreational audience at the world’s most watched sporting event.
The early results of our product and brand investment have been encouraging. We have seen sustained
increases in our UK and Ireland customer acquisition numbers (up 54% year on year). This has driven strong
growth in Betfair’s active customer base, with UK and Ireland active customer numbers up 35% in FY14. The
increase in customer numbers has in turn driven double digit growth in sustainable revenues in each of the
last three quarters. Mobile continues to be a key channel and revenue was up 70% following a 50% increase
in active mobile customers.
International
We are focused on achieving sustainable international expansion and have therefore been encouraged by the
launches of both our online casino in New Jersey and our Exchange in Italy, two markets which we believe
possess attractive long term characteristics. Whilst it is very early days for both products, we believe our 8%
share of the New Jersey casino market to date represents a fair start and that our Italian Exchange, which is
the first into the new market, offers a compelling experience for sports bettors in Italy.
Efficiency
Betfair’s strategic objectives are supported by our ongoing drive to become a leaner, more dynamic
organisation. In FY13, we undertook a thorough review of our cost base and identified a number of areas
where the business could become leaner and we delivered £33m of cost savings in FY14. This has led to
improved margins and is enabling us to make further investments in product and marketing to drive future
revenue growth.
Outlook
Betfair operates in an uncertain marketplace where many governments, including in the UK, are either
introducing or contemplating new regulatory or fiscal arrangements. Whilst this makes any future predictions
on financial performance difficult, our strategy is working and the business is seeing good momentum. This
leaves us confident that we can grow sustainable revenues in line with the online market growth rate. In other
markets, we continue to expect regulatory uncertainty and declining revenue as a result of lack of investment
and market exits. Our best estimate is that these revenues will reduce by between 15-25% per annum.
Our strong trading has continued in the first six weeks of the new financial year and we look forward to
building on this positive momentum during the World Cup.
5
OPERATING REVIEW
Sports
Exchange
Overview of results
Exchange revenue was down 1% to £244.3m (FY13: £247.5m). The first half of the year saw a decline of 7%,
largely due to the absence of a major international football tournament (Euro 2012) and the adverse impact of market exits. In sustainable markets Exchange revenue was up 2%.
Operational developments
We continue to focus on increasing liquidity on the Exchange, recognising that this is the key factor behind
attracting and retaining customers and the ultimate driver of better value. Price Rush is one high-profile way
we are boosting liquidity and we continue to work on initiatives to increase activity in less liquid markets.
The Exchange remains a natural home of in-play sports betting and this year has seen strong revenue
performance in sports that have trading dimensions such as Tennis and Cricket. The 2014 World T20 cricket tournament saw close to £1bn matched between customers. The 2013 home Ashes series was also popular
with the dramatic First Test at Trent Bridge becoming the second highest single event traded ever on the
Exchange at £61m. The historic 2013 Wimbledon final between Andy Murray and Novak Djokovic saw £48m traded across all markets.
Mobile is an extremely important channel, with around 52% of active Exchange customers placing a bet via mobile in the year. We have also continued to improve our products for our high end Exchange customers,
with a number of improvements to our Application Programming Interface (API), which allows customers to bet directly into our Exchange without using our own website or mobile channels, launched over the year.
The hugely popular Cash Out product started on the Exchange. We have recently taken the concept further
through Cash Out+, which allows customers to partially cash out their bets, further differentiating the product from competitors’ offerings.
Sportsbook
Overview of results
Sportsbook revenue grew by 50% to £36.2m (FY13: £24.1m) following a 50% rise in the number of active
customers.
Operational developments
The focus in FY14 was on creating a competitive Sportsbook and we are now entering an exciting development phase where innovative products are making our product stand out from a crowded
marketplace.
For a new product in a competitive marketplace, the underlying performance of the Sportsbook has been highly encouraging. Volume more than doubled over the year, with particularly high levels of activity on
football. We now offer fixed odds betting on 30 sports and have continued to broaden our market coverage in order to build a fully competitive product. In April 2014 our Sportsbook ran 4,100 football matches, 1,200
tennis matches and 300 other sports events, which is three times the number of events offered at the start of the year. The number of in-play markets within these events also more than doubled over the year.
The Sportsbook has been placed at the centre of Betfair’s marketing and customer acquisition, with several
television advertising campaigns this year focusing on market-leading functions it possesses, such as the aforementioned Cash Out and more recently its ability to Price Rush bets to better odds through the
Exchange. This has come alongside more traditional promotional activity, with some of these offers now benefitting from Betfair’s technology capability, such as Cash Back Extra, which allows customers to select
their own trigger for returning stakes on losing bets. The interactive nature of these products has meant they
have become an organic source of social media and PR activity between Betfair and customers.
Mobile delivered 56% of all Sportsbook revenues in the year, rising to 64% in the fourth quarter.

6
Gaming
Overview of Results
Gaming revenue decreased by 13% to £66.2m (FY13: £75.9m). The reduction was primarily due to the continued decline in Poker and the adverse impact on other markets following the decision to focus on
sustainable revenues, partly offset by UK Casino growth. In sustainable markets, Gaming revenue was up 2%
in the year.
Operational developments
We have taken significant steps to address two issues that have affected Betfair’s ability to compete in Gaming: by closing product gaps and improving cross-sell from recreational sports customers.
The work undertaken falls broadly into two areas. Firstly, we have made product upgrades to our Casino so
that it now hosts the top level of content offered by Playtech, launching popular new features such as Live Dealer and more recently a tailored site for VIPs, a key way of serving and driving revenues from this
important customer group.
Accompanying this has been structural work designed to make our site easier for customers to use. Customers
now get a more intuitive welcome experience, meaning a higher percentage of new sign ups now fund their accounts. We have launched a seamless wallet between sports and gaming products, meaning it is now easier
for customers to use funds between Sports and Gaming. This, alongside more effective promotional activity, is
increasing our cross-sell from Sports into Gaming.
We have recognised the need to make a greater impact across all channels and have subsequently made
significant investment in mobile gaming, recently launching new Bingo and Casino Mobile Apps. The number of active customers using mobile rose 155% year on year, with mobile revenues up 235% year on year.
Betfair US
Betfair US now consists of two operations:
(i) TVG - an advanced deposit horserace wagering business, which operates primarily in both
California and New Jersey; and
(ii) Betfair New Jersey, a new online Casino site that was launched in November 2013 following the
regulation of online gaming in the state.
TVG performed well in FY14, against a weak economic backdrop in the US Racing industry. Revenues increased 19% (constant currency) to £44.5m as handle, which is the volume of wagers placed, increased by
33% (constant currency) against a wider industry handle that was flat in the period. This was helped by the
launch of advanced deposit wagering in New Jersey following our exclusive agreement to operate the 4NJbets platform on behalf of the State of New Jersey and the racing industry. Since taking over the responsibility for
the platform, TVG has modernised the product offering, helping to drive a 57% increase in wagering volumes. The revenue growth and management of costs have resulted in substantial margin expansion.
The business has continued to make significant strides; recently investing to upgrade the TVG cable channel
to High Definition, which we believe will consolidate our viewing share in the future. The attractiveness of the TVG brand worldwide was recently illustrated by the signing of a strategic partnership with the world famous
Hong Kong Jockey Club, which will link pari-mutuel wagering from both the US and Hong Kong for the first time.
Betfair New Jersey was launched in November 2013. Whilst the overall market size is smaller than originally expected, Betfair New Jersey’s total gross gaming revenue (GGR) was £1.8m, representing a 6% share of the
nascent market. Our share of the casino market to date is 8%.

7
Regulation
Betfair continues to operate within an evolving regulatory environment and there have been a number of
significant developments in the past year.
UK and Ireland
The Government has recently introduced legislation that will change the basis of licensing and taxation to a
point of consumption basis from December 2014. This will require all operators selling into the UK market, whether based domestically or overseas, to hold a UK Gambling Commission licence to transact and advertise
within the UK and to pay betting duty at a rate of 15% of revenue generated from UK persons.
Betfair continues to engage with the Government to emphasise the importance of effective enforcement of
any new rules to ensure player protection and fair competition in the marketplace.
We expect a system of taxation for online sports betting to be in place in Ireland before the end of FY15, although exact timings remain uncertain. The Irish government is considering introducing a new licensing
system for operators although the timeline for its introduction is also uncertain.
International
Betfair continues to engage within international markets where there is the prospect of fair and workable regulation.
We have seen significant developments in the US this year, with New Jersey opening its market for online
gaming to sites run by partnerships between online operators and local casinos. Betfair has partnered with the Trump Plaza Casino and in November 2013 was one of several operators to be awarded a ‘Transactional
Waiver’, which allowed us to launch our new site www.betfaircasino.com in New Jersey.
In Italy, we have recently launched our Exchange with national liquidity, having worked with the regulator for
a significant period of time to achieve this. Over the past year we have been building our brand presence in
the Italian market, launching a new Italian Sportsbook in November 2013 which featured a major update to the site’s design and functionality. The Exchange launch supports our strategy to grow sustainable revenues
and to find new overseas markets.
We have recently been awarded a licence in Bulgaria and launched an Exchange in April 2014 which now
operates in line with the country’s newly adopted online gaming regulation, taxing operators at 20% of gross gaming revenue.
We continue to monitor developments elsewhere and participate where appropriate. Whilst we cannot predict
with any degree of certainty, we continue to expect further market exits from territories where the future of online gaming regulation is unclear. We are particularly monitoring current developments in Eastern European
territories. Our objective remains to mitigate any loss of revenue from other markets through the ongoing growth of sustainable revenues.
Gaming taxes
If both the proposed UK and Irish taxation changes had been in place for the whole of FY14 along with the gaming taxes we are now incurring in Italy, we estimate that the cost would have been approximately £36m.

8
FINANCIAL REVIEW
Summary
Revenue increased by 2% to £393.6m (FY13: £387.0m), with strong growth in Sportsbook and Betfair US
partly offset by a weak Gaming performance. Revenue included significant adverse impacts from market exits
(£13.3m revenue impact from Greece, Germany, Cyprus & Spain) and the absence of a major international
football tournament (FY13: £7.8m revenue from Euro 2012).
Reported profit before tax for the year was £61.1m (FY13 loss: £49.4m). In the prior year £104.5m of
expenses and charges were separately disclosed due to their exceptional nature. These items included non-
cash charges relating to impairment of the carrying values of goodwill and other intangible assets, as well as
restructuring costs. The prior year also included £16.8m profits arising on disposal of Kabam.
Management believes that underlying results, which exclude these separately disclosed items, provide
additional guidance to statutory measures to help understand the underlying performance of the business
during the financial year. Underlying EBITDA was up 24% to £91.1m (FY13: £73.3m) and underlying profit
before tax was up 61% to £61.1m (FY13: £38.0m), with the improvement driven primarily by the cost savings
announced in FY13. This, along with lower depreciation and amortisation, resulted in underlying basic
earnings per share increasing by 57% to 49.0 pence (FY13: 31.2 pence).
The Group ended the year with a cash balance of £209.8m (FY13: £168.1m) and no debt.
Year ended 30 April FY14 £m
FY13 £m
Change %
Revenue 393.6 387.0 +2%
EBITDA 91.1 51.2 +78% Underlying EBITDA 1 91.1 73.3 +24%
Operating profit / (loss) 61.6 (69.0) N/A Underlying operating profit 1 61.6 35.5 +74%
Profit / (loss) before tax 61.1 (49.4) N/A Underlying profit before tax 1 61.1 38.0 +61%
Profit / (loss) for the year Underlying profit for the year ¹
51.0 51.0
(45.2) 31.8
N/A +60%
Earnings / (loss) per share 49.0p (44.4p) N/A Underlying earnings per share 1 49.0p 31.2p +57% 1 Underlying figures in FY13 are stated after making a number of adjustments in order to aid comparability between periods. A
reconciliation of reported figures to underlying figures is set out on page 11.
Revenue
Year ended 30 April FY14 £m
FY13 £m
Change %
Exchange 244.3 247.5 -1% Sportsbook ² 36.2 24.1 +50% Gaming 66.2 75.9 -13% Management of customer funds 1.2 1.5 -20% Betfair US 45.7 38.0 +20%
Total Revenue 393.6 387.0 +2% 2 Sportsbook represents the segment previously described as Sports
Exchange revenue was down 1% to £244.3m (FY13: £247.5m). The first half of the year saw a decline of 7%,
largely due to the absence of a major international football tournament and the adverse impact of market
exits.
Sportsbook revenue was up 50% to £36.2m (FY13: £24.1m), driven by a 137% increase in the amount staked
following a 50% rise in the number of active customers.
Gaming revenue decreased by 13% to £66.2m (FY13: £75.9m). This was primarily due to the continued
decline in poker and lower revenues in other markets following the decision to focus on sustainable
jurisdictions, partly offset by UK Casino growth.

9
US Revenue increased by 20% to £45.7m (FY13: £38.0m), mainly driven by TVG where handle (which is the
volume of wagers placed) and revenue increased by 33% and 19% respectively (both constant currency).
Revenue was also boosted by the launch of New Jersey Casino in H2 (£1.8m).
Revenue (£m) Q1 Q2 Q3 Q4 FY14 Q1 Q2 Q3 Q4 FY13
Sustainable markets Growth
69.9 -7%
75.4 11%
73.2 12%
87.6 23%
306.1 9%
75.5
67.7 65.3 71.5 280.0
Other markets Growth
20.5 -28%
22.2 -23%
22.2 -12%
22.6 -8%
87.5 -18%
28.3 29.0 25.2 24.5 107.0
Total revenue Growth
90.4 -13%
97.6 1%
95.4 5%
110.2 15%
393.6 2%
103.8 96.7 90.5 96.0 387.0
Revenue from sustainable markets (UK, Ireland, US, Denmark, Malta, Gibraltar) in FY14 was up 9% driven by
the UK, following the launch of the new Sportsbook, and the US. Revenue from other markets was down
18%, driven by regulatory changes in Greece, Germany, Cyprus and Spain, as well as the decision to focus
investment on sustainable markets. The remaining £87.5m revenue in other markets comprises over 100
countries, with only five contributing more than 1% and none contributing more than 3%.
Actives (k) Q1 Q2 Q3 Q4 FY14 Q1 Q2 Q3 Q4 FY13
Sustainable markets Growth
396 10%
393 28%
424 26%
571 31%
854 27%
359 307 336 437 674
Other markets Growth
134 -31%
147 -19%
137 -23%
143 -1%
275 -26%
195 181 177 145 372
Total actives Growth
530 -4%
540 11%
561 9%
714 23%
1,129 8%
554 488 513 582 1,046
The number of active customers in FY14 increased by 8% to 1,129,000 (FY13: 1,046,000). The number of
active customers in sustainable markets increased significantly, up 27% to 854,000, while the number of
actives in other markets was down 26% to 275,000.
Administrative expenses 3 4
Year ended 30 April FY14 £m
FY13 £m
Change %
Sales and marketing 124.2 113.0 +10% Technology 60.1 63.0 -5% Operations 35.1 41.9 -16% G&A 32.2 46.0 -30% Operating expenses 251.6 263.9 -5% Separately disclosed items – restructuring and other - 22.1 -100% Separately disclosed items – impairment - 82.4 -100% Depreciation and amortisation 29.5 37.8 -22%
Total administrative expenses 281.1 406.2 -31%
3 Facilities costs have been reclassified from G&A to Operations (£10.1m in FY13). 4 Betfair US costs are now reported within Sales and marketing, Technology, Operations and G&A (£36.2m in FY14, £27.2m in FY13).
Average headcount during the period of 1,739 was significantly lower than the prior year (FY13: 2,066), with
headcount reductions across most areas of the business.
Sales and marketing spend increased by 10%, reflecting additional TV advertising on Sky Sports, ITV Football
and Channel 4 Racing, as well as investment in our New Jersey online casino. As a proportion of total
revenue, sales and marketing spend increased to 32% (29% in FY13)4.
Technology costs before capitalisation of internal development expenditure were down 16% on the prior year
following headcount reductions, a shift of development activity to Romania and Portugal and savings from
external suppliers. In FY14, £7.4m of internal development expenditure was capitalised compared with
£17.4m in FY13. Technology costs after this capitalisation were down 5% on the prior year.
Operations spend was down 16% in the period, with savings in office costs partly offset by increased
investment in customer services resources to support the growing customer base.
General & administrative (G&A) costs were down 30%, primarily driven by lower headcount.

10
Depreciation and amortisation of £29.5m was 22% lower than prior year (FY13: £37.8m) as a result of lower
capital expenditure and the impairment of intangible assets in FY13.
EBITDA
Year ended 30 April FY14 £m
FY13 £m
Change %
EBITDA 91.1 51.2 +78% Betfair excl. US 89.1 70.4 +27% Betfair US Underlying EBITDA 1
2.0 91.1
2.9 73.3
-31% +24%
EBITDA increased by 78% to £91.1m, partly due to separately disclosed items (restructuring and other) in the
prior year (FY13: £22.1m). Excluding these, Underlying EBITDA increased by 24% to £91.1m.
Underlying EBITDA excluding US increased by 27% to £89.1m (FY13: £70.4m), with the improvement driven
primarily by the cost savings announced in FY13.
Betfair US Underlying EBITDA decreased by 31% to £2.0m (FY13: £2.9m). A positive performance in TVG,
driven by a combination of increased operating leverage and cost savings, was offset by significant start-up
costs incurred as part of our multi-year investment in New Jersey Casino. In addition to the start-up costs
already incurred, the Group has committed to prepay a revenue share to a third party which is contingent on
that third party meeting specific requirements. As at 30 April 2014, the Group deems the fulfilment of these
criteria as uncertain. In the event that the payment was to crystallise, there would be no significant impact on
the profitability of the Group.
Finance income and expenses
Net interest income from corporate funds was £0.7m (FY13: income of £1.4m). Total finance income and
expenses include a net foreign exchange loss of £0.4m (FY13: gain of £0.3m). Excluding the foreign exchange
impact, finance income of £1.1m was unchanged from prior year.
Share of profit from equity accounted investments – Betfair Australia
Our share of operating losses in Betfair Australia was £1.2m (FY13: profit of £1.4m), driven by a combination
of increased marketing spend and higher variable costs reflecting additional race fields fees (charges for
betting operators set by state racing authorities).
Taxation
The Group had a tax charge of £10.1m in the period (FY13: credit of £4.2m). The Group’s effective and
underlying tax rate was 16.5% (FY13 underlying: 16.4%) and we continue to expect the long-term
sustainable tax rate to remain around this level.
Dividend
The Board is recommending the payment of a final dividend of 14.0 pence per share. Together with the
interim dividend of 6.0 pence per share, the proposed full year dividend is 20.0 pence per share (FY13: 13.0
pence). The full year dividend represents 41% of profit after tax, in line with the company’s dividend policy.
The ex-dividend date will be 3 September 2014, the record date will be 5 September 2014 and payment will
be on 3 October 2014.
Capital expenditure
Year ended 30 April FY14
£m
FY13
£m
Change %
External capex Internal devex
15.0 7.4
17.9 17.4
-16% -57%
Total 22.4 35.3 -37%
Capital expenditure (capex) reduced to £22.4m (FY13: £35.3m), mostly due to lower capitalisation of internal
development spend (devex), as a higher proportion of this spend was expensed in the period. External capex

11
of £15.0m included investment in product innovation, technology infrastructure, TVG conversion to High
Definition and New Jersey Casino.
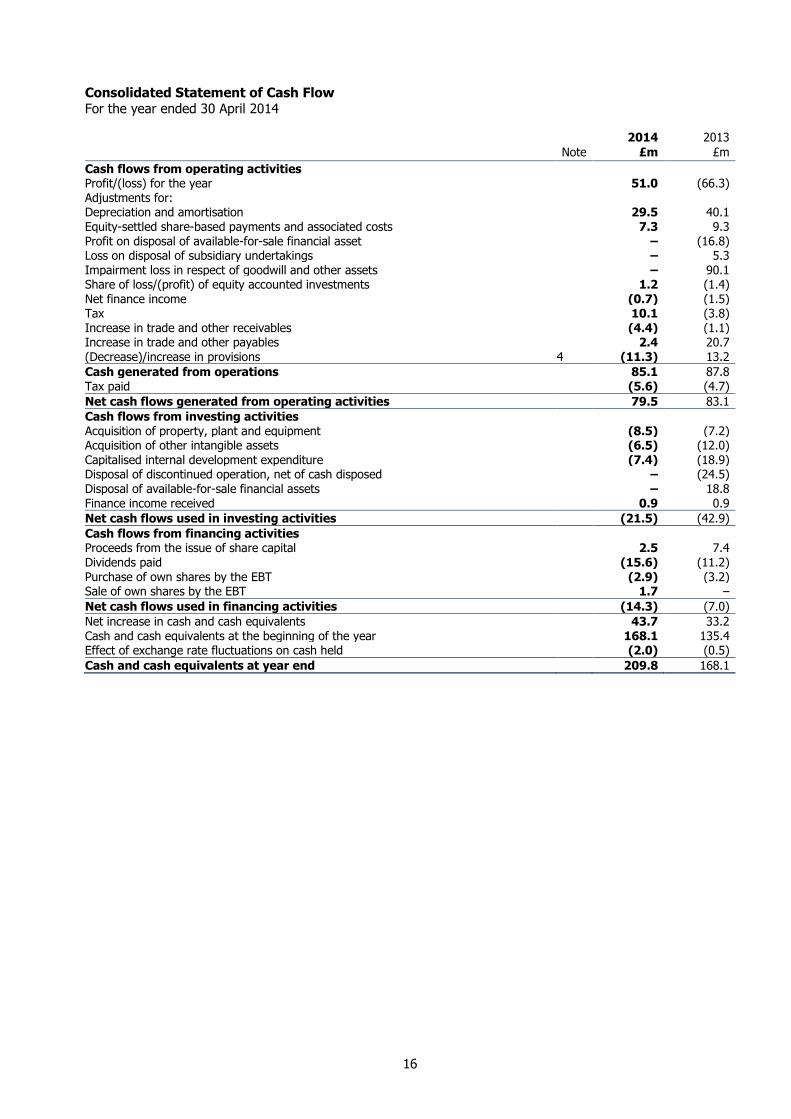
Cash and cash flow
Free cash flow was £58.0m in the period (FY13: £37.9m). This included £12.4m relating to separately
disclosed items recognised in the prior year. Excluding these items, underlying free cash flow increased by
40% to £70.4m (FY13: £50.2m).
Cash at 30 April 2014 was £209.8m (30 April 2013: £168.1m).
Year ended 30 April 5
FY14 £m
FY13 £m
Underlying free cash flow 70.4 50.2 Cash flow from separately disclosed items (12.4) (12.3)
Free cash flow 58.0 37.9
Dividends paid (15.6) (11.2) Disposal of Kabam - 18.8 Other 6 1.3 4.3
Net increase in cash and cash equivalents 7 43.7 49.8
5 Continuing operations 6 Other is comprised of the net purchase of own shares and proceeds from the issue of share capital 7 Excludes the effect of exchange rate fluctuations on cash held
Year ended 30 April
FY14 £m
FY13 £m
Cash and cash equivalents as at 30 April 209.8 168.1
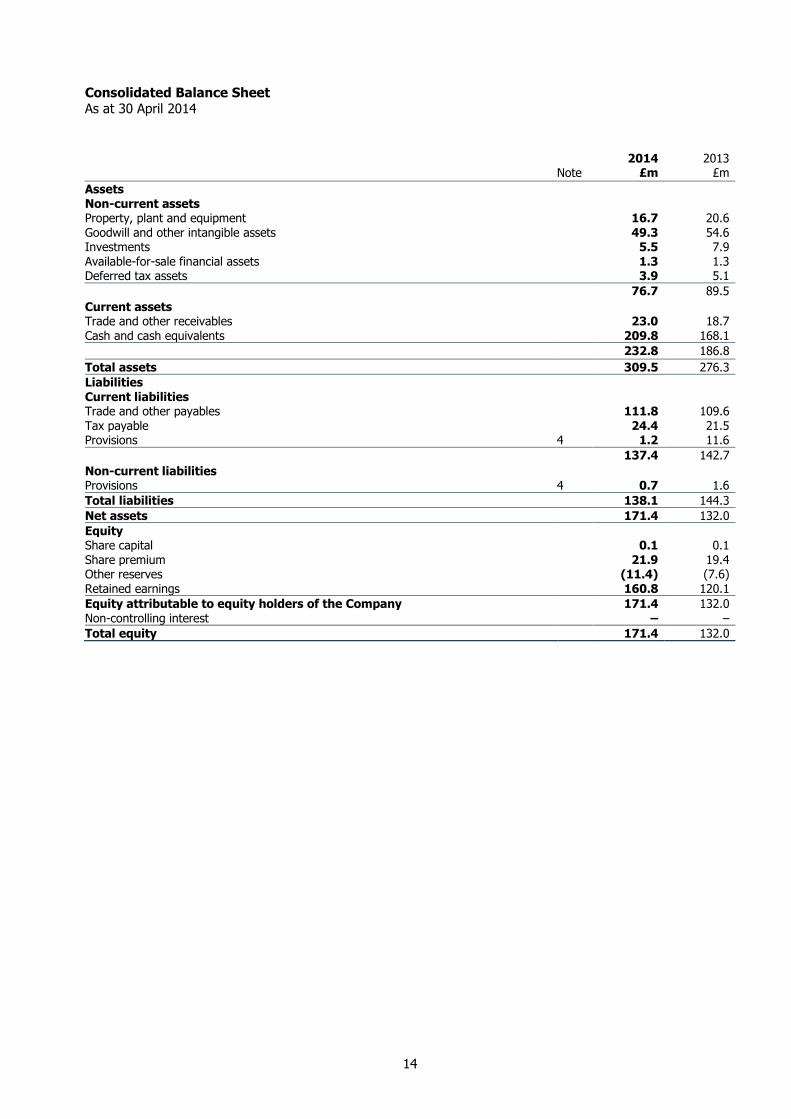
Balance Sheet
The Group ended the year in a strong financial position, with net assets of £171.4m (FY13: £132.0m). Total
assets were £309.5m (FY13: £276.3m) of which 75% were current assets (FY13: 68%).
Current assets increased primarily as a result of the positive cash generated from operations in the year, while an increase in trade and other receivables was predominantly due to additional prepaid marketing expenses.
Current liabilities reduced from £142.7m to £137.4m as a result of a reduction in provisions, including the
utilisation of the redundancy provision that was established in the prior year (FY13: £9.7m). This was offset
by increases in trade and other payables due to additional marketing activity.
Reconciliation of Reported to Underlying
Year ended 30 April 2013 Revenue
£m
EBITDA
£m
Operating Profit
(loss) £m
Profit/(loss) for the year
£m
EPS
£p
FY13 reported – continuing & discontinued 391.1 45.7 (84.5) (66.3) (65.1) Discontinued operations (4.1) 5.5 15.5 21.1 20.7 FY13 reported - continuing 387.0 51.2 (69.0) (45.2) (44.4) Separately disclosed items – restructuring & other 22.1 22.1 22.1 21.7 Separately disclosed items - impairment 82.4 82.4 80.9 Disposal of Kabam (16.8) (16.5) Net foreign exchange gains (0.3) (0.3) Tax Effect of Adjustment (10.4) (10.2)
FY13 underlying 387.0 73.3 35.5 31.8 31.2

12
Consolidated Income Statement
For the year ended 30 April 2014
Note 2014
£m 2013
£m
Continuing operations
Revenue 1 393.6 387.0
Cost of sales (50.9) (49.8)
Gross profit 342.7 337.2
Administrative expenses (281.1) (406.2)
Group operating profit/(loss) 61.6 (69.0)
Analysed as:
Underlying EBITDA* (excluding separately disclosed items) 1 91.1 73.3
Separately disclosed items – restructuring and other – (22.1)
EBITDA* 1 91.1 51.2
Separately disclosed items - impairment of goodwill and other intangible assets – (82.4)
Depreciation and amortisation (29.5) (37.8)
Group operating profit/(loss) 61.6 (69.0)
Profit on disposal of available-for-sale financial asset – 16.8
Finance income 1.1 1.4
Finance expense (0.4) –
Net finance income 0.7 1.4
Share of (loss)/profit of equity accounted investments (1.2) 1.4
Profit/(loss) before tax 61.1 (49.4)
Tax 2 (10.1) 4.2
Profit/(loss) for the year from continuing operations 51.0 (45.2)
Discontinued operations
Loss for the year/period from discontinued operations, net of tax – (21.1)
Profit/(loss) for the year 51.0 (66.3)
Attributable to:
Equity holders of the Company 51.0 (66.3)
Non-controlling interest – –
Profit/(loss) for the year 51.0 (66.3)
Earnings/(loss) per share from continuing operations
Basic 49.0p (44.4)p
Diluted** 48.1p (44.4)p
Earnings/(loss) per share from continuing and discontinued operations
Basic 3 49.0p (65.1)p
Diluted** 3 48.1p (65.1)p
* EBITDA is defined as Group operating profit before net finance income, tax, impairment, depreciation and amortisation. It excludes amounts in respect
of the Group’s equity accounted investments and is considered by the Directors to be a key measure of its financial performance.
Underlying EBITDA is defined as EBITDA before separately disclosed items.
** Where any potential ordinary shares would have the effect of decreasing a loss per share, they have not been treated as dilutive.
13
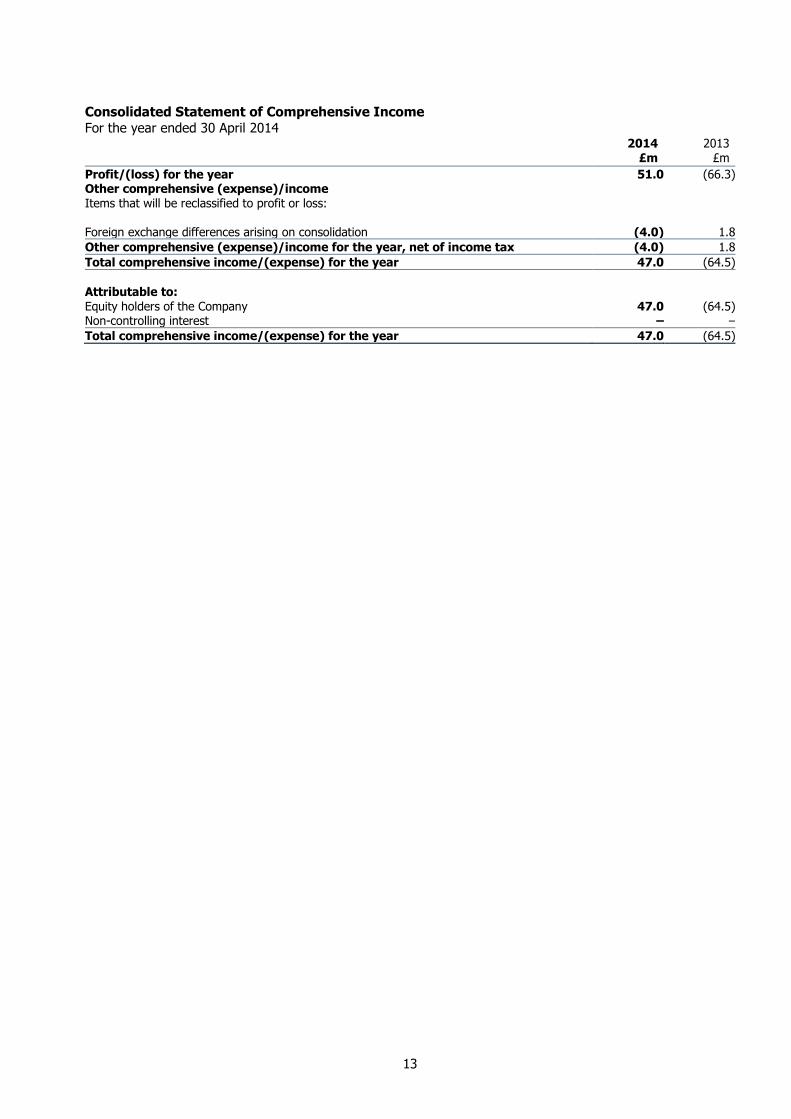
Consolidated Statement of Comprehensive Income
For the year ended 30 April 2014
2014 £m
2013 £m
Profit/(loss) for the year 51.0 (66.3) Other comprehensive (expense)/income Items that will be reclassified to profit or loss:
Foreign exchange differences arising on consolidation (4.0) 1.8
Other comprehensive (expense)/income for the year, net of income tax (4.0) 1.8
Total comprehensive income/(expense) for the year 47.0 (64.5)
Attributable to:
Equity holders of the Company 47.0 (64.5) Non-controlling interest – –
Total comprehensive income/(expense) for the year 47.0 (64.5)
14
Consolidated Balance Sheet As at 30 April 2014
Note 2014
£m 2013
£m
Assets Non-current assets Property, plant and equipment 16.7 20.6 Goodwill and other intangible assets 49.3 54.6 Investments 5.5 7.9 Available-for-sale financial assets 1.3 1.3 Deferred tax assets 3.9 5.1
76.7 89.5
Current assets Trade and other receivables 23.0 18.7 Cash and cash equivalents 209.8 168.1
232.8 186.8
Total assets 309.5 276.3
Liabilities Current liabilities Trade and other payables 111.8 109.6 Tax payable 24.4 21.5 Provisions 4 1.2 11.6
137.4 142.7
Non-current liabilities Provisions 4 0.7 1.6
Total liabilities 138.1 144.3
Net assets 171.4 132.0
Equity Share capital 0.1 0.1 Share premium 21.9 19.4 Other reserves (11.4) (7.6) Retained earnings 160.8 120.1
Equity attributable to equity holders of the Company 171.4 132.0 Non-controlling interest – –
Total equity 171.4 132.0
15
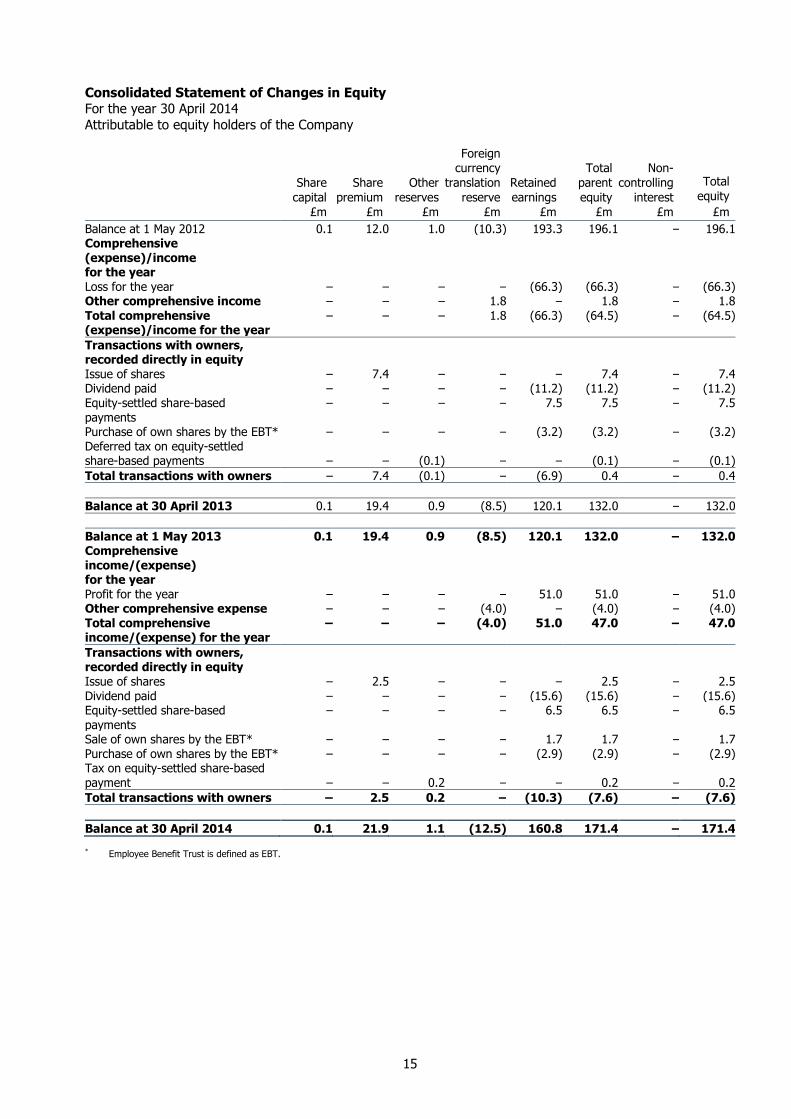
Consolidated Statement of Changes in Equity For the year 30 April 2014
Attributable to equity holders of the Company
Share
capital
£m
Share
premium
£m
Other
reserves
£m
Foreign currency
translation
reserve
£m
Retained
earnings
£m
Total
parent
equity
£m
Non-
controlling
interest
£m
Total
equity
£m
Balance at 1 May 2012 0.1 12.0 1.0 (10.3) 193.3 196.1 – 196.1 Comprehensive (expense)/income for the year
Loss for the year – – – – (66.3) (66.3) – (66.3) Other comprehensive income – – – 1.8 – 1.8 – 1.8
Total comprehensive (expense)/income for the year
– – – 1.8 (66.3) (64.5) – (64.5)
Transactions with owners, recorded directly in equity
Issue of shares – 7.4 – – – 7.4 – 7.4 Dividend paid – – – – (11.2) (11.2) – (11.2) Equity-settled share-based payments
– – – – 7.5 7.5 – 7.5
Purchase of own shares by the EBT* – – – – (3.2) (3.2) – (3.2) Deferred tax on equity-settled share-based payments – – (0.1) – – (0.1) – (0.1)
Total transactions with owners – 7.4 (0.1) – (6.9) 0.4 – 0.4
Balance at 30 April 2013 0.1 19.4 0.9 (8.5) 120.1 132.0 – 132.0
Balance at 1 May 2013 0.1 19.4 0.9 (8.5) 120.1 132.0 – 132.0 Comprehensive income/(expense) for the year
Profit for the year – – – – 51.0 51.0 – 51.0 Other comprehensive expense – – – (4.0) – (4.0) – (4.0) Total comprehensive income/(expense) for the year
– – – (4.0) 51.0 47.0 – 47.0
Transactions with owners, recorded directly in equity
Issue of shares – 2.5 – – – 2.5 – 2.5 Dividend paid – – – – (15.6) (15.6) – (15.6) Equity-settled share-based
payments
– – – – 6.5 6.5 – 6.5
Sale of own shares by the EBT* – – – – 1.7 1.7 – 1.7 Purchase of own shares by the EBT* – – – – (2.9) (2.9) – (2.9) Tax on equity-settled share-based payment – – 0.2 – – 0.2 – 0.2
Total transactions with owners – 2.5 0.2 – (10.3) (7.6) – (7.6)
Balance at 30 April 2014 0.1 21.9 1.1 (12.5) 160.8 171.4 – 171.4
* Employee Benefit Trust is defined as EBT.
16
Consolidated Statement of Cash Flow For the year ended 30 April 2014
Note
2014
£m
2013
£m
Cash flows from operating activities Profit/(loss) for the year 51.0 (66.3) Adjustments for: Depreciation and amortisation 29.5 40.1 Equity-settled share-based payments and associated costs 7.3 9.3 Profit on disposal of available-for-sale financial asset – (16.8) Loss on disposal of subsidiary undertakings – 5.3 Impairment loss in respect of goodwill and other assets – 90.1 Share of loss/(profit) of equity accounted investments 1.2 (1.4) Net finance income (0.7) (1.5) Tax 10.1 (3.8) Increase in trade and other receivables (4.4) (1.1) Increase in trade and other payables 2.4 20.7 (Decrease)/increase in provisions 4 (11.3) 13.2
Cash generated from operations 85.1 87.8 Tax paid (5.6) (4.7)
Net cash flows generated from operating activities 79.5 83.1
Cash flows from investing activities Acquisition of property, plant and equipment (8.5) (7.2) Acquisition of other intangible assets (6.5) (12.0) Capitalised internal development expenditure (7.4) (18.9) Disposal of discontinued operation, net of cash disposed – (24.5) Disposal of available-for-sale financial assets – 18.8 Finance income received 0.9 0.9
Net cash flows used in investing activities (21.5) (42.9)
Cash flows from financing activities Proceeds from the issue of share capital 2.5 7.4 Dividends paid (15.6) (11.2) Purchase of own shares by the EBT (2.9) (3.2) Sale of own shares by the EBT 1.7 –
Net cash flows used in financing activities (14.3) (7.0)
Net increase in cash and cash equivalents 43.7 33.2 Cash and cash equivalents at the beginning of the year 168.1 135.4 Effect of exchange rate fluctuations on cash held (2.0) (0.5)
Cash and cash equivalents at year end 209.8 168.1

17
NOTES (forming part of the financial statements)
1 Operating segments
The Group’s continuing operating businesses are organised and managed as reportable business segments according to the information which is used by the Group’s CODM in making decisions about reporting matters.
Following the disposal of LMAX in the year ended 30 April 2013, the segment previously disclosed as Other Investments now only comprises Betfair US.
As a result, management considers that it is more appropriate to provide segmental disclosures as follows:
Betfair excl. US
Exchange
Sportsbook
Gaming
Management of customer funds
Betfair US
Exchange consists of the Exchange sports betting product and includes Timeform. Sportsbook (previously
described as Sports) consists of the Sportsbook product and Multiples. Gaming consists of various Casino products and bespoke Exchange games products. Tradefair Spreads and Poker are also classified within
Gaming. All of these gaming activities are played by customers in a number of geographical areas.
Exchange and Gaming meet the quantitative thresholds required by IFRS 8 as reportable segments. While Sportsbook and revenue from the Management of customer funds do not meet these requirements, these
segments are separately disclosed as they are closely monitored by the CODM.
Betfair US (including the TVG Network) meets the quantitative threshold to be disclosed separately.
The results of the Australian joint venture are consolidated in the Group accounts on an equity accounting basis. As such only the net assets and the share of profits/(losses) are presented in the operating segment
note below. If proportional consolidation was applied the Group’s share of the Australian joint venture would
have increased revenue by £15.4m (30 April 2013: £18.0m) and decreased EBITDA by £0.1m (30 April 2013: increase of £2.1m).
The revenue from Exchange, Sportsbook, Gaming and the Management of customer funds represents the developed and integrated parts of the Group’s business and has been grouped together as Betfair excl. US.
The Group focuses its internal management reporting predominantly on revenue, as the products’ potential to
generate revenue is the chief driver of the Group’s business and the allocation of resources. The Group’s cost base is to a large extent fixed in nature. Corporate expenses, assets and liabilities cannot be allocated to
individual operating segments and are not used by the CODM for making operating and resource allocation decisions. However, expenses are allocated and reviewed by the CODM between Betfair excl. US and Betfair
US and the analysis of EBITDA for them is summarised below.
Management also reviews Group revenue on a geographic basis, determined by the location of the customers. This information is analysed below on the following basis:
UK
Rest of World
The majority of the Group’s non-current assets are located in the UK.
18
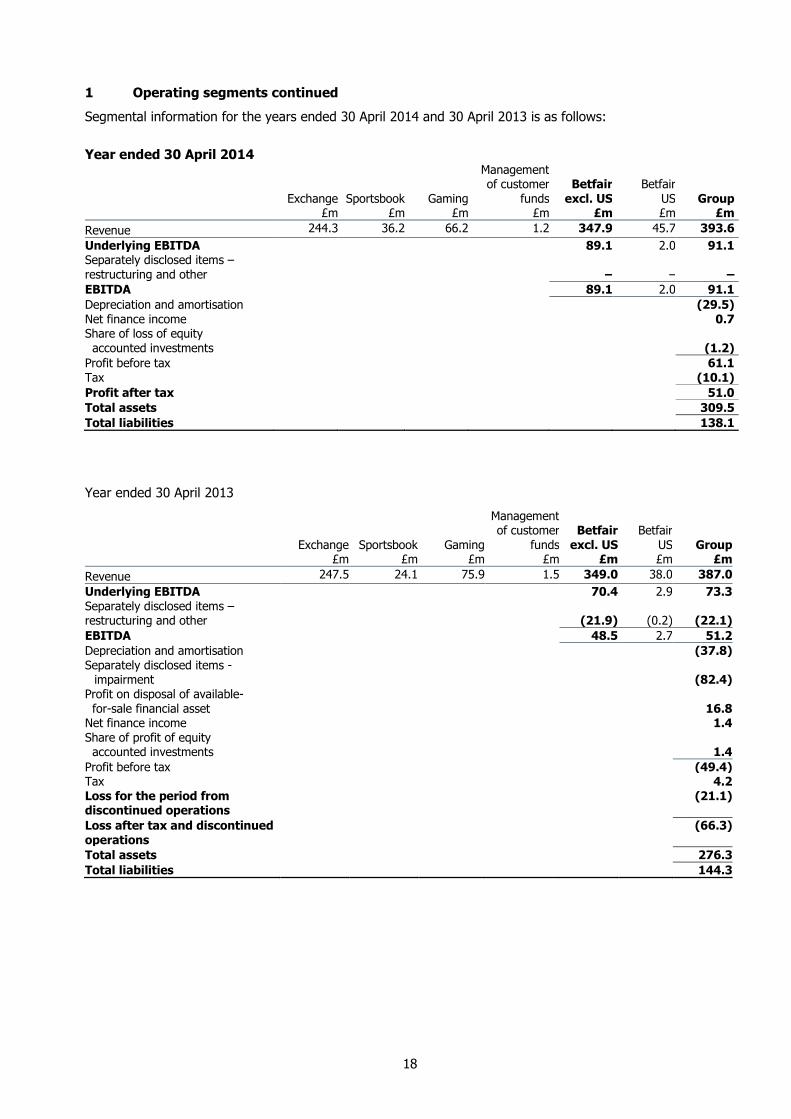
1 Operating segments continued
Segmental information for the years ended 30 April 2014 and 30 April 2013 is as follows:
Year ended 30 April 2014
Exchange
£m Sportsbook
£m Gaming
£m
Management of customer
funds £m
Betfair
excl. US £m
Betfair US £m
Group £m
Revenue 244.3 36.2 66.2 1.2 347.9 45.7 393.6
Underlying EBITDA 89.1 2.0 91.1 Separately disclosed items – restructuring and other
–
– –
EBITDA 89.1 2.0 91.1
Depreciation and amortisation (29.5) Net finance income 0.7 Share of loss of equity accounted investments (1.2)
Profit before tax 61.1 Tax (10.1)
Profit after tax 51.0
Total assets 309.5
Total liabilities 138.1
Year ended 30 April 2013
Exchange
£m Sportsbook
£m Gaming
£m
Management of customer
funds £m
Betfair
excl. US £m
Betfair US £m
Group £m
Revenue 247.5 24.1 75.9 1.5 349.0 38.0 387.0
Underlying EBITDA 70.4 2.9 73.3 Separately disclosed items – restructuring and other
(21.9)
(0.2) (22.1)
EBITDA 48.5 2.7 51.2
Depreciation and amortisation (37.8) Separately disclosed items -
impairment
(82.4) Profit on disposal of available- for-sale financial asset
16.8
Net finance income 1.4 Share of profit of equity accounted investments 1.4
Profit before tax (49.4) Tax 4.2 Loss for the period from discontinued operations
(21.1)
Loss after tax and discontinued operations
(66.3)
Total assets 276.3
Total liabilities 144.3

19
1 Operating segments continued
Geographical information determined by location of customers is set out below:
Year ended 30 April 2014
UK
Sustainable
£m
Rest of
World
Sustainable
£m
Total
Sustainable
£m
Rest of
World
Other
£m
Group
£m
Betfair excl. US 246.4 14.0 260.4 87.5 347.9 Betfair US – 45.7 45.7 – 45.7
Total Group revenue 246.4 59.7 306.1 87.5 393.6
Year ended 30 April 2013
UK
Sustainable £m
Rest of World
Sustainable £m
Total
Sustainable £m
Rest of World Other
£m
Group £m
Betfair excl. US 228.6 13.4 242.0 107.0 349.0 Betfair US – 38.0 38.0 – 38.0
Total Group revenue 228.6 51.4 280.0 107.0 387.0
In prior years, revenue was recorded and disclosed on a registration basis. The CODM believes it is more reliable to assess the performance of the Group’s operations by analysing revenue from a residency basis
following regulatory changes in a number of jurisdictions. Comparatives for the year ended 30 April 2013 have therefore been restated accordingly. Revenue derived from customers located in Ireland is classified within
UK.
2 Tax
The Group’s consolidated effective tax rate for the year was 16.5% (30 April 2013: 8.5%).
The tax effect of separately disclosed items and impairment in the year amounted to £nil (30 April 2013: tax
credit of £10.4m).
The 2013 Budget on 25 March 2013 announced that the UK corporation tax rate will reduce to 20% by 2015.
A reduction in the rate from 24% to 23% (effective from 1 April 2013) was substantively enacted on 3 July 2012, and further reductions to 21% (effective from 1 April 2014) and 20% (effective from 1 April 2015) were
substantively enacted on 2 July 2013.
This will reduce the Group’s future current tax charge accordingly. The deferred tax liability at 30 April 2014 has been calculated based on the rate of 20% substantively enacted at the balance sheet date.
3 Earnings per share
Basic earnings per share
The calculation of basic earnings per share for the year ended 30 April 2014 was based on the profit
attributable to ordinary shareholders of £51.0m (30 April 2013: loss of £66.3m) and a weighted average
number of ordinary shares outstanding of 103,975,695 (30 April 2013: 101,854,246). The weighted average number of shares has been adjusted for amounts held by the Group’s EBT.
2014 2013
Profit/(loss) for the year (£m) 51.0 (66.3) Weighted average number of shares 103,975,695 101,854,246 Basic earnings/(loss) per share* 49.0p (65.1)p Diluted earnings/(loss) per share* 48.1p (65.1)p * The loss per share calculations in the prior year include the results of the discontinued operations.

20
3 Earnings per share continued
All earnings in the current year relate to continuing operations.
Diluted earnings per share
The calculation of diluted earnings per share for the year ended 30 April 2014 was based on the profit
attributable to ordinary shareholders of £51.0m (30 April 2013: loss of £66.3m) and a weighted average
number of ordinary shares outstanding after adjustment for the effect of all dilutive potential ordinary shares of 106,019,686 (30 April 2013: 103,378,698).
As any potential ordinary shares would have the effect of decreasing the loss per share for the year ended 30 April 2013, they have not been treated as dilutive.
Profit/(loss) used to determine diluted earnings/(loss) per share
2014 £m
2013 £m
Profit/(loss) used to determine diluted earnings/(loss) per share 51.0 (66.3)
Weighted average number of shares (diluted)
2014 2013
Weighted average number of ordinary shares (basic) 103,975,695 101,854,246 Effect of share options on issue 2,043,991 1,524,452
Weighted average number of ordinary shares (diluted) 106,019,686 103,378,698
The average market value of the Company’s shares of £9.89 (2013: £7.33) was used to calculate the dilutive
effect of share options based on the market value for the year that the options were outstanding.
4 Provisions
Redundancy provision
£m
Onerous contracts
£m Total
£m
Balance at 1 May 2012 – – – Provision accounted for in the year 9.7 1.9 11.6
Current provisions 30 April 2013 9.7 1.9 11.6 Utilised in the period (9.7) (1.6) (11.3) Reclassification from non-current* – 0.9 0.9
Current provisions 30 April 2014 – 1.2 1.2
Balance at 1 May 2012
–
–
– Provision accounted for in the year – 1.6 1.6
Non-current provisions 30 April 2013 – 1.6 1.6 Reclassification to current* – (0.9) (0.9)
Non-current provisions 30 April 2014 – 0.7 0.7 * Non-current provisions reflect contractual obligations that will be settled more than 12 months after the reporting date. During the period, £0.9m has
been reclassified from non-current provisions to current provisions.
The redundancy provision held at 30 April 2013 related to costs incurred as part of restructuring and cost
optimisation initiatives. All affected employees have now departed the Group.
Onerous contracts relate to provisions made in relation to operating leases for premises that were vacated
during the year ended 30 April 2013 as part of the restructuring.
Related Documents