1 Ref: Aşıkoğlu A., Vasconcelos G., Lourenço P.B., Pantò B. (2020) Pushover Analysis of Unreinforced Irregular Masonry Buildings: Lessons from Different Modeling Approaches, Eng Struct. doi: 10.1016/j.engstruct.2020. 110830 PUSHOVER ANALYSIS OF UNREINFORCED IRREGULAR MASONRY BUILDINGS: 1 LESSONS FROM DIFFERENT MODELING APPROACHES 2 Abide Aşıkoğlu *1a , Graça Vasconcelos 1b , Paulo B. Lourenço 1c , Bartolomeo Pantò 2d 3 Abstract 4 The present paper addresses the seismic performance of a half-scale two-story unreinforced 5 masonry (URM) building with structural irregularity in plan and in elevation. The main objectives 6 are (i) to understand the seismic response of URM buildings with torsional effects, and (ii) to 7 evaluate the reliability of using simplified approaches for irregular masonry buildings. For this 8 purpose, nonlinear static analyses are carried out by using three different modeling approaches, 9 based on a continuum model, beam-based and spring-based macro-element models. The 10 performance of each approach was compared based on capacity curves and global damage patterns. 11 Reasonable agreement was found between numerical predictions and experimental observations. 12 Validation of simplified approaches was generally provided with reference to regular structures but, 13 based on the differences in the base shear capacity found here, it appears that structural irregularities 14 are important to be taken into account for acquiring higher accuracy on simplified methods when 15 torsion is present. 16 Keywords: Unreinforced masonry, nonlinear static analysis, macro-element model, equivalent 17 frame model, finite element methods. 18 1 ISISE, Department of Civil Engineering, University of Minho, Azurém, 4800 -058 Guimarães, Portugal 2 Department of Civil and Environmental Engineering, Imperial College of London, SW7 2AZ, London, UK a Ph.D student, b Assistant professor, c Full professor, d Post-doc researcher * Corresponding author E-mail: [email protected]

Welcome message from author
This document is posted to help you gain knowledge. Please leave a comment to let me know what you think about it! Share it to your friends and learn new things together.
Transcript
1
Ref: Aşıkoğlu A., Vasconcelos G., Lourenço P.B., Pantò B. (2020) Pushover Analysis of Unreinforced Irregular
Masonry Buildings: Lessons from Different Modeling Approaches, Eng Struct. doi: 10.1016/j.engstruct.2020.
110830
PUSHOVER ANALYSIS OF UNREINFORCED IRREGULAR MASONRY BUILDINGS: 1
LESSONS FROM DIFFERENT MODELING APPROACHES 2
Abide Aşıkoğlu*1a, Graça Vasconcelos1b, Paulo B. Lourenço1c, Bartolomeo Pantò2d 3
Abstract 4
The present paper addresses the seismic performance of a half-scale two-story unreinforced 5
masonry (URM) building with structural irregularity in plan and in elevation. The main objectives 6
are (i) to understand the seismic response of URM buildings with torsional effects, and (ii) to 7
evaluate the reliability of using simplified approaches for irregular masonry buildings. For this 8
purpose, nonlinear static analyses are carried out by using three different modeling approaches, 9
based on a continuum model, beam-based and spring-based macro-element models. The 10
performance of each approach was compared based on capacity curves and global damage patterns. 11
Reasonable agreement was found between numerical predictions and experimental observations. 12
Validation of simplified approaches was generally provided with reference to regular structures but, 13
based on the differences in the base shear capacity found here, it appears that structural irregularities 14
are important to be taken into account for acquiring higher accuracy on simplified methods when 15
torsion is present. 16
Keywords: Unreinforced masonry, nonlinear static analysis, macro-element model, equivalent 17
frame model, finite element methods. 18
1 ISISE, Department of Civil Engineering, University of Minho, Azurém, 4800-058 Guimarães, Portugal 2 Department of Civil and Environmental Engineering, Imperial College of London, SW7 2AZ, London, UK a Ph.D student, b Assistant professor, c Full professor, d Post-doc researcher
* Corresponding author
E-mail: [email protected]
1. INTRODUCTION 19
Unreinforced masonry (URM) construction typology is widely used in construction practice and 20
constitutes a significant portion of the building stock as residential or commercial buildings in both 21
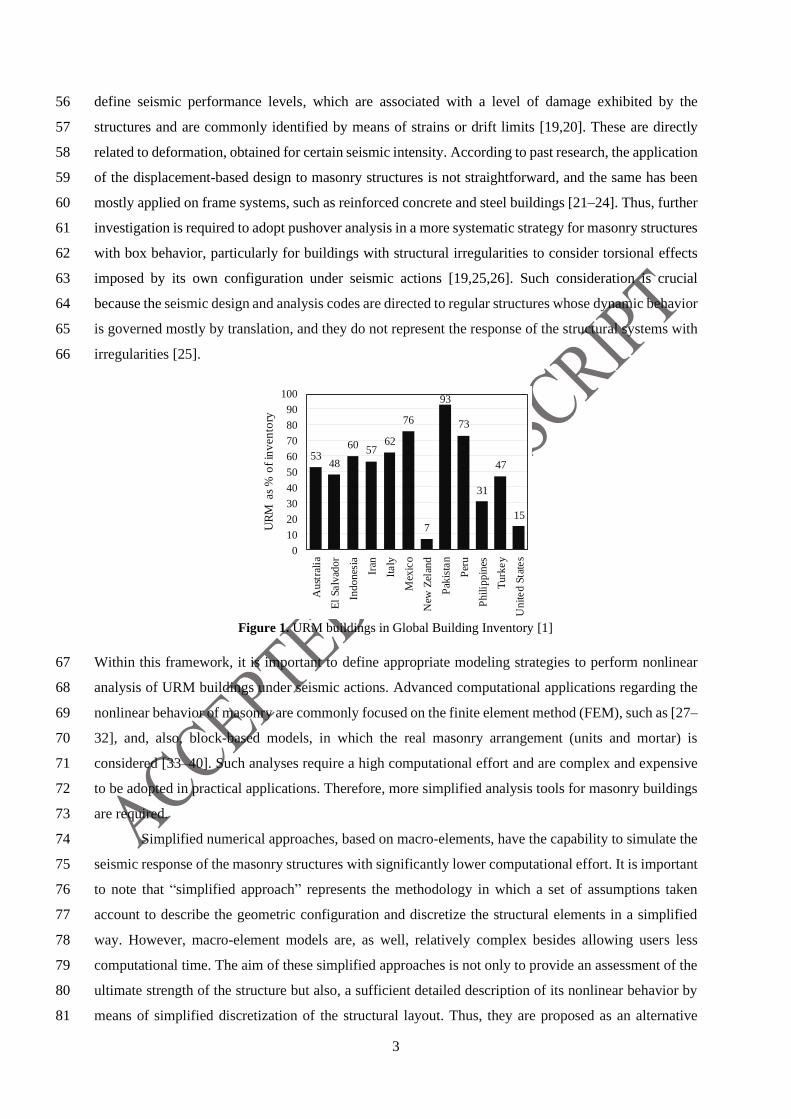
developed and developing countries [1]. Figure 1 intends to show the proportions of the masonry 22
buildings in several countries. It can be observed that a vast majority of building stock in Pakistan (93%), 23
Mexico (76%), Peru (73%) followed by Italy (62%) is composed of URM buildings which can be 24
categorized as existing and modern buildings. The former typology usually consists of historical 25
masonry buildings, made of stones or weak bricks with significantly large wall thickness and weak 26
connections between orthogonal walls. They generally show local seismic behavior due to existence of 27
flexible diaphragms weakly connected to the walls [2,3] . On the other hand, the modern buildings are 28
characterized by regular brick-masonry configuration with limited wall thickness. Furthermore, design 29
of the modern URM buildings require rigid floors and strong floor-to-wall connections to ensure that 30
the global seismic response is achieved through box-behavior [4]. Although it is a sustainable 31
construction solution owing to its thermal and acoustic efficiency, fire resistance, durability, and simple 32
construction technology, globally masonry has been losing market share. The main reason for this is the 33
appearance of other alternative solutions for low to medium-rise buildings, such as reinforced concrete 34
or steel, which have relatively lower seismic vulnerability comparing to the masonry buildings in 35
seismic areas. However, masonry construction is still extensively present in seismic prone zones [5,6]. 36
Past seismic events showed that the seismic vulnerability of unreinforced masonry structures is high due 37
to its low tensile strength, low ductility, and low energy dissipation capacity, particularly in the case of 38
existing buildings lacking “box-type” behavior [7–10]. The lack of seismic design rules for URM 39
buildings, which have been often designed mostly for vertical loads, also contributes to the high seismic 40
vulnerability. In this regard, many research studies have been carried out in order to improve masonry 41
structural systems under seismic actions and develop guidelines and tools for their seismic design [11–42
15]. 43
It is known that nonlinear dynamic analysis is the most accurate approach to simulate and assess 44
the seismic response of a structure [16,17]. Nevertheless, its application in engineering practice is 45
complex and requires high computational cost, time, and a high level of knowledge for the calibration 46
of the cyclic constitutive laws and the interpretation of the results. Response of structures is highly 47
dependent on the seismic input used in the dynamic analysis. Furthermore, there is a lack of standardized 48
verification procedures, in other terms, the evaluation of the seismic response of a building from the 49
output of dynamic analysis is not straightforward. Yet, linear elastic analysis does not represent the 50
behavior of the masonry building since the material response is highly non-linear regardless of low level 51
of loading. Therefore, nonlinear static (pushover) analysis has been often preferred for the seismic 52
design/assessment of structures [18]. A pushover curve provides fundamental information about the 53
seismic performance of buildings and is a powerful tool to evaluate the seismic behavior based on 54
displacement-based strategies. According to the displacement-based design approach, it is needed to 55
3
define seismic performance levels, which are associated with a level of damage exhibited by the 56
structures and are commonly identified by means of strains or drift limits [19,20]. These are directly 57
related to deformation, obtained for certain seismic intensity. According to past research, the application 58
of the displacement-based design to masonry structures is not straightforward, and the same has been 59
mostly applied on frame systems, such as reinforced concrete and steel buildings [21–24]. Thus, further 60
investigation is required to adopt pushover analysis in a more systematic strategy for masonry structures 61
with box behavior, particularly for buildings with structural irregularities to consider torsional effects 62
imposed by its own configuration under seismic actions [19,25,26]. Such consideration is crucial 63
because the seismic design and analysis codes are directed to regular structures whose dynamic behavior 64
is governed mostly by translation, and they do not represent the response of the structural systems with 65
irregularities [25]. 66
Figure 1. URM buildings in Global Building Inventory [1]
Within this framework, it is important to define appropriate modeling strategies to perform nonlinear 67
analysis of URM buildings under seismic actions. Advanced computational applications regarding the 68
nonlinear behavior of masonry are commonly focused on the finite element method (FEM), such as [27–69
32], and, also, block-based models, in which the real masonry arrangement (units and mortar) is 70
considered [33–40]. Such analyses require a high computational effort and are complex and expensive 71
to be adopted in practical applications. Therefore, more simplified analysis tools for masonry buildings 72
are required. 73
Simplified numerical approaches, based on macro-elements, have the capability to simulate the 74
seismic response of the masonry structures with significantly lower computational effort. It is important 75
to note that “simplified approach” represents the methodology in which a set of assumptions taken 76
account to describe the geometric configuration and discretize the structural elements in a simplified 77
way. However, macro-element models are, as well, relatively complex besides allowing users less 78
computational time. The aim of these simplified approaches is not only to provide an assessment of the 79
ultimate strength of the structure but also, a sufficient detailed description of its nonlinear behavior by 80
means of simplified discretization of the structural layout. Thus, they are proposed as an alternative 81
5348
6057
62
76
7
93
73
31
47
15
0
10
20
30
40
50
60
70
80
90
100
Au
stra
lia
El
Salv
ado
r
Ind
on
esia
Iran
Italy
Mex
ico
New
Zel
and
Pak
ista
n
Per
u
Ph
ilip
pin
es
Tu
rke
y
Un
ite
d S
tate
s
UR
M a
s %
of
inv
en
tory
4
method for practitioners. Several simplified numerical strategies have been developed for masonry 82
buildings, both in presence of deformable (existing buildings) or rigid diaphragms (modern buildings) 83
to be used in general engineering practice and displacement-based design, such as the Discrete Macro 84
Element Model (DMEM) [41] implemented in the 3DMacro [42] software and the equivalent frame 85
model [43] implemented in the Tremuri software [44–46]. It is worth to pointing out that an important 86
prerequisite for apply these simplified approaches is the presence of floor actions due to the presence of 87
diaphragms, although deformable. In absence of diaphragm, different approaches, able to simulate the 88
out-of-plane failure of masonry walls, should be employed. 89
Recent studies have shown that these simplified numerical approaches simulate the seismic 90
response of buildings with reasonable accuracy. It is noticed that there is a growing interest in the 91
scientific community in comparing different numerical approaches [47–49]. Marques and Lourenço 92
(2011) [50] compared different macro-element models, namely the equivalent frame SAM model 93
proposed by Magenes and Della Fontana (1998) [51] and the DMEM, as an alternative practical and 94
reliable structural analysis tool for two-story masonry buildings. Pantò et al. (2017) [52] improved the 95
3D macro software developed by Caliò et al. (2012) [41] to simulate the combined in-plane and out-of-96
plane behavior of masonry walls. Chácara et al. (2018) [53] conducted a study aiming at the simulation 97
of dynamic shaking table tests on a U-shaped masonry wall by means of the macro-element modeling. 98
Bondarabadi (2018) [54] used the equivalent frame model implemented in Tremuri software [43] to 99
validate the seismic behavior of two masonry structures tested on a shaking table by performing 100
nonlinear dynamic analysis. 101
Aiming at assessing the performance of different modelling strategies for the nonlinear analysis 102
of irregular masonry buildings in plan and elevation, the present paper presents the calibration of 103
different numerical models, namely a continuum model and two different simplified approaches (the 104
DMEM and the equivalent frame model), based on the results obtained in dynamic tests on the shaking 105
table of a half-scale two-storey asymmetric URM building. A comparative analysis of the results 106
obtained by the different models is provided. Furthermore, a sensitivity analysis is carried out by means 107
of the simplified numerical approaches regarding key mechanical parameters, namely modulus of 108
elasticity, and tensile, compressive, and shear strength. 109
2. MODELING METHODS FOR MASONRY BUILDINGS 110
A literature review on the methodologies applied in the seismic assessment of masonry buildings, [55], 111
discusses different modeling approaches. Besides, [56] discusses the applicability of the available 112
analytical tools so as to enhance the design practice of new masonry structures and as well as prevention 113
of the historical ones. The most advanced methodology is the finite element method which allows 114
simulating the behavior of masonry structures with accurate results. However, the method requires high 115
computational effort, complex constitutive material laws and users with postgraduate knowledge, and, 116
5
therefore, its application in engineering practice is limited. In this regard, simplified computational tools 117
have been proposed, based on structural components such as beam-type and panel elements. 118
The seismic behavior of modern masonry buildings is governed by box-behavior where the in-119
plane structural walls controls the resistance and premature out-of-plane mechanisms are prevented. 120
Yet, once proper measures are taken for existing masonry buildings, the so-called box-behavior can be 121
also achieved. Typically, the in-plane resisting mechanisms of masonry piers can be generally 122
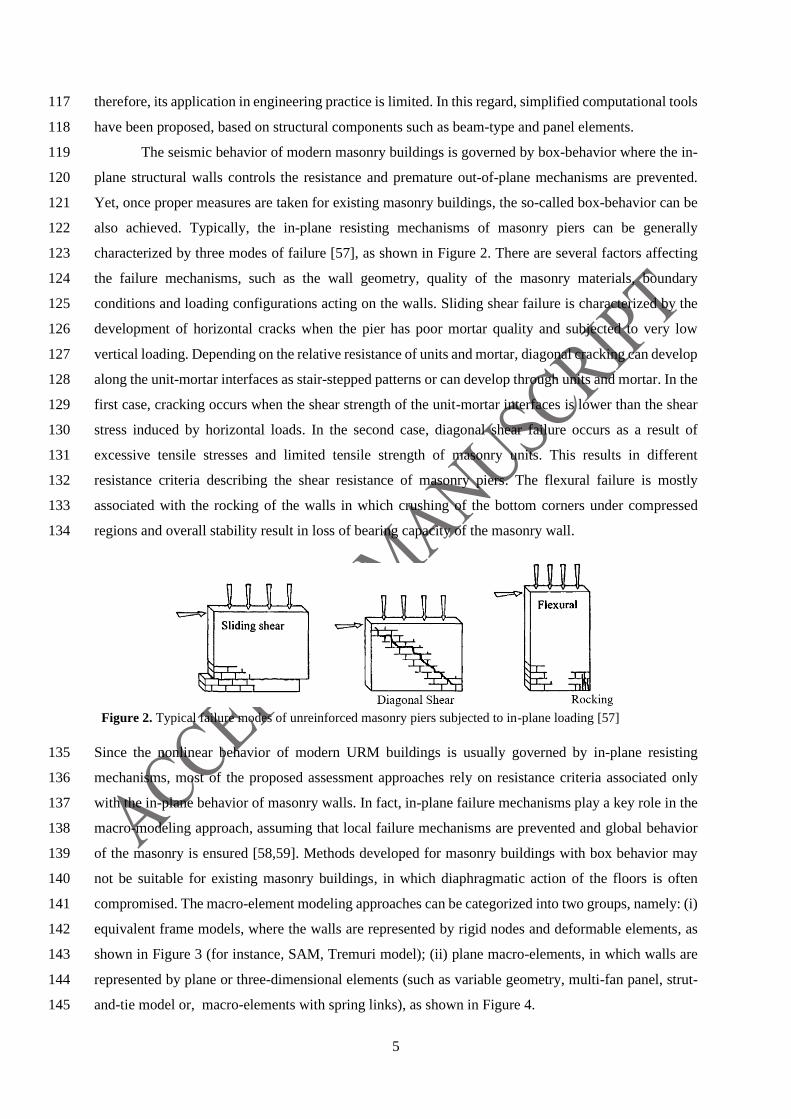
characterized by three modes of failure [57], as shown in Figure 2. There are several factors affecting 123
the failure mechanisms, such as the wall geometry, quality of the masonry materials, boundary 124
conditions and loading configurations acting on the walls. Sliding shear failure is characterized by the 125
development of horizontal cracks when the pier has poor mortar quality and subjected to very low 126
vertical loading. Depending on the relative resistance of units and mortar, diagonal cracking can develop 127
along the unit-mortar interfaces as stair-stepped patterns or can develop through units and mortar. In the 128
first case, cracking occurs when the shear strength of the unit-mortar interfaces is lower than the shear 129
stress induced by horizontal loads. In the second case, diagonal shear failure occurs as a result of 130
excessive tensile stresses and limited tensile strength of masonry units. This results in different 131
resistance criteria describing the shear resistance of masonry piers. The flexural failure is mostly 132
associated with the rocking of the walls in which crushing of the bottom corners under compressed 133
regions and overall stability result in loss of bearing capacity of the masonry wall. 134
Figure 2. Typical failure modes of unreinforced masonry piers subjected to in-plane loading [57]
Since the nonlinear behavior of modern URM buildings is usually governed by in-plane resisting 135
mechanisms, most of the proposed assessment approaches rely on resistance criteria associated only 136
with the in-plane behavior of masonry walls. In fact, in-plane failure mechanisms play a key role in the 137
macro-modeling approach, assuming that local failure mechanisms are prevented and global behavior 138
of the masonry is ensured [58,59]. Methods developed for masonry buildings with box behavior may 139
not be suitable for existing masonry buildings, in which diaphragmatic action of the floors is often 140
compromised. The macro-element modeling approaches can be categorized into two groups, namely: (i) 141
equivalent frame models, where the walls are represented by rigid nodes and deformable elements, as 142
shown in Figure 3 (for instance, SAM, Tremuri model); (ii) plane macro-elements, in which walls are 143
represented by plane or three-dimensional elements (such as variable geometry, multi-fan panel, strut-144
and-tie model or, macro-elements with spring links), as shown in Figure 4. 145
6
The POR method was proposed by [60] and the methodology is known as the first seismic assessment 146
tool for masonry structures. The approach assumes a story failure mechanism and analyses each 147
structure level individually. The nonlinear behavior of the structure is computed by taking into account 148
the inter-story shear force-displacement curve in which the sum of the individual response of each wall 149
is represented. The application of the method is limited to the assessment of masonry structures with a 150
rigid diaphragm that ensures the inhibition of out-of-plane failure. Therefore, the failure of the building 151
is based on the shear failure of the pier panels having elastic-perfectly plastic behavior with limited 152
ductility. 153
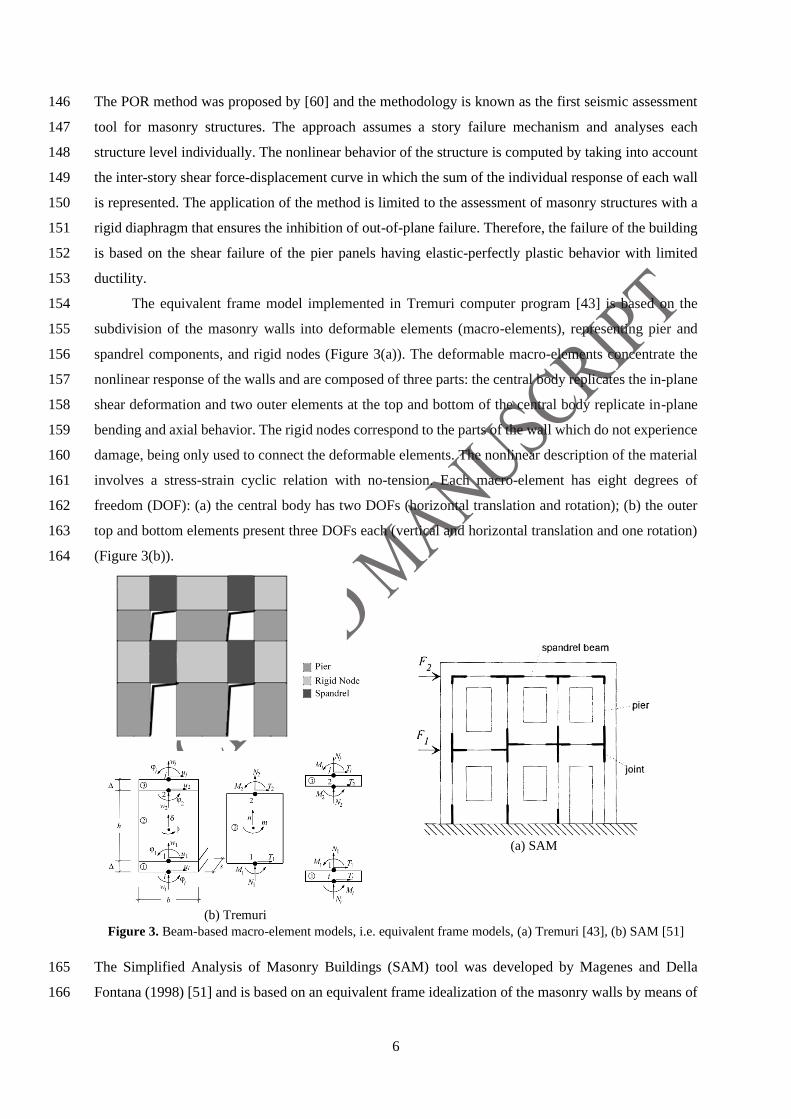
The equivalent frame model implemented in Tremuri computer program [43] is based on the 154
subdivision of the masonry walls into deformable elements (macro-elements), representing pier and 155
spandrel components, and rigid nodes (Figure 3(a)). The deformable macro-elements concentrate the 156
nonlinear response of the walls and are composed of three parts: the central body replicates the in-plane 157
shear deformation and two outer elements at the top and bottom of the central body replicate in-plane 158
bending and axial behavior. The rigid nodes correspond to the parts of the wall which do not experience 159
damage, being only used to connect the deformable elements. The nonlinear description of the material 160
involves a stress-strain cyclic relation with no-tension. Each macro-element has eight degrees of 161
freedom (DOF): (a) the central body has two DOFs (horizontal translation and rotation); (b) the outer 162
top and bottom elements present three DOFs each (vertical and horizontal translation and one rotation) 163
(Figure 3(b)). 164
(a) SAM
(b) Tremuri
Figure 3. Beam-based macro-element models, i.e. equivalent frame models, (a) Tremuri [43], (b) SAM [51]
The Simplified Analysis of Masonry Buildings (SAM) tool was developed by Magenes and Della 165
Fontana (1998) [51] and is based on an equivalent frame idealization of the masonry walls by means of 166
7
deformable (piers and spandrels) and rigid (joints) macro-elements as shown in Figure 3(b). The 167
nonlinear behavior of the pier elements is governed by elastic-perfectly plastic behavior with limited 168
ductility, whereas spandrels are considered to have either elastic-plastic or elastic-brittle behavior. The 169
configuration of the openings in vertical alignment plays an important role to simplify the masonry wall 170
as an equivalent frame, requiring regular distribution. 171
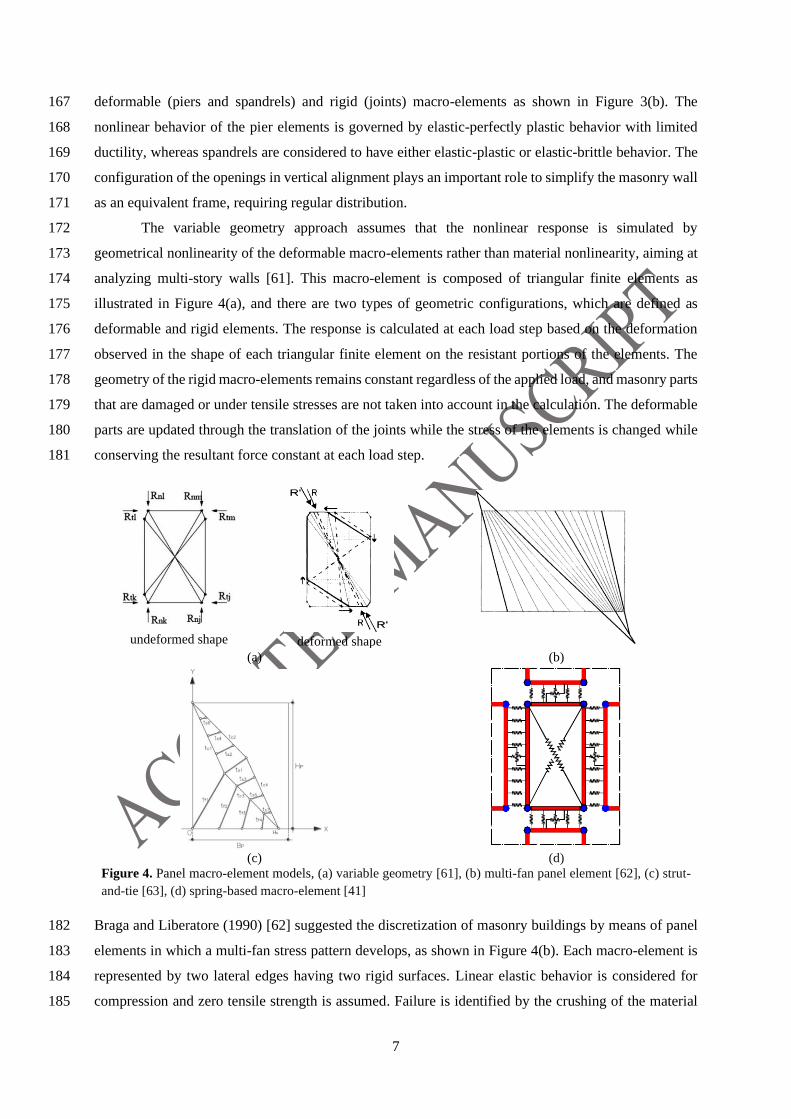
The variable geometry approach assumes that the nonlinear response is simulated by 172
geometrical nonlinearity of the deformable macro-elements rather than material nonlinearity, aiming at 173
analyzing multi-story walls [61]. This macro-element is composed of triangular finite elements as 174
illustrated in Figure 4(a), and there are two types of geometric configurations, which are defined as 175
deformable and rigid elements. The response is calculated at each load step based on the deformation 176
observed in the shape of each triangular finite element on the resistant portions of the elements. The 177
geometry of the rigid macro-elements remains constant regardless of the applied load, and masonry parts 178
that are damaged or under tensile stresses are not taken into account in the calculation. The deformable 179
parts are updated through the translation of the joints while the stress of the elements is changed while 180
conserving the resultant force constant at each load step. 181
undeformed shape
deformed shape
(a) (b)
(c) (d)
Figure 4. Panel macro-element models, (a) variable geometry [61], (b) multi-fan panel element [62], (c) strut-
and-tie [63], (d) spring-based macro-element [41]
Braga and Liberatore (1990) [62] suggested the discretization of masonry buildings by means of panel 182
elements in which a multi-fan stress pattern develops, as shown in Figure 4(b). Each macro-element is 183
represented by two lateral edges having two rigid surfaces. Linear elastic behavior is considered for 184
compression and zero tensile strength is assumed. Failure is identified by the crushing of the material 185
8
when reaching the maximum compressive stress. It is noted that this approach is not capable of capturing 186
material degradation [64]. 187
In the strut-and-tie method, the masonry building is subdivided into stories, and the vertical 188
elements are represented by masonry panels acting as in-plane resisting elements, which are analyzed 189
individually by means of pushover analysis [63]. The capacity curve of the story is calculated by the 190
addition of the capacity curves obtained for each panel of that story. Hence, the capacity of the building 191
is obtained taking into account the capacity curves of all the stories. Elasto-plastic compressive behavior 192
and no-tension behavior are assumed. Each masonry panel is composed of an equivalent strut-and-tie 193
member, so-called evolutive strut-and-tie, whose response is updated at each load step, allowing to 194
investigate the response in uncracked, cracked and softening states. The geometrical shape of the strut-195
and-tie is changed by the decrease in the number of resisting trusses. The behavior of the masonry panel 196
from uncracked condition to failure is simulated by the elimination of the trusses that connect the 197
rhomboid to the base and inside of the rhomboid (Figure 4(c)), being possible to reproduce the flexural 198
and shear failure modes, respectively. Two major simplifications are made: (i) there is no interaction 199
between the stories and each story is analyzed individually; (ii) the panel elements only represent 200
masonry piers and the columns, without spandrels. 201
A plane macro-element model, the DMEM, was proposed by Caliò et al. (2012) [41] and the 202
generic masonry wall is obtained by assembling quadrilateral (panel) elements with four rigid edges and 203
a diagonal link. Each side of the panel interacts with other panels by means of nonlinear links, so-called 204
interfaces. The simulation of the failure mechanisms is governed by the nonlinear links at the panel and 205
interfaces: (a) discrete distribution of orthogonal links at the interface element simulates the masonry 206
axial/flexural behavior; (b) a single link located parallel to the interface’s direction governs the shear-207
sliding mechanism; (c) the diagonal panel link, is responsible for the simulation of the shear-diagonal 208
failure. Each plane macro-element includes 4 degrees of freedom, see Figure 4(d): 1 DOF to represent 209
the in-plane deformability (diagonal spring) and 3 DOFs to describe the rigid body motions. 210
3. EXPERIMENTAL RESULTS 211
The main objective of this work is to discuss the performance of numerical models simulating the 212
seismic behavior of irregular masonry buildings. For this purpose, the results of dynamic shaking table 213
tests carried out on a concrete block masonry building were adopted [12]. The idea is to compare the 214
pushover curve and numerical damage patterns with the monotonic experimental response envelop and 215
experimental damage patterns. Shaking table tests on modern masonry buildings having symmetric [65] 216
and asymmetric structural configuration [12] were carried out in order to investigate the influence of the 217
torsional behavior induced by irregular geometries. It is noted that torsional behavior is present even in 218
regular geometries after the development of nonlinear behavior and the accumulation of damage [65]. 219
In addition, irregular structural configurations of buildings with box-behavior (presence of rigid floor 220
9
diaphragms) are intended to be analyzed since simultaneous in-plane and out-of-plane deformations may 221
occur due to torsional effects in the post-peak regime [12]. 222
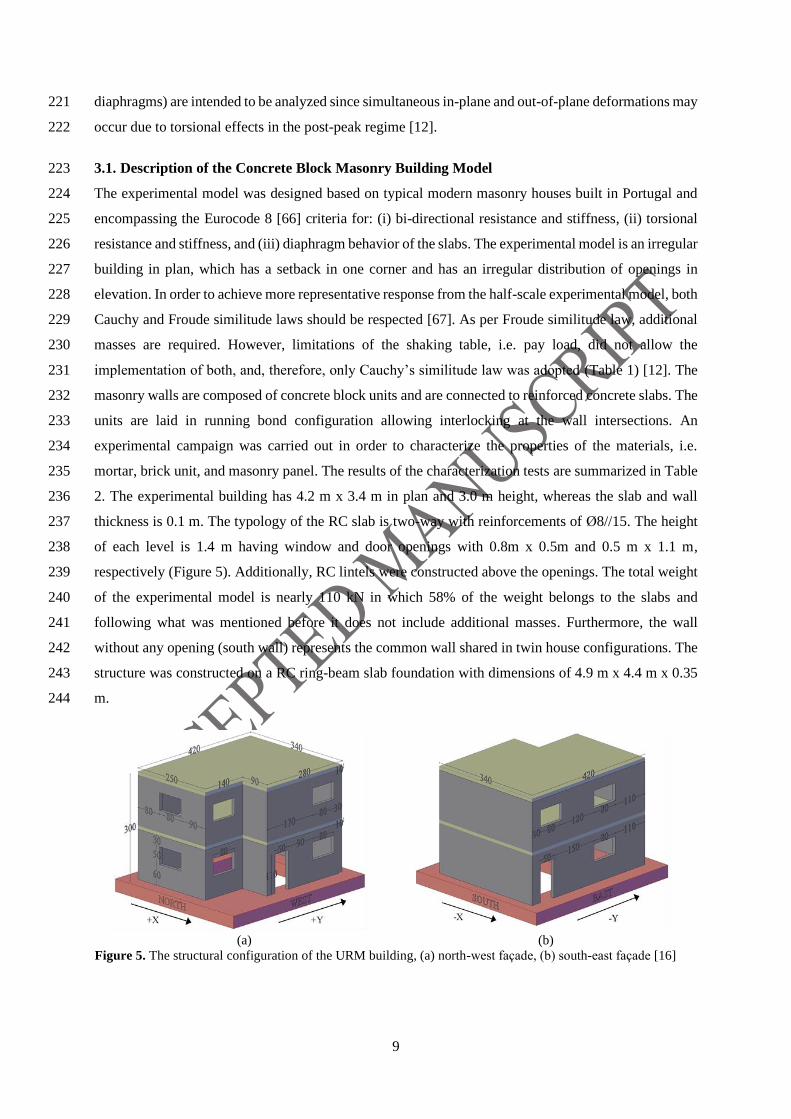
3.1. Description of the Concrete Block Masonry Building Model 223
The experimental model was designed based on typical modern masonry houses built in Portugal and 224
encompassing the Eurocode 8 [66] criteria for: (i) bi-directional resistance and stiffness, (ii) torsional 225
resistance and stiffness, and (iii) diaphragm behavior of the slabs. The experimental model is an irregular 226
building in plan, which has a setback in one corner and has an irregular distribution of openings in 227
elevation. In order to achieve more representative response from the half-scale experimental model, both 228
Cauchy and Froude similitude laws should be respected [67]. As per Froude similitude law, additional 229
masses are required. However, limitations of the shaking table, i.e. pay load, did not allow the 230
implementation of both, and, therefore, only Cauchy’s similitude law was adopted (Table 1) [12]. The 231
masonry walls are composed of concrete block units and are connected to reinforced concrete slabs. The 232
units are laid in running bond configuration allowing interlocking at the wall intersections. An 233
experimental campaign was carried out in order to characterize the properties of the materials, i.e. 234
mortar, brick unit, and masonry panel. The results of the characterization tests are summarized in Table 235
2. The experimental building has 4.2 m x 3.4 m in plan and 3.0 m height, whereas the slab and wall 236
thickness is 0.1 m. The typology of the RC slab is two-way with reinforcements of Ø8//15. The height 237
of each level is 1.4 m having window and door openings with 0.8m x 0.5m and 0.5 m x 1.1 m, 238
respectively (Figure 5). Additionally, RC lintels were constructed above the openings. The total weight 239
of the experimental model is nearly 110 kN in which 58% of the weight belongs to the slabs and 240
following what was mentioned before it does not include additional masses. Furthermore, the wall 241
without any opening (south wall) represents the common wall shared in twin house configurations. The 242
structure was constructed on a RC ring-beam slab foundation with dimensions of 4.9 m x 4.4 m x 0.35 243
m. 244
(a) (b)
Figure 5. The structural configuration of the URM building, (a) north-west façade, (b) south-east façade [16]
10
Table 1. Scale factors used for Cauchy’s similitude law [67] 245
Parameter Symbol Relation
Prototype/Model
Cauchy
scale factor
Length L LP/LM λ
Young’s Modulus E EP/EM 1
Specific mass ρ ρP/ρM 1
Area A AP/AM λ2
Volume V VP/VM λ3
Mass m mP/mM λ3
Displacement d dP/dM λ
Velocity υ υP/υM 1
Acceleration a aP/aM λ-1
Weight w wP/wM λ3
Force F FP/FM λ2
Moment M MP/MM λ3
Stress σ σP/σM 1
Strain ε εP/εM 1
Time t tP/tM λ
Frequency f fP/fM λ-1
Table 2. Material properties obtained by experimental campaign [16] 246
Mortar
Flexural strength 2.70 MPa
Compressive strength 11.71 MPa
Block
Tensile strength 3.19 MPa
Young’s modulus 9.57 GPa
Compressive strength 12.13 MPa
Masonry Panel
Young’s modulus 5.30 GPa
Compressive strength 5.95 MPa
Shear strength 0.12 MPa
Shear modulus 1.76 GPa
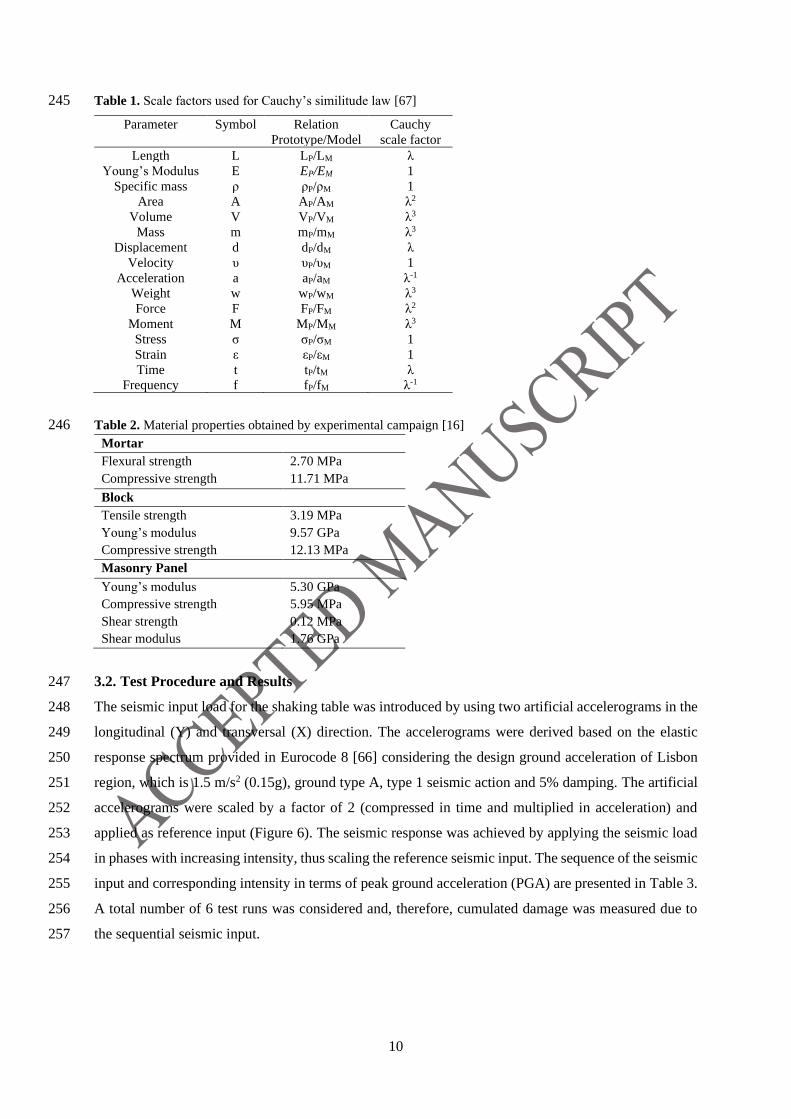
3.2. Test Procedure and Results 247
The seismic input load for the shaking table was introduced by using two artificial accelerograms in the 248
longitudinal (Y) and transversal (X) direction. The accelerograms were derived based on the elastic 249
response spectrum provided in Eurocode 8 [66] considering the design ground acceleration of Lisbon 250
region, which is 1.5 m/s2 (0.15g), ground type A, type 1 seismic action and 5% damping. The artificial 251
accelerograms were scaled by a factor of 2 (compressed in time and multiplied in acceleration) and 252
applied as reference input (Figure 6). The seismic response was achieved by applying the seismic load 253
in phases with increasing intensity, thus scaling the reference seismic input. The sequence of the seismic 254
input and corresponding intensity in terms of peak ground acceleration (PGA) are presented in Table 3. 255
A total number of 6 test runs was considered and, therefore, cumulated damage was measured due to 256
the sequential seismic input. 257
11
(a)
(b)
Figure 6. Input signals at 1:2 scale for the longitudinal (NS) and transverse (EW) directions: (a) artificial
response spectrums, (b) acceleration-time series [16]
Table 3. Seismic input series and corresponding PGA [16] 258
No. Test PGA NS (m/s2) PGA EW (m/s2)
1 25% 1.16 (0.12 g) 0.89 (0.09 g)
2 50% 2.50 (0.26 g) 2.31 (0.24 g)
3 75% 3.25 (0.33 g) 2.79 (0.28 g)
4 100% 4.57 (0.47 g) 4.05 (0.41 g)
5 150% 6.45 (0.66 g) 10.46 (1.07 g)
6 150% 2 6.44 (0.66 g) 12.19 (1.24 g)
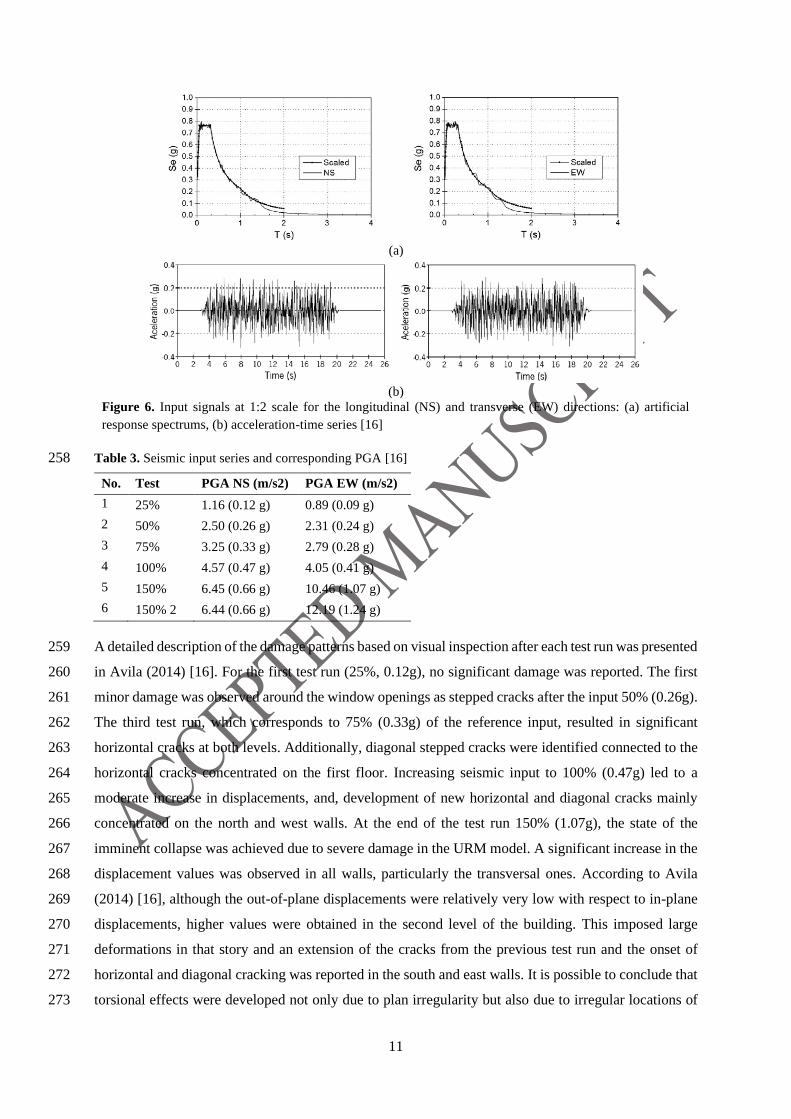
A detailed description of the damage patterns based on visual inspection after each test run was presented 259
in Avila (2014) [16]. For the first test run (25%, 0.12g), no significant damage was reported. The first 260
minor damage was observed around the window openings as stepped cracks after the input 50% (0.26g). 261
The third test run, which corresponds to 75% (0.33g) of the reference input, resulted in significant 262
horizontal cracks at both levels. Additionally, diagonal stepped cracks were identified connected to the 263
horizontal cracks concentrated on the first floor. Increasing seismic input to 100% (0.47g) led to a 264
moderate increase in displacements, and, development of new horizontal and diagonal cracks mainly 265
concentrated on the north and west walls. At the end of the test run 150% (1.07g), the state of the 266
imminent collapse was achieved due to severe damage in the URM model. A significant increase in the 267
displacement values was observed in all walls, particularly the transversal ones. According to Avila 268
(2014) [16], although the out-of-plane displacements were relatively very low with respect to in-plane 269
displacements, higher values were obtained in the second level of the building. This imposed large 270
deformations in that story and an extension of the cracks from the previous test run and the onset of 271
horizontal and diagonal cracking was reported in the south and east walls. It is possible to conclude that 272
torsional effects were developed not only due to plan irregularity but also due to irregular locations of 273
12
the openings and previous damage. Figure 7 presents the damage pattern observed in the URM model 274
at the end of the dynamic test. Accordingly, an envelope curve of the hysteretic response was developed 275
through the maximum base shear and maximum displacement of the hysteresis loops after each test run. 276
(a)
(b)
Figure 7. Damage observed after the final input sequence, (a) north wall, (b) west wall [16]
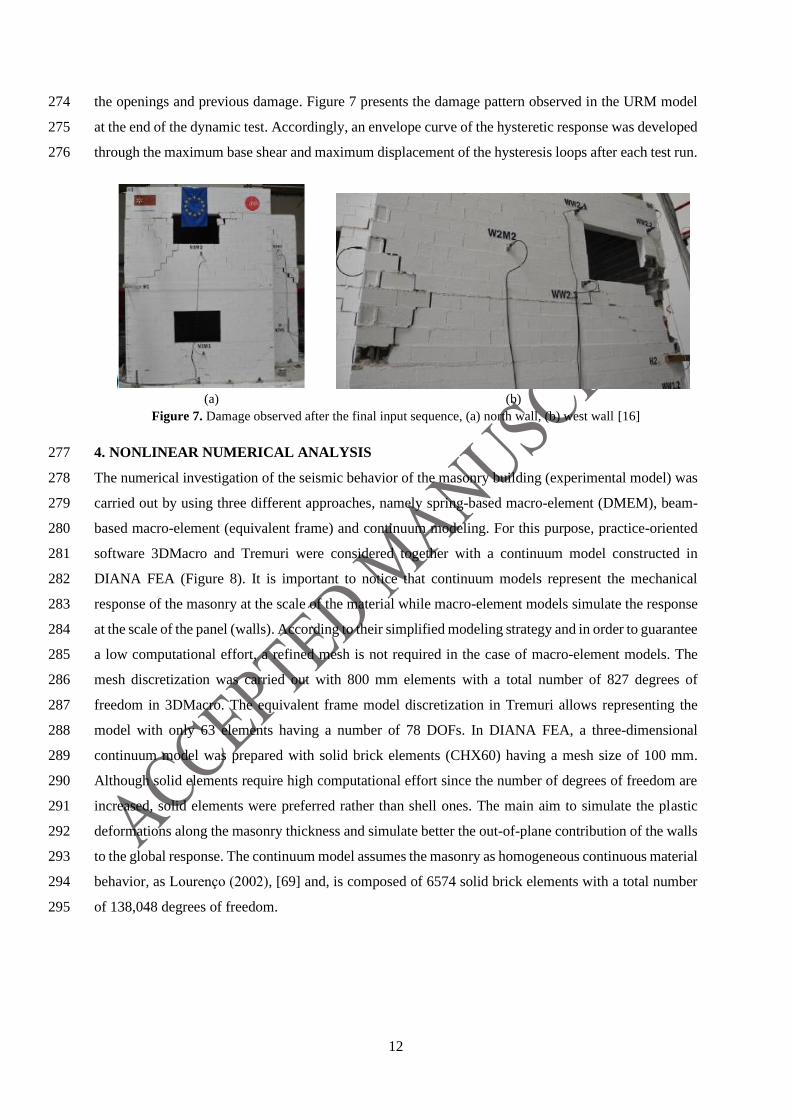
4. NONLINEAR NUMERICAL ANALYSIS 277
The numerical investigation of the seismic behavior of the masonry building (experimental model) was 278
carried out by using three different approaches, namely spring-based macro-element (DMEM), beam-279
based macro-element (equivalent frame) and continuum modeling. For this purpose, practice-oriented 280
software 3DMacro and Tremuri were considered together with a continuum model constructed in 281
DIANA FEA (Figure 8). It is important to notice that continuum models represent the mechanical 282
response of the masonry at the scale of the material while macro-element models simulate the response 283
at the scale of the panel (walls). According to their simplified modeling strategy and in order to guarantee 284
a low computational effort, a refined mesh is not required in the case of macro-element models. The 285
mesh discretization was carried out with 800 mm elements with a total number of 827 degrees of 286
freedom in 3DMacro. The equivalent frame model discretization in Tremuri allows representing the 287
model with only 63 elements having a number of 78 DOFs. In DIANA FEA, a three-dimensional 288
continuum model was prepared with solid brick elements (CHX60) having a mesh size of 100 mm. 289
Although solid elements require high computational effort since the number of degrees of freedom are 290
increased, solid elements were preferred rather than shell ones. The main aim to simulate the plastic 291
deformations along the masonry thickness and simulate better the out-of-plane contribution of the walls 292
to the global response. The continuum model assumes the masonry as homogeneous continuous material 293
behavior, as Lourenço (2002), [69] and, is composed of 6574 solid brick elements with a total number 294
of 138,048 degrees of freedom. 295

13
(a) (b) (c)
Figure 8. Numerical models constructed by using different approaches, (a) spring-based macro-element
modeling in 3DMacro, (b) beam-based macro-element modeling (EFM) in TREMURI, (c) continuum
modeling in DIANA FEA
4.1. Calibration of the Linear Properties 296
The calibration of the numerical models based on the constitutive laws obtained from in-plane loaded 297
masonry panels would be more accurate [70,71]. However, due to the absence of this data, it was decided 298
to proceed with the calibration of the numerical models through the fitting of the initial stiffness in the 299
linear range of nonlinear pushover curves and, thus, the mechanical property involved in the calibration 300
process was the modulus of elasticity masonry (E). The modulus of elasticity obtained experimentally 301
by Avila (2014) [16] was 5300 MPa. However, this value needed to be reduced to reflect cracking of 302
the concrete block masonry during transportation before the test, and accumulation of microcracks in 303
the first loading stages during the shaking table tests. It must be stressed that the modulus of elasticity 304
used in the three numerical approaches differs due to modeling assumptions in each software. An 305
isotropic continuum behavior is considered for the continuum model which allows the definition of the 306
elastic parameters, such as E and G, having a dependency to each other by the relationship G=E/(2+2γ). 307
On the other hand, microelement models generally assume uncoupled relationship between E and G 308
parameters. This is an inconsistency between the modeling approaches, which poses questions on the 309
reliability of displacement-based seismic assessment approaches for irregular masonry buildings, given 310
their higher dependency on the elastic properties. 311
In theory, the stiffness of a wall in linear range is only dependent on the modulus of elasticity of 312
masonry, the geometry of the panel and boundary conditions. However, various experimental studies 313
proved that initial stiffness is influenced also by pre-compression load level significantly [72–75]. 314
According to Araújo (2014) [74], the numerical simulation of the elastic parameters requires an 315
equivalent modulus of elasticity by means of calibration. Thus, experimental value of the modulus of 316
elasticity obtained in small masonry wallets under uniaxial compression may not be representative of a 317
masonry wall. In fact, it is stressed that a precise description of numerical models for masonry buildings 318
requires certain hypothesis. In the particular case of continuum models, it is important to recall that 319
significant assumptions have been made, namely (i) masonry (concrete block, mortar and unit-mortar 320
interfaces) considered as an homogenous material and (ii) full fixed connection between the structural 321
components. Once all methodologies adopt macro nature of masonry, the discrepancy in elastic modulus 322
can be associated to the features of modeling approaches, i.e. connections of intersecting walls (flange 323
14
effect). With this respected, it is important to stress that (i) the continuum model assumes fully fixed 324
connection along the height, (ii) the equivalent frame model considers lumped rigid nodes at the story 325
level, as already discussed by Simões (2018) [76], and (iii) discrete macro-element model only shares 326
the vertical deformation at the intersections. Therefore, aiming at clarifying the need for adopting 327
different values of modulus of elasticity among the different modelling approaches, a simple benchmark 328
study was carried out. 329
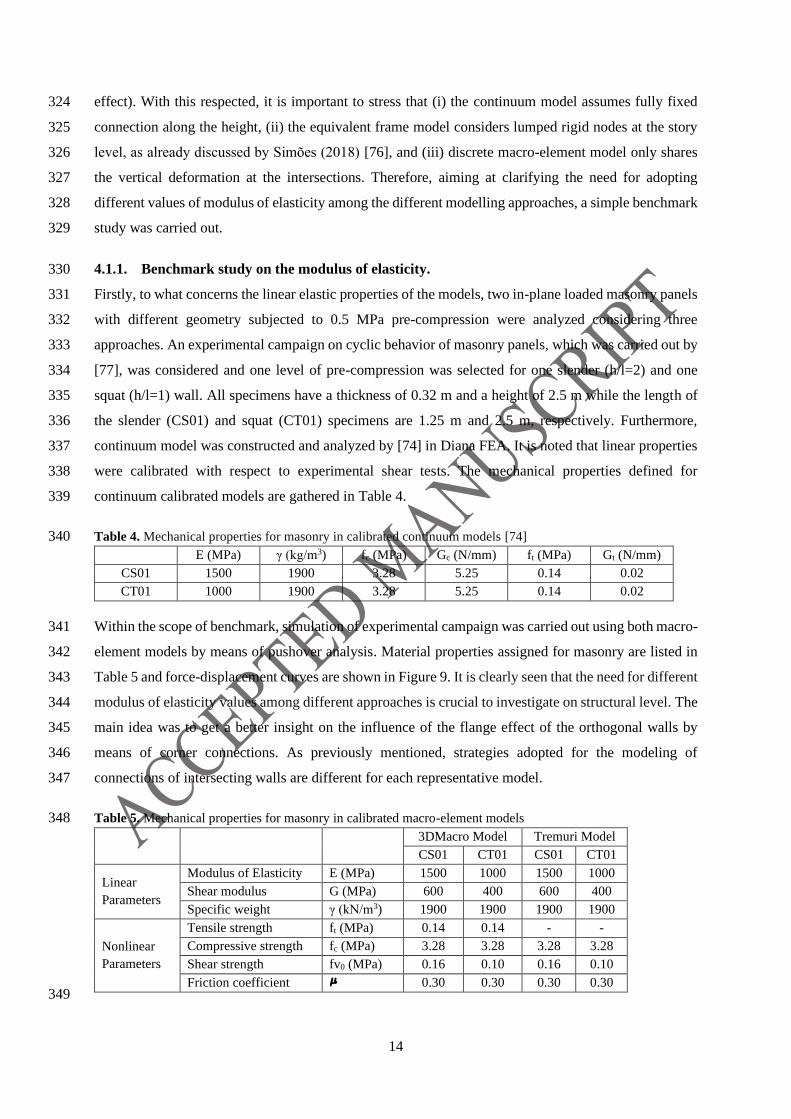
4.1.1. Benchmark study on the modulus of elasticity. 330
Firstly, to what concerns the linear elastic properties of the models, two in-plane loaded masonry panels 331
with different geometry subjected to 0.5 MPa pre-compression were analyzed considering three 332
approaches. An experimental campaign on cyclic behavior of masonry panels, which was carried out by 333
[77], was considered and one level of pre-compression was selected for one slender (h/l=2) and one 334
squat (h/l=1) wall. All specimens have a thickness of 0.32 m and a height of 2.5 m while the length of 335
the slender (CS01) and squat (CT01) specimens are 1.25 m and 2.5 m, respectively. Furthermore, 336
continuum model was constructed and analyzed by [74] in Diana FEA. It is noted that linear properties 337
were calibrated with respect to experimental shear tests. The mechanical properties defined for 338
continuum calibrated models are gathered in Table 4. 339
Table 4. Mechanical properties for masonry in calibrated continuum models [74] 340
E (MPa) γ (kg/m3) fc (MPa) Gc (N/mm) ft (MPa) Gt (N/mm)
CS01 1500 1900 3.28 5.25 0.14 0.02
CT01 1000 1900 3.28 5.25 0.14 0.02
Within the scope of benchmark, simulation of experimental campaign was carried out using both macro-341
element models by means of pushover analysis. Material properties assigned for masonry are listed in 342
Table 5 and force-displacement curves are shown in Figure 9. It is clearly seen that the need for different 343
modulus of elasticity values among different approaches is crucial to investigate on structural level. The 344
main idea was to get a better insight on the influence of the flange effect of the orthogonal walls by 345
means of corner connections. As previously mentioned, strategies adopted for the modeling of 346
connections of intersecting walls are different for each representative model. 347
Table 5. Mechanical properties for masonry in calibrated macro-element models 348
3DMacro Model Tremuri Model
CS01 CT01 CS01 CT01
Linear
Parameters
Modulus of Elasticity E (MPa) 1500 1000 1500 1000
Shear modulus G (MPa) 600 400 600 400
Specific weight γ (kN/m3) 1900 1900 1900 1900
Nonlinear
Parameters
Tensile strength ft (MPa) 0.14 0.14 - -
Compressive strength fc (MPa) 3.28 3.28 3.28 3.28
Shear strength fv0 (MPa) 0.16 0.10 0.16 0.10
Friction coefficient
0.30 0.30 0.30 0.30 349
15
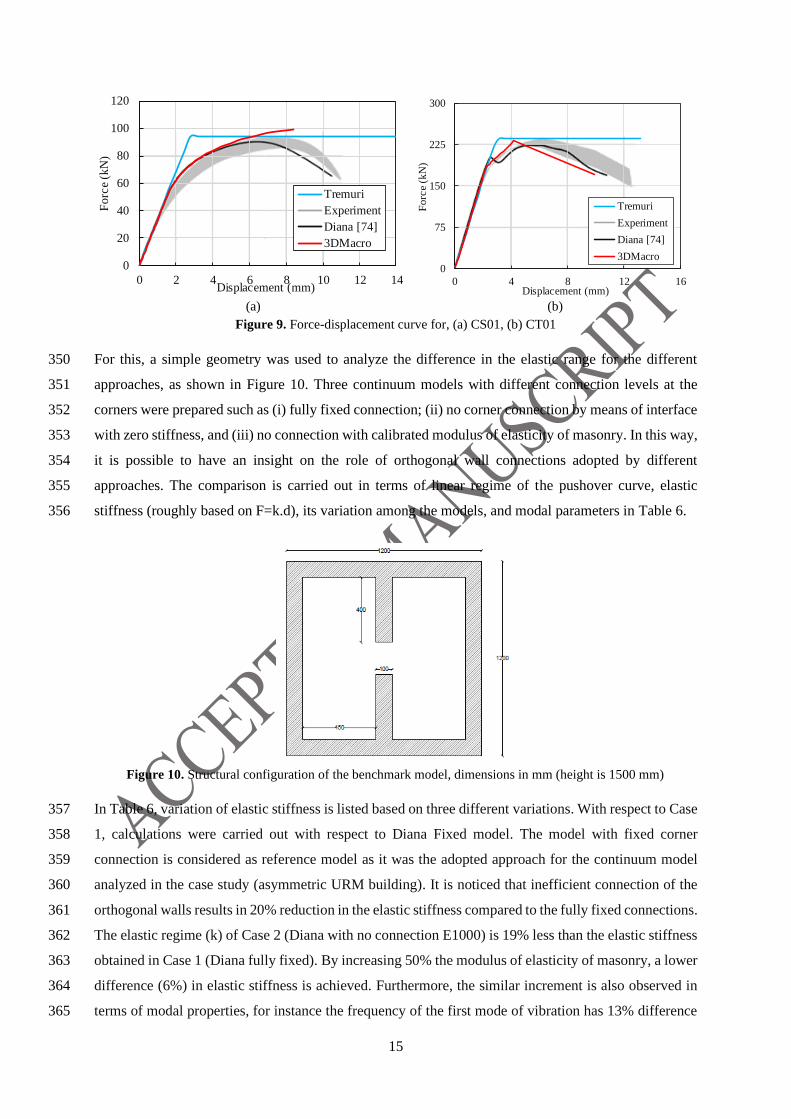
(a) (b)
Figure 9. Force-displacement curve for, (a) CS01, (b) CT01
For this, a simple geometry was used to analyze the difference in the elastic range for the different 350
approaches, as shown in Figure 10. Three continuum models with different connection levels at the 351
corners were prepared such as (i) fully fixed connection; (ii) no corner connection by means of interface 352
with zero stiffness, and (iii) no connection with calibrated modulus of elasticity of masonry. In this way, 353
it is possible to have an insight on the role of orthogonal wall connections adopted by different 354
approaches. The comparison is carried out in terms of linear regime of the pushover curve, elastic 355
stiffness (roughly based on F=k.d), its variation among the models, and modal parameters in Table 6. 356
Figure 10. Structural configuration of the benchmark model, dimensions in mm (height is 1500 mm)
In Table 6, variation of elastic stiffness is listed based on three different variations. With respect to Case 357
1, calculations were carried out with respect to Diana Fixed model. The model with fixed corner 358
connection is considered as reference model as it was the adopted approach for the continuum model 359
analyzed in the case study (asymmetric URM building). It is noticed that inefficient connection of the 360
orthogonal walls results in 20% reduction in the elastic stiffness compared to the fully fixed connections. 361
The elastic regime (k) of Case 2 (Diana with no connection E1000) is 19% less than the elastic stiffness 362
obtained in Case 1 (Diana fully fixed). By increasing 50% the modulus of elasticity of masonry, a lower 363
difference (6%) in elastic stiffness is achieved. Furthermore, the similar increment is also observed in 364
terms of modal properties, for instance the frequency of the first mode of vibration has 13% difference 365
0
20
40
60
80
100
120
0 2 4 6 8 10 12 14
Fo
rce
(kN
)
Displacement (mm)
Tremuri
Experiment
Diana [74]
3DMacro
0
75
150
225
300
0 4 8 12 16
Forc
e (k
N)
Displacement (mm)
Tremuri
Experiment
Diana [74]
3DMacro
16
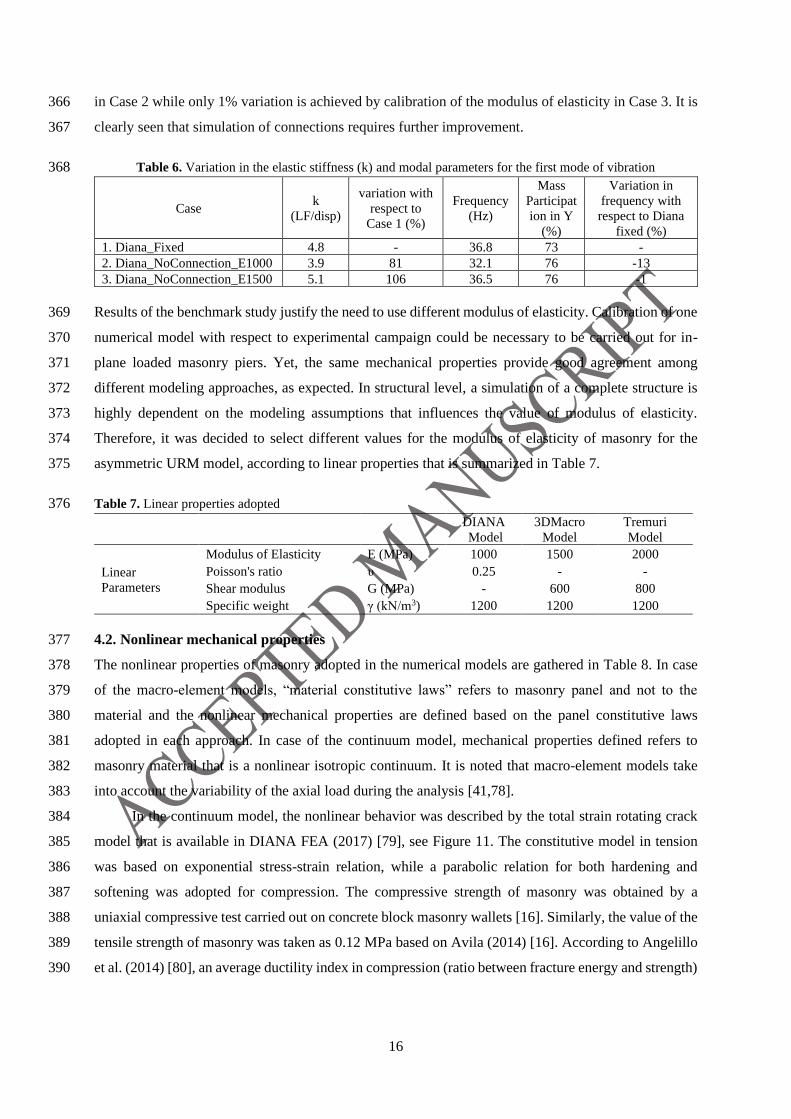
in Case 2 while only 1% variation is achieved by calibration of the modulus of elasticity in Case 3. It is 366
clearly seen that simulation of connections requires further improvement. 367
Table 6. Variation in the elastic stiffness (k) and modal parameters for the first mode of vibration 368
Case k
(LF/disp)
variation with
respect to
Case 1 (%)
Frequency
(Hz)
Mass
Participat
ion in Y
(%)
Variation in
frequency with
respect to Diana
fixed (%)
1. Diana_Fixed 4.8 - 36.8 73 -
2. Diana_NoConnection_E1000 3.9 81 32.1 76 -13
3. Diana_NoConnection_E1500 5.1 106 36.5 76 -1
Results of the benchmark study justify the need to use different modulus of elasticity. Calibration of one 369
numerical model with respect to experimental campaign could be necessary to be carried out for in-370
plane loaded masonry piers. Yet, the same mechanical properties provide good agreement among 371
different modeling approaches, as expected. In structural level, a simulation of a complete structure is 372
highly dependent on the modeling assumptions that influences the value of modulus of elasticity. 373
Therefore, it was decided to select different values for the modulus of elasticity of masonry for the 374
asymmetric URM model, according to linear properties that is summarized in Table 7. 375
Table 7. Linear properties adopted 376
DIANA
Model
3DMacro
Model
Tremuri
Model
Linear
Parameters
Modulus of Elasticity E (MPa) 1000 1500 2000
Poisson's ratio υ 0.25 - -
Shear modulus G (MPa) - 600 800
Specific weight γ (kN/m3) 1200 1200 1200
4.2. Nonlinear mechanical properties 377
The nonlinear properties of masonry adopted in the numerical models are gathered in Table 8. In case 378
of the macro-element models, “material constitutive laws” refers to masonry panel and not to the 379
material and the nonlinear mechanical properties are defined based on the panel constitutive laws 380
adopted in each approach. In case of the continuum model, mechanical properties defined refers to 381
masonry material that is a nonlinear isotropic continuum. It is noted that macro-element models take 382
into account the variability of the axial load during the analysis [41,78]. 383
In the continuum model, the nonlinear behavior was described by the total strain rotating crack 384
model that is available in DIANA FEA (2017) [79], see Figure 11. The constitutive model in tension 385
was based on exponential stress-strain relation, while a parabolic relation for both hardening and 386
softening was adopted for compression. The compressive strength of masonry was obtained by a 387
uniaxial compressive test carried out on concrete block masonry wallets [16]. Similarly, the value of the 388
tensile strength of masonry was taken as 0.12 MPa based on Avila (2014) [16]. According to Angelillo 389
et al. (2014) [80], an average ductility index in compression (ratio between fracture energy and strength) 390
17
equal to 1.6 mm was considered to evaluate the fracture energy in compression. The fracture energy in 391
tension was fixed as 0.012 N/mm. 392
In the present study, the equivalent frame model was constructed by using commercial version, 393
but the analyses were performed through the research version of Tremuri. The research version allows 394
to use nonlinear macro-element (“elementi command”) instead of nonlinear beam element 395
(“macroelementOPCM 3274”). In this work, beam-based approach was defined by macro-element 396
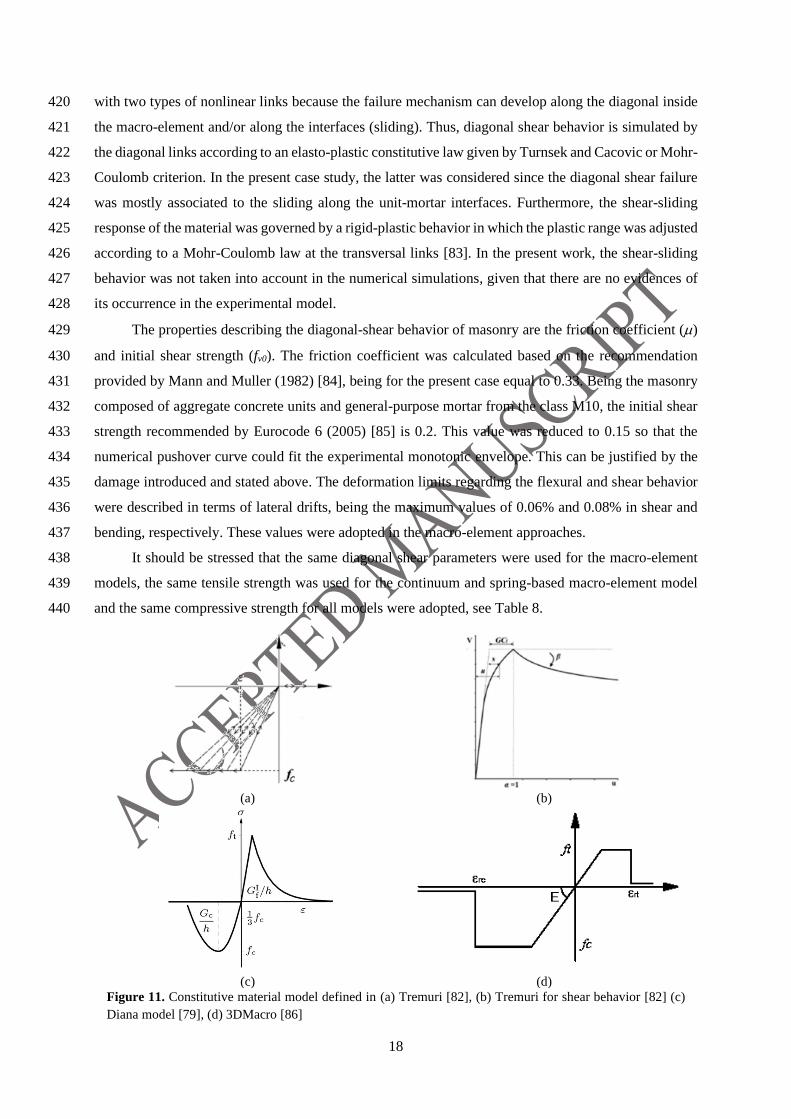
implemented in [81]. Therefore, a bilinear constitutive model with zero tensile strength and stiffness 397
degradation in compression with limited compressive strength is defined in Tremuri, see Figure 11(a) 398
[82]. Degradation in compressive stiffness replicates toe-crushing phenomena under cyclic loading. The 399
constitutive shear-global drift (v-u) law describes the sliding displacement at horizontal mortar joints to 400
simulate diagonal cracking. Additionally, shear behavior is characterized by a plastic component of 401
sliding displacement (s) which is activated once the Mohr-Coulomb criterion for the friction limit is 402
exceeded (Figure 11(a)). Shear damage variable (α) is a scalar parameter that defines the shear damage 403
[81]. At the state of elastic range, α corresponds to 0, and becomes equal to 1 when the panel reaches its 404
peak shear strength. Hence, the post-peak softening branch begins when α is greater than 1. Thus, the 405
mechanical properties of the masonry panel, such as shear modulus (G), initial shear strength (fvo) and 406
friction coefficient (μ), control Mohr-Coulomb yield surface. It is also required to define the slope of 407
the softening branch (β) and shear deformability parameter for the macro-element (ct). In the present 408
case, the slope of the softening branch was not taken into account, and the product Gct was considered 409
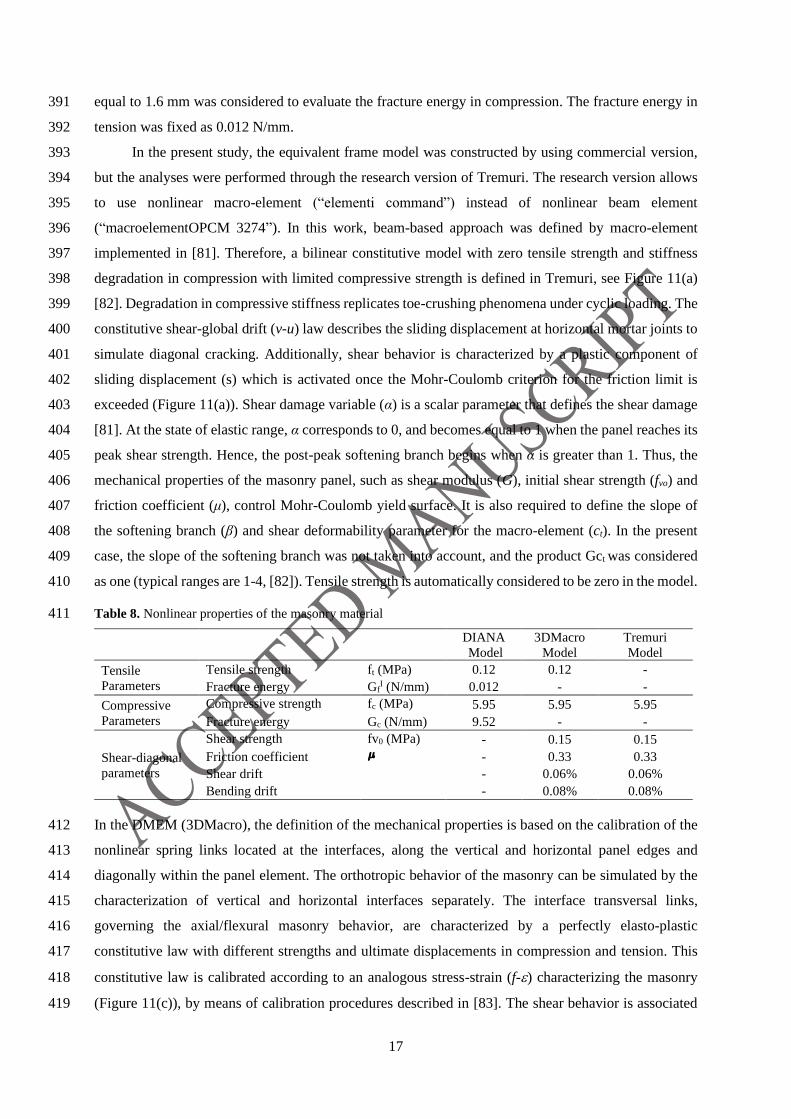
as one (typical ranges are 1-4, [82]). Tensile strength is automatically considered to be zero in the model. 410
Table 8. Nonlinear properties of the masonry material 411
DIANA
Model
3DMacro
Model
Tremuri
Model
Tensile
Parameters
Tensile strength ft (MPa) 0.12 0.12 -
Fracture energy GfI (N/mm) 0.012 - -
Compressive
Parameters
Compressive strength fc (MPa) 5.95 5.95 5.95
Fracture energy Gc (N/mm) 9.52 - -
Shear-diagonal
parameters
Shear strength fv0 (MPa) - 0.15 0.15
Friction coefficient
- 0.33 0.33
Shear drift - 0.06% 0.06%
Bending drift - 0.08% 0.08%
In the DMEM (3DMacro), the definition of the mechanical properties is based on the calibration of the 412
nonlinear spring links located at the interfaces, along the vertical and horizontal panel edges and 413
diagonally within the panel element. The orthotropic behavior of the masonry can be simulated by the 414
characterization of vertical and horizontal interfaces separately. The interface transversal links, 415
governing the axial/flexural masonry behavior, are characterized by a perfectly elasto-plastic 416
constitutive law with different strengths and ultimate displacements in compression and tension. This 417
constitutive law is calibrated according to an analogous stress-strain (f-) characterizing the masonry 418
(Figure 11(c)), by means of calibration procedures described in [83]. The shear behavior is associated 419
18
with two types of nonlinear links because the failure mechanism can develop along the diagonal inside 420
the macro-element and/or along the interfaces (sliding). Thus, diagonal shear behavior is simulated by 421
the diagonal links according to an elasto-plastic constitutive law given by Turnsek and Cacovic or Mohr-422
Coulomb criterion. In the present case study, the latter was considered since the diagonal shear failure 423
was mostly associated to the sliding along the unit-mortar interfaces. Furthermore, the shear-sliding 424
response of the material was governed by a rigid-plastic behavior in which the plastic range was adjusted 425
according to a Mohr-Coulomb law at the transversal links [83]. In the present work, the shear-sliding 426
behavior was not taken into account in the numerical simulations, given that there are no evidences of 427
its occurrence in the experimental model. 428
The properties describing the diagonal-shear behavior of masonry are the friction coefficient () 429
and initial shear strength (fv0). The friction coefficient was calculated based on the recommendation 430
provided by Mann and Muller (1982) [84], being for the present case equal to 0.33. Being the masonry 431
composed of aggregate concrete units and general-purpose mortar from the class M10, the initial shear 432
strength recommended by Eurocode 6 (2005) [85] is 0.2. This value was reduced to 0.15 so that the 433
numerical pushover curve could fit the experimental monotonic envelope. This can be justified by the 434
damage introduced and stated above. The deformation limits regarding the flexural and shear behavior 435
were described in terms of lateral drifts, being the maximum values of 0.06% and 0.08% in shear and 436
bending, respectively. These values were adopted in the macro-element approaches. 437
It should be stressed that the same diagonal shear parameters were used for the macro-element 438
models, the same tensile strength was used for the continuum and spring-based macro-element model 439
and the same compressive strength for all models were adopted, see Table 8. 440
(a) (b)
(c) (d)
Figure 11. Constitutive material model defined in (a) Tremuri [82], (b) Tremuri for shear behavior [82] (c)
Diana model [79], (d) 3DMacro [86]
19
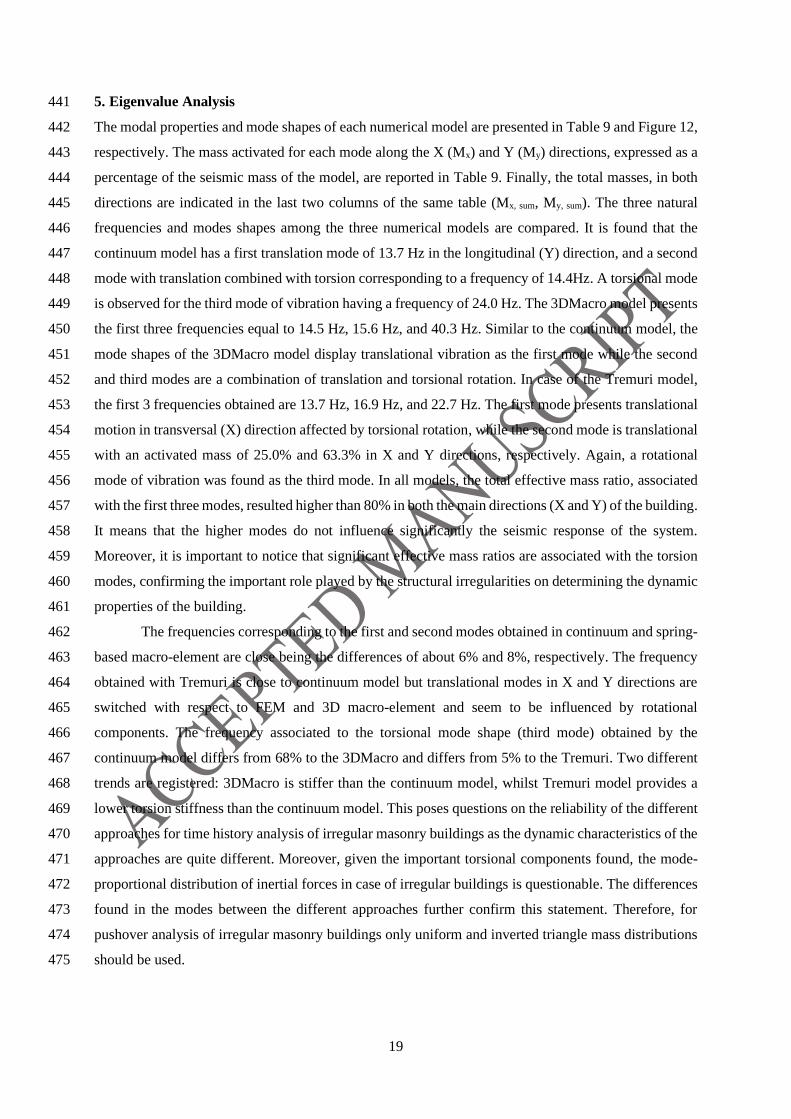
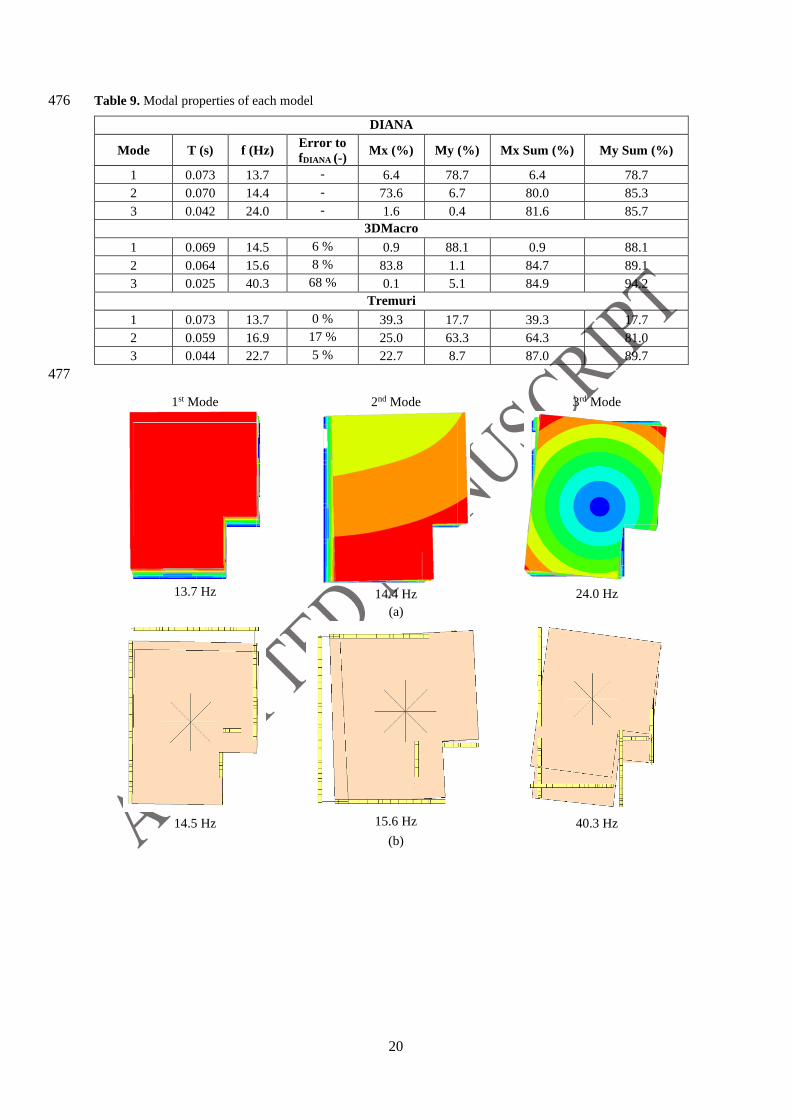
5. Eigenvalue Analysis 441
The modal properties and mode shapes of each numerical model are presented in Table 9 and Figure 12, 442
respectively. The mass activated for each mode along the X (Mx) and Y (My) directions, expressed as a 443
percentage of the seismic mass of the model, are reported in Table 9. Finally, the total masses, in both 444
directions are indicated in the last two columns of the same table (Mx, sum, My, sum). The three natural 445
frequencies and modes shapes among the three numerical models are compared. It is found that the 446
continuum model has a first translation mode of 13.7 Hz in the longitudinal (Y) direction, and a second 447
mode with translation combined with torsion corresponding to a frequency of 14.4Hz. A torsional mode 448
is observed for the third mode of vibration having a frequency of 24.0 Hz. The 3DMacro model presents 449
the first three frequencies equal to 14.5 Hz, 15.6 Hz, and 40.3 Hz. Similar to the continuum model, the 450
mode shapes of the 3DMacro model display translational vibration as the first mode while the second 451
and third modes are a combination of translation and torsional rotation. In case of the Tremuri model, 452
the first 3 frequencies obtained are 13.7 Hz, 16.9 Hz, and 22.7 Hz. The first mode presents translational 453
motion in transversal (X) direction affected by torsional rotation, while the second mode is translational 454
with an activated mass of 25.0% and 63.3% in X and Y directions, respectively. Again, a rotational 455
mode of vibration was found as the third mode. In all models, the total effective mass ratio, associated 456
with the first three modes, resulted higher than 80% in both the main directions (X and Y) of the building. 457
It means that the higher modes do not influence significantly the seismic response of the system. 458
Moreover, it is important to notice that significant effective mass ratios are associated with the torsion 459
modes, confirming the important role played by the structural irregularities on determining the dynamic 460
properties of the building. 461
The frequencies corresponding to the first and second modes obtained in continuum and spring-462
based macro-element are close being the differences of about 6% and 8%, respectively. The frequency 463
obtained with Tremuri is close to continuum model but translational modes in X and Y directions are 464
switched with respect to FEM and 3D macro-element and seem to be influenced by rotational 465
components. The frequency associated to the torsional mode shape (third mode) obtained by the 466
continuum model differs from 68% to the 3DMacro and differs from 5% to the Tremuri. Two different 467
trends are registered: 3DMacro is stiffer than the continuum model, whilst Tremuri model provides a 468
lower torsion stiffness than the continuum model. This poses questions on the reliability of the different 469
approaches for time history analysis of irregular masonry buildings as the dynamic characteristics of the 470
approaches are quite different. Moreover, given the important torsional components found, the mode-471
proportional distribution of inertial forces in case of irregular buildings is questionable. The differences 472
found in the modes between the different approaches further confirm this statement. Therefore, for 473
pushover analysis of irregular masonry buildings only uniform and inverted triangle mass distributions 474
should be used. 475
20
Table 9. Modal properties of each model 476
DIANA
Mode T (s) f (Hz) Error to
fDIANA (-) Mx (%) My (%) Mx Sum (%) My Sum (%)
1 0.073 13.7 - 6.4 78.7 6.4 78.7
2 0.070 14.4 - 73.6 6.7 80.0 85.3
3 0.042 24.0 - 1.6 0.4 81.6 85.7
3DMacro
1 0.069 14.5 6 % 0.9 88.1 0.9 88.1
2 0.064 15.6 8 % 83.8 1.1 84.7 89.1
3 0.025 40.3 68 % 0.1 5.1 84.9 94.2
Tremuri
1 0.073 13.7 0 % 39.3 17.7 39.3 17.7
2 0.059 16.9 17 % 25.0 63.3 64.3 81.0
3 0.044 22.7 5 % 22.7 8.7 87.0 89.7
477
1st Mode
13.7 Hz
2nd Mode
14.4 Hz
3rd Mode
24.0 Hz
(a)
14.5 Hz
15.6 Hz
40.3 Hz
(b)
21
13.7 Hz
16.9 Hz
22.7 Hz
(c)
Figure 12. Modes of vibrations for the first three modes, (a) DIANA, (b) 3DMacro, (c) Tremuri
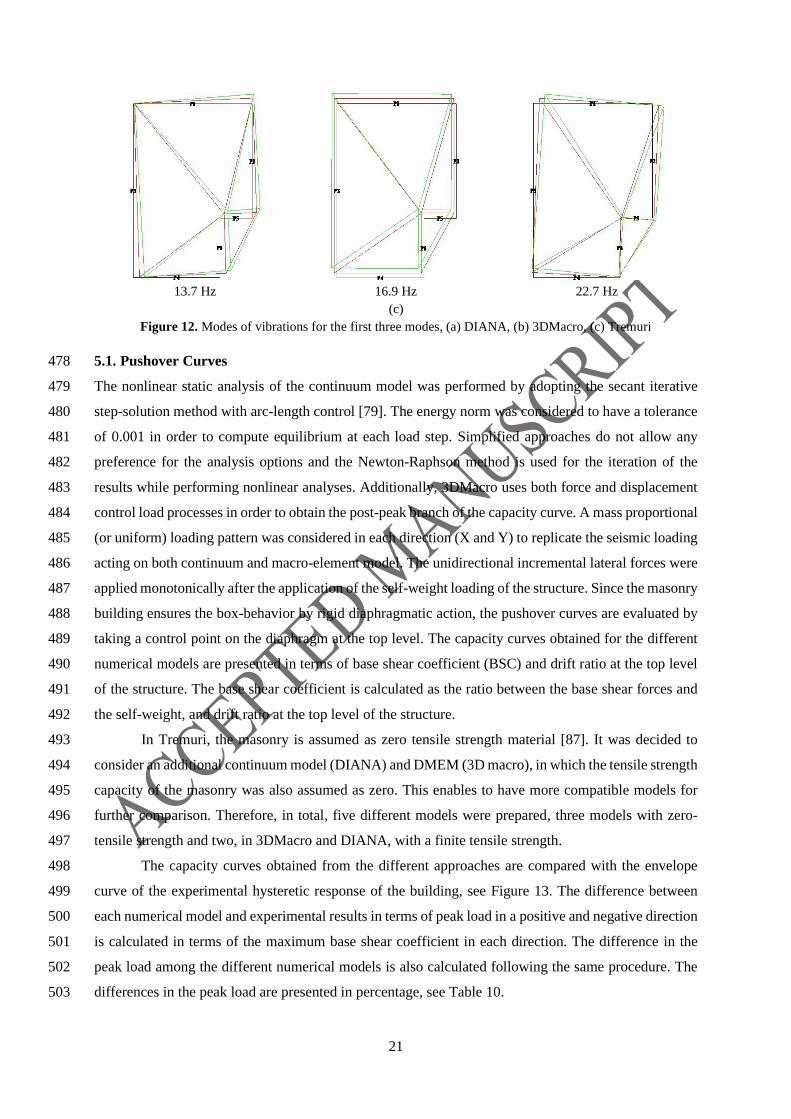
5.1. Pushover Curves 478
The nonlinear static analysis of the continuum model was performed by adopting the secant iterative 479
step-solution method with arc-length control [79]. The energy norm was considered to have a tolerance 480
of 0.001 in order to compute equilibrium at each load step. Simplified approaches do not allow any 481
preference for the analysis options and the Newton-Raphson method is used for the iteration of the 482
results while performing nonlinear analyses. Additionally, 3DMacro uses both force and displacement 483
control load processes in order to obtain the post-peak branch of the capacity curve. A mass proportional 484
(or uniform) loading pattern was considered in each direction (X and Y) to replicate the seismic loading 485
acting on both continuum and macro-element model. The unidirectional incremental lateral forces were 486
applied monotonically after the application of the self-weight loading of the structure. Since the masonry 487
building ensures the box-behavior by rigid diaphragmatic action, the pushover curves are evaluated by 488
taking a control point on the diaphragm at the top level. The capacity curves obtained for the different 489
numerical models are presented in terms of base shear coefficient (BSC) and drift ratio at the top level 490
of the structure. The base shear coefficient is calculated as the ratio between the base shear forces and 491
the self-weight, and drift ratio at the top level of the structure. 492
In Tremuri, the masonry is assumed as zero tensile strength material [87]. It was decided to 493
consider an additional continuum model (DIANA) and DMEM (3D macro), in which the tensile strength 494
capacity of the masonry was also assumed as zero. This enables to have more compatible models for 495
further comparison. Therefore, in total, five different models were prepared, three models with zero-496
tensile strength and two, in 3DMacro and DIANA, with a finite tensile strength. 497
The capacity curves obtained from the different approaches are compared with the envelope 498
curve of the experimental hysteretic response of the building, see Figure 13. The difference between 499
each numerical model and experimental results in terms of peak load in a positive and negative direction 500
is calculated in terms of the maximum base shear coefficient in each direction. The difference in the 501
peak load among the different numerical models is also calculated following the same procedure. The 502
differences in the peak load are presented in percentage, see Table 10. 503
22
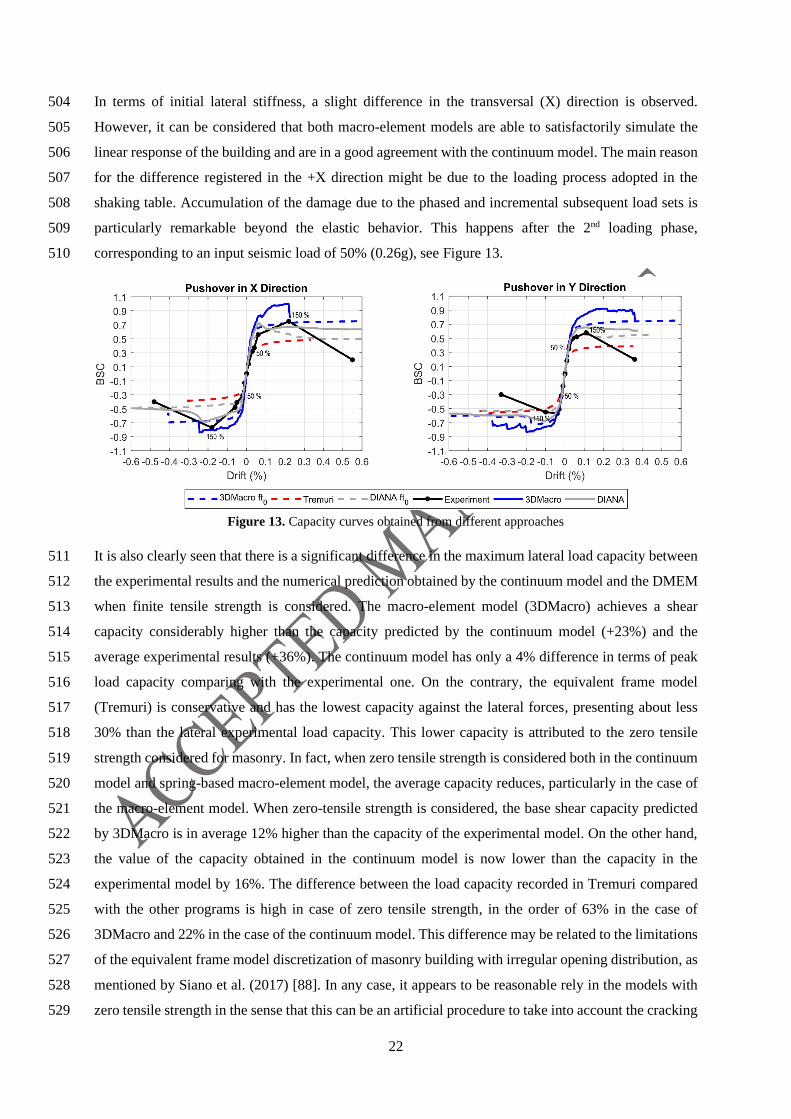
In terms of initial lateral stiffness, a slight difference in the transversal (X) direction is observed. 504
However, it can be considered that both macro-element models are able to satisfactorily simulate the 505
linear response of the building and are in a good agreement with the continuum model. The main reason 506
for the difference registered in the +X direction might be due to the loading process adopted in the 507
shaking table. Accumulation of the damage due to the phased and incremental subsequent load sets is 508
particularly remarkable beyond the elastic behavior. This happens after the 2nd loading phase, 509
corresponding to an input seismic load of 50% (0.26g), see Figure 13. 510
Figure 13. Capacity curves obtained from different approaches
It is also clearly seen that there is a significant difference in the maximum lateral load capacity between 511
the experimental results and the numerical prediction obtained by the continuum model and the DMEM 512
when finite tensile strength is considered. The macro-element model (3DMacro) achieves a shear 513
capacity considerably higher than the capacity predicted by the continuum model (+23%) and the 514
average experimental results (+36%). The continuum model has only a 4% difference in terms of peak 515
load capacity comparing with the experimental one. On the contrary, the equivalent frame model 516
(Tremuri) is conservative and has the lowest capacity against the lateral forces, presenting about less 517
30% than the lateral experimental load capacity. This lower capacity is attributed to the zero tensile 518
strength considered for masonry. In fact, when zero tensile strength is considered both in the continuum 519
model and spring-based macro-element model, the average capacity reduces, particularly in the case of 520
the macro-element model. When zero-tensile strength is considered, the base shear capacity predicted 521
by 3DMacro is in average 12% higher than the capacity of the experimental model. On the other hand, 522
the value of the capacity obtained in the continuum model is now lower than the capacity in the 523
experimental model by 16%. The difference between the load capacity recorded in Tremuri compared 524
with the other programs is high in case of zero tensile strength, in the order of 63% in the case of 525
3DMacro and 22% in the case of the continuum model. This difference may be related to the limitations 526
of the equivalent frame model discretization of masonry building with irregular opening distribution, as 527
mentioned by Siano et al. (2017) [88]. In any case, it appears to be reasonable rely in the models with 528
zero tensile strength in the sense that this can be an artificial procedure to take into account the cracking 529
23
accumulation due the loading phased procedure adopted in the experimental campaign. It is acceptable 530
the previous cracking at the unit-mortar interfaces can influence the shear resistance of the masonry 531
building. 532
Table 10. The difference between the results in terms of the average lateral peak load in all directions (%) 533
Vs. (%) Experiment 3DMacro Tremuri DIANA 3DMacro_t0 DIANA_t0
Experiment +36 -30 +4 +12 -16
3DMacro - -23 -18 -
Tremuri - +63 +22
DIANA - -20
3DMacro_t0 -25
DIANA_t0
It is also important to mention that much higher ductility is achieved in the post-peak regime in the 534
numerical models when compared to the experimental model. This feature can also be attributed to the 535
dynamic nature of the experimental phased loading process and its effects on the structure, which is not 536
possible to described by the non-linear static analysis. 537
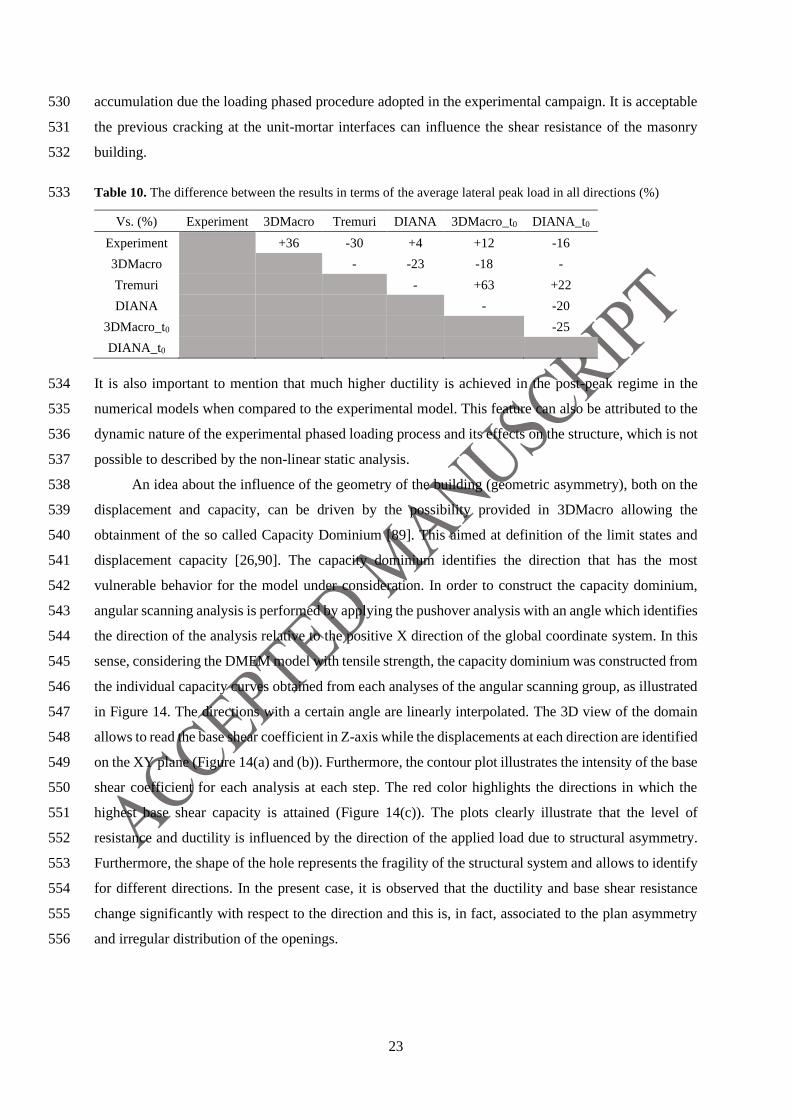
An idea about the influence of the geometry of the building (geometric asymmetry), both on the 538
displacement and capacity, can be driven by the possibility provided in 3DMacro allowing the 539
obtainment of the so called Capacity Dominium [89]. This aimed at definition of the limit states and 540
displacement capacity [26,90]. The capacity dominium identifies the direction that has the most 541
vulnerable behavior for the model under consideration. In order to construct the capacity dominium, 542
angular scanning analysis is performed by applying the pushover analysis with an angle which identifies 543
the direction of the analysis relative to the positive X direction of the global coordinate system. In this 544
sense, considering the DMEM model with tensile strength, the capacity dominium was constructed from 545
the individual capacity curves obtained from each analyses of the angular scanning group, as illustrated 546
in Figure 14. The directions with a certain angle are linearly interpolated. The 3D view of the domain 547
allows to read the base shear coefficient in Z-axis while the displacements at each direction are identified 548
on the XY plane (Figure 14(a) and (b)). Furthermore, the contour plot illustrates the intensity of the base 549
shear coefficient for each analysis at each step. The red color highlights the directions in which the 550
highest base shear capacity is attained (Figure 14(c)). The plots clearly illustrate that the level of 551
resistance and ductility is influenced by the direction of the applied load due to structural asymmetry. 552
Furthermore, the shape of the hole represents the fragility of the structural system and allows to identify 553
for different directions. In the present case, it is observed that the ductility and base shear resistance 554
change significantly with respect to the direction and this is, in fact, associated to the plan asymmetry 555
and irregular distribution of the openings. 556
24
(a)
(b)
(c) Figure 14. Capacity dominium of the spring-based macro-element model, (a) displacement dominium in 2D,
(b) load factor dominium in 3D view, (c) XY plane
5.2. Damage Patterns 557
A critical analysis of the damage patterns is important to understand the discrepancies observed among 558
the capacity curves obtained by the different modeling approaches and the differences between the 559
numerical predictions and the experimental response of the building. The crack patterns under 560
comparison correspond to the peak load recorded in each numerical model. This appears to be the most 561
adequate solution given the different deformation levels corresponding to peak load amongst the 562
numerical models, which are also different from the experimental model. As already mentioned, after a 563
certain deformation level (150%, 1.07g), the large deformations recorded in the experimental model are 564
impossible to be captured by the investigated numerical modeling strategies. Thus, the crack patterns 565
corresponding to this seismic level is assumed to be representative of the imminent collapse. 566
The comparison between experimental and numerical damage patterns obtained in the 567
continuum model and DMEM implemented in 3DMacro are presented in Figure 15 and Figure 16, 568
respectively. In the present case, the comparison is carried out taking into account the representative 569
models having tensile strength capacity (for continuum and macro-element models). In the case of the 570
continuum model, the maximum principal tensile strain distribution was used to represent the model 571
damage distribution. According to Mendes (2012) [17], the principal tensile strain distribution is a good 572
damage indicator. 573
25
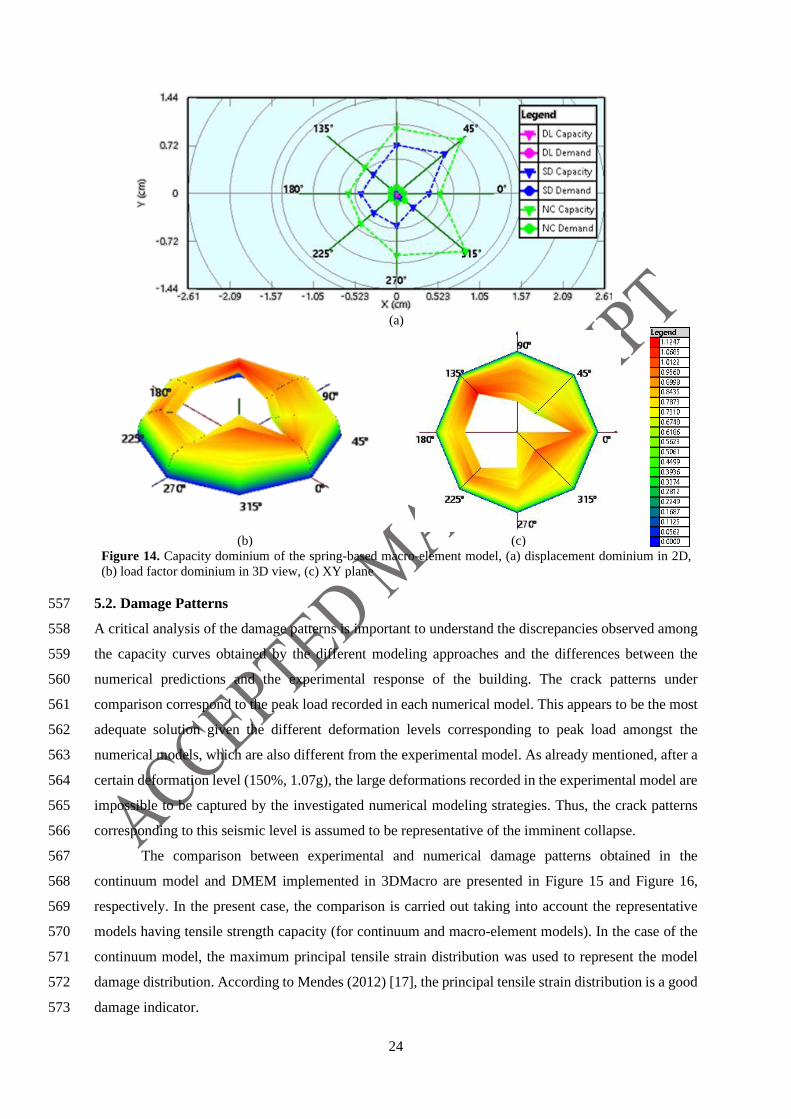
In the experimental model, the damage concentrates mostly at the first floor, even if there are some local 574
diagonal cracks connected by long horizontal cracks developing almost along the perimeter of the 575
building, which are believed to be the result of torsional effects of the buildings. By comparing the crack 576
patterns obtained in both numerical models, it is observed that both reasonably describe the damage 577
observed on the first floor. More in detail, either models (continuum and DMEM), are governed by 578
mixed flexural (rocking) and diagonal shear mechanism. Apart from the vertical cracks observed above 579
the openings in the spring-based macro-element model, due to the fact that the macro-model 580
concentrates the masonry deformation at the zero-thickness interfaces, flexural (rocking) cracks 581
developing mostly at the base of the buildings, and diagonal cracks can be seen in both models in similar 582
regions of the structure (Figure 15 and Figure 16). It should be also noticed that the damage patterns 583
obtained in the DMEM model are moderately influenced by the discretization of the elements. 584
Since the box-behavior of the structure is ensured by the rigid diaphragm, out-of-plane failure 585
mechanisms are not expected. However, even though the structure is exposed to unidirectional lateral 586
loading, it is possible to observe some interaction between in-plane and out-of-plane deformations, 587
mainly at the first floor, close to the base and at the intersection of the walls (North-west intersection), 588
as shown in Figure 16. This interaction is well captured in both numerical models, with out-of-plane 589
deformation and horizontal cracks governed by tension failure of the North wall when the lateral load is 590
applied in the longitudinal direction of the buildings (Y direction). This is attributed to the good 591
(monolithic) connection assumed between longitudinal and transversal walls. 592
North – West façade South – East façade
(a)
26
(b)
(c)
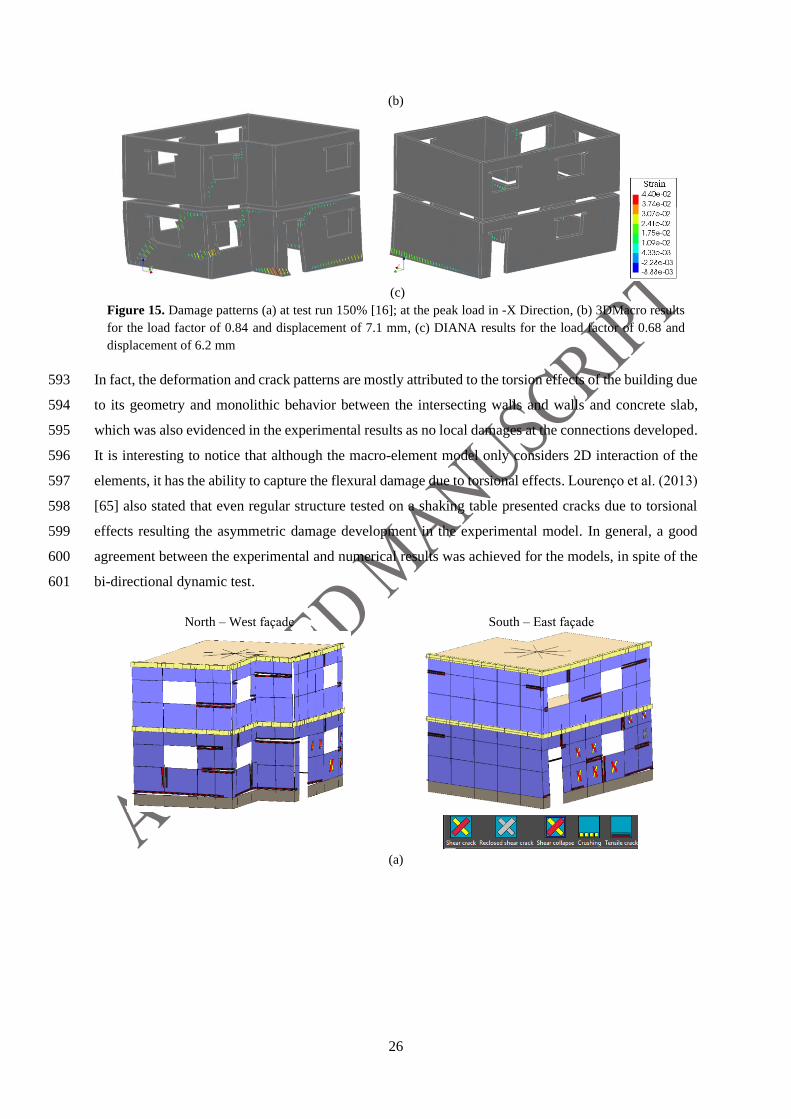
Figure 15. Damage patterns (a) at test run 150% [16]; at the peak load in -X Direction, (b) 3DMacro results
for the load factor of 0.84 and displacement of 7.1 mm, (c) DIANA results for the load factor of 0.68 and
displacement of 6.2 mm
In fact, the deformation and crack patterns are mostly attributed to the torsion effects of the building due 593
to its geometry and monolithic behavior between the intersecting walls and walls and concrete slab, 594
which was also evidenced in the experimental results as no local damages at the connections developed. 595
It is interesting to notice that although the macro-element model only considers 2D interaction of the 596
elements, it has the ability to capture the flexural damage due to torsional effects. Lourenço et al. (2013) 597
[65] also stated that even regular structure tested on a shaking table presented cracks due to torsional 598
effects resulting the asymmetric damage development in the experimental model. In general, a good 599
agreement between the experimental and numerical results was achieved for the models, in spite of the 600
bi-directional dynamic test. 601
North – West façade South – East façade
(a)
27
(b)
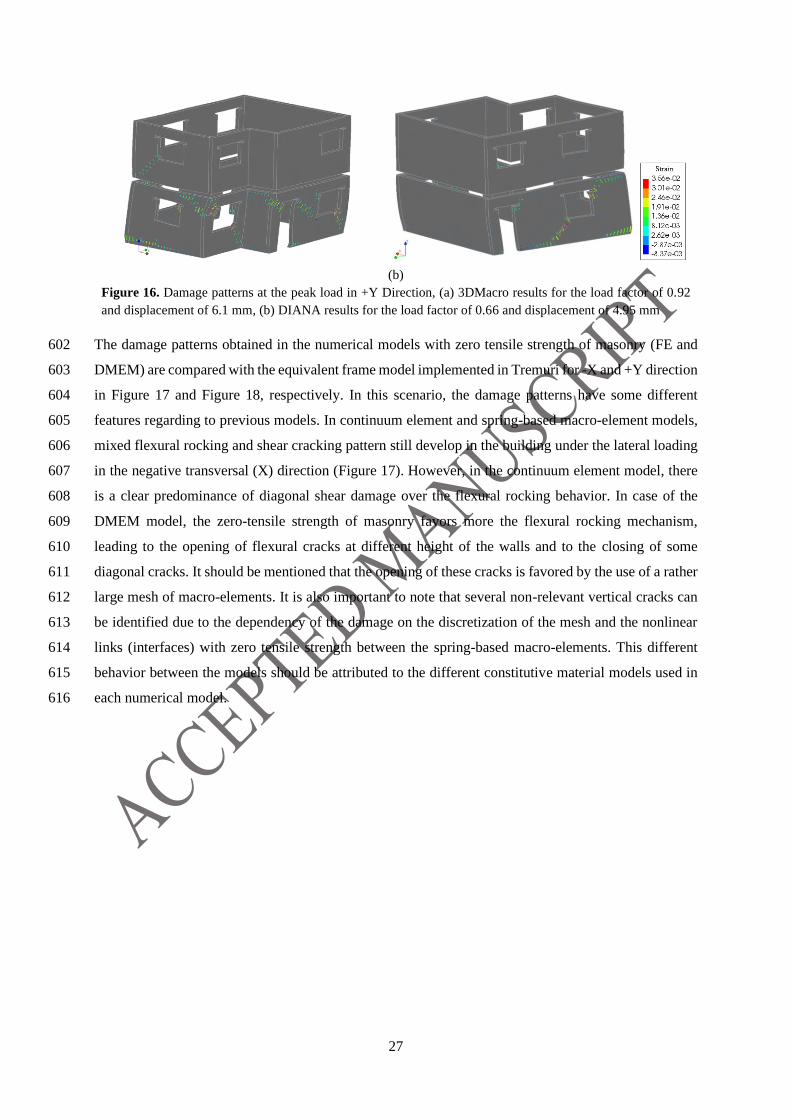
Figure 16. Damage patterns at the peak load in +Y Direction, (a) 3DMacro results for the load factor of 0.92
and displacement of 6.1 mm, (b) DIANA results for the load factor of 0.66 and displacement of 4.95 mm
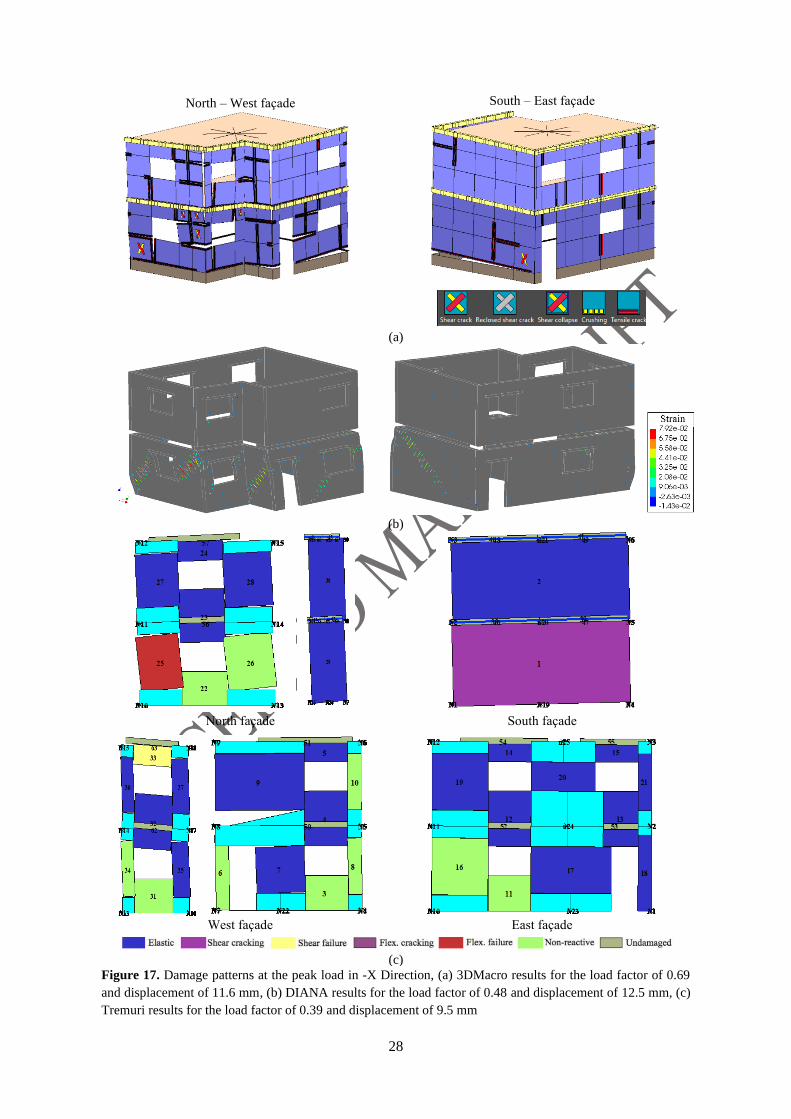
The damage patterns obtained in the numerical models with zero tensile strength of masonry (FE and 602
DMEM) are compared with the equivalent frame model implemented in Tremuri for -X and +Y direction 603
in Figure 17 and Figure 18, respectively. In this scenario, the damage patterns have some different 604
features regarding to previous models. In continuum element and spring-based macro-element models, 605
mixed flexural rocking and shear cracking pattern still develop in the building under the lateral loading 606
in the negative transversal (X) direction (Figure 17). However, in the continuum element model, there 607
is a clear predominance of diagonal shear damage over the flexural rocking behavior. In case of the 608
DMEM model, the zero-tensile strength of masonry favors more the flexural rocking mechanism, 609
leading to the opening of flexural cracks at different height of the walls and to the closing of some 610
diagonal cracks. It should be mentioned that the opening of these cracks is favored by the use of a rather 611
large mesh of macro-elements. It is also important to note that several non-relevant vertical cracks can 612
be identified due to the dependency of the damage on the discretization of the mesh and the nonlinear 613
links (interfaces) with zero tensile strength between the spring-based macro-elements. This different 614
behavior between the models should be attributed to the different constitutive material models used in 615
each numerical model. 616
28
North – West façade South – East façade
(a)
(b)
North façade
South façade
West façade
East façade
(c)
Figure 17. Damage patterns at the peak load in -X Direction, (a) 3DMacro results for the load factor of 0.69
and displacement of 11.6 mm, (b) DIANA results for the load factor of 0.48 and displacement of 12.5 mm, (c)
Tremuri results for the load factor of 0.39 and displacement of 9.5 mm
29
617 North – West façade South – East façade
(a)
(b)
North façade
South façade
West façade
East façade
(c)
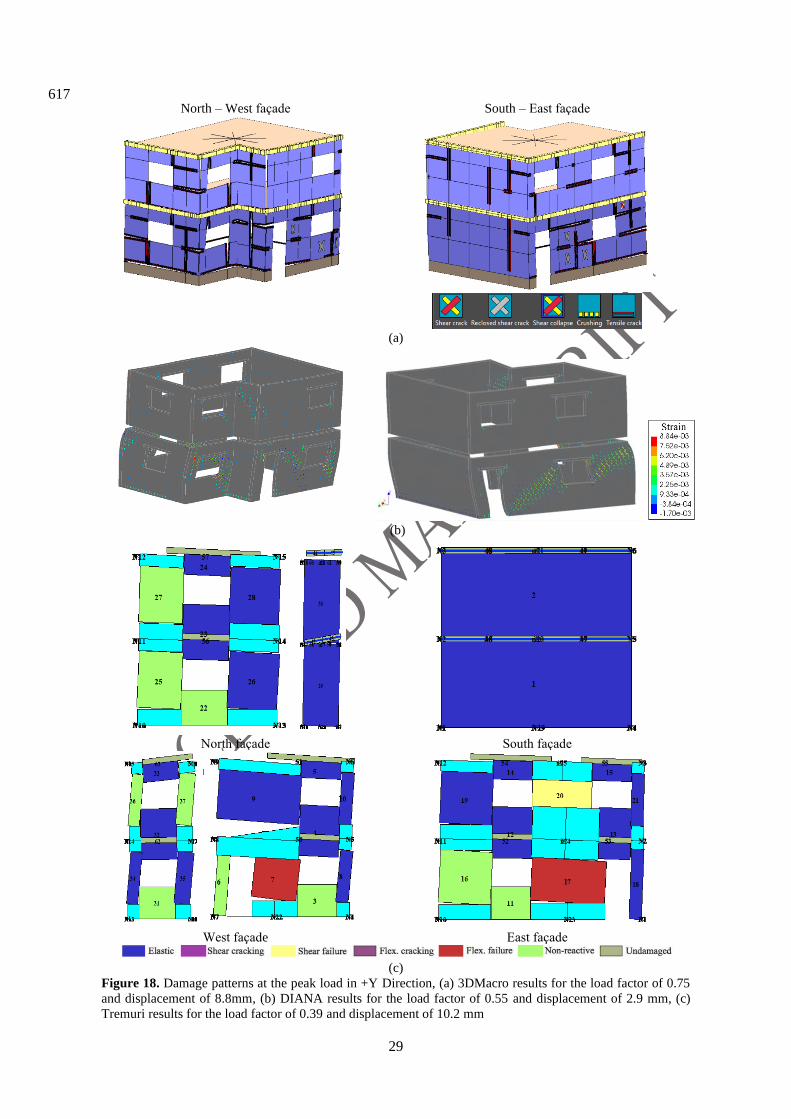
Figure 18. Damage patterns at the peak load in +Y Direction, (a) 3DMacro results for the load factor of 0.75
and displacement of 8.8mm, (b) DIANA results for the load factor of 0.55 and displacement of 2.9 mm, (c)
Tremuri results for the load factor of 0.39 and displacement of 10.2 mm
30
It is also seen that in both numerical approaches the damage observed on the second level reduces in 618
comparison to the models with finite tensile strength. In addition, the interaction between orthogonal 619
walls appears to reduce, which is particularly evident in the continuum model, due to the reduction of 620
the effectiveness of the connections at intersecting walls and thus to the lower influence of the “flange” 621
effects in the in-plane behavior of the walls. Regarding the results obtained in the beam-based macro-622
element model, it is seen that the global response is governed by flexural behavior in which in-plane 623
walls present a rocking mechanism concentrated on the North and South façades on the first floor. In 624
this regard, the significant difference in the load capacity presented in Table 10 can be attributed to the 625
different resisting mechanism characterizing the global behavior of the building, resulting in different 626
numerical damage patterns. Similar to the other numerical models, the major damage concentrates on 627
the first level. 628
The representative models subjected to lateral loading in the longitudinal (+Y) direction have 629
limited agreement in terms of damage patterns as shown in Figure 18. Again, combined flexural and 630
diagonal shear failure can be seen in the 3DMacro model. In fact, tensile cracks are not only observed 631
at the bottom of the in-plane and out-of-plane walls but also along with the pier elements. On the other 632
hand, the crack propagation on the continuum model shows dominant smeared diagonal shear damage 633
along the in-plane walls. In addition, North and West façades are exposed to tensile cracks which are 634
characterized by flexural failure. Even though the North wall is an out-of-plane wall in the longitudinal 635
direction, a moderate horizontal crack is observed at the bottom of the structural element, which results 636
naturally from the good connection between intersecting walls and rigid diaphragm. The equivalent 637
frame model in Tremuri (beam-based macro-element model) presents relatively more compatible 638
damage patterns with the continuum model in terms of flexural failure. In-plane walls exhibit flexural 639
failure at piers on the first floor while shear failure is also noted on the pier on the second level. 640
6. CONCLUSIONS 641
The present paper is focused on the seismic performance assessment of unreinforced masonry buildings 642
with structural irregularities in plan and elevation by means of nonlinear static analysis. The building 643
typology was selected regarding the residential building stock to replicate typical geometry. The main 644
motivation is to understand structural irregularity effects on the seismic response of different modeling 645
approaches. Even if continuum modeling approach is usually accepted as an accurate numerical 646
approach for the seismic assessment of masonry buildings, its application in engineering practice is 647
limited due to huge computational efforts and more simplified approaches are required. Thus, promising 648
simplified methodologies have been developed in the literature to perform structural assessment and 649
design of masonry buildings. Such developments are crucial to promote the construction of low- to mid-650
rise URM buildings in seismic prone zone supported by a reliable seismic design. 651
Within this scope, pushover analysis of an irregular concrete block masonry building tested in 652
a shaking table was carried out by using three different approaches, being one advanced and two 653
31
simplified, namely continuum model, spring-based macro-element and beam-based model, i.e. 654
equivalent frame model. In order to validate the implemented methodologies, the envelop curve of the 655
hysteretic response obtained from a dynamic shaking table test was used. 656
From the comparison of the results, multiple conclusions are stated as follows, 657
• The simplified approaches are less demanding, and, therefore, they are practical to apply in 658
engineering practice. 659
• The modulus of elasticity required for the modeling approaches has to be adjusted taking into 660
account the modeling particularities of each numerical model. This poses questions on the 661
reliability of displacement-based seismic assessment approaches for irregular masonry 662
buildings, given their higher dependency on elastic properties. 663
• Some inconsistency was found between the vibration modes in the different models, 664
particularly in case of the torsional ones. This poses questions on the reliability of the different 665
approaches for time history analysis of irregular masonry buildings, as the dynamic 666
characteristics of the approaches are quite different. 667
• Given the important torsional components found, the mode-proportional distribution of inertial 668
forces in case of irregular buildings should not be used. In case of pushover analyses of 669
irregular masonry buildings, which is questionable but may be the only available tool for 670
professionals, only uniform and inverted triangle mass distributions should be used. 671
• Considering masonry tensile strength, it was observed that the results from the continuum 672
model approached relatively well the experimental envelop, being the average difference of 673
4% considering all directions. The simplified model built-in 3DMacro software provided, in 674
general, higher values when compared to experimental results. 675
• When the tensile strength of masonry was considered to be equal to zero in the 3DMacro and 676
Diana model, the maximum capacity was closer to the experimental response. 677
• The Tremuri model appeared to be excessively conservative as the maximum capacity of the 678
building was considerably lower than the experimental load capacity. Compared to the 679
3DMacro and Diana model, with zero-tensile strength, the Tremuri model registered lower 680
maximum capacity. 681
• A reasonable agreement was found between experimental and numerical failure modes. Some 682
horizontal cracks developed on the second level in the experimental models, could not be 683
found in the numerical models. 684
• Torsional effects were obtained on the continuum and spring-based macro-element model in 685
which combined rocking and diagonal shear failure mechanisms was observed. This highlights 686
the relevance of the good connections between intersecting walls and between walls and the 687
32
rigid reinforced concrete slabs. The equivalent frame model has limitations to capture damage 688
due to torsion. 689
ACKNOWLEDGEMENTS 690
The first author acknowledges the financial support from the Portuguese Foundation for Science 691
and Technology (FCT) through the Ph.D. Grant SFRH/BD/143949/2019. This work is financed by 692
national funds through FCT, in the scope of the research project “Experimental and Numerical 693
Pushover Analysis of Masonry Buildings (PUMA) (PTDC/ECI-EGC/29010/2017). 694
REFERENCES 695
[1] Jaiswal K, Wald D, Porter K. A global building inventory for earthquake loss estimation and risk 696
management. Earthq Spectra 2010;26:731–48. doi:10.1193/1.3450316. 697
[2] Maio R, Ferreira TM, Estêvão JMC, Pantò B, Caliò I, Vicente R. Seismic performance-based 698
assessment of urban cultural heritage assets through different macroelement approaches. J Build 699
Eng 2020;29. doi:10.1016/j.jobe.2019.101083. 700
[3] Greco A, Lombardo G, Pantò B, Famà A. Seismic Vulnerability of Historical Masonry 701
Aggregate Buildings in Oriental Sicily. Int J Archit Herit 2018;00:1–24. 702
doi:10.1080/15583058.2018.1553075. 703
[4] Marques R, Lourenço PB. Unreinforced and confined masonry buildings in seismic regions: 704
Validation of macro-element models and cost analysis. Eng Struct 2014;64:52–67. 705
doi:10.1016/j.engstruct.2014.01.014. 706
[5] EERI. World Housing Encyclopedia 2007. http://db.world-housing.net/. 707
[6] Jaiswal KS, Wald DJ. Creating a Global Building Inventory for Earthquake Loss Assessment 708
and Risk Management: U.S. Geological Survey Open-File Report 2008;1160:113. 709
[7] Lourenço PB, Mendes N, Ramos LF, Oliveira D V. Analysis of masonry structures without box 710
behavior. Int J Archit Herit 2011;5:369–82. doi:10.1080/15583058.2010.528824. 711
[8] Betti M, Galano L, Vignoli A. Comparative analysis on the seismic behaviour of unreinforced 712
masonry buildings with flexible diaphragms. Eng Struct 2014;61:195–208. 713
doi:10.1016/j.engstruct.2013.12.038. 714
[9] Nakamura Y, Derakhshan H, Magenes G, Michael C, Nakamura Y, Derakhshan H, et al. 715
Influence of Diaphragm Flexibility on Seismic Response of Unreinforced Masonry Buildings 716
Influence of Diaphragm Flexibility on Seismic Response of Unreinforced Masonry Buildings 717
2017;2469. doi:10.1080/13632469.2016.1190799. 718
[10] Scotta R, Trutalli D, Marchi L, Pozza L. Seismic performance of URM buildings with in-plane 719
non-sti ff ened and sti ff ened timber fl oors. Eng Struct 2018;167:683–94. 720
doi:10.1016/j.engstruct.2018.02.060. 721
[11] Magenes G, Calvi GM, Kingsley GR. Seismic Testing of a Full-Scale, Two-Story Masonry 722
33
Building: Test Procedure and Measured Experimental Response. Experimental and Numerical 723
Investigation on a brick Masonry Building Prototype – Numerical Prediction of the Experiment 724
1995. 725
[12] Avila L, Vasconcelos G, Lourenço PB. Experimental seismic performance assessment of 726
asymmetric masonry buildings. Eng Struct 2018;155:298–314. 727
doi:10.1016/j.engstruct.2017.10.059. 728
[13] Azizi-Bondarabadi H, Mendes N, Lourenço PB. Higher Mode Effects in Pushover Analysis of 729
Irregular Masonry Buildings. J Earthq Eng 2019;0:1–35. doi:10.1080/13632469.2019.1579770. 730
[14] Yi T, Moon FL, Leon RT, Kahn LF. Lateral Load Tests on a Two-Story Unreinforced Masonry 731
Building. J Struct Eng 2006;132:643–52. doi:10.1061/(asce)0733-9445(2006)132:5(643). 732
[15] Graziotti F, Tomassetti U, Kallioras S, Penna A, Magenes G. Shaking table test on a full scale 733
URM cavity wall building. Bull Earthq Eng 2017;15:5329–64. doi:10.1007/s10518-017-0185-8. 734
[16] Avila L. Seismic behavior of concrete block masonry buildings. PhD Thesis, University of 735
Minho, 2014. 736
[17] Mendes N. Seismic Assessment of Ancient Masonry Buildings : Shaking Table Tests and 737
Numerical Analysis. PhD Thesis, University of Minho, 2012. 738
[18] Lourenço PB, Mendes N, Marques R. Earthquake design and assessment of masonry structures: 739
review and applications. Earthq Des Assess Mason Struct Rev Appl 2009:77–101. 740
doi:10.4203/csets.22.4. 741
[19] Lagomarsino S, Cattari S. PERPETUATE guidelines for seismic performance-based assessment 742
of cultural heritage masonry structures. Bull Earthq Eng 2015;13:13–47. doi:10.1007/s10518-743
014-9674-1. 744
[20] Chácara C, Cannizzaro F, Pantò B, Caliò I, Lourenço PB. Seismic vulnerability of URM 745
structures based on a Discrete Macro-Element Modeling (DMEM) approach. Eng Struct 746
2019;201:109715. doi:10.1016/j.engstruct.2019.109715. 747
[21] Fajfar P. A Nonlinear Analysis Method for Performance-Based Seismic Design. Earthq Spectra 748
2000;16:573–92. doi:10.1193/1.1586128. 749
[22] Priestley MJN, Grant DN, Blandon CA. Direct displacement-based seismic design. NZSEE 750
Conf., 2005. doi:10.1016/S0141-0296(01)00048-7. 751
[23] Fajfar P, Marusic D, Perus I. Torsional Effects in the Pushover-Based Seismic Analysis of 752
Buildings. J Earthq Eng 2011;9:831–54. doi:10.1080/13632460509350568. 753
[24] Kreslin M, Fajfar P. The extended N2 method considering higher mode effects in both plan and 754
elevation. Bull Earthq Eng 2012;10:695–715. doi:10.1007/s10518-011-9319-6. 755
[25] De Stefano M, Mariani V. Pushover Analysis for Plan Irregular Building Structures. In: Ansal 756
A, editor. Perspect. Eur. Earthq. Eng. Seismol., 2014. 757
[26] Chácara C, Cannizzaro F, Pantò B, Caliò I, Lourenço PB. Seismic vulnerability of URM 758
structures based on a Discrete Macro-Element Modeling (DMEM) approach. Eng Struct 759
34
2019;201:109715. doi:10.1016/j.engstruct.2019.109715. 760
[27] Aşıkoğlu A, Avşar Ö, Lourenço PB, Silva LC. Effectiveness of seismic retrofitting of a historical 761
masonry structure: Kütahya Kurşunlu Mosque, Turkey. Bull Earthq Eng 2019. 762
doi:10.1007/s10518-019-00603-6. 763
[28] Ciocci MP, Sharma S, Lourenço PB. Engineering simulations of a super-complex cultural 764
heritage building: Ica Cathedral in Peru. Meccanica 2018;53:1931–58. 765
[29] Karanikoloudis G, Lourenço PB. Structural assessment and seismic vulnerability of earthen 766
historic structures. Application of sophisticated numerical and simple analytical models. Eng 767
Struct 2018;160:488–509. 768
[30] Mendes N, Lourenco PB. Seismic assessment of masonry Gaioleiro buildings in Lisbon, 769
Portugal. J Earthq Eng 2010;14:80–101. doi:10.1080/13632460902977474. 770
[31] Ramírez R, Mendes N, Lourenço PB. Diagnosis and Seismic Behavior Evaluation of the Church 771
of São Miguel de Refojos (Portugal). Buildings 2019;9:138. doi:10.3390/buildings9060138. 772
[32] Silva LC, Mendes N, Lourenço PB, Ingham J. Seismic Structural Assessment of the Christchurch 773
Catholic Basilica, New Zealand. Structures 2018;15:115–30. doi:10.1016/j.istruc.2018.06.004. 774
[33] Baraldi D, Cecchi A. A full 3D rigid block model for the collapse behaviour of masonry walls. 775
Eur J Mech A/Solids 2017;64:11–28. doi:10.1016/j.euromechsol.2017.01.012. 776
[34] D’Altri AM, de Miranda S, Castellazzi G, Sarhosis V. A 3D detailed micro-model for the in-777
plane and out-of-plane numerical analysis of masonry panels. Comput Struct 2018;206:18–30. 778
doi:10.1016/j.compstruc.2018.06.007. 779
[35] Portioli F, Casapulla C, Gilbert M, Cascini L. Limit analysis of 3D masonry block structures 780
with non-associative frictional joints using cone programming. Comput Struct 2014;143:108–781
21. doi:10.1016/j.compstruc.2014.07.010. 782
[36] Milani G. 3D upper bound limit analysis of multi-leaf masonry walls. Int J Mech Sci 783
2008;50:817–36. doi:10.1016/j.ijmecsci.2007.11.003. 784
[37] Lourenço PB, Rots JG. Multisurface interface model for analysis of masonry structures. J Eng 785
Mech 1997;123:660–8. doi:10.1061/(ASCE)0733-9399(1997)123:7(660). 786
[38] Chisari C, Macorini L, Amadio C, Izzuddin BA. Identification of mesoscale model parameters 787
for brick-masonry. Int J Solids Struct 2018;146:224–40. doi:10.1016/j.ijsolstr.2018.04.003. 788
[39] Silva LC, Lourenço PB, Milani G. Numerical homogenization-based seismic assessment of an 789
English-bond masonry prototype: structural level application. Earthq Eng Struct Dyn 2020:1–790
22. doi:10.1002/eqe.3267. 791
[40] Lemos J V. Discrete element modeling of masonry structures. Int J Archit Herit 2007;1:190–792
213. doi:10.1080/15583050601176868. 793
[41] Caliò I, Marletta M, Pantò B. A new discrete element model for the evaluation of the seismic 794
behaviour of unreinforced masonry buildings. Eng Struct 2012;40:327–38. 795
doi:10.1016/j.engstruct.2012.02.039. 796
35
[42] 3DMacro. (computer program for the seismic assessment of masonry buildings), Release 3.0, 797
Gruppo Sismica s.r.l. 2014. 798
[43] Lagomarsino S, Penna A, Galasco A, Cattari S. TREMURI program: An equivalent frame model 799
for the nonlinear seismic analysis of masonry buildings. Eng Struct 2013;56:1787–99. 800
doi:10.1016/j.engstruct.2013.08.002. 801
[44] Marino S, Cattari S, Lagomarsino S, Dizhur D, Ingham JM. Post-earthquake Damage Simulation 802
of Two Colonial Unreinforced Clay Brick Masonry Buildings Using the Equivalent Frame 803
Approach. Structures 2019;19:212–26. doi:10.1016/j.istruc.2019.01.010. 804
[45] Lagomarsino S, Camilletti D, Cattari S, Marino S. Seismic assessment of existing irregular 805
masonry buildings by nonlinear static and dynamic analyses. Geotech Geol Earthq Eng 806
2018;46:123–51. doi:10.1007/978-3-319-75741-4_5. 807
[46] Penna A, Senaldi IE, Galasco A, Magenes G. Numerical Simulation of Shaking Table Tests on 808
Full-Scale Stone Masonry Buildings. Int J Archit Herit 2016;10:146–63. 809
doi:10.1080/15583058.2015.1113338. 810
[47] Bracchi S, Penna A, Magenes G. Consideration of modelling uncertainties in the seismic 811
assessment of masonry buildings by equivalent-frame approach. Bull Earthq Eng 2015:3423–48. 812
doi:10.1007/s10518-015-9760-z. 813
[48] Bartoli G, Betti M, Biagini P, Borghini A, Ciavattone A, Girardi M, et al. Epistemic Uncertainties 814
in Structural Modeling : A Blind Benchmark for Seismic Assessment of Slender Masonry 815
Towers 2017;31:1–18. doi:10.1061/(ASCE)CF.1943-5509.0001049. 816
[49] Cattari S, Ottonelli D, Degli S, Magenes G, Filippo C. Use of computer programs for the 817
nonlinear seismic analysis of masonry buildings : comparison of the results obtained with 818
different software on an actual case study Uso dei codici di calcolo per l ’ analisi sismica 819
nonlineare di edifici in muratura : con 2019:235–45. 820
[50] Marques R, Lourenço PB. Possibilities and comparison of structural component models for the 821
seismic assessment of modern unreinforced masonry buildings. Comput Struct 2011;89:2079–822
91. doi:10.1016/j.compstruc.2011.05.021. 823
[51] Magenes G, Della Fontana A. Simplified Non-Linear Seismic Analysis of Masonry Buildings. 824
Proc Br Maasonry Soc 1998:1–313. doi:10.6092/UNINA/FEDOA/8417. 825
[52] Pantò B, Cannizzaro F, Caliò I, Lourenço PB. Numerical and Experimental Validation of a 3D 826
Macro-Model for the In-Plane and Out-Of-Plane Behavior of Unreinforced Masonry Walls. Int 827
J Archit Herit 2017;11:946–64. doi:10.1080/15583058.2017.1325539. 828
[53] Chácara E. CJ. Macro-Element Nonlinear Dynamic Analysis for the Assessment of the Seismic 829
Vulnerability of Masonry Structures. 2018:1–173. 830
[54] Bondarabadi HA. Analytical and empirical seismic fragility analysis of irregular URM buildings 831
with box behavior. University of Minho, 2018. 832
[55] D’Altri A, Sarhosis V, Milani G, Rots J, Cattari S, Lagomarsino S, et al. Modeling Strategies for 833
36
the Computational Analysis of Unreinforced Masonry Structures: Review and Classification. 834
Arch Comput Methods Eng 2019. doi:10.1007/s11831-019-09351-x. 835
[56] Theodossopoulos D, Sinha B. A review of analytical methods in the current design processes 836
and assessment of performance of masonry structures. Constr Build Mater 2013;41:990–1001. 837
doi:10.1016/j.conbuildmat.2012.07.095. 838
[57] Tomaževič M. Earthquake-Resistant Design of Masonry Building. London: Imperial College 839
Press; 1999. 840
[58] Calderini C, Cattari S, Lagomarsino S. In-plane strength of unreinforced masonry piers. Earthq 841
Eng Struct Dyn 2009;38:243–67. doi:10.1002/eqe.860. 842
[59] Betti M, Galano L, Petracchi M, Vignoli A. Diagonal cracking shear strength of unreinforced 843
masonry panels: a correction proposal of the b shape factor. Bull Earthq Eng 2015;13:3151–86. 844
doi:10.1007/s10518-015-9756-8. 845
[60] Tomaževič M. The computer program POR. Report ZRMK 1978. 846
[61] D’Asdia P, Viskovic A. Analyses of a masonry wall subjected to horizontal actions on its plane, 847
employing a non-linear procedure using changing shape finite element. Trans Model Simul 848
1995;10:519–26. doi:10.2495/CMEM950571. 849
[62] Braga F, Liberatore D. A finite element for the analysis of the response of masonry buildings. 850
5th North Am. Mason. Conf., Urbana: 1990, p. 201–12. 851
[63] Foraboschi P, Vanin A. Non-linear static analysis of masonry buildings based on a strut-and-tie 852
modeling. Soil Dyn Earthq Eng 2013;55:44–58. doi:10.1016/j.soildyn.2013.08.005. 853
[64] Braga F, Liberatore D, Spera G. A computer program for the seismic analysis of complex 854
masonry buildings. Comput. Methods Struct. Mason. - 4th Int. Symp., Firenze: 1997, p. 309–16. 855
[65] Lourenço PB, Avila L, Vasconcelos G, Alves JPP, Mendes N, Costa AC. Experimental 856
investigation on the seismic performance of masonry buildings using shaking table testing. Bull 857
Earthq Eng 2013;11:1157–90. doi:10.1007/s10518-012-9410-7. 858
[66] Eurocode 8. EN 1998-1: Design of structures for earthquake resistance - Part 1: General rules, 859
seismic actions and rules for buildings 2004. 860
[67] Carvalho E. Seismic testing of structures. Earthq Eng Pap Proc Elev Eur Conf 1999;2:53. 861
[68] Eurocode 8. Design of structures for earthquake resistancepart 3: Assessment and retrofitting of 862
buildings 2005. 863
[69] Lourenço PB. Computations on historic masonry structures. Prog Struct Eng Mater 2002;4:301–864
19. doi:10.1002/pse.120. 865
[70] Chácara C, Lourenço PB, Pantò B, Cannizzaro F, Caliò I. Parametric numerical studies on the 866
dynamic response of unreinforced masonry structures. Struct Anal Hist Constr Anamn 867
Diagnosis, Ther Control - Proc 10th Int Conf Struct Anal Hist Constr SAHC 2016 2016:239–45. 868
doi:10.1201/9781315616995-30. 869
[71] Pantò B, Giresini L, Sassu M, Caliò I. Non-linear modeling of masonry churches through a 870
37
discrete macro-element approach. Earthq Struct 2017;12:223–36. 871
doi:10.12989/eas.2017.12.2.223. 872
[72] Magenes G, Calvi GM. Cyclic behavior of brick masonry walls. 10th World Conf. Earthq. Eng., 873
Rotterdam: 1992, p. 3517–22. 874
[73] Vasconcelos GFM. Experimental investigations on the mechanics of stone masonry: 875
Characterization of granites and behavior of ancient masonry shear walls. PhD Thesis 2005:266. 876
[74] Araújo A. Modelling of the Seismic Performance of Connections and Walls in Ancient Masonry 877
Buildings. PhD Thesis, University of Minho, 2014. 878
[75] Petry S, Beyer K. Influence of boundary conditions and size effect on the drift capacity of URM 879
walls. Eng Struct 2014;65:76–88. doi:10.1016/j.engstruct.2014.01.048. 880
[76] Simões A. Evaluation of the seismic vulnerability of the unreinforced masonry buildings 881
constructed in the transition between the 19 th and 20 th centuries in Lisbon, Portugal. PhD 882
Thesis, Universidade de Lisboa Instituto Superior Tecnico, 2018. 883
[77] Magenes G, Penna A, Galasco A, da Paré M. In-plane cyclic shear tests of undressed double leaf 884
stone masonry panels. 8th Int Masorny Conf 2010:1–10. 885
[78] Lagomarsino S, Penna A, Galasco A. TREMURI program: seismic analysis program for 3D 886
masonry buildings. Univ Genoa 2006. 887
[79] DIANA FEA. User’s Manual Release 10.2 2017. 888
[80] Angelillo M, Lourenço P, Milani G. Masonry behavior and modelling. In: Angelillo M, editor. 889
Mech. Mason. Struct., Udine: CISM International Centre for Mechanical Sciences, Springer; 890
2014, p. 1–24. 891
[81] Gambarotta L, Lagomarsino S. Damage Models for the seismic response of brck masonry shear 892
walls. Part II: the continuum model and its applications. Earthq Eng Struct Dyn 1997;26:441–893
62. 894
[82] Penna A, Lagomarsino S, Galasco A. A nonlinear macroelement model for the seismic analysis 895
of masonry buildings. Earthq Eng Struct Dyn 2014;43:159–79. 896
[83] Pantò B, Cannizzaro F, Caliò I, Lourenço PB. Numerical and Experimental Validation of a 3D 897
Macro-Model for the In-Plane and Out-Of-Plane Behavior of Unreinforced Masonry Walls. Int 898
J Archit Herit 2017;11:946–64. doi:10.1080/15583058.2017.1325539. 899
[84] Mann W, Muller H. Failure of shear-stressed masonry. An enlarged theory, tests and application 900
to shear walls. Proc Br Ceram Soc 1982:223. 901
[85] Eurocode 6. Design of masonry structures - Part 1-1: General rules for reinforced and 902
unreinforced masonry structures. 2005. 903
[86] Gruppo Sismica. 3DMacro - Manuale Teorico 2013. 904
[87] Lagomarsino S, Penna A, Galasco A, Cattari S. TREMURI program: seismic analyses of 3D 905
masonry buildings 2012. 906
[88] Siano R, Sepe V, Camata G, Spacone E, Roca P, Pelà L. Analysis of the performance in the 907
38
linear field of Equivalent-Frame Models for regular and irregular masonry walls. Eng Struct 908
2017;145:190–210. doi:10.1016/j.engstruct.2017.05.017. 909
[89] Caliò I, Cannizzaro F, D’Amore E, Marletta M, Pantò B. A new discrete-element approach for 910
the assessment of the seismic resistance of composite reinforced concrete-masonry buildings. 911
AIP Conf Proc 2008;1020:832–9. doi:10.1063/1.2963920. 912
[90] Cannizzaro F, Pantò B, Lepidi M, Caddemi S, Caliò I. Multi-directional seismic assessment of 913
historical masonry buildings by means of macro-element modelling: Application to a building 914
damaged during the L’Aquila earthquake (Italy). Buildings 2017;7:1–24. 915
doi:10.3390/buildings7040106. 916
917
Related Documents


![Comparative Analysis of Regular and Irregular … buildings in pushover analysis was also studied [Ravikumar C M et.al. (2012)]. The response spectrum, time history and linking slab](https://static.cupdf.com/doc/110x72/5a9f4a387f8b9a8e178c8af0/pdfcomparative-analysis-of-regular-and-irregular-buildings-in-pushover-analysis.jpg)


