1 Progress Report to MDE October 22, 2009 Dr. Konstantin Vinnikov, Acting State Climatologist for Maryland Prof. Russell Dickerson, Department of Atmospheric and Oceanic Science University of Maryland at College Park, MD Diurnal-Seasonal and Longer Time Scale Variation of Power Plants Emissions at Maryland and other East Coast States Partly supported by NASA

1 Progress Report to MDE October 22, 2009 Dr. Konstantin Vinnikov, Acting State Climatologist for Maryland Prof. Russell Dickerson, Department of Atmospheric.
Dec 19, 2015
Welcome message from author
This document is posted to help you gain knowledge. Please leave a comment to let me know what you think about it! Share it to your friends and learn new things together.
Transcript
1
Progress Report to MDEOctober 22, 2009
Dr. Konstantin Vinnikov, Acting State Climatologist for Maryland
Prof. Russell Dickerson, Department of Atmospheric and Oceanic Science
University of Maryland at College Park, MD
Diurnal-Seasonal and Longer Time Scale Variation of
Power Plants Emissions at Marylandand other East Coast States
Partly supported by NASA
2
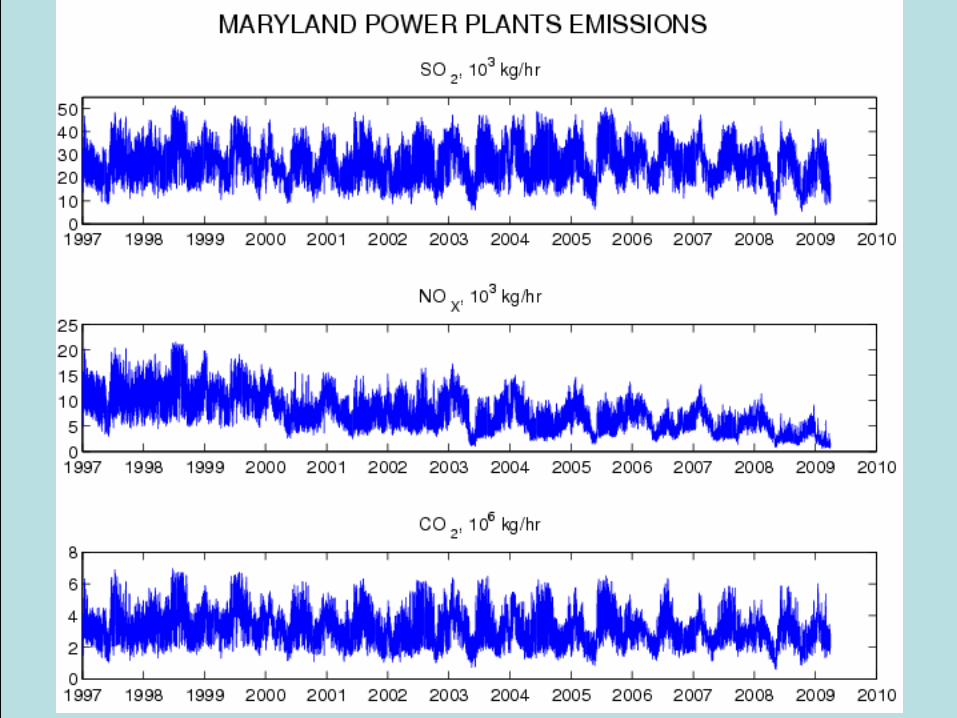
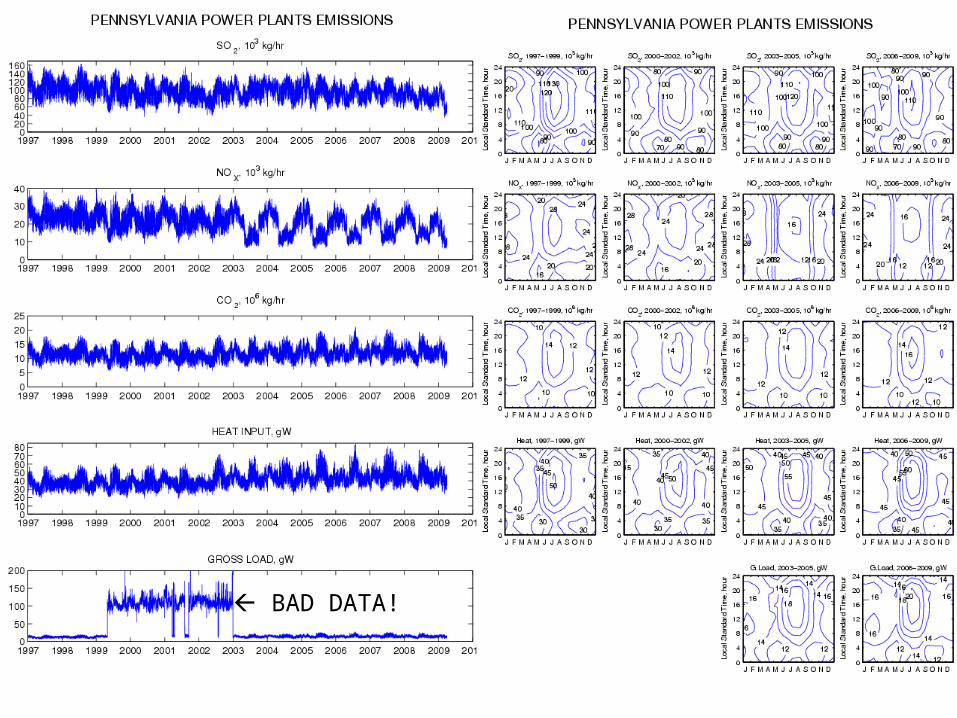
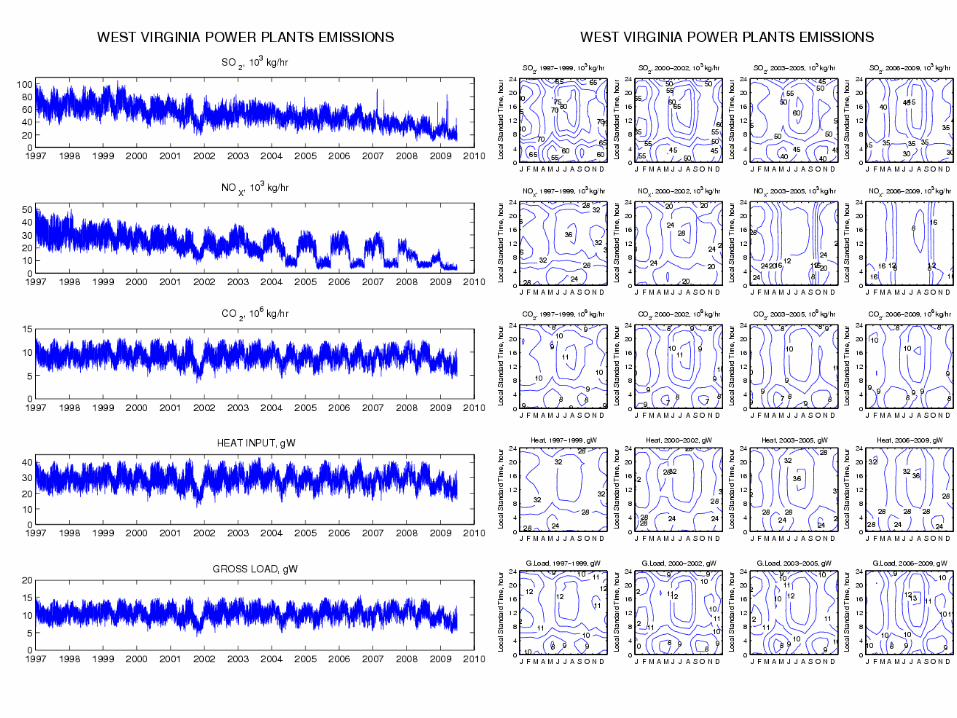
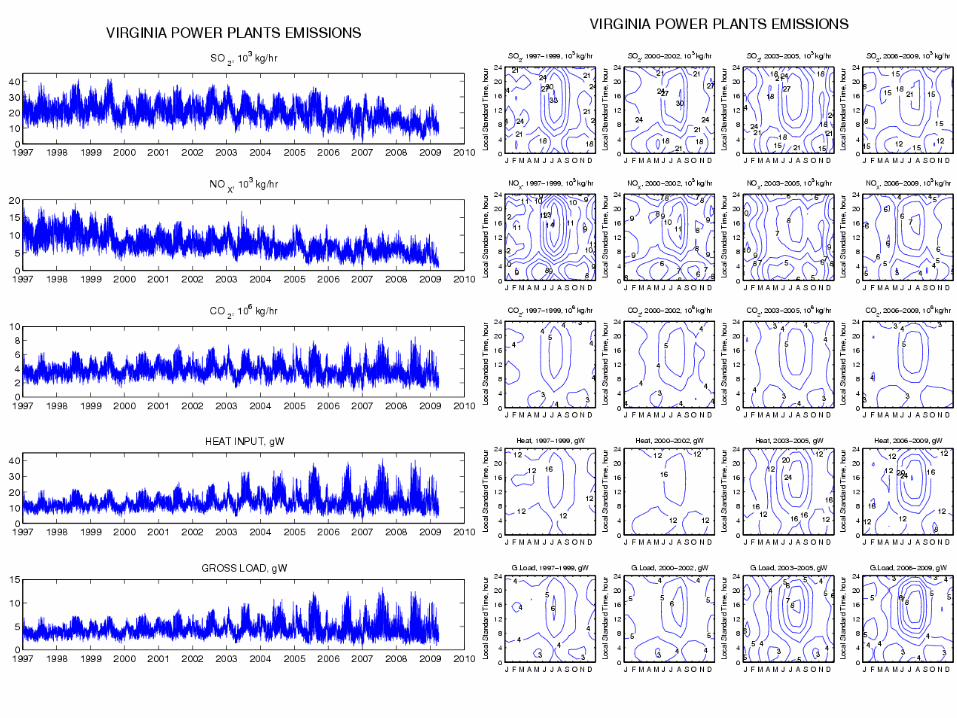
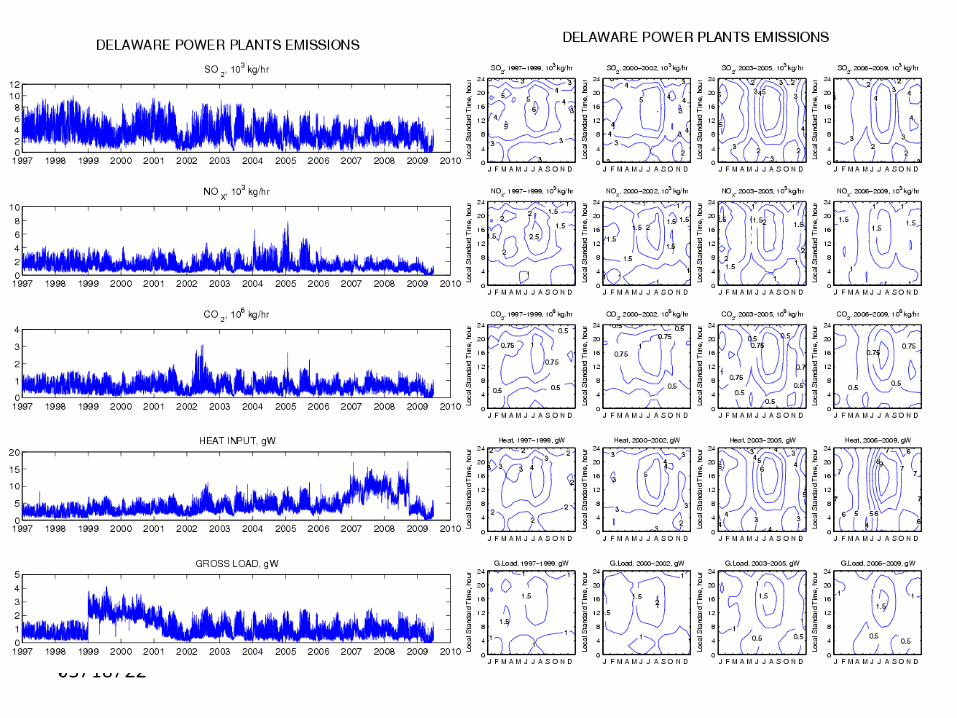
• Time series of Hourly Emissions of SO2, NOx, CO2, Heat, Electricity
• Changes in Seasonal/Diurnal Cycles
• Regional Climatic ForcingUsed EPA Prepackaged Power Plants Emissions Data Sets:
http://camddataandmaps.epa.gov/gdm/index.cfm?fuseaction=emissions.wizard
Objectives:
-To look at diurnal and seasonal trends in emission for atmospheric budget studies;- To help NASA understand what a Geostationary Satellite
can do that a Polar orbiter cannot.
3
4

5
MARYLAND POWER PLANTS EMISSIONS. Workdays - Weekends
6
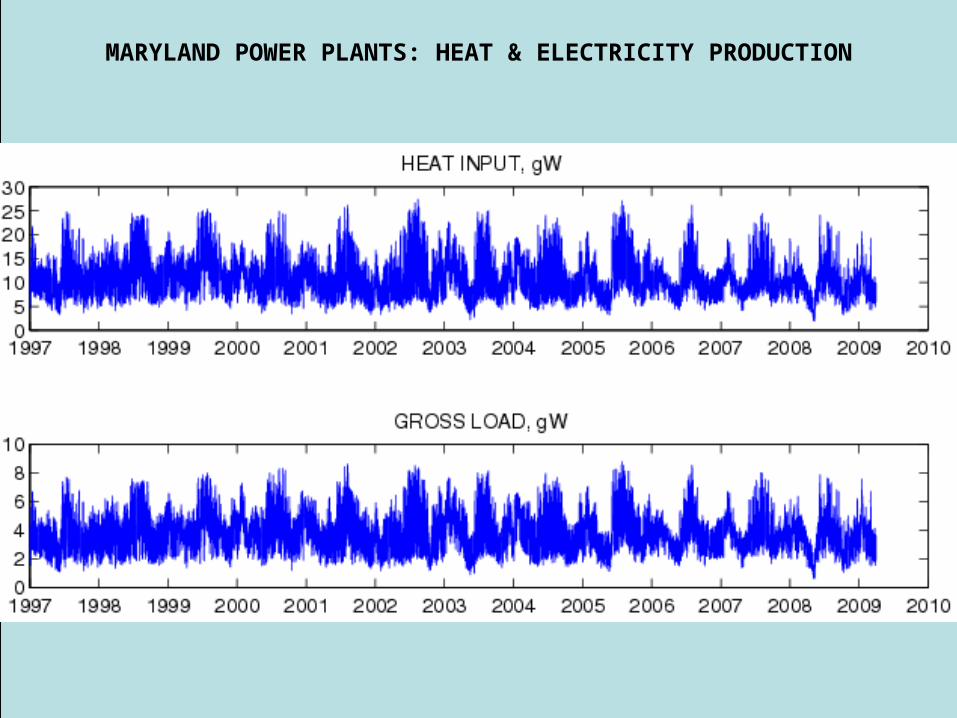
MARYLAND POWER PLANTS: HEAT & ELECTRICITY PRODUCTION
7
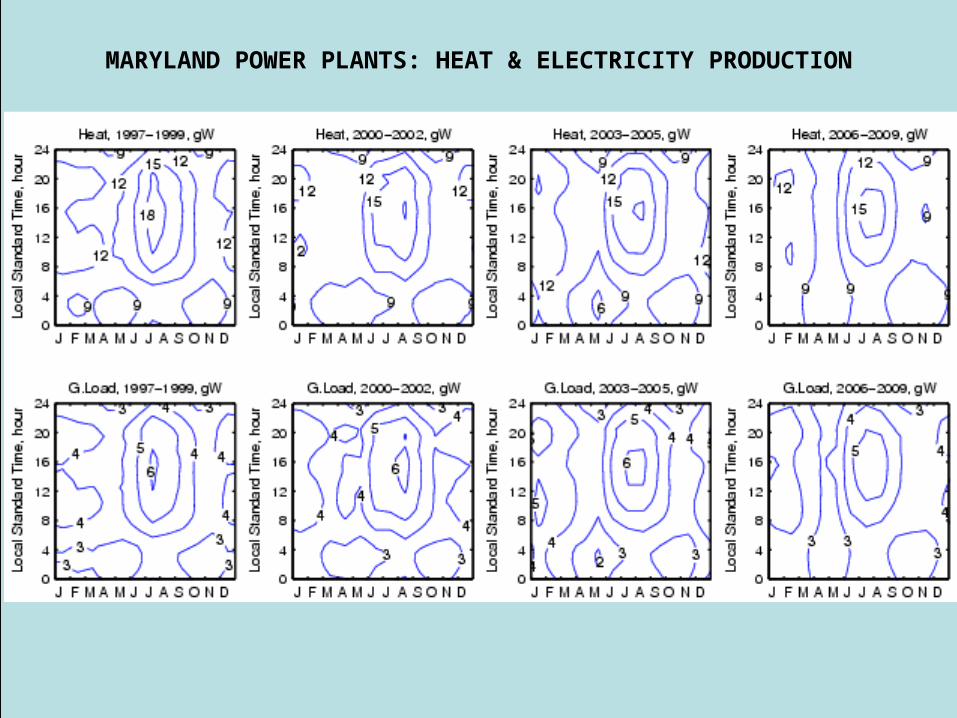
MARYLAND POWER PLANTS: HEAT & ELECTRICITY PRODUCTION
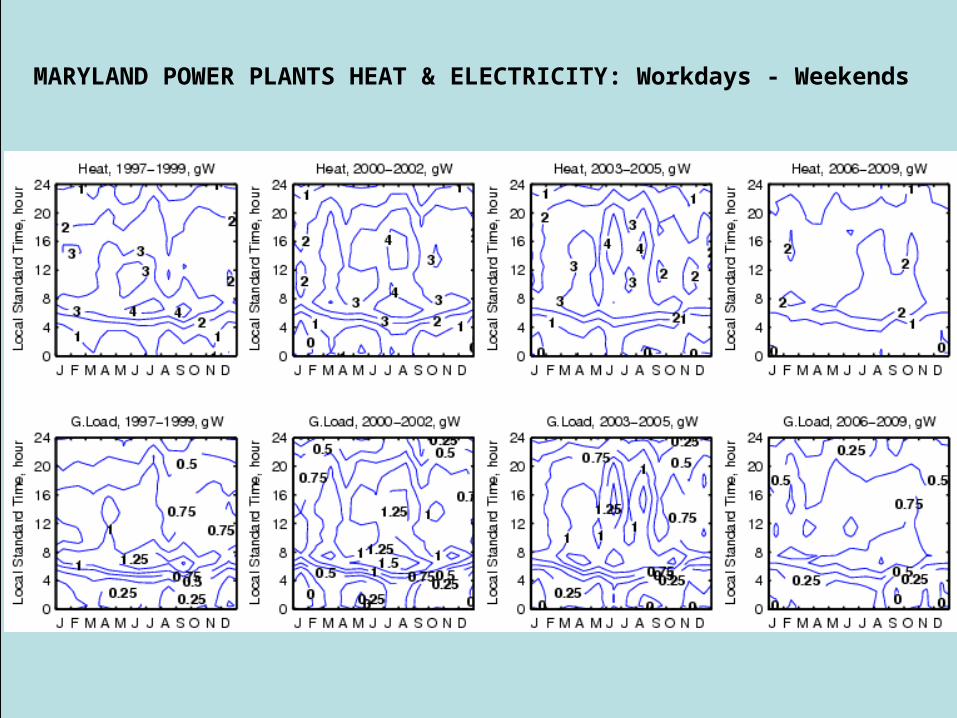
MARYLAND POWER PLANTS HEAT & ELECTRICITY: Workdays - Weekends
04/18/23
BAD DATA!

STATESSUMMER/
AFTERNOON HEAT FORCING
W/m2
NY 0.3NJ 0.7PA 0.5OH 1.2DE 1.4WV 0.6MD 0.5VA 0.2
Climatic Forcing 1 W/m2 ⟶ Global Warming ≈0.75 ºC
HEAT EMISSION BY POWER PLANTSCAN BE RESPONSIBLE FOR REGIONALCLIMATE CHANGE

THREE URBAN STATIONS:
THREE RURAL, HIGH ELEVATED MOUNTIAN STATIONS:
SCALES OF TEMPORAL AUTOCORRELATION IN SO2 VARIATIONS, HOURS
It is assumed that lag-correlation functions of observed temporal SO2 variations can be approximated as R(t) =exp(t/T), where t is lag, and T is decay time. This time is needed for observed anomaly of SO2 concentration to decrease e times. For two physical processes with decay times T1 and T2, resulted decay time T=T1T2 / (T1+T2). The resulted T is always smaller than the smallest of T1 and T2.
15
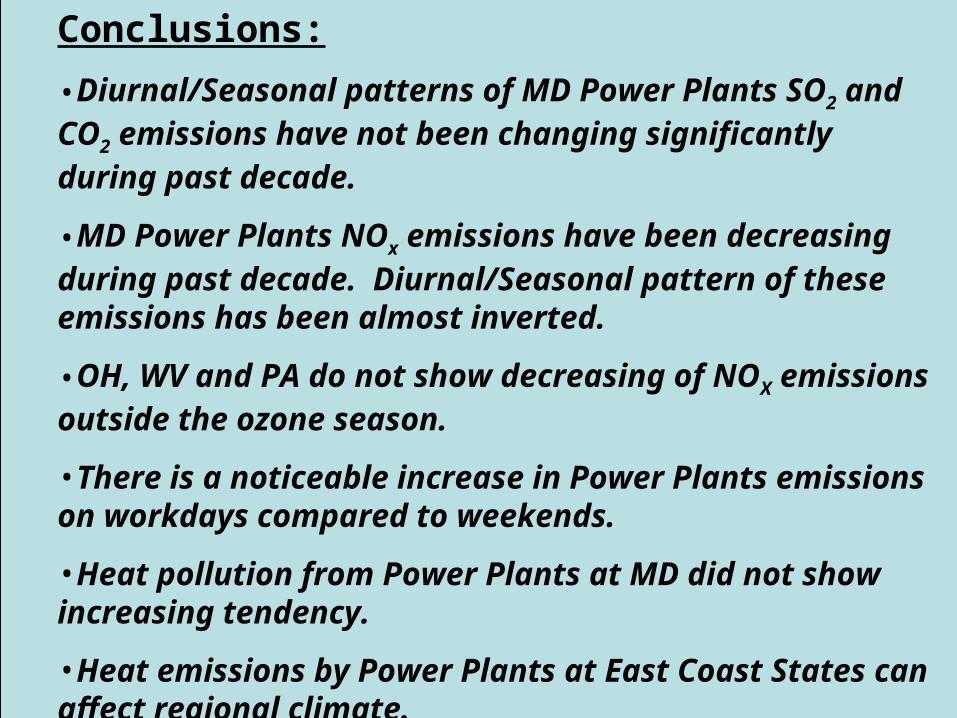
Conclusions:
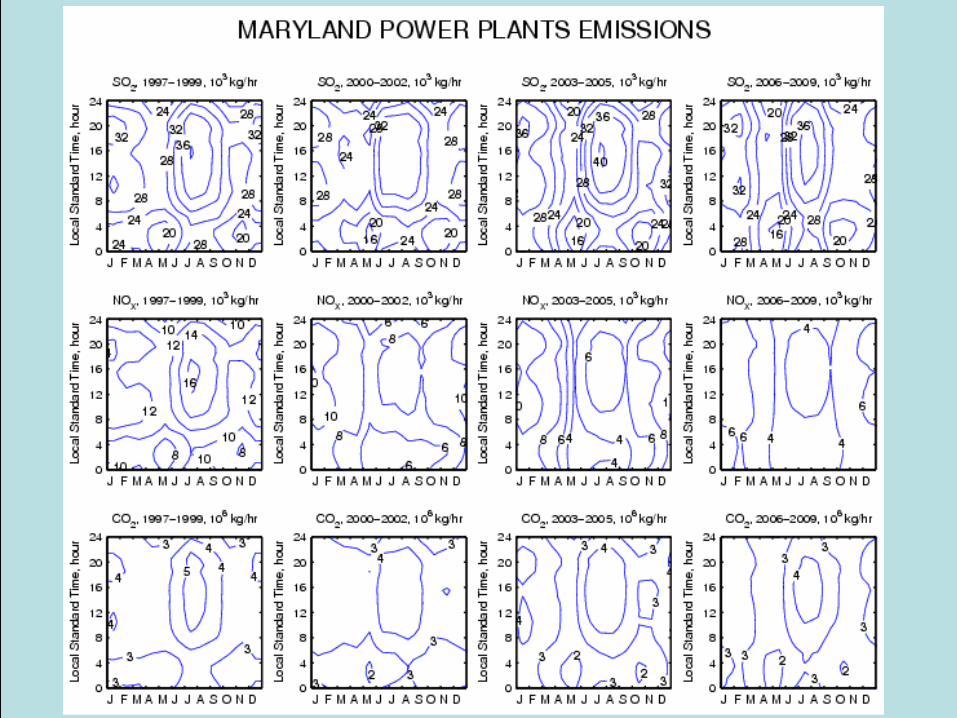
•Diurnal/Seasonal patterns of MD Power Plants SO2 and CO2 emissions have not been changing significantly during past decade.
•MD Power Plants NOx emissions have been decreasing during past decade. Diurnal/Seasonal pattern of these emissions has been almost inverted.
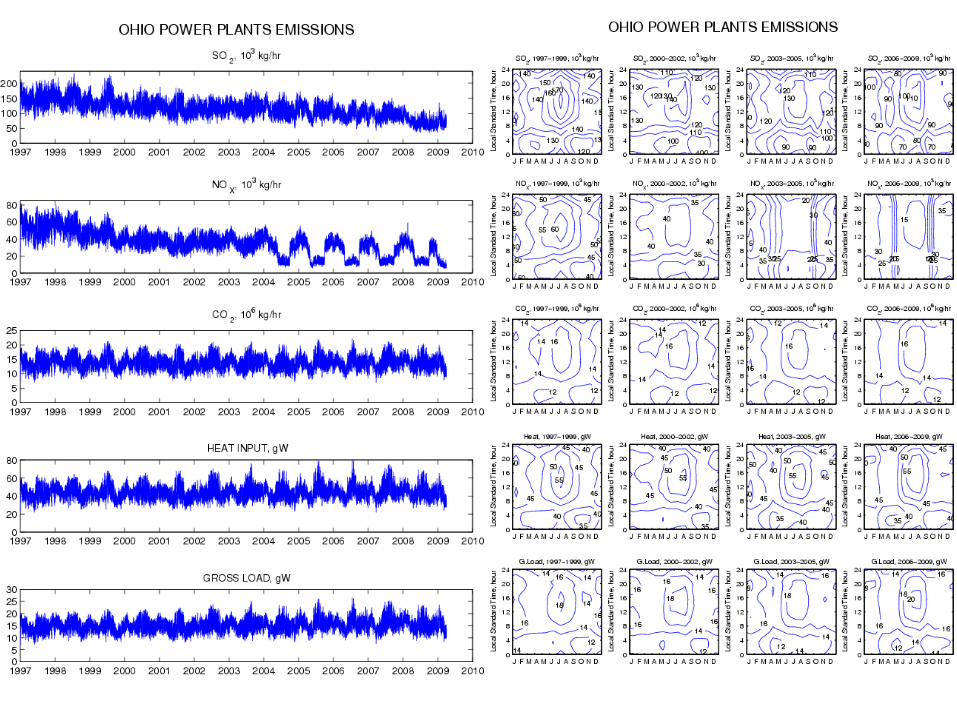
•OH, WV and PA do not show decreasing of NOX emissions outside the ozone season.
•There is a noticeable increase in Power Plants emissions on workdays compared to weekends.
•Heat pollution from Power Plants at MD did not show increasing tendency.
•Heat emissions by Power Plants at East Coast States can affect regional climate.
04/18/23

04/18/23

04/18/23
Related Documents