1 Production and Cost in the Short Run Chapter 7 © 2006 Thomson/South-Western

1 Production and Cost in the Short Run Chapter 7 © 2006 Thomson/South-Western.
Dec 20, 2015
Welcome message from author
This document is posted to help you gain knowledge. Please leave a comment to let me know what you think about it! Share it to your friends and learn new things together.
Transcript

1
Production and Cost in the Short Run
Chapter 7
© 2006 Thomson/South-Western
2
Explicit and Implicit Costs
Explicit costs Refer to the firm’s actual cash payments for
resources wages, rent, taxes, etc.
Implicit costs The opportunity costs of using resources owned by
the firm or provided by the firm’s owners Require no cash payment and no entry in the firm’s
accounting statement, which records its revenues, explicit costs, and accounting profits
3
Alternative Measures of Profit
Wanda Wheeler currently earns $50,000 in her current jobShe decides to start her own businessShe withdraws $20,000 from her savings
account, hires and assistant and uses a spare bay in her garage that had been renting for $1,200 a year
Exhibit 1 shows the results after the first year

4
Exhibit 1: Accounts of Wheeler Dealer 2004

5
Normal Profit
Alternatively, the accounting profit just sufficient to ensure that all resources used by the firm earn their opportunity cost normal profitRecall that the accounting profit = $64,000Normal profits = $50,000 + $1,200 + $1,000 =
$52,200: normal profit $11,800:economic profit

6
Fixed and Variable Resources
Variable resources can be varied quickly to change the output rate
Fixed resources are those resources which cannot be easily changed
This provides us the distinction between the short run and the long runShort run: at least one resource is fixedLong run: all resources are variableVaries from industry to industry

7
Exhibit 2: Short-Run Relationship

8
Law of Diminishing Marginal Returns
As more of a variable resource is combined with a given amount of a fixed resource, marginal product eventually declines
This is the most important feature of production in the short run dictates the shape of the production function and the cost curves

9
Exhibit 3: Total and Marginal Product of Labor
Because of increasing marginal returns, marginal product increases with each of the first three workers: total product is increasing at an increasing rateOnce diminishing returns sets in with the 4th worker, marginal product declines: total product increases at a decreasing rateAs long as marginal product is positive, total product increases, and when marginal product turns negative, total product starts to fall

10
Costs in the Short Run
Fixed costs pay for fixed resources and must be paid even if no output is produced – they do not vary when output varies
Variable cost is the cost of variable resources – labor in our example – and vary with the amount of labor employed in the production process: as more labor is employed, output and variable cost both increase The firm can hire labor at $100 per worker day:
variable cost equals $100 times the number of workers hired

11
Tons Moved Fixed Variable Marginal per Day cost Workers Cost Total Cost Cost (q) (FC) per Day (VC) TC=FC+VC MC=TC/ q (1) (2) (3) (4) (5) (6)
$0 $200 0 $0 $200 - 2 200 1 100 300 50.00 5 200 2 200 400 33.33 9 200 3 300 500 25.00 12 200 4 400 600 33.33 14 200 5 500 700 50.00 15 200 6 600 800 100.00
Exhibit 4: Short-Run Cost Data
Since total cost is the opportunity cost of all resources employed by the firm, it includes a normal profit but not an economic profit. Marginal cost is simply the change in total cost divided by the change in output MC = ΔTC / Δq Changes in MC reflect changes in marginal productivity of the variable resource employed

12
Marginal Cost and Marginal Productivity
When the firm experiences increasing marginal returns – marginal product is increasing – the marginal cost decreases
When the firm experiences diminishing marginal returns – marginal product begins to decline – the marginal cost of output increases
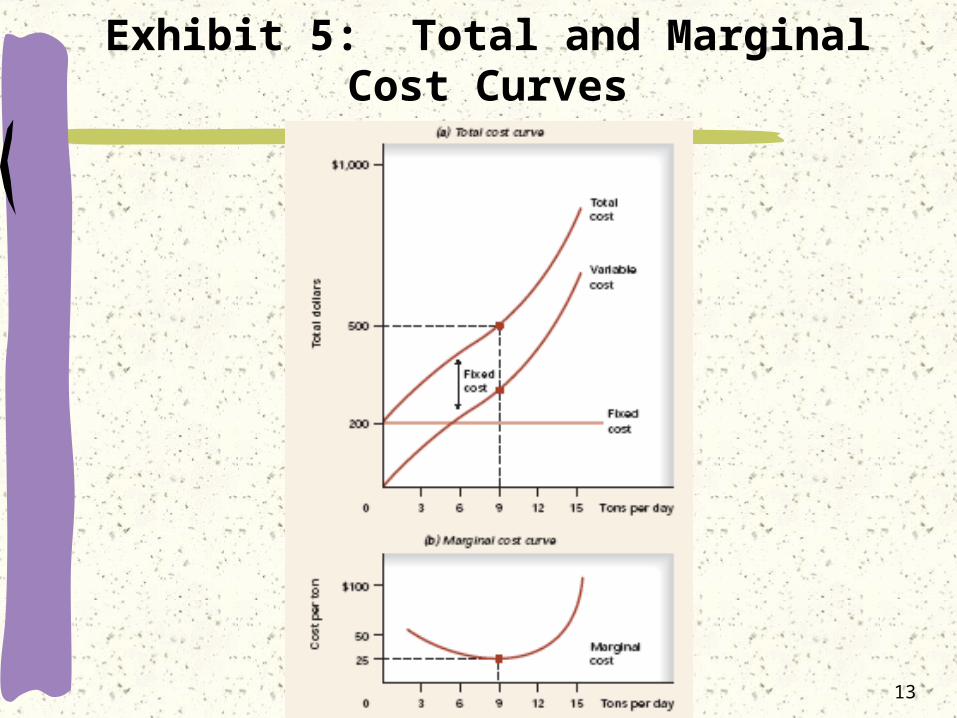
Exhibit 5 provides a graphical illustration of our cost curves
13
Exhibit 5: Total and Marginal Cost Curves

14
Exhibit 5: Total and Marginal Cost Curves(
Tons per day
$1,000
500
200
Totalcost
Variablecost
Fixedcost
Fixedcost
30 6 9 12 15
To
tal d
olla
rs
Tons per day
$100
50
25
Marginal cost
30 6 9 12
Co
st p
er t
on
15
Since total cost does not vary with output, the fixed cost curve is a horizontal line at $200Variable cost is zero when output is zero – the variable cost curve starts at zeroThe total cost curve sums the variable and fixed cost curvesBecause a constant fixed cost is added to variable cost, the total cost curve is the variable cost curve shifted vertically by the amount of fixed costMarginal cost declines until the 9th unit of output and then increasesThis reflects labor’s increasing, and then diminishing, marginal returns

15
Average Cost in the Short Run
The average cost per unit of output is another of the useful cost measures
There are average cost measures corresponding to variable cost, fixed cost and variable cost
Exhibit 6 provides a detailed listing of the variable costs for our example

16
Exhibit 6: Short Run Cost Data
Average variable cost, AVC, equals variable cost divided by output AVC = VC / q
Average total cost, ATC = TC / q Both average variable cost and average total cost first decline as
output expands, then increase
Tons Moved Variable Marginal Average Average per Day Cost Total Cost Cost Variable Cost Total Cost (q) (VC) TC=FC+VC MC=∆TC/∆q AVC=VC/q ATC=TC /q (1) (2) (3) (4) (5) =(2) / (1) (6)=(3) / (1)
0 $0 $200 $0.00 - 2 100 300 50.00 $50.00 $150.00 5 200 400 33.33 40.00 80.00 9 300 500 25.00 33.33 55.55 12 400 600 33.33 33.33 50.00 14 500 700 50.00 35.71 50.00 15 600 800 100.00 40.00 53.33
17
Marginal and Average Cost
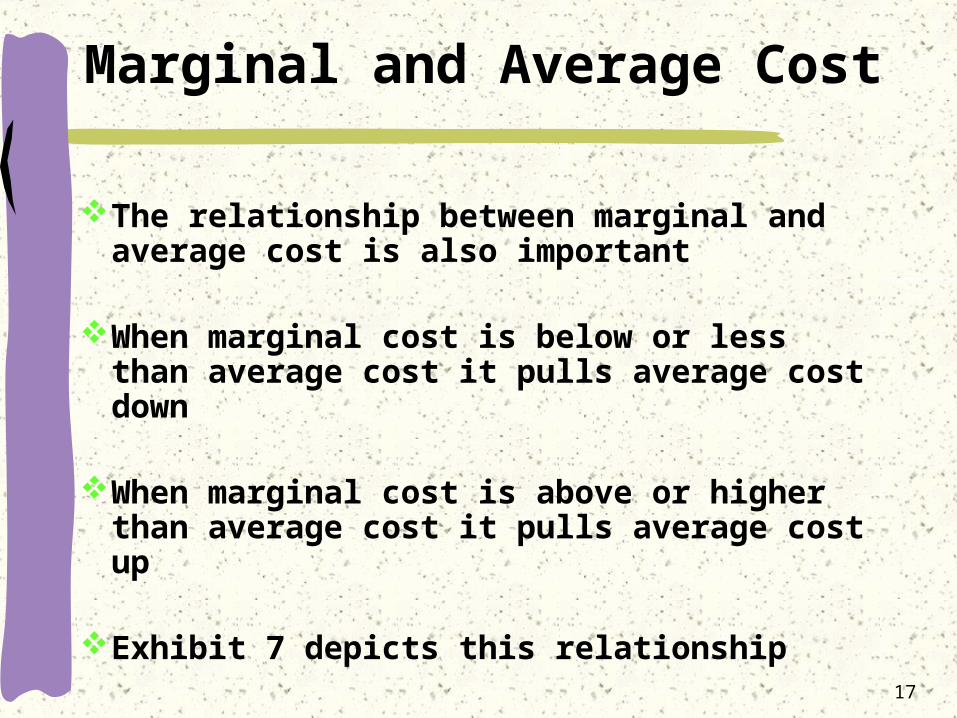
The relationship between marginal and average cost is also important
When marginal cost is below or less than average cost it pulls average cost down
When marginal cost is above or higher than average cost it pulls average cost up
Exhibit 7 depicts this relationship

18
Exhibit 7: Average and Marginal Cost Curves
$150
125
100
75
50
25
0 5 10 15 Tons per day
Marginal cost
Average total cost
Average variable costNotice also that the rising marginal cost curve intersects both the average variable and total cost curves at their minimums.
The distance between the average variable and total cost gets smaller as output increases because average fixed costs decline as output increases
Co
st p
er t
on

19
Costs in the Long Run
All inputs that are under the firm’s control can be varied there are no fixed costs
Long run is best thought of as a planning horizon
Choice of input combinations is flexible, but that flexibility is available only to firms that have not yet acted on their plans
Firms plan for the long run, but they produce in the short run
20
Long-Run Average Cost Curve
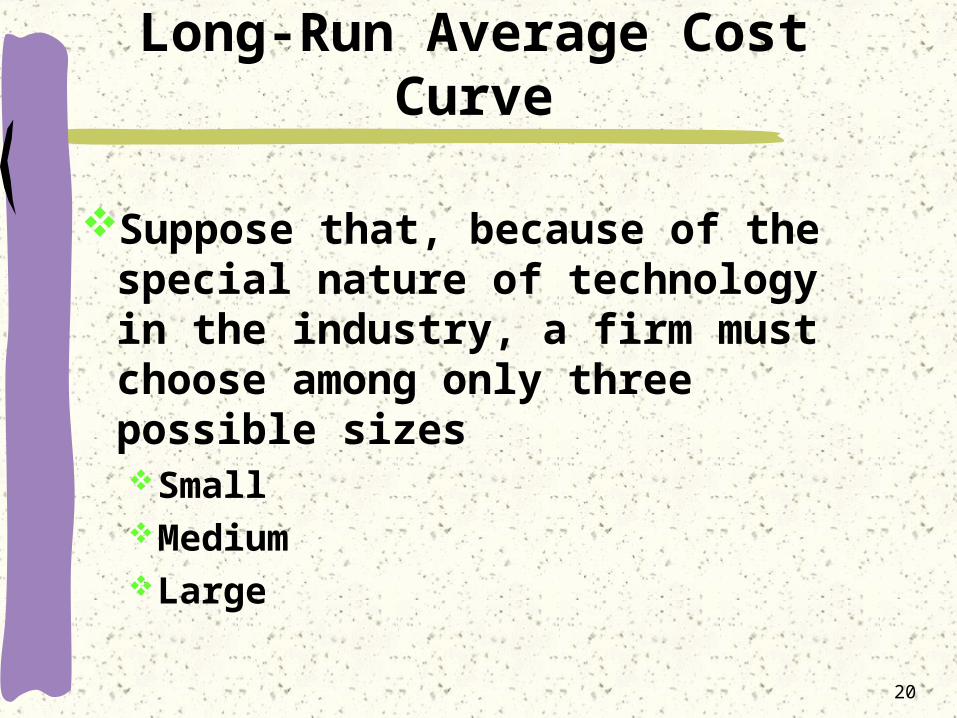
Suppose that, because of the special nature of technology in the industry, a firm must choose among only three possible sizesSmallMediumLarge

21
Long-Run Average Cost Curve
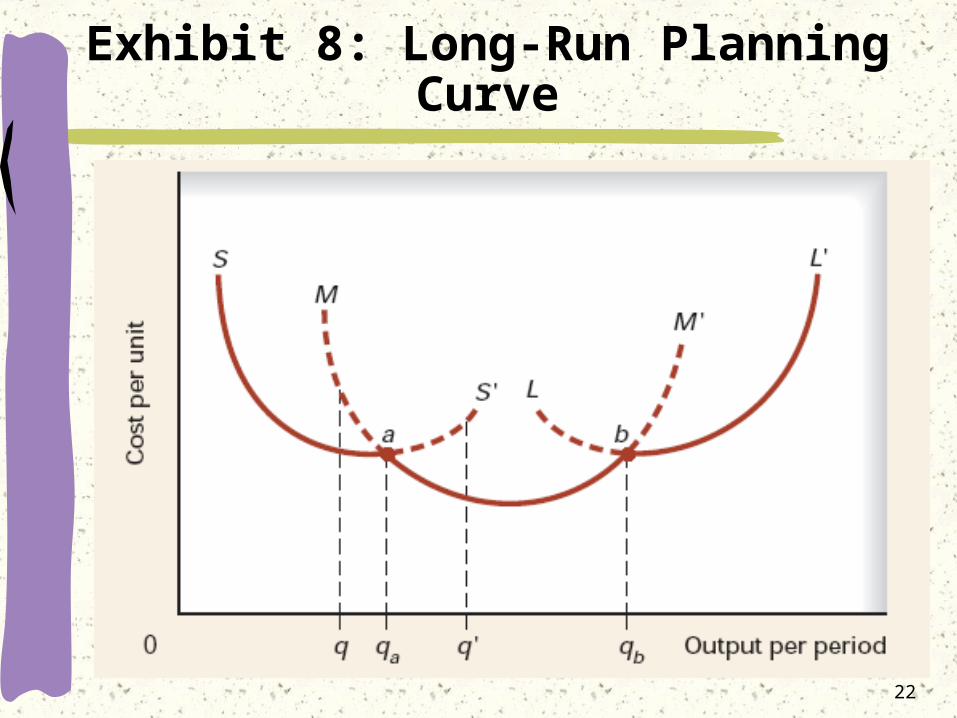
Now suppose there are many possible plant sizes
Exhibit 9 presents a sample of short-run average total cost curves shown in purple
The long-run average cost curve, shown in red, is formed by connecting the points on the various short-run average cost curves that represent the lowest per-unit cost for each rate of output
22
Exhibit 8: Long-Run Planning Curve

23
Exhibit 9: Firm’s Long-Run Planning Curve

24
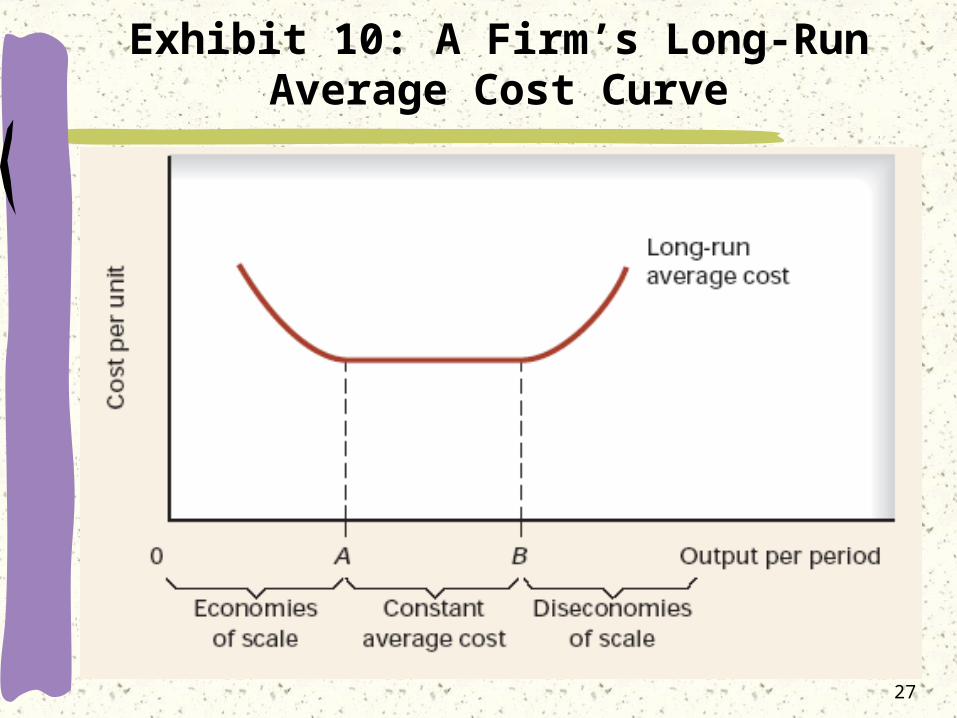
Economies of Scale
Notice that the long-run average curve is U-shaped, a result of economies and diseconomies of scale
Economies of scale imply that long-run average costs decline as output expands while diseconomies of scale imply that long-run average costs increase as output increases

25
Economies of Scale
A larger size often allows for larger, more efficient, machines and allows workers a greater degree of specialization Production techniques such as the assembly line can be utilized only if the rate of output is large enough
Typically, as the scale of the firm increases, capital substitutes for labor and complex machines substitute for simpler machines

26
Diseconomies of Scale
As a firm expands, diseconomies of scale, eventually take over: long-run average cost increase as output expands
Additional layers of management are needed to monitor production
The more levels of management in an organization, the more difficult it is for top management to communicate with those that perform most of the production tasks
27
Exhibit 10: A Firm’s Long-Run Average Cost Curve
Related Documents


