1 Presented by Presented by Bryce Contor Bryce Contor University of Idaho University of Idaho Idaho Water Resources Idaho Water Resources Research Institute Research Institute Spokane Valley - Rathdrum Prairie Aquifer Study Human Water Use in the Human Water Use in the SVRP Aquifer SVRP Aquifer

Welcome message from author
This document is posted to help you gain knowledge. Please leave a comment to let me know what you think about it! Share it to your friends and learn new things together.
Transcript

1
Presented byPresented byBryce ContorBryce Contor
University of Idaho University of Idaho Idaho Water Resources Research Idaho Water Resources Research
InstituteInstitute
Spokane Valley - Rathdrum Prairie Aquifer Study
Human Water Use in the SVRP Human Water Use in the SVRP AquiferAquifer
2
Outline of Talk
• Water-use Overview
• Data Sources
• Estimated Components
• Interesting Observations
• Uncertainty

3
I: Water-use Overview
4
MODFLOW Well Term:Human Pumping & Returns
• Domestic, Commercial, Municipal and Industrial (DCMI)
• Agricultural
5
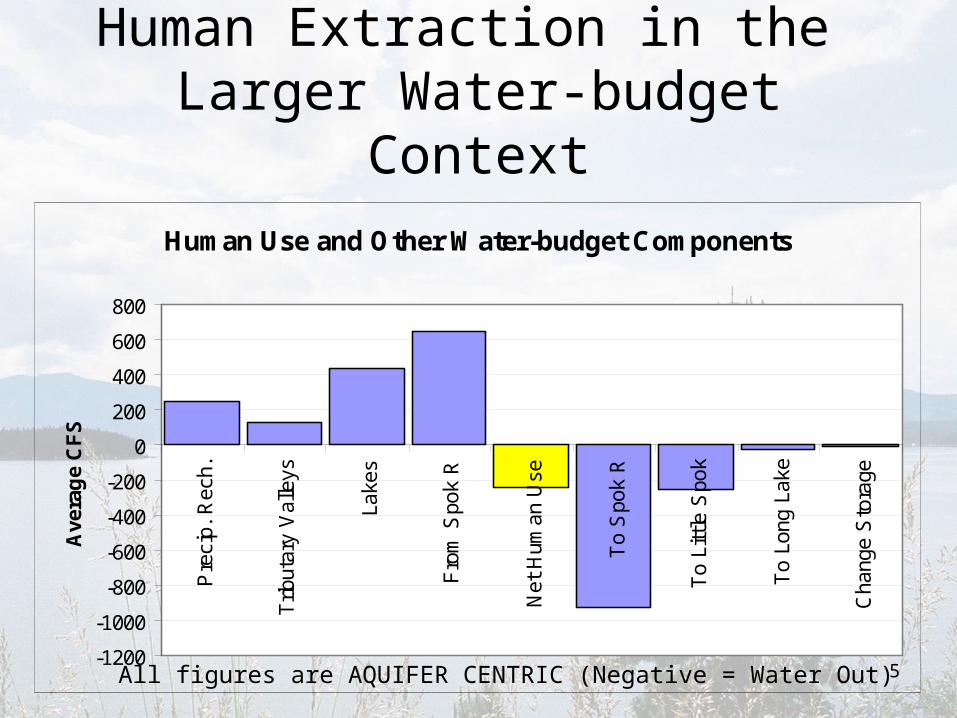
Human Extraction in the Larger Water-budget Context
Human Use and Other Water-budget Components
-1200
-1000
-800
-600
-400
-200
0
200
400
600
800
Pre
cip.
Rec
h.
Trib
utar
y V
alle
ys
Lake
s
Fro
m S
pok
R
Net
Hum
an U
se
To
Spo
k R
To
Litt
le S
pok
To
Long
Lak
e
Cha
nge
Sto
rage
Ave
rag
e C
FS
All figures are AQUIFER CENTRIC (Negative = Water Out)

6
Spatial Distribution: Cell-by-Cell

7
Spatial Distribution: Smoothed

8-300
-250
-200
-150
-100
-50
0
50
100
DCMIPump
DCMIPerc
AgPump
Ag Perc
Ave
rag
e C
FS
Ag Perc
Ag Pump
Perc, Estimate
Perc, Records
Rural Estimate
Purveyor Records
Self Industrial
Human Use By Component

9
Time Series
Time Series, Net Human Extraction - SVRP
-300
-250
-200
-150
-100
-50
0
1990 1995 2000 2005
Ann
ual A
vg C
FS
Net DCMI Net Ag Total Net Extraction

10
• USGS Water-use Data Program (Molly Maupin)
• SVRP Model Data Archive (GIS Data from Counties, Cities and States)
• National Ag Statistics Service crop reports (USDA)
• University of Idaho Evapotranspiration Tables
II. Data Sources
11
• Personal contacts (cities, Spokane County, Panhandle Health District, Jacklin Seed, irrigation districts)
• Aerial photos (USDA)• NLCD impermeable-cover data (USGS
Seamless Data Server)• Idaho water-rights data (IDWR)
• CH2M Hill & Golder Reports
• PRISM precipitation data (Oregon State U)
12
III. Estimated Components
• DCMI uses in small towns & rural homes
• Agricultural irrigation outside reporting purveyor service areas
• Partitioning of pumping data to indoor & outdoor use & percolation
• Partitioning of outdoor use to ag & landscape irrigation (for reporting only)
• Idaho self-supplied industrial use
13
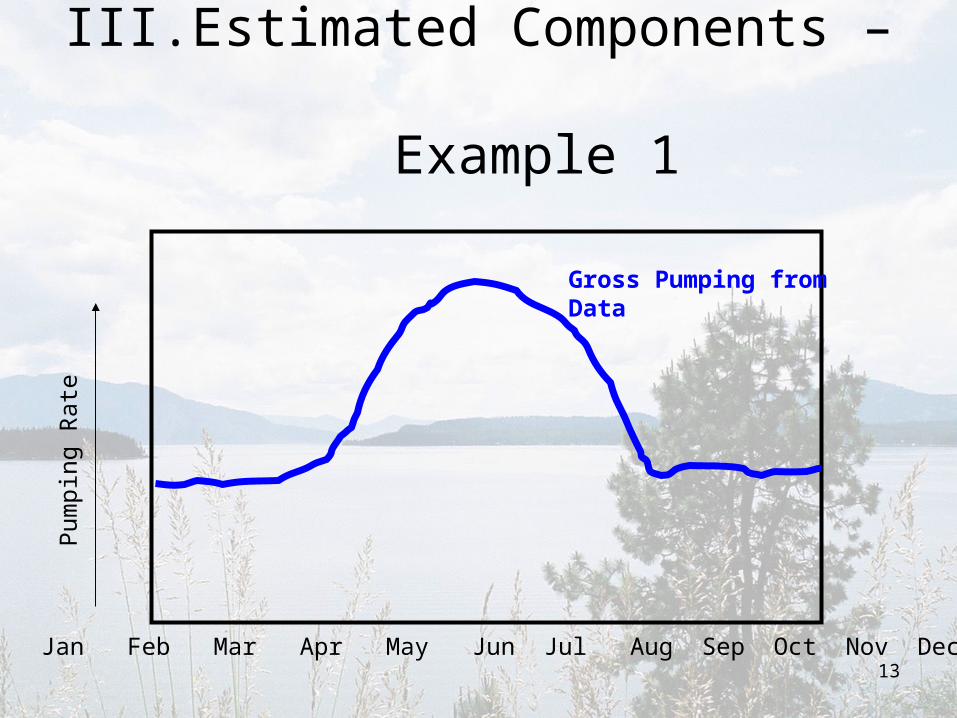
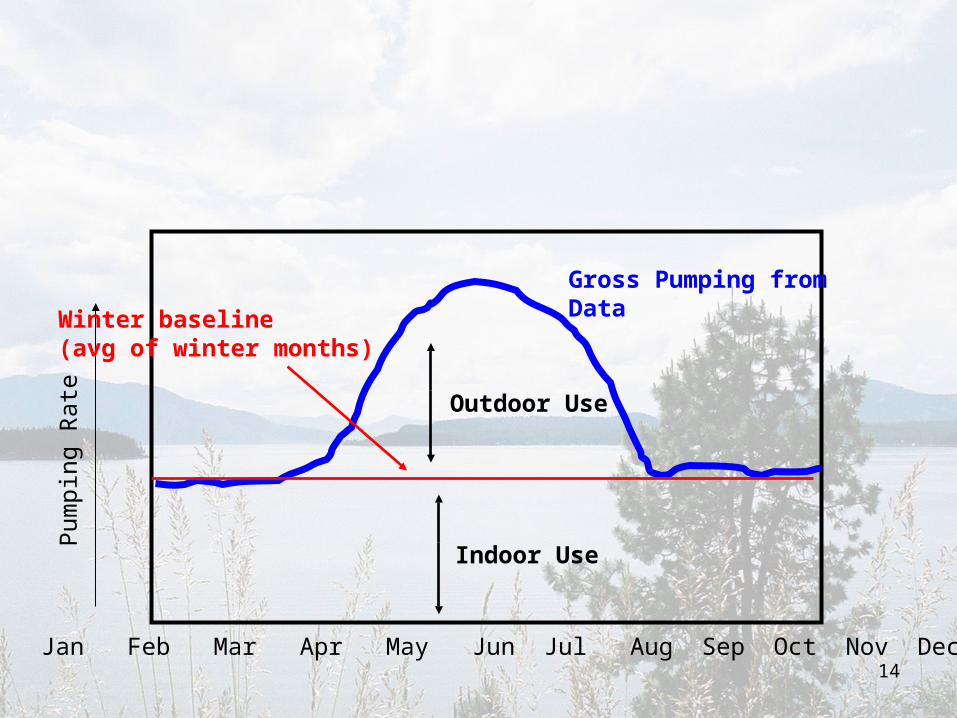
III. Estimated Components – Example 1
Gross Pumping from Data
Jan Feb Mar Apr May Jun Jul Aug Sep Oct Nov Dec
Pum
ping
Rat
e
14
Gross Pumping from Data
Indoor Use
Outdoor Use
Jan Feb Mar Apr May Jun Jul Aug Sep Oct Nov Dec
Pum
ping
Rat
e
Winter baseline(avg of winter months)
15
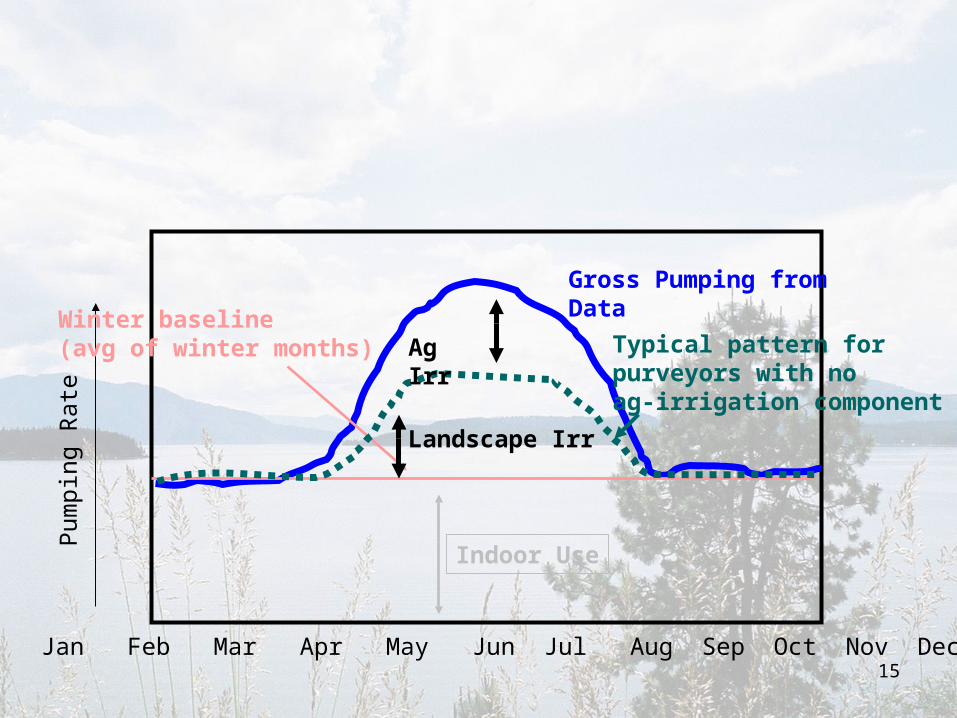
Gross Pumping from Data
Indoor Use
Jan Feb Mar Apr May Jun Jul Aug Sep Oct Nov Dec
Pum
ping
Rat
e
Winter baseline(avg of winter months) Typical pattern for
purveyors with no ag-irrigation component
Landscape Irr
Ag Irr
16
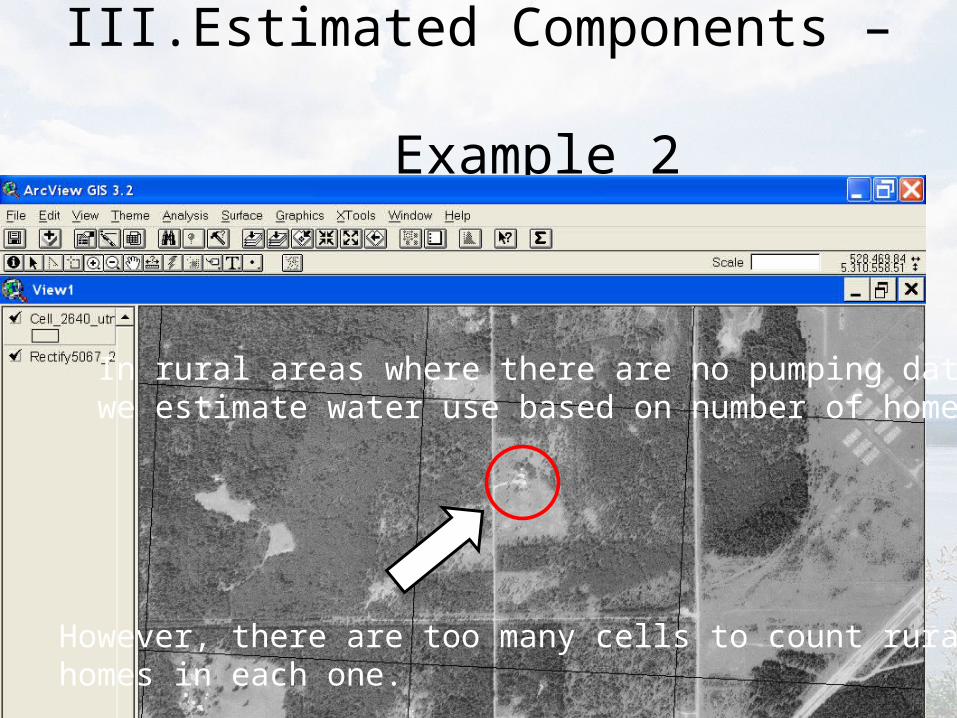
III. Estimated Components – Example 2
However, there are too many cells to count rural homes in each one.
In rural areas where there are no pumping data,we estimate water use based on number of homes.
17
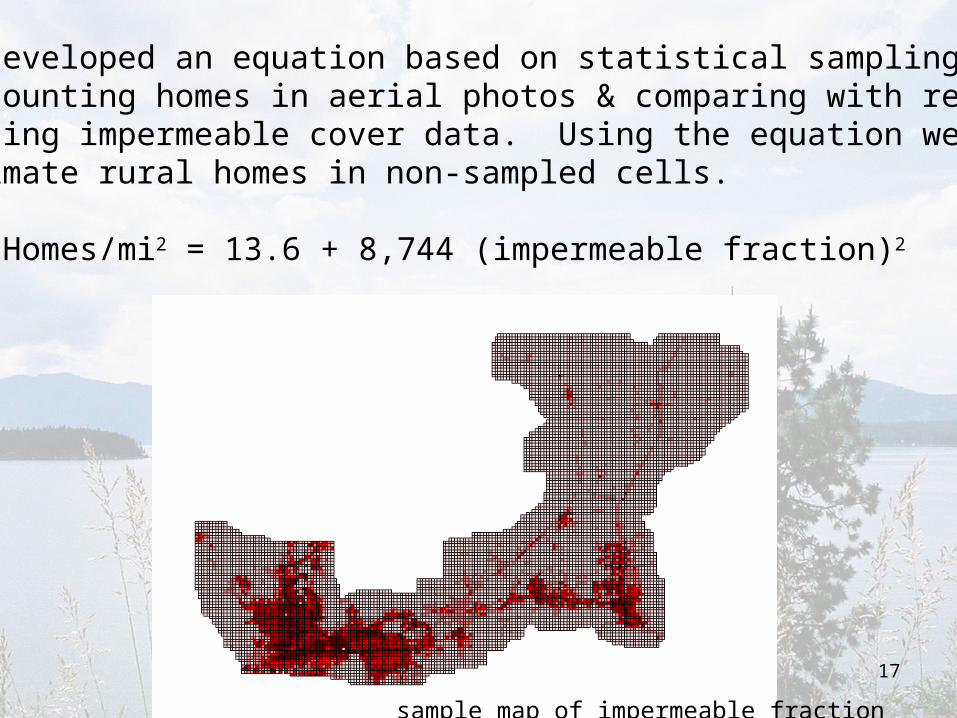
We developed an equation based on statistical sampling, by counting homes in aerial photos & comparing with remote-sensing impermeable cover data. Using the equation we canestimate rural homes in non-sampled cells.
Homes/mi2 = 13.6 + 8,744 (impermeable fraction)2
sample map of impermeable fraction
18
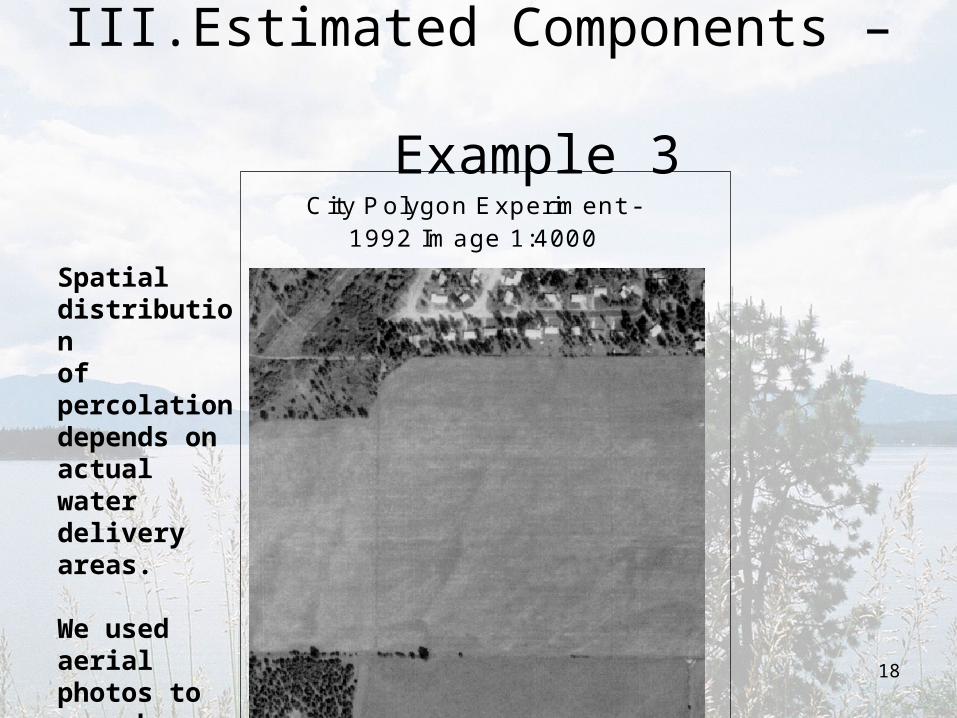
III. Estimated Components – Example 3
City Polygon Experiment -1992 Image 1:4000
300 0 300 600 Feet
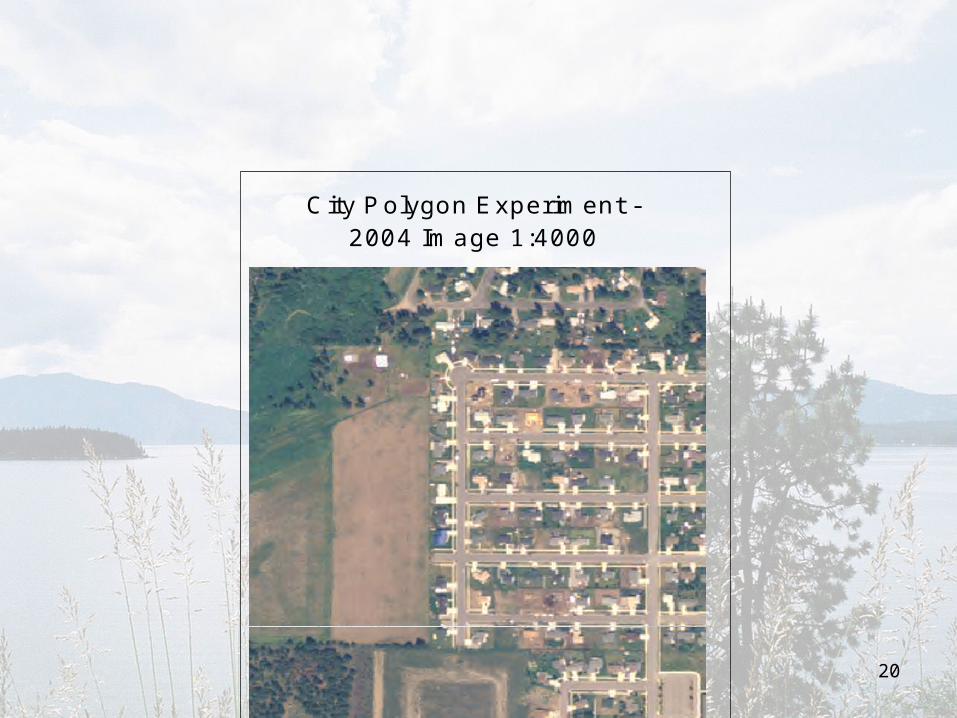
Spatial distributionof percolationdepends onactual waterdeliveryareas.
We used aerial photos to map changes overtime.

19
City Polygon Experiment -circa 1998 Image 1:4000
300 0 300 600 Feet
20
City Polygon Experiment -2004 Image 1:4000
300 0 300 600 Feet

21
IV. Interesting Observations
22
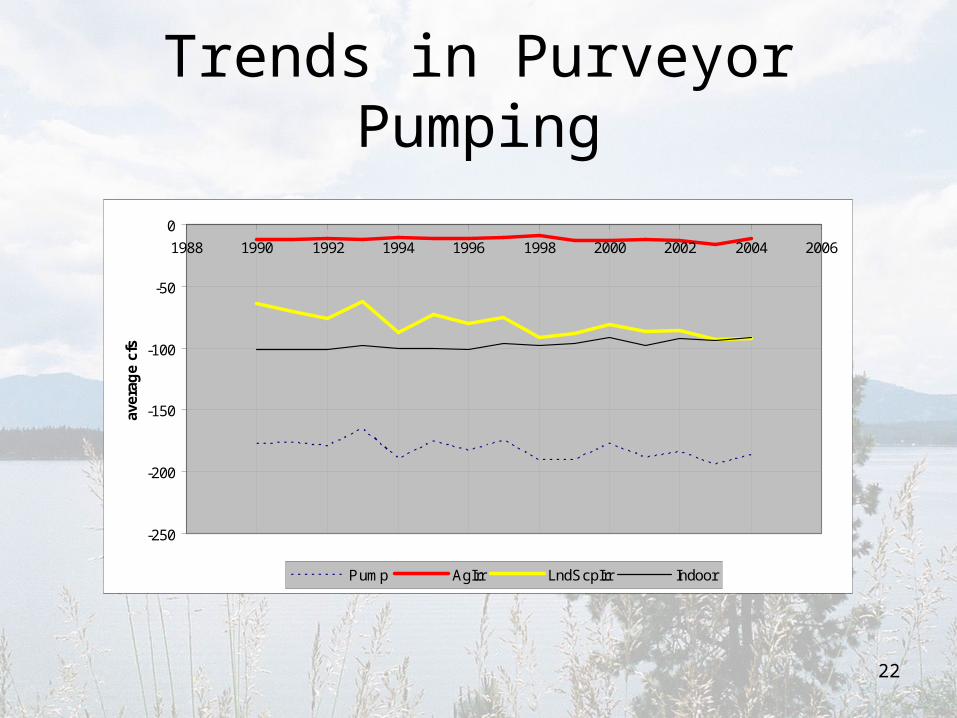
Trends in Purveyor Pumping
-250
-200
-150
-100
-50
0
1988 1990 1992 1994 1996 1998 2000 2002 2004 2006
aver
age
cfs
Pump AgIrr LndScpIrr Indoor

23
Seasonality
Typical Seasonal Pumping Patterns - Two Years
-500
-400
-300
-200
-100
0
100
200
0 6 12 18 24
cfs
Rec Purv
No Rec DCMI
Ag Pump
PurvIrrPerc
NoRecordsLndscpPerc
AgIrrPerc
PurveyorSpticPerc
NoRecordsSpticPerc
SelfIndust
No time lagwas applied
topercolation

24
V. Estimated Uncertainty in Well Term
80%
85%
90%
95%
100%
105%
110%
115%
120%
0.8 0.9 1 1.1 1.2
+/- 1 std dev+/- 17 cfs
+/- 2 std dev+/- 34 cfs
This is theuncertaintydue to ourmeasurement/estimation methods

Related Documents