1 Poverty Phase II Dissemination Workshop in Addis Ababa Ethiopia

1 Poverty Phase II Dissemination Workshop in Addis Ababa Ethiopia.
Jan 03, 2016
Welcome message from author
This document is posted to help you gain knowledge. Please leave a comment to let me know what you think about it! Share it to your friends and learn new things together.
Transcript
1
Poverty Phase II Dissemination Workshop in Addis Ababa Ethiopia

2
Presenters
Nnaemaka ChukwuoneDr. Fidelis Uguru
Paul Chine
Dr. Benjamin Okpukpara
3
INTRODUCTION
Background Who is a child What is child welfare and its indicators
Different types of children according to welfare classification
4
INTRODUCTION CONTINUES
The state of child welfare in Nigeria and other developing countries.
Different argument about the links between poverty and child welfare (child labour or child schooling and street children).
5
INTRODUCTION CONTINUES
The effort made by Nigerian government to improve the child welfare
Why has these programme failed to achieve the desired goals.
6
Why is it difficult to control the incidence of child labour and street children Children are seen as a means of
generating income for household survival
High cost and/or inaccessibility of school
Perception of education as investment with low returns
Lack of or loose laws to enforce the ban
7
The implication of deteriorating child welfare in Nigeria
Increasing rate of drop out among children
Low Child Enrolment rate Poor Academic Performance Increase in Child Health Problems Psychological Problems Growth of irresponsible citizen Deepens inequality in family
8
Why this Study in Nigeria
Children as an important human capital accumulation
Growing emphasizes of child right Increasing rate of drop out among
children Inadequate information on determinants
of child labour and child schooling Increasing controversy among
researchers on the link between poverty and child welfare (child labour or child schooling, street children)
9
Objective of the study To examine child labour, child schooling and
street children as patterned by age, gender, sector and zone
To examine and compare the health and education characteristics of child labourers and street children
To identify the determinants of child schooling
To identify the determinants of child labour
To compare the work and health characteristics of child labourers and street children.
10
Methodology Data FOS/ILO Child Labour Survey 2001 Theoretical framework
Household utility theory Unitary household model
Econometric Framework Schooling and economic activities are
interdependent decision Probit regression model
11
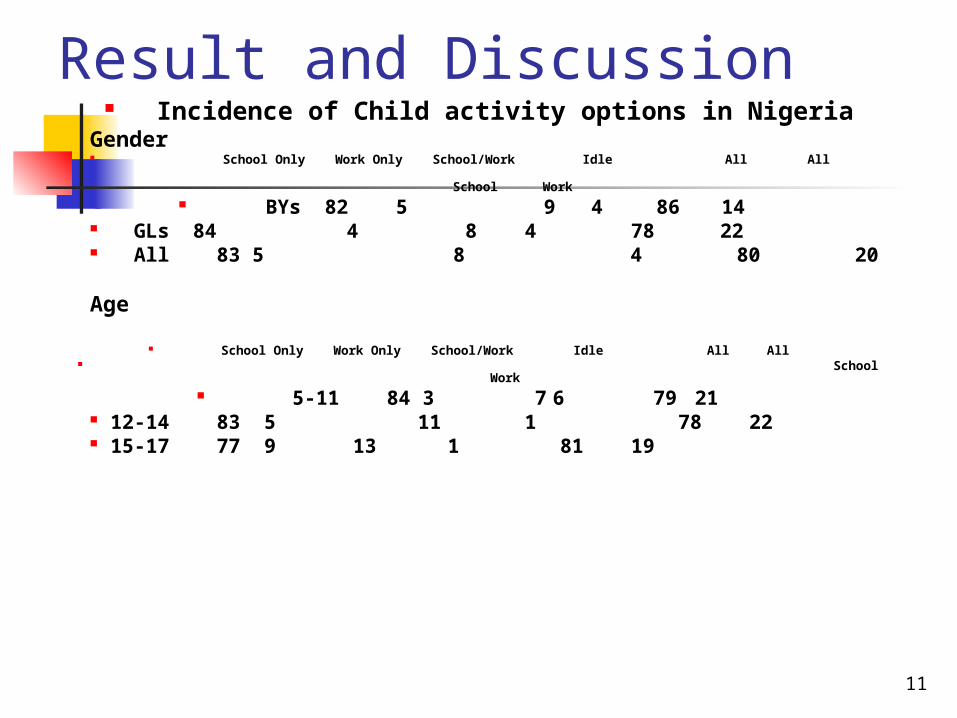
Result and Discussion Incidence of Child activity options in Nigeria
Gender School Only Work Only School/Work Idle All All
School Work BYs 82 5 9 4 86 14
GLs 84 4 8 4 78 22 All 83 5 8 4 80 20
Age
School Only Work Only School/Work Idle All All School Work
5-11 84 3 7 6 79 21 12-14 83 5 11 1 78 22 15-17 77 9 13 1 81 19
12
Result and Discussion Continue
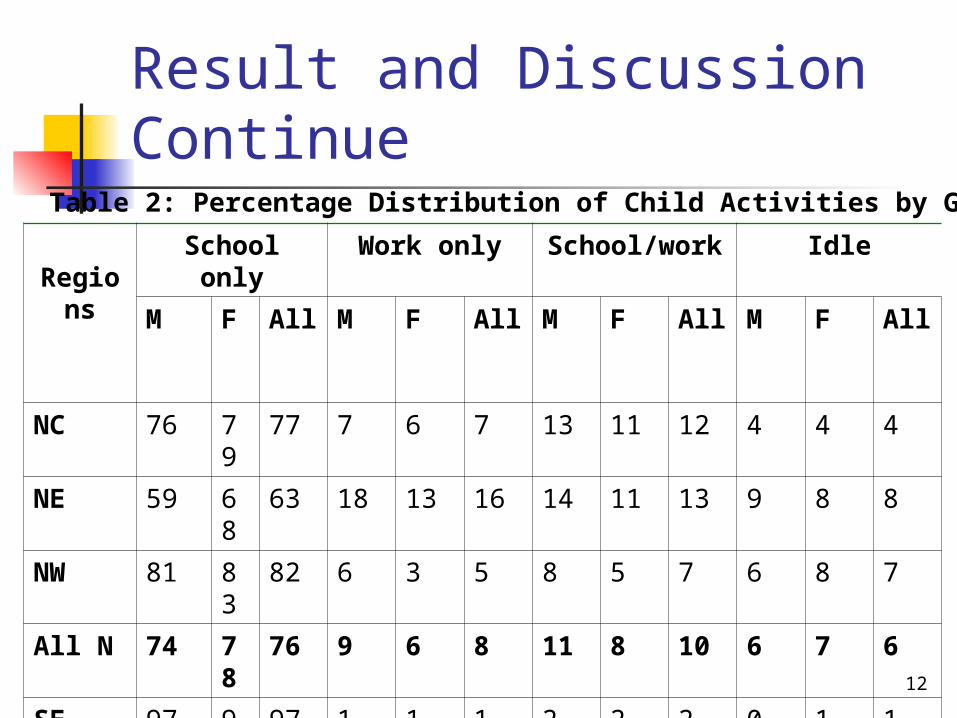
Table 2: Percentage Distribution of Child Activities by Gender
RegionsSchool only Work only School/work Idle
M F All M F All M F All M F All
NC 76 79 77 7 6 7 13 11 12 4 4 4
NE 59 68 63 18 13 16 14 11 13 9 8 8
NW 81 83 82 6 3 5 8 5 7 6 8 7
All N 74 78 76 9 6 8 11 8 10 6 7 6
SE 97 96 97 1 1 1 2 2 2 0 1 1
SS 93 91 92 2 3 3 3 4 4 1 1 1
SW 79 78 78 2 2 2 19 19 19 1 1 1
All S 91 85 89 2 2 2 8 8 8 1 1 1
All 82 84 83 5 4 5 9 8 8 4 4 4
13
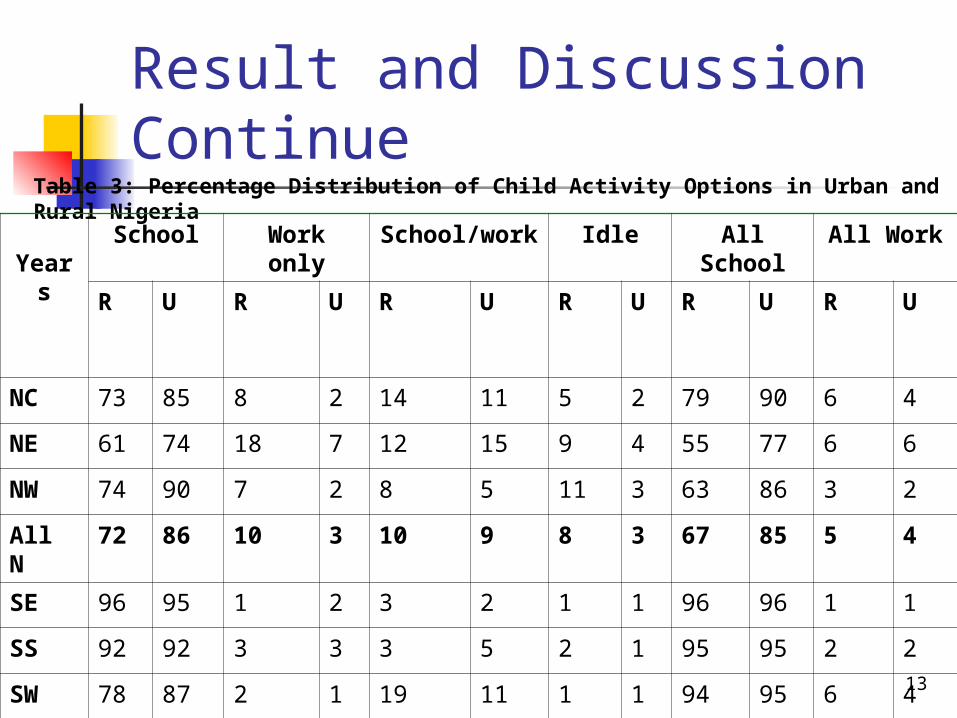
Result and Discussion Continue
Table 3: Percentage Distribution of Child Activity Options in Urban and Rural Nigeria
YearsSchool Work only School/work Idle All School All Work
R U R U R U R U R U R U
NC 73 85 8 2 14 11 5 2 79 90 6 4
NE 61 74 18 7 12 15 9 4 55 77 6 6
NW 74 90 7 2 8 5 11 3 63 86 3 2
All N 72 86 10 3 10 9 8 3 67 85 5 4
SE 96 95 1 2 3 2 1 1 96 96 1 1
SS 92 92 3 3 3 5 2 1 95 95 2 2
SW 78 87 2 1 19 11 1 1 94 95 6 4
All S 87 92 2 2 10 5 1 1 95 95 4 3
All 79 89 6 3 10 6 5 2 78 90 5 3
14
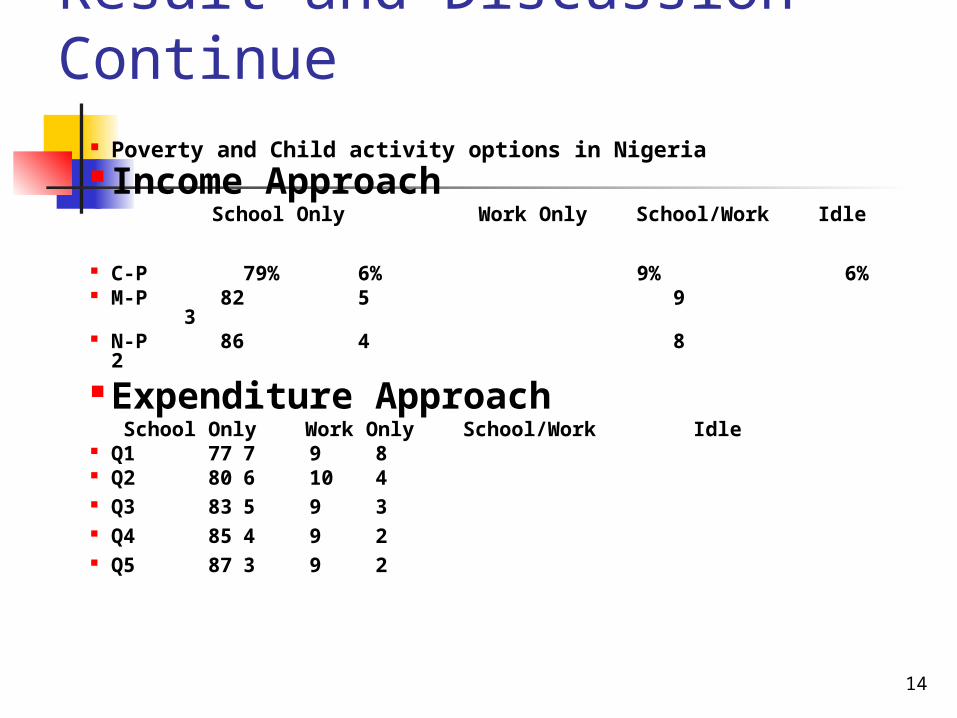
Result and Discussion Continue
Poverty and Child activity options in Nigeria Income Approach
School Only Work Only School/Work Idle C-P 79% 6% 9% 6% M-P 82 5 9 3 N-P 86 4 8 2
Expenditure ApproachSchool Only Work Only School/Work Idle
Q1 77 7 9 8 Q2 80 6 10 4 Q3 83 5 9 3 Q4 85 4 9 2 Q5 87 3 9 2
15
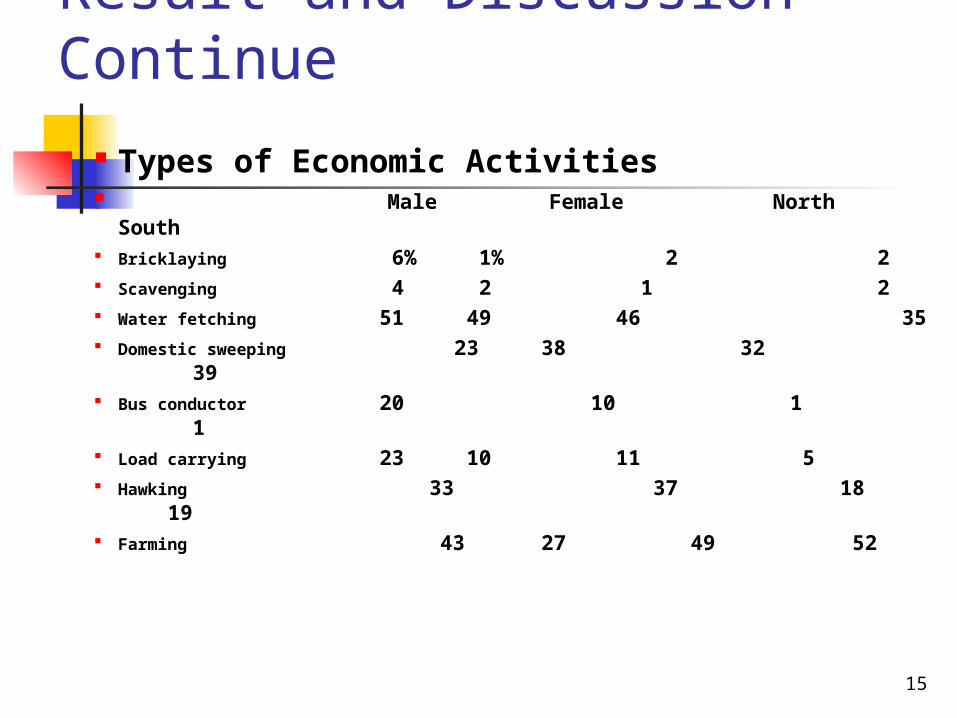
Result and Discussion Continue
Types of Economic Activities Male Female North South Bricklaying 6% 1% 2 2 Scavenging 4 2 1 2 Water fetching 51 49 46 35 Domestic sweeping 23 38 32 39 Bus conductor 20 10 1 1 Load carrying 23 10 11 5 Hawking 33 37 18 19 Farming 43 27 49 52
16
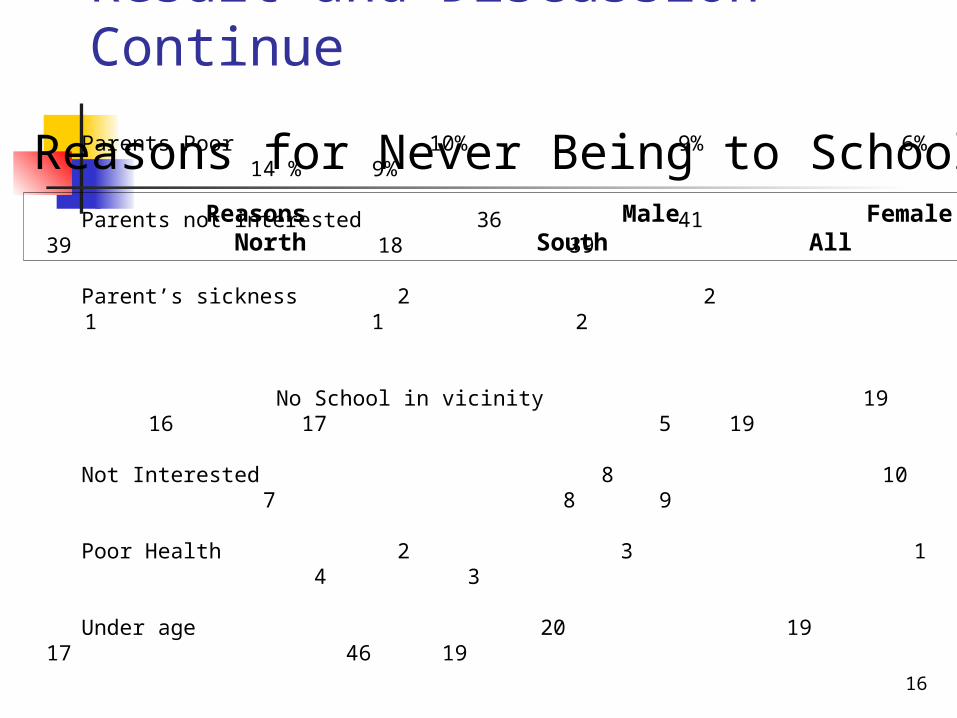
Result and Discussion Continue
Reasons Male Female North South All Parents Poor 10% 9% 6% 14 % 9%
Parents not interested 36 41 39 18 39
Parent’s sickness 2 2 1 1 2
No School in vicinity 19 16 17 5 19
Not Interested 8 10 7 8 9
Poor Health 2 3 1 4 3
Under age 20 19 17 46 19
Reasons for Never Being to School
17
Result and Discussion Continues
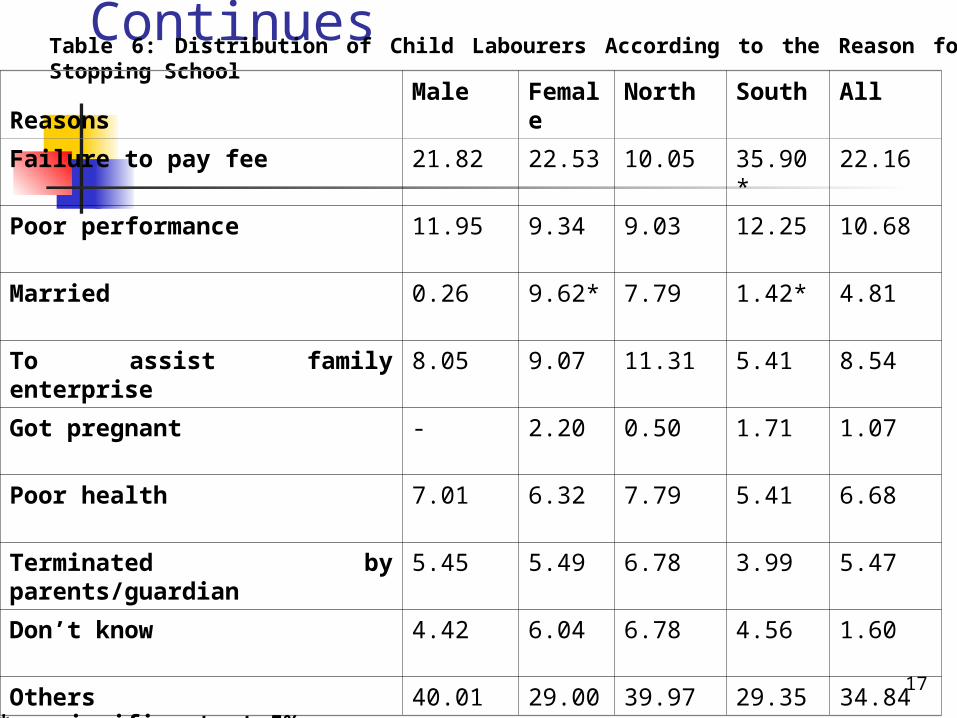
Table 6: Distribution of Child Labourers According to the Reason for Stopping School
ReasonsMale Female North South All
Failure to pay fee 21.82 22.53 10.05 35.90* 22.16
Poor performance 11.95 9.34 9.03 12.25 10.68
Married 0.26 9.62* 7.79 1.42* 4.81
To assist family enterprise 8.05 9.07 11.31 5.41 8.54
Got pregnant - 2.20 0.50 1.71 1.07
Poor health 7.01 6.32 7.79 5.41 6.68
Terminated by parents/guardian 5.45 5.49 6.78 3.99 5.47
Don’t know 4.42 6.04 6.78 4.56 1.60
Others 40.01 29.00 39.97 29.35 34.84* = significant at 5%
18
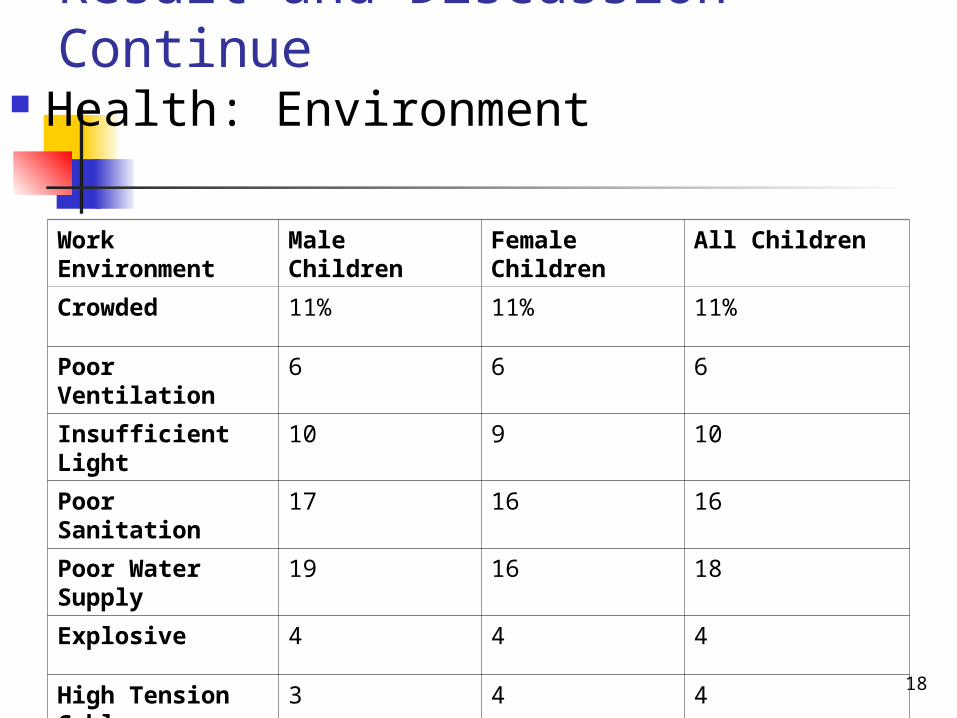
Result and Discussion Continue Health: Environment
Work Environment Male Children Female Children All Children
Crowded 11% 11% 11%
Poor Ventilation 6 6 6
Insufficient Light 10 9 10
Poor Sanitation 17 16 16
Poor Water Supply 19 16 18
Explosive 4 4 4
High Tension Cable 3 4 4
19
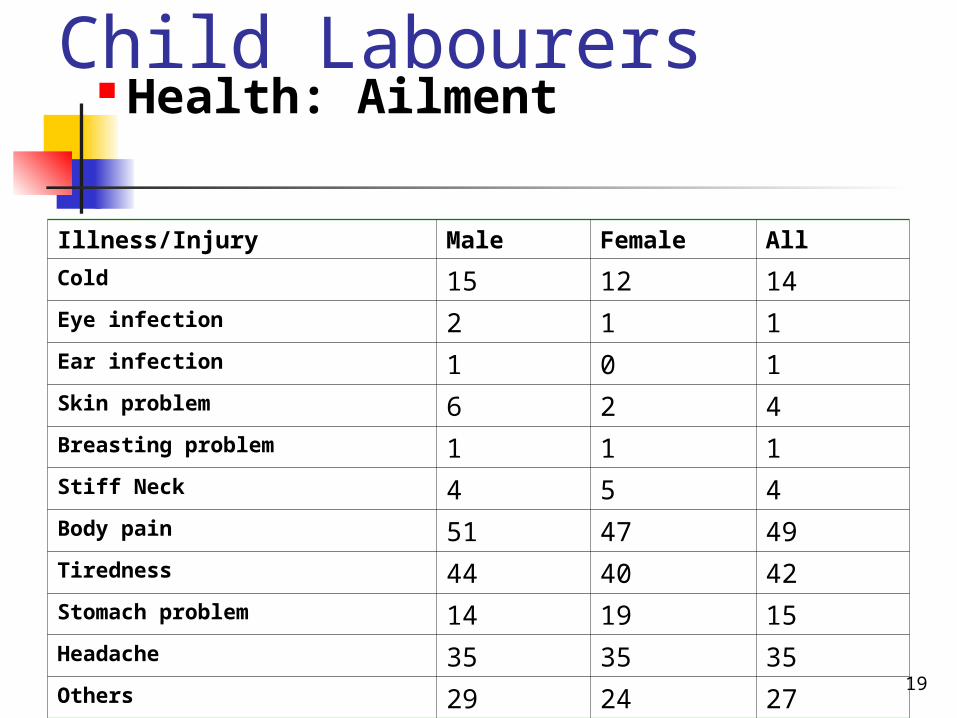
Child Labourers Health: Ailment
Illness/Injury Male Female All
Cold 15 12 14Eye infection 2 1 1Ear infection 1 0 1Skin problem 6 2 4Breasting problem 1 1 1Stiff Neck 4 5 4Body pain 51 47 49Tiredness 44 40 42Stomach problem 14 19 15Headache 35 35 35Others 29 24 27
20
Econometric result Introduction
The general school model school model =school only and those
combining school with some economic activities
work model=work only and those that combine work with schooling
21
Econometric result Determinants of Child schooling
Child characteristics Female are less likely to enrol Younger children are more likely to be enrolled (13 years as inflection point)
Head’s child are more likely to go to school.
22
Econometric result Parents characteristics
Children from female headed household are more likely to school
Children from Older household head are more likely to go to school
Children from literate father and mother are more likely to school. However literate father’s education impact more on child schooling
23
Econometric resultHousehold characteristics
Children from household with children aged below 11 years are likely to school
Household poverty decreases the probability of child schooling
24
Econometric result Community characteristics
Children from North West are less likely to be enrolled
Children from other zones are more likely to enrolled. However, the probability of child schooling in South is more than those of North
Access to school in terms of distance spur children to school
25
Econometric resultDeterminants of Child Work Child characteristics
Girls are less likely to school
Older children are more likely to work
26
Econometric result Parents characteristics
Children from literate parents are more likely work
Mother with any level of education and has more impact in withdrawing children from work
Fathers educated up to secondary and postsecondary school level
27
Econometric result
Household characteristicsHousehold poverty has influence in withdrawing child from economic activities.
Very weak
28
Econometric result
Community characteristicsThere is higher probability of child withdrawing from work in South than North
Access to school has impact in withdrawing children from work
2929
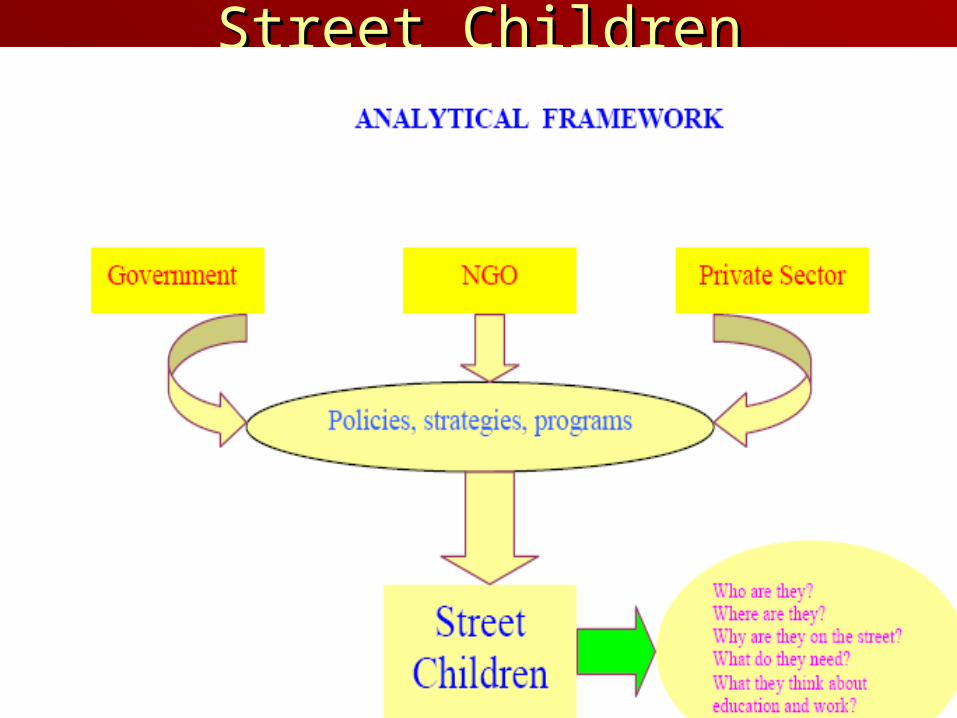
Street ChildrenStreet Children
30
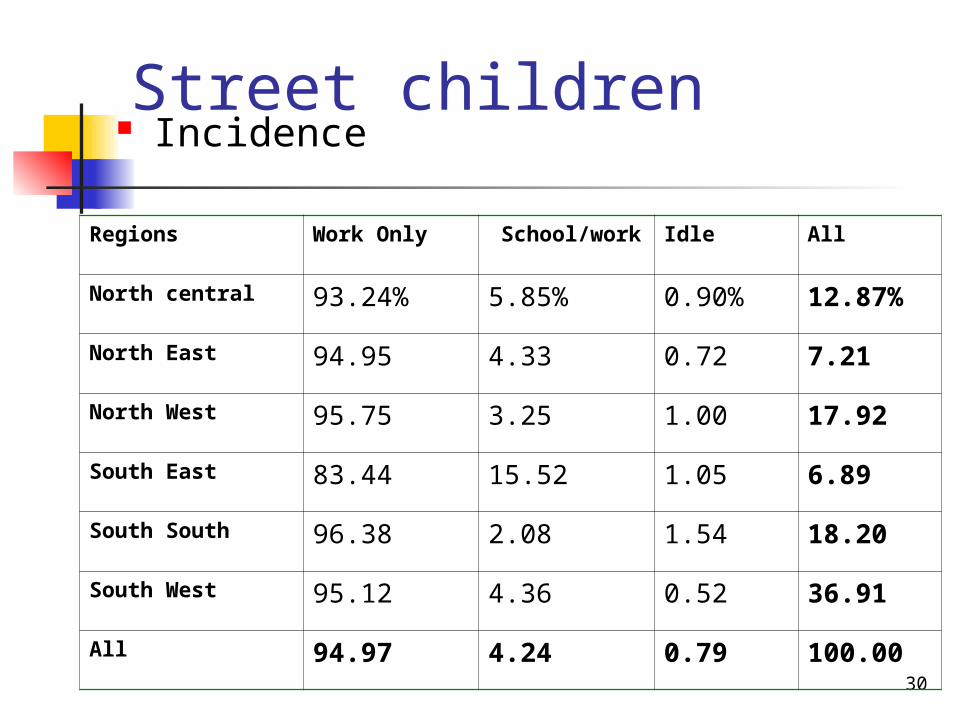
Street children Incidence
Regions Work Only School/work Idle All
North central 93.24% 5.85% 0.90% 12.87%
North East 94.95 4.33 0.72 7.21
North West 95.75 3.25 1.00 17.92
South East 83.44 15.52 1.05 6.89
South South 96.38 2.08 1.54 18.20
South West 95.12 4.36 0.52 36.91
All 94.97 4.24 0.79 100.00
31
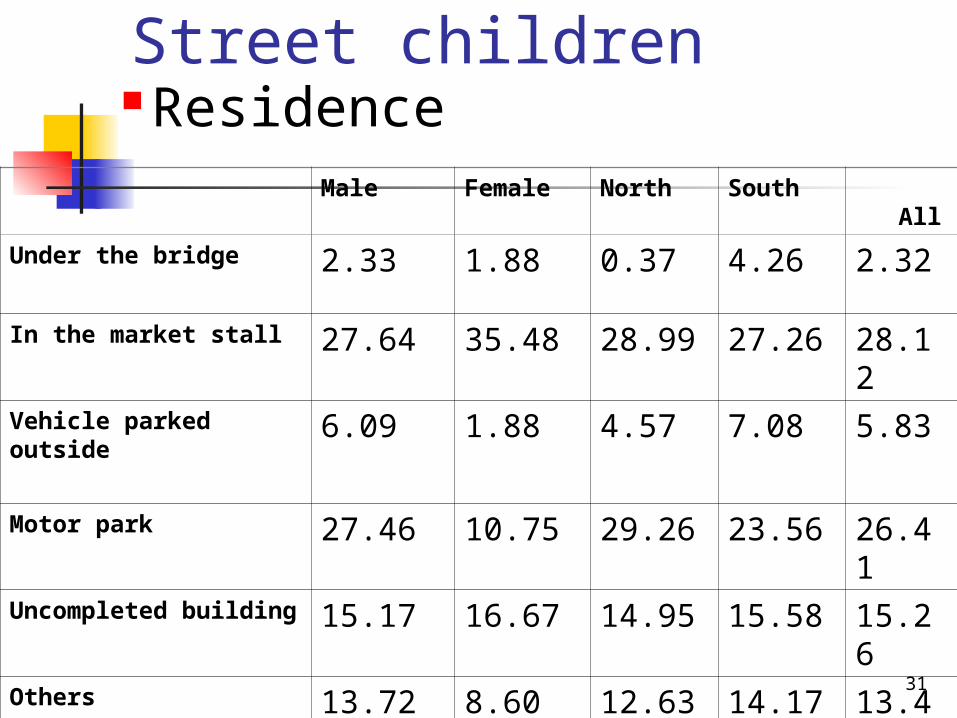
Street children Residence
Male Female North South All
Under the bridge 2.33 1.88 0.37 4.26 2.32
In the market stall 27.64 35.48 28.99 27.26 28.12
Vehicle parked outside 6.09 1.88 4.57 7.08 5.83
Motor park 27.46 10.75 29.26 23.56 26.41
Uncompleted building 15.17 16.67 14.95 15.58 15.26
Others 13.72 8.60 12.63 14.17 13.40
32
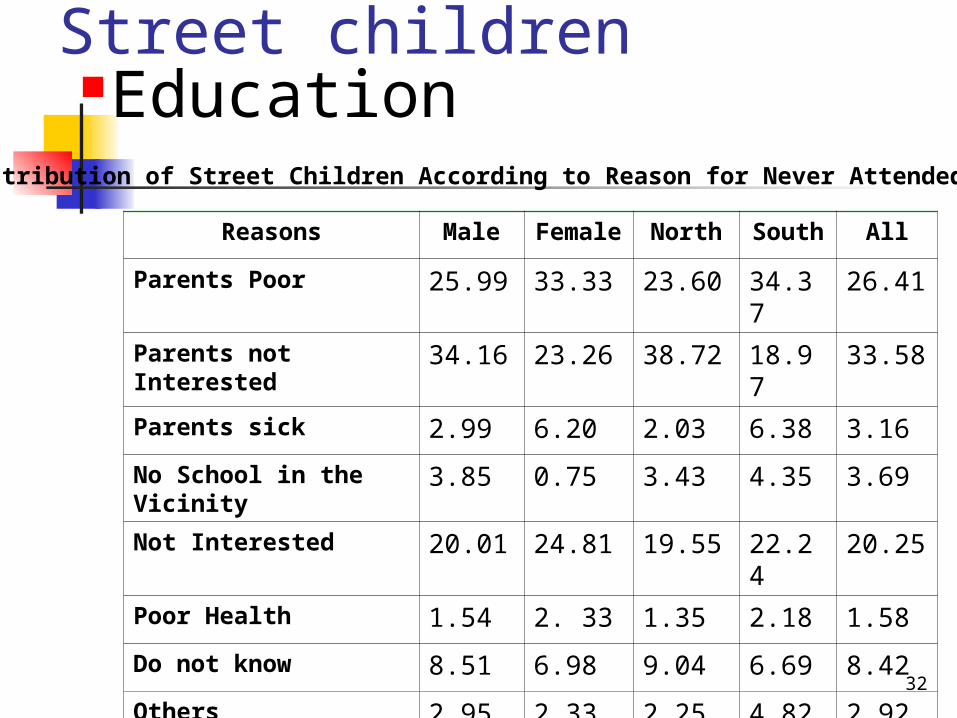
Street childrenEducation
Reasons Male Female North South All
Parents Poor 25.99 33.33 23.60 34.37 26.41
Parents not Interested 34.16 23.26 38.72 18.97 33.58
Parents sick 2.99 6.20 2.03 6.38 3.16
No School in the Vicinity 3.85 0.75 3.43 4.35 3.69
Not Interested 20.01 24.81 19.55 22.24 20.25
Poor Health 1.54 2. 33 1.35 2.18 1.58
Do not know 8.51 6.98 9.04 6.69 8.42
Others 2.95 2.33 2.25 4.82 2.92
Distribution of Street Children According to Reason for Never Attended School
33
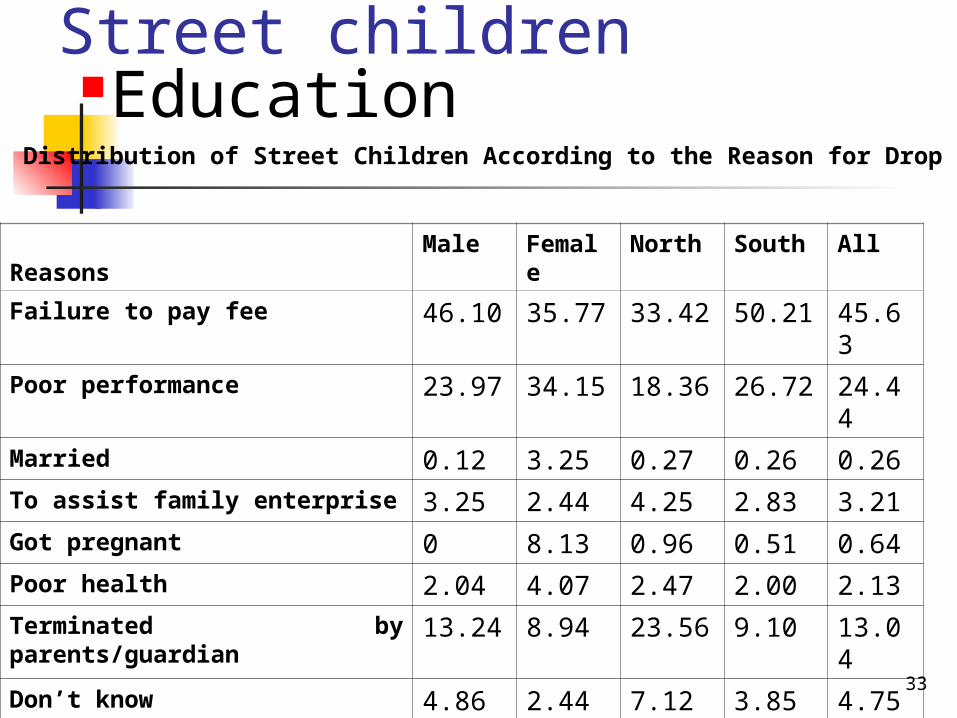
Street childrenEducation
Distribution of Street Children According to the Reason for Drop Out
ReasonsMale Female North South All
Failure to pay fee 46.10 35.77 33.42 50.21 45.63
Poor performance 23.97 34.15 18.36 26.72 24.44
Married 0.12 3.25 0.27 0.26 0.26
To assist family enterprise 3.25 2.44 4.25 2.83 3.21
Got pregnant 0 8.13 0.96 0.51 0.64
Poor health 2.04 4.07 2.47 2.00 2.13
Terminated by parents/guardian 13.24 8.94 23.56 9.10 13.04
Don’t know 4.86 2.44 7.12 3.85 4.75
Others 6.15 0.81 9.59 4.52 5.90
34
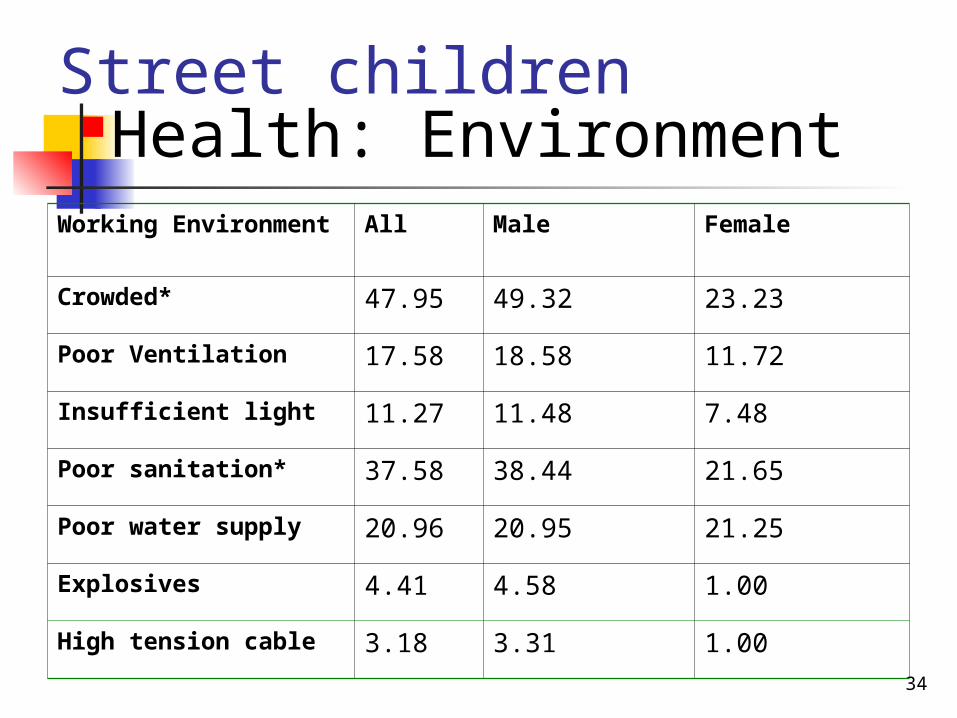
Street childrenHealth: Environment
Working Environment All Male Female
Crowded* 47.95 49.32 23.23
Poor Ventilation 17.58 18.58 11.72
Insufficient light 11.27 11.48 7.48
Poor sanitation* 37.58 38.44 21.65
Poor water supply 20.96 20.95 21.25
Explosives 4.41 4.58 1.00
High tension cable 3.18 3.31 1.00
35
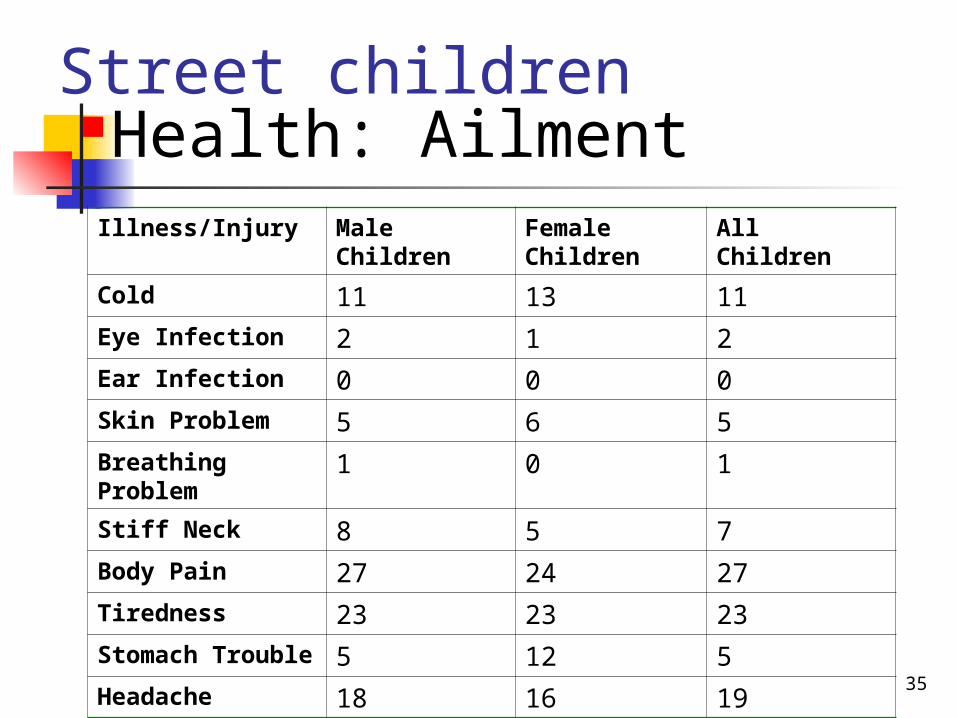
Street childrenHealth: Ailment
Illness/Injury Male Children Female Children All Children
Cold 11 13 11
Eye Infection 2 1 2
Ear Infection 0 0 0
Skin Problem 5 6 5
Breathing Problem 1 0 1
Stiff Neck 8 5 7
Body Pain 27 24 27
Tiredness 23 23 23
Stomach Trouble 5 12 5
Headache 18 16 19
36
Education
Health
Comparing Child Labourers and Street Children
37
There is also a greater sectorial difference in school enrolment in North East and North West. This calls for a concerted effort of child education campaign in these rural zones. This can be done using grassroots approach in form of first, organizing workshop on the ills of no being educated through training the respected leader in the communities and secondly, these leaders will then educated parents and children in their respective communities
The regional analysis seems to inform us that parental factor is the major difference in the determinants of non-school attendant by region. This also was identified in econometric analysis in form of the effect of educated parents and illiterate parents in child school enrolment and work activity. This influence is stronger in North than South. Literacy programme (be it formal or non-formal) for parents should be organized to educate parents on the importance of child education and bad effects of child labour and more importantly girl child education and parents in Northern Nigeria. This should be supported by a follow-up programmes or workshop on re-orientating the value system of children
38
However, for those children combining schooling with some economic activities, (which is a response to poverty) which is also higher in South than North, there is need to structure school programme to accommodate them in form of school hours etc especially in the Southern Nigeria. This is because most families especially poor families may not afford the cost of schooling without engaging their children in economic activities. Alternatively, government should provide some assistantship in form of grant, free education or scholarship for children of poor. This can be done through well articulated and target programme devoid of politics to these families.The child participation in school or economic activities is influenced by regional dummies. In view of this, we may not accurately infer the reason for this. However, this could be attributed to religion and/or tribal (in form of culture) influence which was not captured in the survey. Therefore, community heads should be educated in any form on the need for playing down some of the cultural and religious variables hindering education of their children especially girl child.
39
The factors that encourage existence of street children should be discouraged in all form and format. Street children are compelled to do anything possible to meet their basic survival needs in the street. They are mostly engaged in the worst forms of child labours. Therefore government, non-government, private sector and international non-government organization should first establish a rehabilitation centers, run-in homes for correction. In this centers and homes, a lot of counseling and other non-formal education should be the highest priority. There should also be a regular networking meetings not only GOs, NGOs, and community based organizations (CBOs), but also street children should be able to share experiences, ideas, resources, and information that will uplift their welfare. These centres should be more in cities where there is higher incidence.It is also important to educate both parents and children on the recently signed child right bill in whatever language and mode that could ensure effective understanding. This is important because some parents and indeed children lack complete knowledge of their right in the society. In addition, government should develop effective and efficient strategies in enforcing the contents of the bill.
40
Regular survey on child labour and street children are important for monitoring the trends of the incidence. However, the obvious lapses in terms of inclusion of omitted variables especially in street children survey should be corrected
The environment where children work is wordy of comment. All stakeholders should provide necessary work environment and working condition for children comparable to those of adult if they must work. In addition, parents should not use their children as means of improving household welfare rather they should see their children’s work as a supplement to household income towards the child’s education expenses. In this vein, parents (especially fathers) should be advised and encouraged to channel whatever income accrued from child labour to their school expenses. However, this policy will only be implemented where children could not help working.
41
Child welfare is affected by region, sector, child, parents and household characteristics. It is important for policy makers to consider these variables when formulating child welfare policy in Nigeria. Government should also play down on their total ban policy considering the effect it may have on poor families. However, they should use every machinery to stop the existence of street children.
42
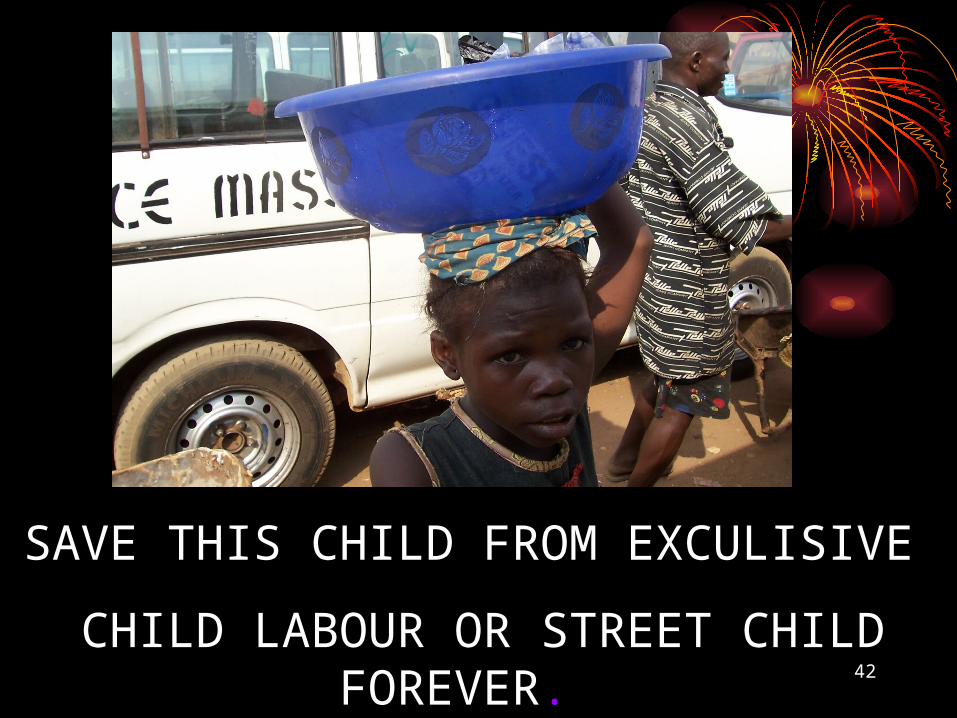
SAVE THIS CHILD FROM EXCULISIVE
CHILD LABOUR OR STREET CHILD FOREVER.

43
THANK YOU AND GOD BLESS
Related Documents