1 Potential Impact and Cost-Effectiveness of the 2009 “Rapid Advice” PMTCT Guidelines — 15 Resource-Limited Countries, 2010 Andrew F. Auld, Omotayo Bolu, Tracy Creek, Mary Lou Lindegren, Emilia Rivadeneira, Helen Dale, Nalinee Sangrujee, Tedd Ellerbrock Global AIDS Program, Centers for Disease Control and Prevention (CDC), Atlanta, U.S.A Presented by Andrew F. Auld MBChB

1 Potential Impact and Cost-Effectiveness of the 2009 “Rapid Advice” PMTCT Guidelines — 15 Resource-Limited Countries, 2010 Andrew F. Auld, Omotayo Bolu,
Dec 25, 2015
Welcome message from author
This document is posted to help you gain knowledge. Please leave a comment to let me know what you think about it! Share it to your friends and learn new things together.
Transcript

1
Potential Impact and Cost-Effectiveness of the 2009 “Rapid Advice” PMTCT Guidelines
— 15 Resource-Limited Countries, 2010
Andrew F. Auld, Omotayo Bolu, Tracy Creek, Mary Lou Lindegren,
Emilia Rivadeneira, Helen Dale, Nalinee Sangrujee, Tedd Ellerbrock
Global AIDS Program, Centers for Disease Control and Prevention (CDC), Atlanta, U.S.A
Presented by Andrew F. Auld MBChB
2
Peri-natal HIV Transmission
• Globally, 420,000 infants become HIV-infected annually
• About 90% of infections occur in Africa 60% during pregnancy/birth 40% during breastfeeding
• Antiretroviral drugs (ARVs) known to significantly reduce HIV transmission during pregnancy and birth In 2009 ARVs proven effective during breastfeeding
• Guidelines for the use of ARVs for prevention of mother-to-child transmission (PMTCT): Last published in 2006 Revised in 2009
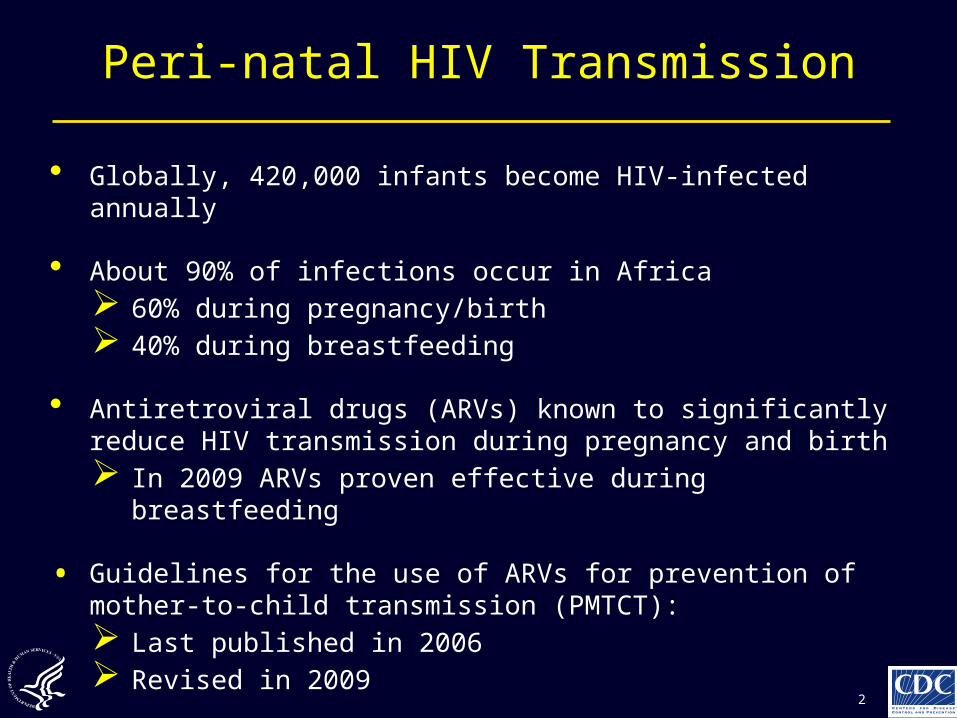
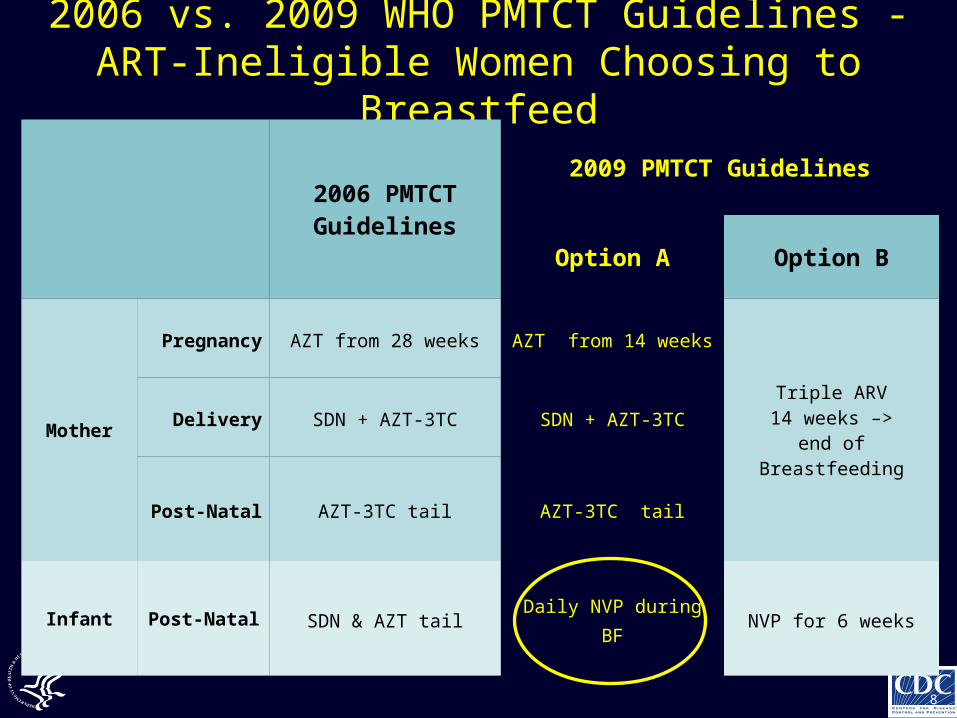
2006 vs. 2009 WHO PMTCT Guidelines -ART-Ineligible Women Choosing to Breastfeed
2006 PMTCT Guidelines
2009 PMTCT Guidelines
Option A Option B
Mother
Pregnancy AZT from 28 weeks AZT from 14 weeks
Triple ARV14 weeks –>
end of Breastfeeding
Delivery SDN + AZT-3TC SDN + AZT-3TC
Post-Natal AZT-3TC tail AZT-3TC tail
Infant Post-Natal SDN & AZT tail Daily NVP during BF NVP for 6 weeks
3

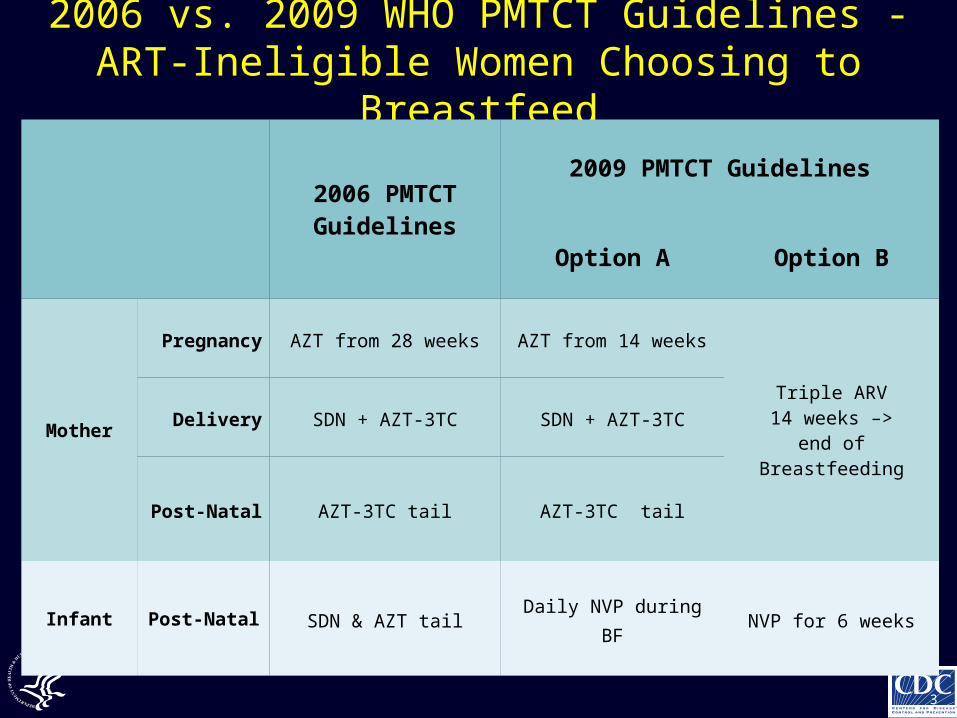
2006 vs. 2009 WHO PMTCT Guidelines -ART-Ineligible Women Choosing to Breastfeed
2006 PMTCT Guidelines
2009 PMTCT Guidelines
Option A Option B
Mother
Pregnancy AZT from 28 weeks AZT from 14 weeks
Triple ARV14 weeks –>
end of Breastfeeding
Delivery SDN + AZT-3TC SDN + AZT-3TC
Post-Natal AZT-3TC tail AZT-3TC tail
Infant Post-Natal SDN & AZT tail Daily NVP during BF NVP for 6 weeks
4

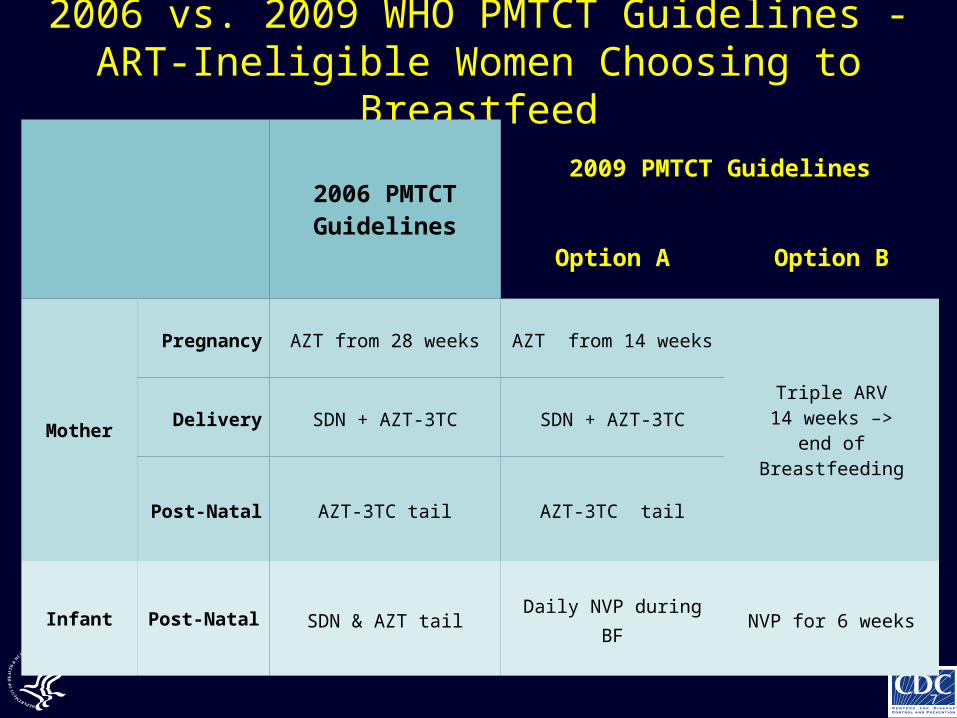
2006 vs. 2009 WHO PMTCT Guidelines -ART-Ineligible Women Choosing to Breastfeed
2006 PMTCT Guidelines
2009 PMTCT Guidelines
Option A Option B
Mother
Pregnancy AZT from 28 weeks AZT from 14 weeks
Triple ARV14 weeks –>
end of Breastfeeding
Delivery SDN + AZT-3TC SDN + AZT-3TC
Post-Natal AZT-3TC tail AZT-3TC tail
Infant Post-Natal SDN & AZT tail Daily NVP during BF NVP for 6 weeks
5

2006 vs. 2009 WHO PMTCT Guidelines -ART-Ineligible Women Choosing to Breastfeed
2006 PMTCT Guidelines
2009 PMTCT Guidelines
Option A Option B
Mother
Pregnancy AZT from 28 weeks AZT from 14 weeks
Triple ARV14 weeks –>
end of Breastfeeding
Delivery SDN + AZT-3TC SDN + AZT-3TC
Post-Natal AZT-3TC tail AZT-3TC tail
Infant Post-Natal SDN & AZT tail Daily NVP during BF NVP for 6 weeks
6
2006 vs. 2009 WHO PMTCT Guidelines -ART-Ineligible Women Choosing to Breastfeed
2006 PMTCT Guidelines
2009 PMTCT Guidelines
Option A Option B
Mother
Pregnancy AZT from 28 weeks AZT from 14 weeks
Triple ARV14 weeks –>
end of Breastfeeding
Delivery SDN + AZT-3TC SDN + AZT-3TC
Post-Natal AZT-3TC tail AZT-3TC tail
Infant Post-Natal SDN & AZT tail Daily NVP during BF NVP for 6 weeks
7
2006 vs. 2009 WHO PMTCT Guidelines -ART-Ineligible Women Choosing to Breastfeed
2006 PMTCT Guidelines
2009 PMTCT Guidelines
Option A Option B
Mother
Pregnancy AZT from 28 weeks AZT from 14 weeks
Triple ARV14 weeks –>
end of Breastfeeding
Delivery SDN + AZT-3TC SDN + AZT-3TC
Post-Natal AZT-3TC tail AZT-3TC tail
Infant Post-Natal SDN & AZT tail Daily NVP during BF NVP for 6 weeks
8

2006 vs. 2009 WHO PMTCT Guidelines -ART-Ineligible Women Choosing to Breastfeed
2006 PMTCT Guidelines
2009 PMTCT Guidelines
Option A Option B
Mother
Pregnancy AZT from 28 weeks AZT from 14 weeks
Triple ARV14 weeks –>
end of Breastfeeding
Delivery SDN + AZT-3TC SDN + AZT-3TC
Post-Natal AZT-3TC tail AZT-3TC tail
Infant Post-Natal SDN & AZT tail Daily NVP during BF NVP for 6 weeks
9

Earlier ART for HIV-Infected Pregnant Women
• 2006 WHO Guidelines:
CD4 < 200/µL
CD4 < 350/µL with WHO stage III
All WHO stage IV eligible
• 2009 WHO Guidelines: Earlier ART
CD4 < 350/µL
All WHO stage III/IV eligible
10

11
Rationale & Objectives for Research
• Rationale:
2009 PMTCT guidelines, adopting options A or B for ART-ineligible women, equally effective for HIV prevention (WHO 2009)
Other criteria, e.g. cost-effectiveness, feasibility, are important
• Objectives:
To estimate in 15 resource-limited countries:
- the potential cost-effectiveness
- the potential costs saved, through reduced need to treat HIV-infected children,
if countries choose option A or option B

12
15 Focus Countries of the US President’s Emergency Plan for AIDS Relief
Ethiopia
Uganda
Kenya
Rwanda
Tanzania
Zambia
Mozambique
Haiti
Guyana
Cote d’Ivoire
Nigeria
Namibia
Botswana
South Africa
Vietnam

13
Methods
• Deterministic model:
Follow cohorts of HIV-infected pregnant women and exposed infants born in each of the 15 focus countries during 2010
Three PMTCT scenarios:
- Scenario “A”: 2009 Guidelines with option A for ART-ineligible women
- Scenario “B”: 2009 Guidelines with option B for ART-ineligible women using the least expensive prophylactic regimen (AZT,3TC,EFV)
- Scenario “2006”: 2006 WHO Guidelines

14
Methods
• To estimate cost-effectiveness of scenarios “A” & “B”, estimate:
Incremental cost-effectiveness ratios (ICERs)
- Additional cost per additional life-years gained (LYG) of implementing either scenario “A” or “B” instead of the 2006 Guidelines
• If ICER < Gross Domestic Product (GDP) / Capita:
Highly Cost-effective

15
Methods
• To estimate whether scenarios A & B are cost saving, estimate for each of the scenarios (“A”, “B”, and “2006”):
Total costs incurred by PMTCT program
Total lifetime treatment costs for infected children
• If total costs for scenario A or B < total costs for scenario 2006:
Cost-saving
16
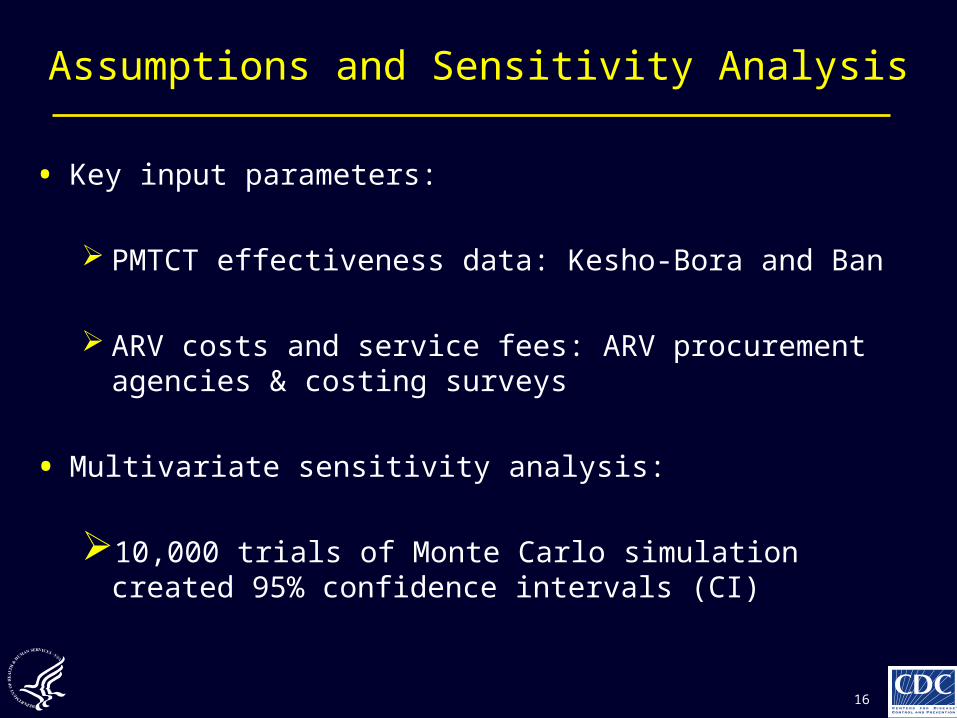
Assumptions and Sensitivity Analysis
• Key input parameters:
PMTCT effectiveness data: Kesho-Bora and Ban
ARV costs and service fees: ARV procurement agencies & costing surveys
• Multivariate sensitivity analysis:
10,000 trials of Monte Carlo simulation created 95% confidence intervals (CI)

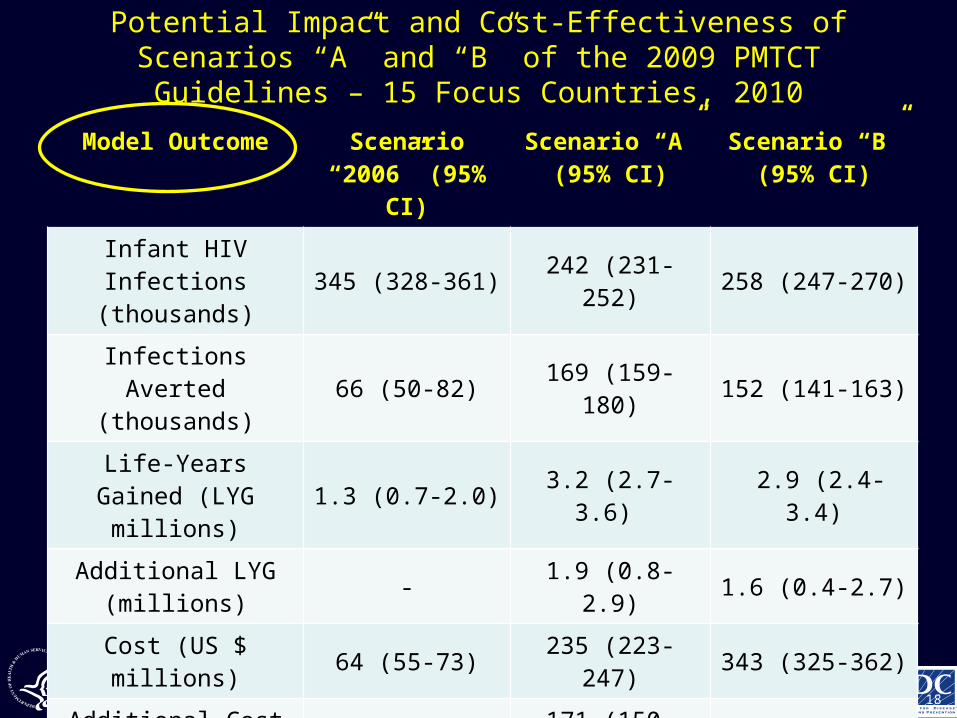
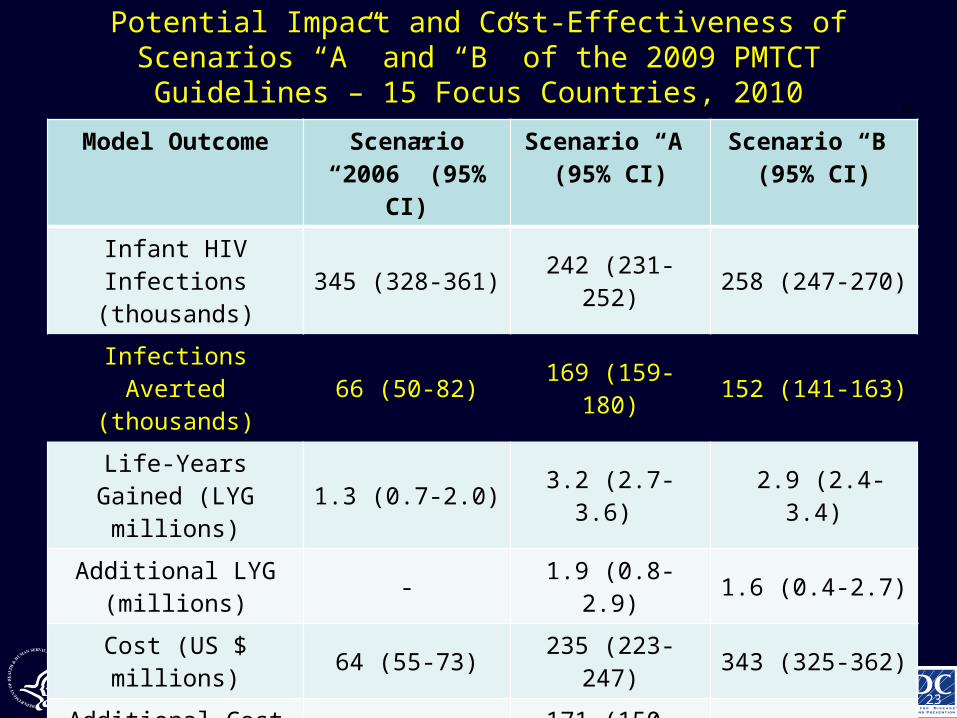
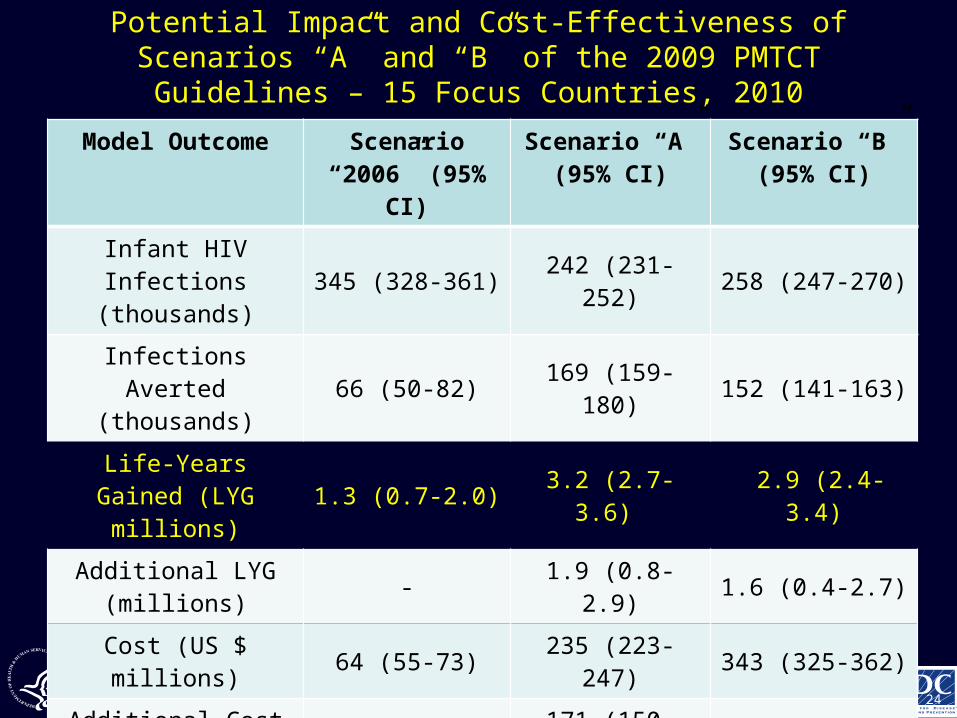
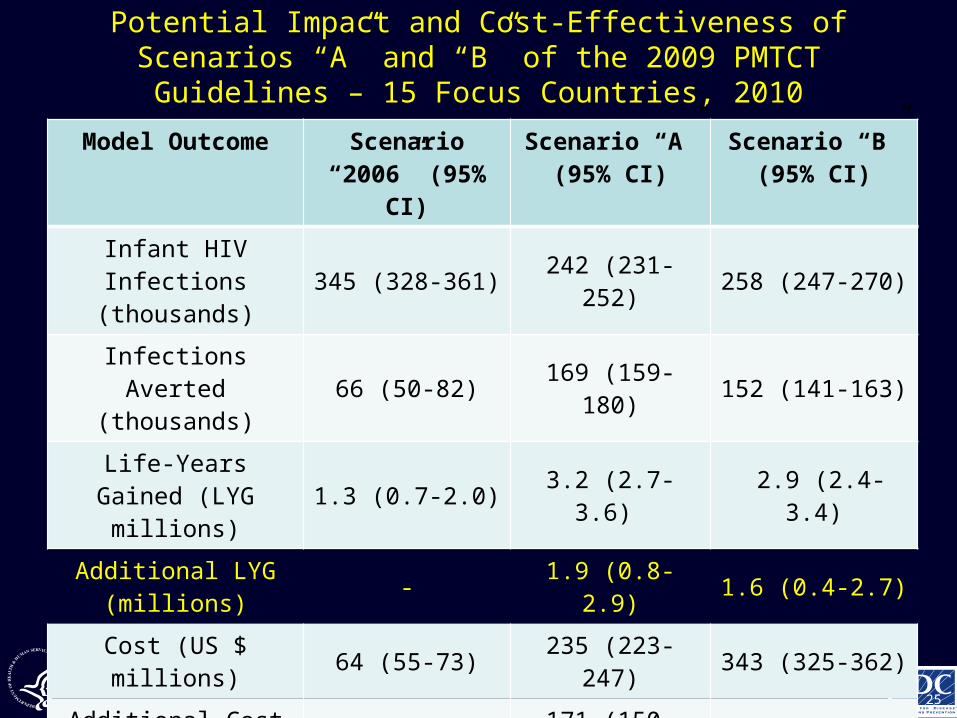
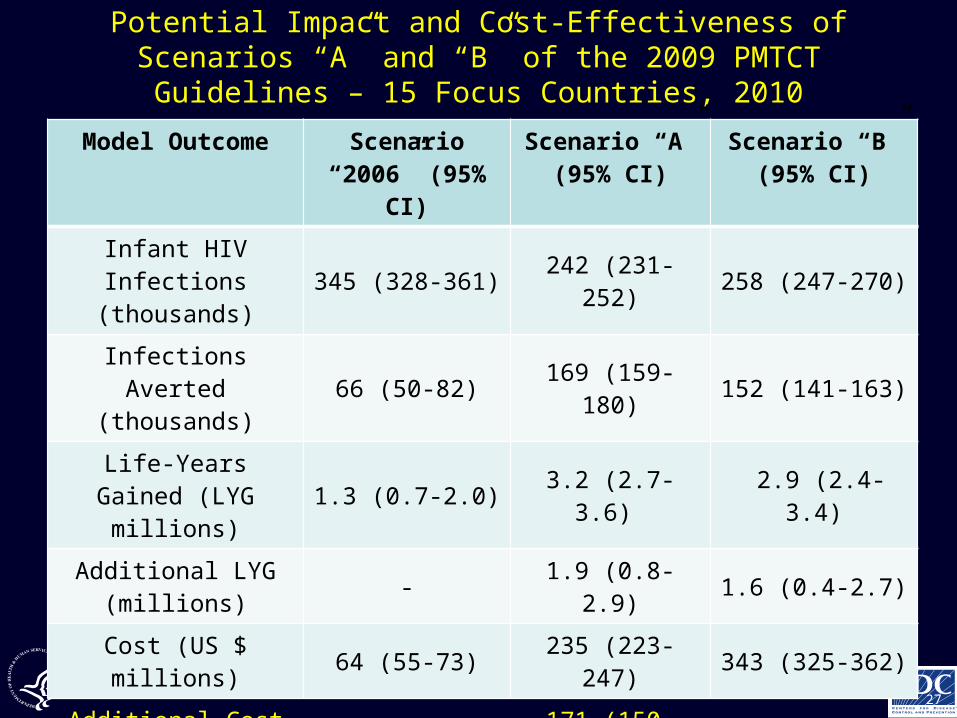
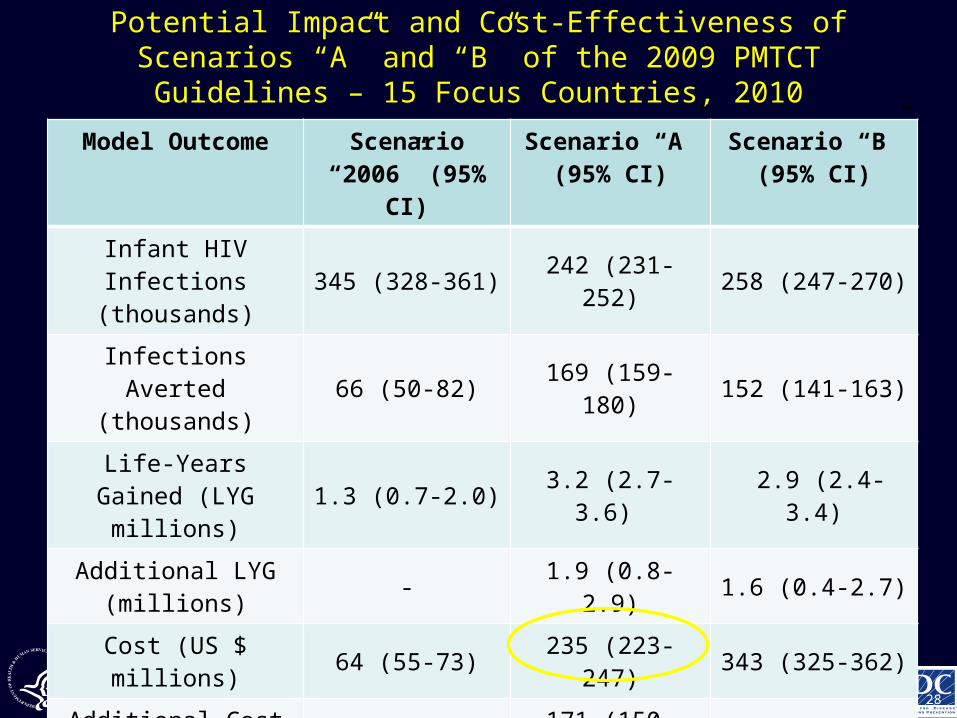
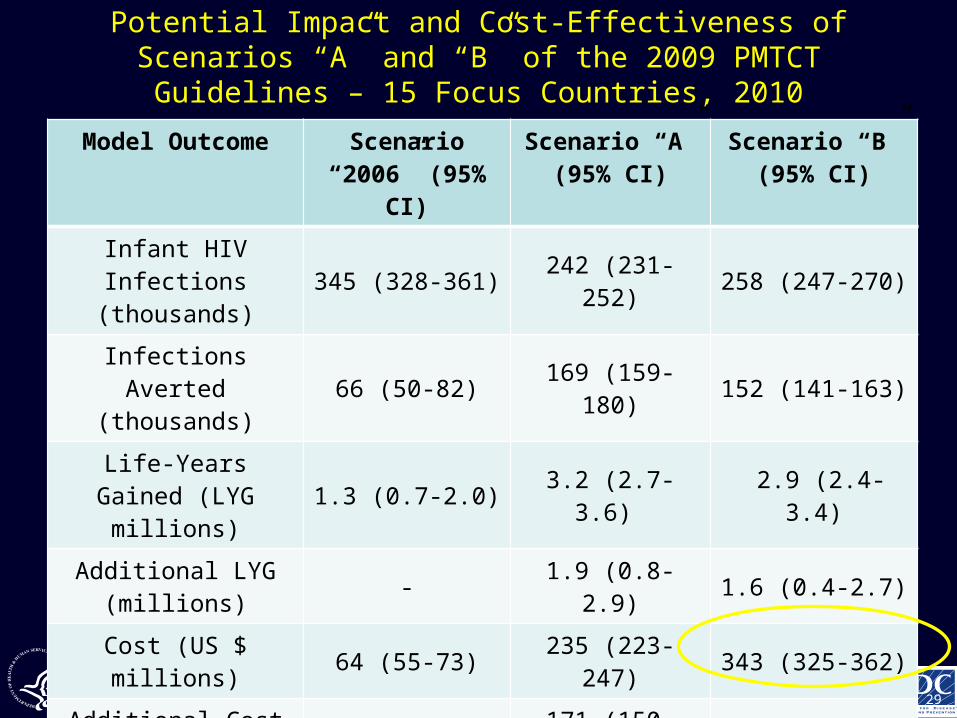
Potential Impact and Cost-Effectiveness of Scenarios “A” and “B” of the 2009 PMTCT Guidelines – 15 Focus Countries, 2010
17
Model Outcome Scenario “2006” (95% CI)
Scenario “A”(95% CI)
Scenario “B”(95% CI)
Infant HIV Infections(thousands)
345 (328-361) 242 (231-252) 258 (247-270)
Infections Averted (thousands)
66 (50-82) 169 (159-180) 152 (141-163)
Life-Years Gained (LYG millions)
1.3 (0.7-2.0) 3.2 (2.7-3.6) 2.9 (2.4-3.4)
Additional LYG (millions)
- 1.9 (0.8-2.9) 1.6 (0.4-2.7)
Cost (US $ millions) 64 (55-73) 235 (223-247) 343 (325-362)
Additional Cost(millions)
- 171 (150-192) 288 (252-307)
ICER (US $/LYG)
- 92 (81-107)Equally EffectiveMore Expensive
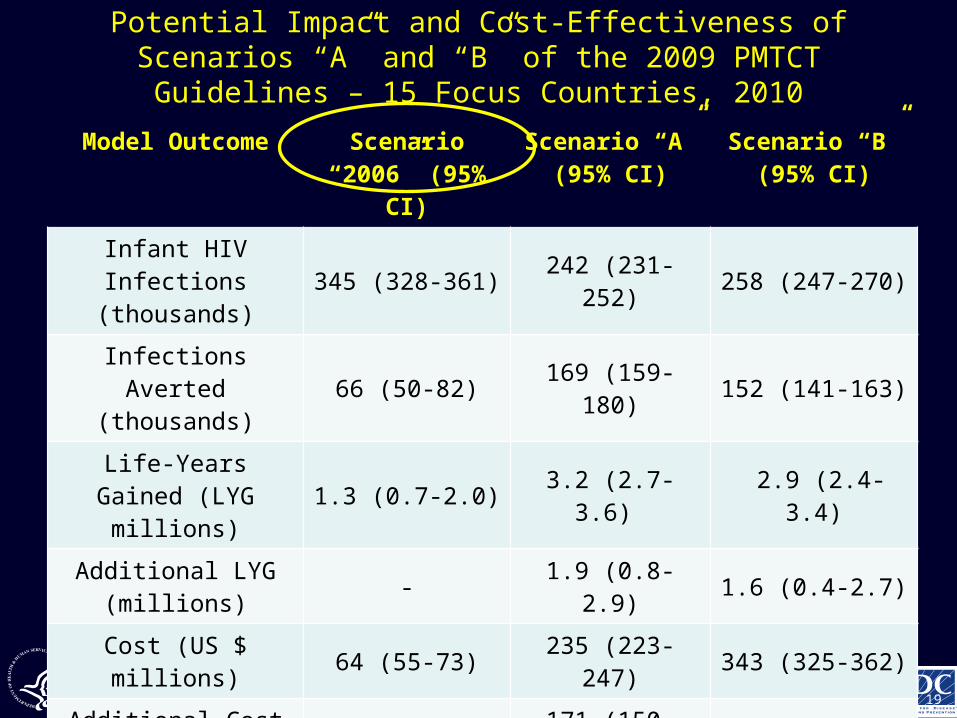
Potential Impact and Cost-Effectiveness of Scenarios “A” and “B” of the 2009 PMTCT Guidelines – 15 Focus Countries, 2010
18
Model Outcome Scenario “2006” (95% CI)
Scenario “A”(95% CI)
Scenario “B”(95% CI)
Infant HIV Infections(thousands)
345 (328-361) 242 (231-252) 258 (247-270)
Infections Averted (thousands)
66 (50-82) 169 (159-180) 152 (141-163)
Life-Years Gained (LYG millions)
1.3 (0.7-2.0) 3.2 (2.7-3.6) 2.9 (2.4-3.4)
Additional LYG (millions)
- 1.9 (0.8-2.9) 1.6 (0.4-2.7)
Cost (US $ millions) 64 (55-73) 235 (223-247) 343 (325-362)
Additional Cost(millions)
- 171 (150-192) 288 (252-307)
ICER (US $/LYG)
- 92 (81-107)Equally EffectiveMore Expensive
Potential Impact and Cost-Effectiveness of Scenarios “A” and “B” of the 2009 PMTCT Guidelines – 15 Focus Countries, 2010
19
Model Outcome Scenario “2006” (95% CI)
Scenario “A”(95% CI)
Scenario “B”(95% CI)
Infant HIV Infections(thousands)
345 (328-361) 242 (231-252) 258 (247-270)
Infections Averted (thousands)
66 (50-82) 169 (159-180) 152 (141-163)
Life-Years Gained (LYG millions)
1.3 (0.7-2.0) 3.2 (2.7-3.6) 2.9 (2.4-3.4)
Additional LYG (millions)
- 1.9 (0.8-2.9) 1.6 (0.4-2.7)
Cost (US $ millions) 64 (55-73) 235 (223-247) 343 (325-362)
Additional Cost(millions)
- 171 (150-192) 288 (252-307)
ICER (US $/LYG)
- 92 (81-107)Equally EffectiveMore Expensive

Potential Impact and Cost-Effectiveness of Scenarios “A” and “B” of the 2009 PMTCT Guidelines – 15 Focus Countries, 2010
20
Model Outcome Scenario “2006” (95% CI)
Scenario “A”(95% CI)
Scenario “B”(95% CI)
Infant HIV Infections(thousands)
345 (328-361) 242 (231-252) 258 (247-270)
Infections Averted (thousands)
66 (50-82) 169 (159-180) 152 (141-163)
Life-Years Gained (LYG millions)
1.3 (0.7-2.0) 3.2 (2.7-3.6) 2.9 (2.4-3.4)
Additional LYG (millions)
- 1.9 (0.8-2.9) 1.6 (0.4-2.7)
Cost (US $ millions) 64 (55-73) 235 (223-247) 343 (325-362)
Additional Cost(millions)
- 171 (150-192) 288 (252-307)
ICER (US $/LYG)
- 92 (81-107)Equally EffectiveMore Expensive

Potential Impact and Cost-Effectiveness of Scenarios “A” and “B” of the 2009 PMTCT Guidelines – 15 Focus Countries, 2010
21
Model Outcome Scenario “2006” (95% CI)
Scenario “A”(95% CI)
Scenario “B”(95% CI)
Infant HIV Infections(thousands)
345 (328-361) 242 (231-252) 258 (247-270)
Infections Averted (thousands)
66 (50-82) 169 (159-180) 152 (141-163)
Life-Years Gained (LYG millions)
1.3 (0.7-2.0) 3.2 (2.7-3.6) 2.9 (2.4-3.4)
Additional LYG (millions)
- 1.9 (0.8-2.9) 1.6 (0.4-2.7)
Cost (US $ millions) 64 (55-73) 235 (223-247) 343 (325-362)
Additional Cost(millions)
- 171 (150-192) 288 (252-307)
ICER (US $/LYG)
- 92 (81-107)Equally EffectiveMore Expensive

Potential Impact and Cost-Effectiveness of Scenarios “A” and “B” of the 2009 PMTCT Guidelines – 15 Focus Countries, 2010
22
Model Outcome Scenario “2006” (95% CI)
Scenario “A”(95% CI)
Scenario “B”(95% CI)
Infant HIV Infections(thousands)
345 (328-361) 242 (231-252) 258 (247-270)
Infections Averted (thousands)
66 (50-82) 169 (159-180) 152 (141-163)
Life-Years Gained (LYG millions)
1.3 (0.7-2.0) 3.2 (2.7-3.6) 2.9 (2.4-3.4)
Additional LYG (millions)
- 1.9 (0.8-2.9) 1.6 (0.4-2.7)
Cost (US $ millions) 64 (55-73) 235 (223-247) 343 (325-362)
Additional Cost(millions)
- 171 (150-192) 288 (252-307)
ICER (US $/LYG)
- 92 (81-107)Equally EffectiveMore Expensive
Potential Impact and Cost-Effectiveness of Scenarios “A” and “B” of the 2009 PMTCT Guidelines – 15 Focus Countries, 2010
23
Model Outcome Scenario “2006” (95% CI)
Scenario “A”(95% CI)
Scenario “B”(95% CI)
Infant HIV Infections(thousands)
345 (328-361) 242 (231-252) 258 (247-270)
Infections Averted (thousands)
66 (50-82) 169 (159-180) 152 (141-163)
Life-Years Gained (LYG millions)
1.3 (0.7-2.0) 3.2 (2.7-3.6) 2.9 (2.4-3.4)
Additional LYG (millions)
- 1.9 (0.8-2.9) 1.6 (0.4-2.7)
Cost (US $ millions) 64 (55-73) 235 (223-247) 343 (325-362)
Additional Cost(millions)
- 171 (150-192) 288 (252-307)
ICER (US $/LYG)
- 92 (81-107)Equally EffectiveMore Expensive
Potential Impact and Cost-Effectiveness of Scenarios “A” and “B” of the 2009 PMTCT Guidelines – 15 Focus Countries, 2010
24
Model Outcome Scenario “2006” (95% CI)
Scenario “A”(95% CI)
Scenario “B”(95% CI)
Infant HIV Infections(thousands)
345 (328-361) 242 (231-252) 258 (247-270)
Infections Averted (thousands)
66 (50-82) 169 (159-180) 152 (141-163)
Life-Years Gained (LYG millions)
1.3 (0.7-2.0) 3.2 (2.7-3.6) 2.9 (2.4-3.4)
Additional LYG (millions)
- 1.9 (0.8-2.9) 1.6 (0.4-2.7)
Cost (US $ millions) 64 (55-73) 235 (223-247) 343 (325-362)
Additional Cost(millions)
- 171 (150-192) 288 (252-307)
ICER (US $/LYG)
- 92 (81-107)Equally EffectiveMore Expensive
Potential Impact and Cost-Effectiveness of Scenarios “A” and “B” of the 2009 PMTCT Guidelines – 15 Focus Countries, 2010
25
Model Outcome Scenario “2006” (95% CI)
Scenario “A”(95% CI)
Scenario “B”(95% CI)
Infant HIV Infections(thousands)
345 (328-361) 242 (231-252) 258 (247-270)
Infections Averted (thousands)
66 (50-82) 169 (159-180) 152 (141-163)
Life-Years Gained (LYG millions)
1.3 (0.7-2.0) 3.2 (2.7-3.6) 2.9 (2.4-3.4)
Additional LYG (millions)
- 1.9 (0.8-2.9) 1.6 (0.4-2.7)
Cost (US $ millions) 64 (55-73) 235 (223-247) 343 (325-362)
Additional Cost(millions)
- 171 (150-192) 288 (252-307)
ICER (US $/LYG)
- 92 (81-107)Equally EffectiveMore Expensive

Potential Impact and Cost-Effectiveness of Scenarios “A” and “B” of the 2009 PMTCT Guidelines – 15 Focus Countries, 2010
26
Model Outcome Scenario “2006” (95% CI)
Scenario “A”(95% CI)
Scenario “B”(95% CI)
Infant HIV Infections(thousands)
345 (328-361) 242 (231-252) 258 (247-270)
Infections Averted (thousands)
66 (50-82) 169 (159-180) 152 (141-163)
Life-Years Gained (LYG millions)
1.3 (0.7-2.0) 3.2 (2.7-3.6) 2.9 (2.4-3.4)
Additional LYG (millions)
- 1.9 (0.8-2.9) 1.6 (0.4-2.7)
Cost (US $ millions) 64 (55-73) 235 (223-247) 343 (325-362)
Additional Cost(millions)
- 171 (150-192) 288 (252-307)
ICER (US $/LYG)
- 92 (81-107)Equally EffectiveMore Expensive
Potential Impact and Cost-Effectiveness of Scenarios “A” and “B” of the 2009 PMTCT Guidelines – 15 Focus Countries, 2010
27
Model Outcome Scenario “2006” (95% CI)
Scenario “A”(95% CI)
Scenario “B”(95% CI)
Infant HIV Infections(thousands)
345 (328-361) 242 (231-252) 258 (247-270)
Infections Averted (thousands)
66 (50-82) 169 (159-180) 152 (141-163)
Life-Years Gained (LYG millions)
1.3 (0.7-2.0) 3.2 (2.7-3.6) 2.9 (2.4-3.4)
Additional LYG (millions)
- 1.9 (0.8-2.9) 1.6 (0.4-2.7)
Cost (US $ millions) 64 (55-73) 235 (223-247) 343 (325-362)
Additional Cost(millions)
- 171 (150-192) 288 (252-307)
ICER (US $/LYG)
- 92 (81-107)Equally EffectiveMore Expensive
Potential Impact and Cost-Effectiveness of Scenarios “A” and “B” of the 2009 PMTCT Guidelines – 15 Focus Countries, 2010
28
Model Outcome Scenario “2006” (95% CI)
Scenario “A”(95% CI)
Scenario “B”(95% CI)
Infant HIV Infections(thousands)
345 (328-361) 242 (231-252) 258 (247-270)
Infections Averted (thousands)
66 (50-82) 169 (159-180) 152 (141-163)
Life-Years Gained (LYG millions)
1.3 (0.7-2.0) 3.2 (2.7-3.6) 2.9 (2.4-3.4)
Additional LYG (millions)
- 1.9 (0.8-2.9) 1.6 (0.4-2.7)
Cost (US $ millions) 64 (55-73) 235 (223-247) 343 (325-362)
Additional Cost(millions)
- 171 (150-192) 288 (252-307)
ICER (US $/LYG)
- 92 (81-107)Equally EffectiveMore Expensive
Potential Impact and Cost-Effectiveness of Scenarios “A” and “B” of the 2009 PMTCT Guidelines – 15 Focus Countries, 2010
29
Model Outcome Scenario “2006” (95% CI)
Scenario “A”(95% CI)
Scenario “B”(95% CI)
Infant HIV Infections(thousands)
345 (328-361) 242 (231-252) 258 (247-270)
Infections Averted (thousands)
66 (50-82) 169 (159-180) 152 (141-163)
Life-Years Gained (LYG millions)
1.3 (0.7-2.0) 3.2 (2.7-3.6) 2.9 (2.4-3.4)
Additional LYG (millions)
- 1.9 (0.8-2.9) 1.6 (0.4-2.7)
Cost (US $ millions) 64 (55-73) 235 (223-247) 343 (325-362)
Additional Cost(millions)
- 171 (150-192) 288 (252-307)
ICER (US $/LYG)
- 92 (81-107)Equally EffectiveMore Expensive

Average ICER of implementing Scenario “A” Instead of Scenario “2006” – 15 Focus Countries, 2010
30
Threshold for High Cost Effectiveness (Weighted Average GDP - US$1,463)
Point Estimate for ICER of Scenario A vs. 2006 WHO PMTCT Guidelines (US$92)
10,000 Trials of Monte Carlo Simulationfor ICER of Scenario A vs. 2006 WHO Guidelines
05
01
00
150
200
Ad
ditio
na
l PM
TC
T A
RV
Deliv
ery
Exp
en
diture
(m
illio
ns U
S$)
0 .5 1 1.5 2 2.5Additional Life-Years Gained (millions)

Average ICER of implementing Scenario “A” Instead of Scenario “2006” – 15 Focus Countries, 2010
31
Threshold for High Cost Effectiveness (Weighted Average GDP - US$1,463)
Point Estimate for ICER of Scenario A vs. 2006 WHO PMTCT Guidelines (US$92)
10,000 Trials of Monte Carlo Simulationfor ICER of Scenario A vs. 2006 WHO Guidelines
05
01
00
150
200
Ad
ditio
na
l PM
TC
T A
RV
Deliv
ery
Exp
en
diture
(m
illio
ns U
S$)
0 .5 1 1.5 2 2.5Additional Life-Years Gained (millions)

Average ICER of implementing Scenario “A” Instead of Scenario “2006” – 15 Focus Countries, 2010
32
Threshold for High Cost Effectiveness (Weighted Average GDP - US$1,463)
Point Estimate for ICER of Scenario A vs. 2006 WHO PMTCT Guidelines (US$92)
10,000 Trials of Monte Carlo Simulationfor ICER of Scenario A vs. 2006 WHO Guidelines
05
01
00
150
200
Ad
ditio
na
l PM
TC
T A
RV
Deliv
ery
Exp
en
diture
(m
illio
ns U
S$)
0 .5 1 1.5 2 2.5Additional Life-Years Gained (millions)

Average ICER of implementing Scenario “A” Instead of Scenario “2006” – 15 Focus Countries, 2010
33
Threshold for High Cost Effectiveness (Weighted Average GDP - US$1,463)
Point Estimate for ICER of Scenario A vs. 2006 WHO PMTCT Guidelines (US$92)
10,000 Trials of Monte Carlo Simulationfor ICER of Scenario A vs. 2006 WHO Guidelines
05
01
00
150
200
Ad
ditio
na
l PM
TC
T A
RV
Deliv
ery
Exp
en
diture
(m
illio
ns U
S$)
0 .5 1 1.5 2 2.5Additional Life-Years Gained (millions)

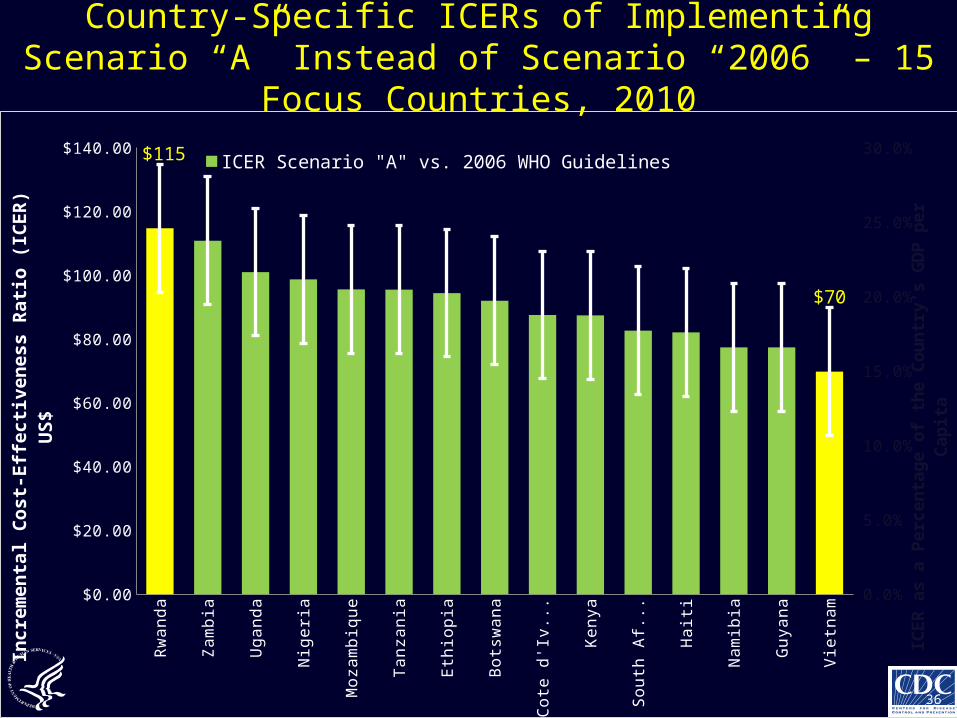
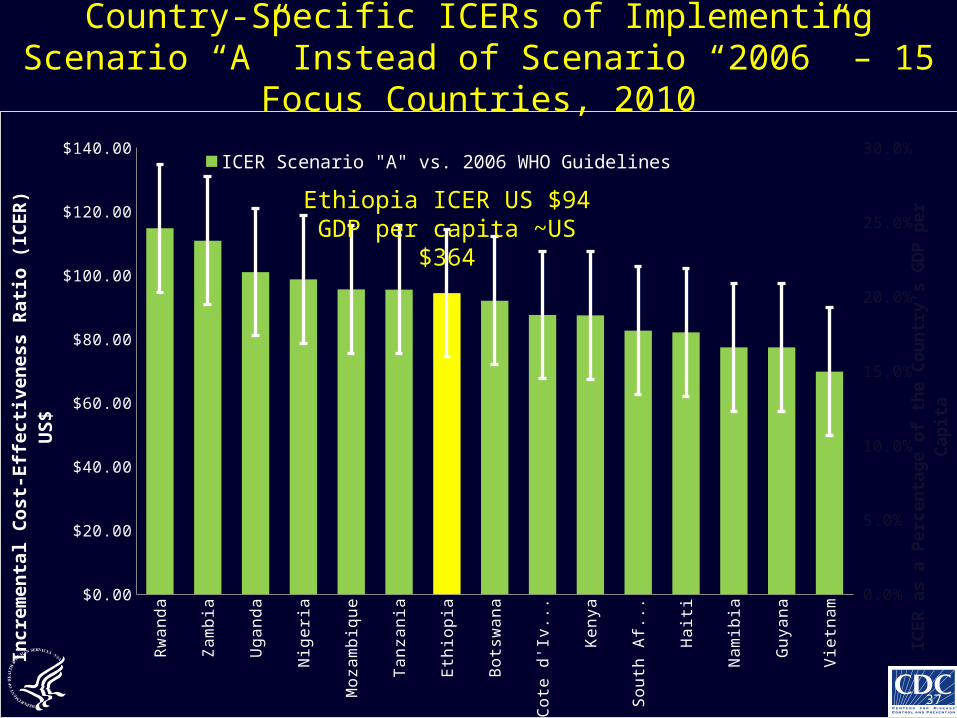
Country-Specific ICERs of Implementing Scenario “A” Instead of Scenario “2006” – 15 Focus Countries, 2010
34
Rw
an
da
Za
mb
ia
Ug
an
da
Nig
eri
a
Mo
zam
biq
ue
Ta
nza
nia
Eth
iop
ia
Bo
tsw
an
a
Co
te d
'Ivo
ire
Ke
nya
So
uth
Afr
ica
Ha
iti
Na
mib
ia
Gu
yan
a
Vie
tna
m
$0.00
$20.00
$40.00
$60.00
$80.00
$100.00
$120.00
$140.00
0.0%
5.0%
10.0%
15.0%
20.0%
25.0%
30.0%ICER Scenario "A" vs. 2006 WHO GuidelinesICER as a % of Country-Specific GDP per Capita
Inc
rem
en
tal C
os
t-E
ffe
cti
ve
ne
ss
Ra
tio
(IC
ER
) U
S$
ICE
R a
s a
Per
cen
tag
e o
f th
e C
ou
ntr
y's
GD
P p
er C
apit
a

Country-Specific ICERs of Implementing Scenario “A” Instead of Scenario “2006” – 15 Focus Countries, 2010
35
Rw
an
da
Za
mb
ia
Ug
an
da
Nig
eri
a
Mo
zam
biq
ue
Ta
nza
nia
Eth
iop
ia
Bo
tsw
an
a
Co
te d
'Ivo
ire
Ke
nya
So
uth
Afr
ica
Ha
iti
Na
mib
ia
Gu
yan
a
Vie
tna
m
$0.00
$20.00
$40.00
$60.00
$80.00
$100.00
$120.00
$140.00
0.0%
5.0%
10.0%
15.0%
20.0%
25.0%
30.0%$115 ICER Scenario "A" vs. 2006 WHO GuidelinesICER as a % of Country-Specific GDP per Capita
Inc
rem
en
tal C
os
t-E
ffe
cti
ve
ne
ss
Ra
tio
(IC
ER
) U
S$
ICE
R a
s a
Per
cen
tag
e o
f th
e C
ou
ntr
y's
GD
P p
er C
apit
a
Country-Specific ICERs of Implementing Scenario “A” Instead of Scenario “2006” – 15 Focus Countries, 2010
36
Rw
an
da
Za
mb
ia
Ug
an
da
Nig
eri
a
Mo
zam
biq
ue
Ta
nza
nia
Eth
iop
ia
Bo
tsw
an
a
Co
te d
'Ivo
ire
Ke
nya
So
uth
Afr
ica
Ha
iti
Na
mib
ia
Gu
yan
a
Vie
tna
m
$0.00
$20.00
$40.00
$60.00
$80.00
$100.00
$120.00
$140.00
0.0%
5.0%
10.0%
15.0%
20.0%
25.0%
30.0%$115
$70
ICER Scenario "A" vs. 2006 WHO GuidelinesICER as a % of Country-Specific GDP per Capita
Inc
rem
en
tal C
os
t-E
ffe
cti
ve
ne
ss
Ra
tio
(IC
ER
) U
S$
ICE
R a
s a
Per
cen
tag
e o
f th
e C
ou
ntr
y's
GD
P p
er C
apit
a
Country-Specific ICERs of Implementing Scenario “A” Instead of Scenario “2006” – 15 Focus Countries, 2010
37
Rw
an
da
Za
mb
ia
Ug
an
da
Nig
eri
a
Mo
zam
biq
ue
Ta
nza
nia
Eth
iop
ia
Bo
tsw
an
a
Co
te d
'Ivo
ire
Ke
nya
So
uth
Afr
ica
Ha
iti
Na
mib
ia
Gu
yan
a
Vie
tna
m
$0.00
$20.00
$40.00
$60.00
$80.00
$100.00
$120.00
$140.00
0.0%
5.0%
10.0%
15.0%
20.0%
25.0%
30.0%ICER Scenario "A" vs. 2006 WHO GuidelinesICER as a % of Country-Specific GDP per Capita
Inc
rem
en
tal C
os
t-E
ffe
cti
ve
ne
ss
Ra
tio
(IC
ER
) U
S$
ICE
R a
s a
Per
cen
tag
e o
f th
e C
ou
ntr
y's
GD
P p
er C
apit
aEthiopia ICER US $94GDP per capita ~US $364
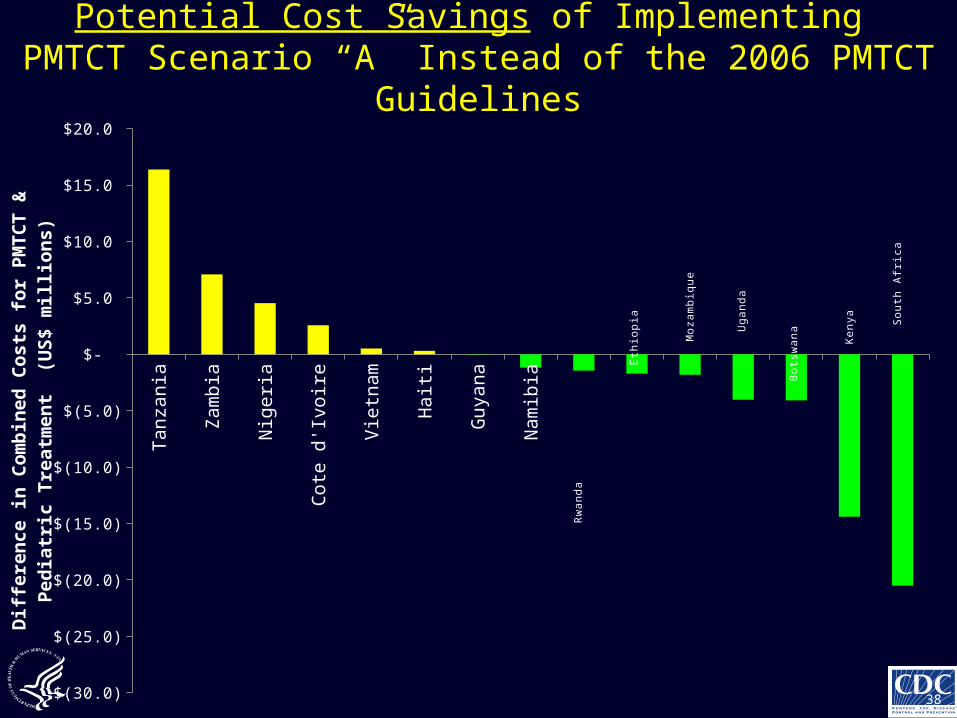
Potential Cost Savings of Implementing PMTCT Scenario “A” Instead of the 2006 PMTCT Guidelines
38
Ta
nza
nia
Za
mb
ia
Nig
eria
Co
te d
'Ivo
ire
Vie
tna
m
Ha
iti
Gu
yan
a
Na
mib
ia
$(30.0)
$(25.0)
$(20.0)
$(15.0)
$(10.0)
$(5.0)
$-
$5.0
$10.0
$15.0
$20.0
Dif
fere
nc
e in
Co
mb
ine
d C
os
ts f
or
PM
TC
T &
Pe
dia
tric
T
rea
tme
nt
(U
S$
mill
ion
s)
Sou
th A
fric
a
Ken
ya
Uga
nda
Bot
swan
a
Moz
ambi
que
Eth
iopi
a
Rw
anda
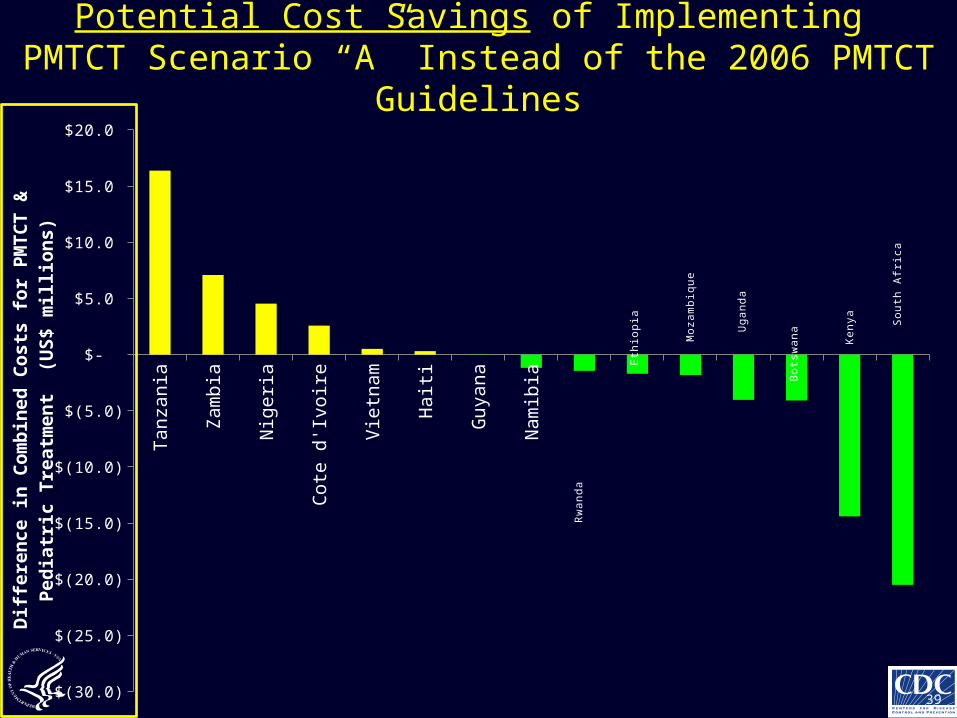
Potential Cost Savings of Implementing PMTCT Scenario “A” Instead of the 2006 PMTCT Guidelines
39
Ta
nza
nia
Za
mb
ia
Nig
eria
Co
te d
'Ivo
ire
Vie
tna
m
Ha
iti
Gu
yan
a
Na
mib
ia
$(30.0)
$(25.0)
$(20.0)
$(15.0)
$(10.0)
$(5.0)
$-
$5.0
$10.0
$15.0
$20.0
Dif
fere
nc
e in
Co
mb
ine
d C
os
ts f
or
PM
TC
T &
Pe
dia
tric
T
rea
tme
nt
(U
S$
mill
ion
s)
Sou
th A
fric
a
Ken
ya
Uga
nda
Bot
swan
a
Moz
ambi
que
Eth
iopi
a
Rw
anda

Potential Cost Savings of Implementing PMTCT Scenario “A” Instead of the 2006 PMTCT Guidelines
40
Ta
nza
nia
Za
mb
ia
Nig
eria
Co
te d
'Ivo
ire
Vie
tna
m
Ha
iti
Gu
yan
a
Na
mib
ia
$(30.0)
$(25.0)
$(20.0)
$(15.0)
$(10.0)
$(5.0)
$-
$5.0
$10.0
$15.0
$20.0
Dif
fere
nc
e in
Co
mb
ine
d C
os
ts f
or
PM
TC
T &
Pe
dia
tric
T
rea
tme
nt
(U
S$
mill
ion
s)
Sou
th A
fric
a
Ken
ya
Uga
nda
Bot
swan
a
Moz
ambi
que
Eth
iopi
a
Rw
anda
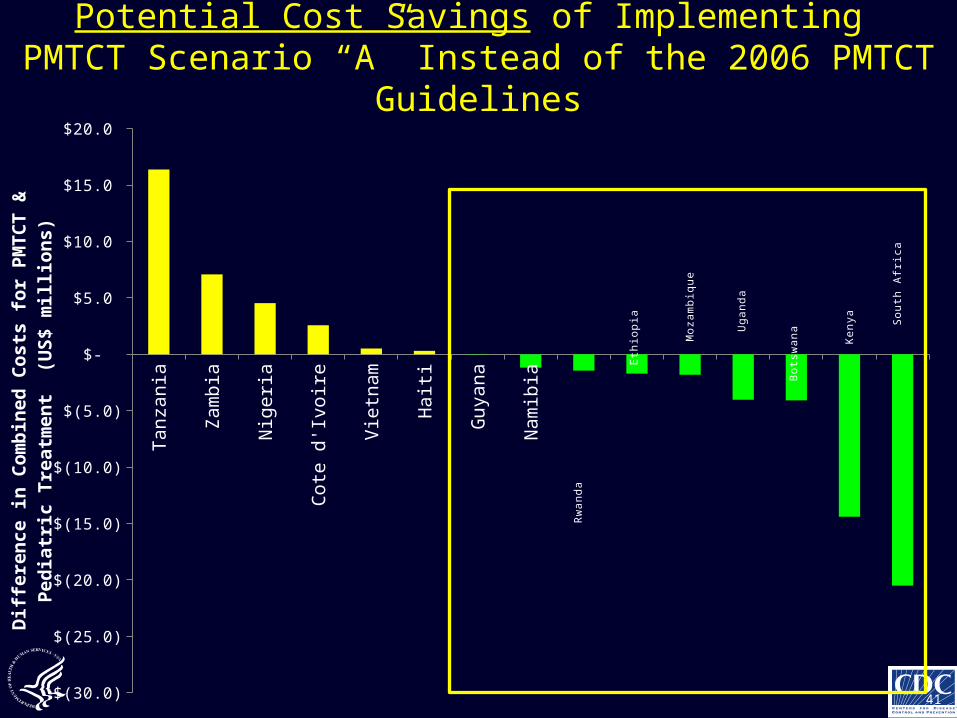
Potential Cost Savings of Implementing PMTCT Scenario “A” Instead of the 2006 PMTCT Guidelines
41
Ta
nza
nia
Za
mb
ia
Nig
eria
Co
te d
'Ivo
ire
Vie
tna
m
Ha
iti
Gu
yan
a
Na
mib
ia
$(30.0)
$(25.0)
$(20.0)
$(15.0)
$(10.0)
$(5.0)
$-
$5.0
$10.0
$15.0
$20.0
Dif
fere
nc
e in
Co
mb
ine
d C
os
ts f
or
PM
TC
T &
Pe
dia
tric
T
rea
tme
nt
(U
S$
mill
ion
s)
Sou
th A
fric
a
Ken
ya
Uga
nda
Bot
swan
a
Moz
ambi
que
Eth
iopi
a
Rw
anda
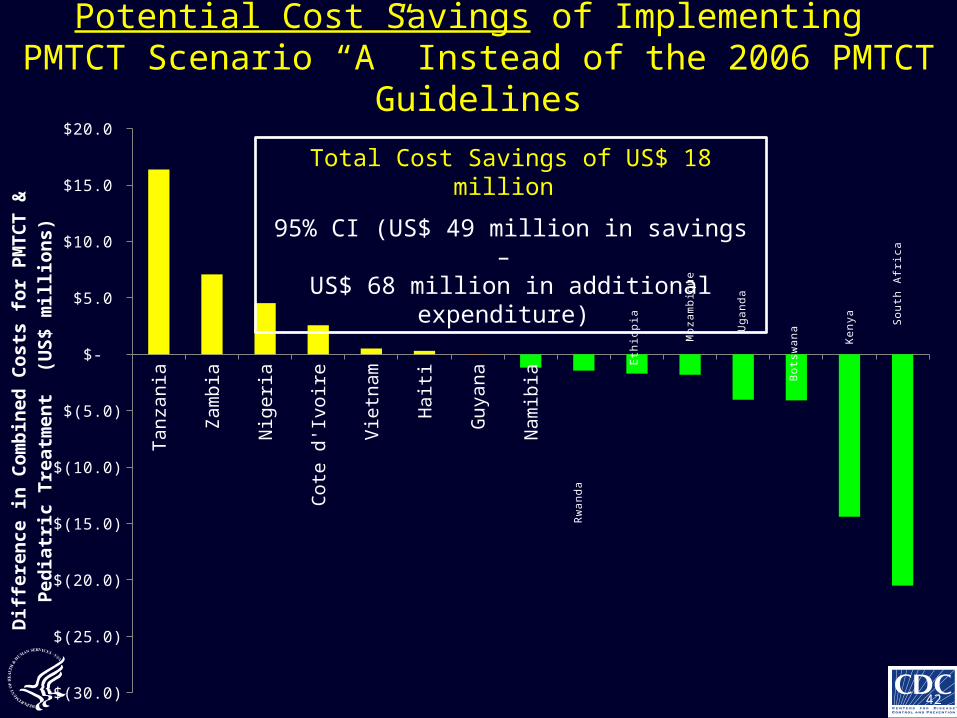
Potential Cost Savings of Implementing PMTCT Scenario “A” Instead of the 2006 PMTCT Guidelines
42
Ta
nza
nia
Za
mb
ia
Nig
eria
Co
te d
'Ivo
ire
Vie
tna
m
Ha
iti
Gu
yan
a
Na
mib
ia
$(30.0)
$(25.0)
$(20.0)
$(15.0)
$(10.0)
$(5.0)
$-
$5.0
$10.0
$15.0
$20.0
Dif
fere
nc
e in
Co
mb
ine
d C
os
ts f
or
PM
TC
T &
Pe
dia
tric
T
rea
tme
nt
(U
S$
mill
ion
s)
Sou
th A
fric
a
Ken
ya
Uga
nda
Bot
swan
a
Moz
ambi
que
Eth
iopi
a
Rw
anda
Total Cost Savings of US$ 18 million
95% CI (US$ 49 million in savings – US$ 68 million in additional expenditure)
43
Limitations
• In establishing 95% CIs, only those input parameters that affected the ICER were varied
• Costs of ARVs are continually changing
44
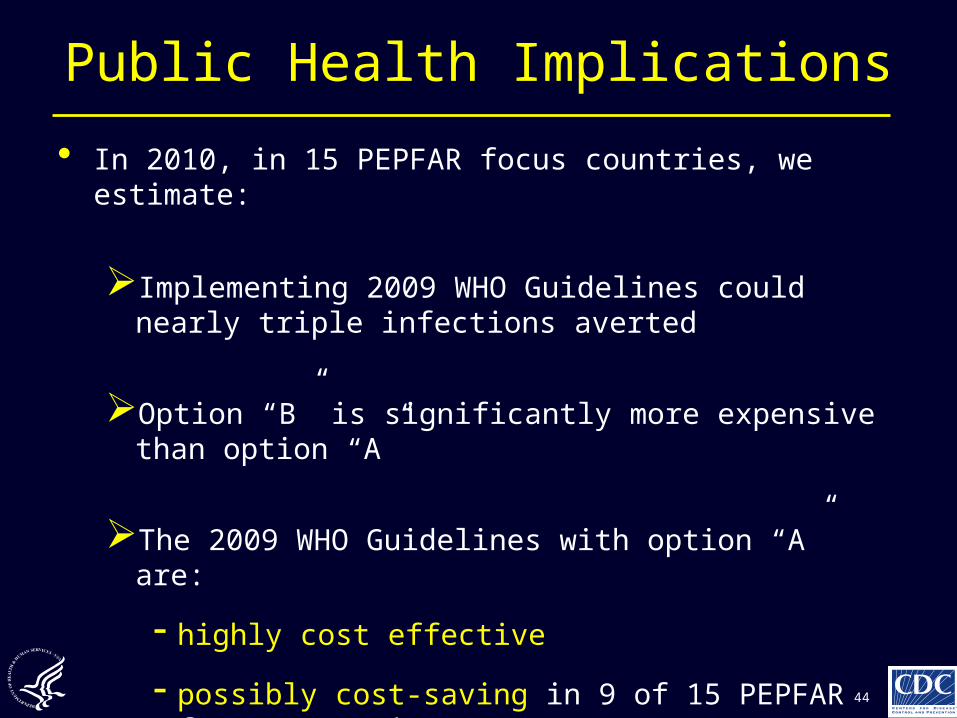
Public Health Implications
• In 2010, in 15 PEPFAR focus countries, we estimate:
Implementing 2009 WHO Guidelines could nearly triple infections averted
Option “B” is significantly more expensive than option “A”
The 2009 WHO Guidelines with option “A” are:
- highly cost effective
- possibly cost-saving in 9 of 15 PEPFAR focus countries

45
Public Health Implications
• These findings support:
Rapid implementation of the 2009 WHO PMTCT Guidelines
Option “A” the most cost-effective option
Acknowledgements
• Co-authors
• Omotayo Bolu
• Tracy Creek
• Mary Lou Lindegren
• Emilia Rivadeneira
• Helen Dale
• Nalinee Sangrujee
• Tedd Ellerbrock
• Collaborators
• Ray Shiraishi
• Elliot Raizes
• David Bell
• Nick Menzies
• Prahbu Vimanaland
• John Blandford
Thank You!
The findings of this presentation are those of the authors and do not necessarily represent the views of the US Centers for
Disease Control and Prevention
47
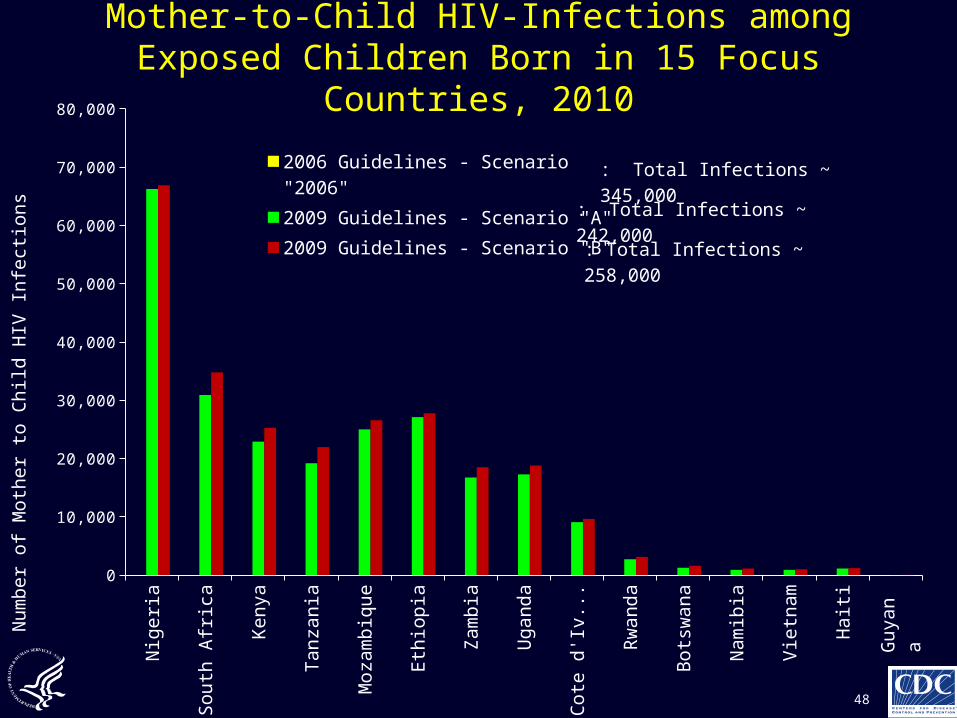
Mother-to-Child HIV-Infections among Exposed Children Born in 15 Focus Countries, 2010
48
Nig
eria
So
uth
Afr
ica
Ke
nya
Ta
nza
nia
Mo
zam
biq
ue
Eth
iop
ia
Za
mb
ia
Ug
an
da
Co
te d
'Ivo
ire
Rw
an
da
Bo
tsw
an
a
Na
mib
ia
Vie
tna
m
Ha
iti
0
10,000
20,000
30,000
40,000
50,000
60,000
70,000
80,000
2006 Guidelines - Scenario "2006"
2009 Guidelines - Scenario "A"
2009 Guidelines - Scenario "B"
Nu
mb
er
of M
oth
er
to C
hild
HIV
Infe
ctio
ns
Guy
ana
: Total Infections ~ 345,000
: Total Infections ~ 242,000
: Total Infections ~ 258,000

Life-Time Treatment Costs for Infected Children Associated with PMTCT Strategy – 15 Focus Countries, 2010
49
So
uth
Afr
ica
Ke
nya
Ug
an
da
Mo
zam
biq
ue
Nig
eria
Eth
iop
ia
Za
mb
ia
Ta
nza
nia
Bo
tsw
an
a
Rw
an
da
Co
te d
'Ivo
ire
Na
mib
ia
Ha
iti
Vie
tna
m
Gu
yan
a
$-
$20.0
$40.0
$60.0
$80.0
$100.0
$120.0
Scenario "2006"
Scenario "A"
Lif
e-T
ime
Tre
atm
en
t C
os
ts f
or
Infe
cte
d C
hild
ren
(U
S$
mill
ion
s)
: Total Treatment Costs ~US$ 440 million
: Total Treatment Costs ~US$ 251 million
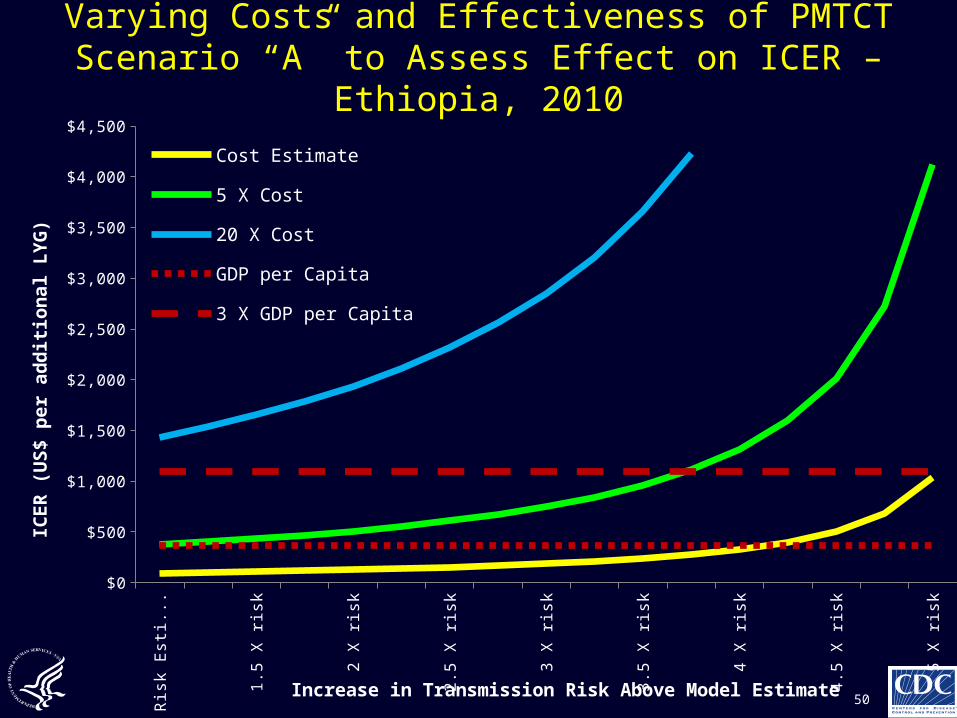
Varying Costs and Effectiveness of PMTCT Scenario “A” to Assess Effect on ICER – Ethiopia, 2010
50
Ris
k E
stim
ate
1.5
X r
isk
2 X
ris
k
2.5
X r
isk
3 X
ris
k
3.5
X r
isk
4 X
ris
k
4.5
X r
isk
5 X
ris
k
$0
$500
$1,000
$1,500
$2,000
$2,500
$3,000
$3,500
$4,000
$4,500
Cost Estimate
5 X Cost
20 X Cost
GDP per Capita
3 X GDP per Capita
Increase in Transmission Risk Above Model Estimate
ICE
R (
US
$ p
er
ad
dit
ion
al L
YG
)
Related Documents