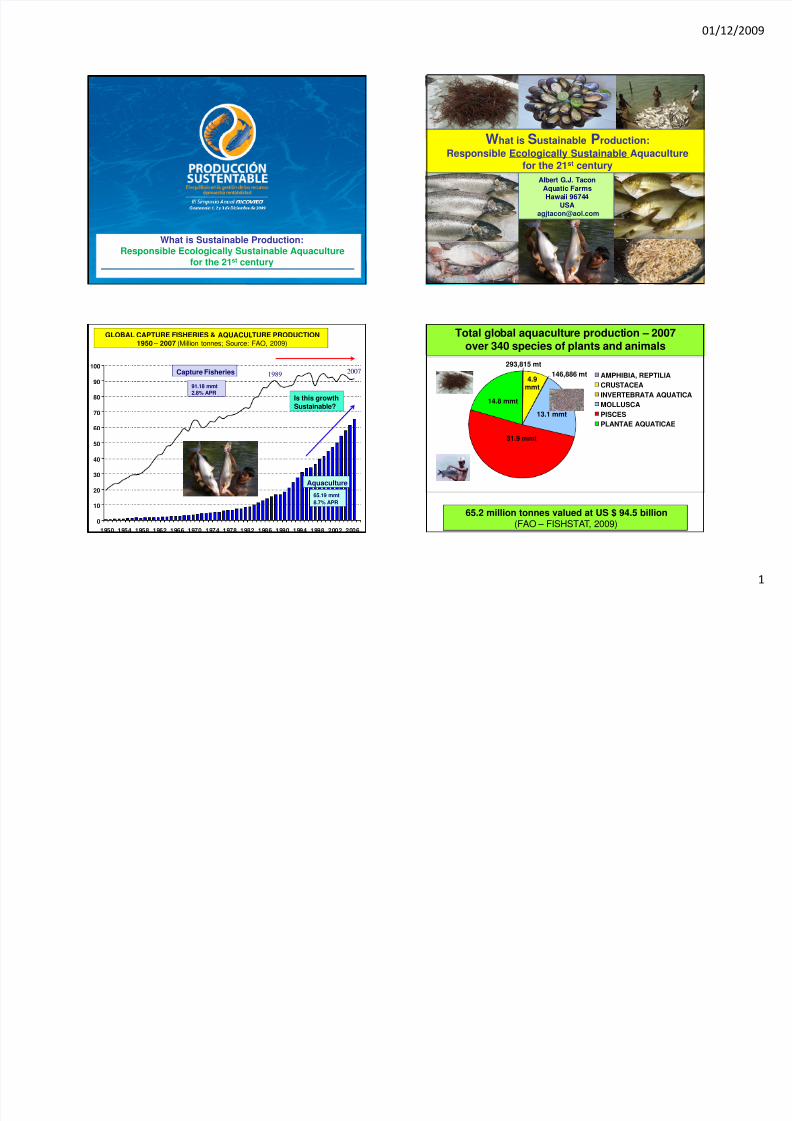
01/12/2009 1 What is Sustainable Production: Responsible Ecologically Sustainable Aquaculture for the 21 st century “ Albert G.J. Tacon Aquatic Farms Hawaii 96744 USA [email protected] . What is Sustainable Production: Responsible Ecologically Sustainable Aquaculture for the 21 st century 0 10 20 30 40 50 60 70 80 90 100 1950 1954 1958 1962 1966 1970 1974 1978 1982 1986 1990 1994 1998 2002 2006 91.18 mmt 2.8% APR 65.19 mmt 8.7% APR Capture Fisheries Aquaculture GLOBAL CAPTURE FISHERIES & AQUACULTURE PRODUCTION 1950 – 2007 (Million tonnes; Source: FAO, 2009) 1989 2007 Is this growth Sustainable? 293,815 mt 4.9 mmt 146,886 mt 13.1 mmt 31.9 mmt 14.8 mmt AMPHIBIA, REPTILIA CRUSTACEA INVERTEBRATA AQUATICA MOLLUSCA PISCES PLANTAE AQUATICAE Total global aquaculture product ion – 2007 over 340 species of plants and animals 65.2 million tonnes valued at US $ 94.5 billion (FAO – FISHSTA T , 2009)

Welcome message from author
This document is posted to help you gain knowledge. Please leave a comment to let me know what you think about it! Share it to your friends and learn new things together.
Transcript
7/30/2019 1 PDF Albert Tacon
http://slidepdf.com/reader/full/1-pdf-albert-tacon 1/24
01/12/2009
1
What is Sustainable Production:Responsible Ecologically Sustainable Aquaculture
for the 21st century
“
Albert G.J. TaconAquatic FarmsHawaii 96744
USA
What is Sustainable Production:
Responsible Ecologically Sustainable Aquaculturefor the 21st century
0
10
20
30
40
50
60
70
80
90
100
1950 1954 1958 1962 1966 1970 1974 1978 1982 1986 1990 1994 1998 2002 2006
91.18 mmt2.8% APR
65.19 mmt
8.7% APR
Capture Fisheries
Aquaculture
GLOBAL CAPTURE FISHERIES & AQUACULTURE PRODUCTION1950 – 2007 (Million tonnes; Source: FAO, 2009)
1989 2007
Is this growthSustainable?
293,815 mt
4.9mmt
146,886 mt
13.1 mmt
31.9 mmt
14.8 mmt
AMPHIBIA, REPTILIA
CRUSTACEA
INVERTEBRATA AQUATICA
MOLLUSCA
PISCES
PLANTAE AQUATICAE
Total global aquaculture production – 2007over 340 species of plants and animals
65.2 million tonnes valued at US $ 94.5 billion(FAO – FISHSTAT, 2009)

7/30/2019 1 PDF Albert Tacon
http://slidepdf.com/reader/full/1-pdf-albert-tacon 2/24
01/12/2009
2
4.9mmt
31.9 mmt
AMPHIBIA, REPTILIA
CRUSTACEA
INVERTEBRATA AQUATICA
MOLLUSCA
PISCES
PLANTAE AQUATICAE
Fed aquaculture species production – 2007(commercial feeds, farm made feeds, fresh feeds)
Total fish & crustaceans 36.82 mmtFed species – 28.99 mmt
Top fed fish & crustacean country producers – 2007(FAO – FISHSTAT, 2009)
Values in metric tonnes
China 15,100,058 (52.1%)
India 2,890,948 (10.0%)
Indonesia 1,365,284 (4.7%)
Viet N am 1,305,700 (4.5%)
Thailand 1,016,948 (3.5%)
Norway 827,707 (2.8%)
Philippines 669,093 (2.3%)
Chile 658,525 (2.3%)
Egypt 635,516 (2.2%)
Bangladesh 597,411 (2.1%)
USA 367,056
Japan 303,598
Brazil 266,188
Myanmar 262,163
Taiwan 228,384Ecuador 171,020
Mexico 150,325
UK 147,378
Turkey 138,921
Pakistan 130,092
Top 11-20 countries
Top 10 countries
Top fed aqua & livestock species – 2007(FAO – FAOSTAT, 2009)
Top fed aqua species - mmt
Grass carp 3.61Common carp 2.87White shrimp 2.30
Catla 2.27Tilapia niloticus 2.12Crucian carp 1.94Atlantic salmon 1.43Pangas catfish 0.93
60.7% global total – 17.5Fed F & C production – 29APR 10.59% since 1980
Top fed livestock sp - mmt
Pig 99.2Chicken 75.8Cattle 59.8
Sheep 8.3Turkey 5.9Goat 4.8Duck 3.6Buffalo 3.3
96.7% global totalTotal meat production - 269APR 2.54% since 1980
Total global production of fed fish & crustacean speciesFAO - AQUASTAT (2009)
Is this growthSustainable?
0
5,000,000
10,000,000
15,000,000
20,000,000
25,000,000
30,000,000
35,000,000
40,000,000
Freshwater fish - fed species Freshwater fish - fi lter feeding species
Marine crustaceans - fed species Diadromous fish - fed species
Marine fish - fed species Freshwater crustaceans - f ed species

7/30/2019 1 PDF Albert Tacon
http://slidepdf.com/reader/full/1-pdf-albert-tacon 3/24
01/12/2009
3
Reported global usage of fishmeal and fish oil by major user (values
give in %: Tacon & Metian, 2009)
0
2,000,000
4,000,000
6,000,000
8,000,000
10,000,000
12,000,000
14,000,000
16,000,000
18,000,000
20,000,000
Carps and Cyprinids TilapiaCatfishes Misc. freshwater fish species
Total global production of fed freshwater fish speciesFAO - AQUASTAT (2009)
Is this growthSustainable?
Reported global usage of fishmeal and fish oil by major user (values
give in %: Tacon & Metian, 2009)
0
500,000
1,000,000
1,500,000
2,000,000
2,500,000
3,000,000
3,500,000
Salmon Misc. diadromous fish species fed Trout Eels
Total global production of fed diadromous fish speciesFAO - AQUASTAT (2009)
Is this growthSustainable?
Reported global usage of fishmeal and fish oil by major user (values
give in %: Tacon & Metian, 2009)
0
200,000
400,000
600,000
800,000
1,000,000
1,200,000
1,400,000
1,600,000
1,800,000
2,000,000
Misc. marine f ish species fed SeabassMullets Porgies, seabreamsJacks, Crevalles Flounders, HalibutsCroakers, drums Cods, Hakes, HaddocksGroupers
Total global production of fed marine fish speciesFAO - AQUASTAT (2009)
Is this growthSustainable?
Reported global usage of fishmeal and fish oil by major user (values
give in %: Tacon & Metian, 2009)
0
1,000,000
2,000,000
3,000,000
4,000,000
5,000,000
6,000,000
Shrimp River prawn
Seawater crabs Lobsters
Freshwater crabs Crawfish, crayfish
Misc. other freshwater crustaceans
Total global production of fed crustacean speciesFAO - AQUASTAT (2009)
Is this growthSustainable?

7/30/2019 1 PDF Albert Tacon
http://slidepdf.com/reader/full/1-pdf-albert-tacon 4/24
01/12/2009
4
Total global aquaculture production by country grouping
0 2.5 5 Millions Tonnes
Developed countries
Developing countries
China
Developing countries without China
0
10,000,000
20,000,000
30,000,000
40,000,000
50,000,000
60,000,000
70,000,000Developing countries
China
Developing countries without China
Developed countries
Tonnes
Aquaticplants
Molluscs
2 ≤ Trophic level < 3
3 ≤ Trophic level < 4
4 ≤ Trophic level < 5
Global trends in aquaculture production expressed in weightedmean trophic level by country grouping & China in 2006
0
10
20
30
40
50
60
70
80
90
100
19 50 1 95 4 1 95 8 19 62 19 66 1 97 0 1 97 4 1 978 19 82 19 86 1 99 0 1 994 19 98 20 02 2 00 6
Capture Fisheries
Aquaculture
2013
Urgent need for the aquaculture sector to continue to grow in aResponsible & Ecologically Sustainable manner as recommended in
The FAO Code of Conduct for Responsible Fisheries
Código de Conducta para la Pesca Responsable (1995)http://www.fao.org/DOCREP/005/V9878S/V9878S00.HTM
Adopted 31 Oct 1995 by over 170 governments, includingall major aquaculture producing countries
Artículo 1 : Naturaleza y ámbito de aplicación del CódigoArtículo 2 : Objetivos del CódigoArtículo 3 : Relación con otros instrumentos internacionalesArtículo 4 : Aplicación seguimiento y actualización
Artículo 5 : Requerim. especiales de los países en desarrolloArtículo 6 : Principios generalesArtículo 7 : Ordenación pesqueraArtículo 8 : Operaciones pesqueras
Artículo 9 : Desarrollo de la acuicultura(22 guiding principles)
Artículo 10: Integ. pesca en la ordenación de la zona costeraArtículo 11: Prácticas postcaptura y comercioArtículo 12: Investigación pesquera
7/30/2019 1 PDF Albert Tacon
http://slidepdf.com/reader/full/1-pdf-albert-tacon 5/24
01/12/2009
5
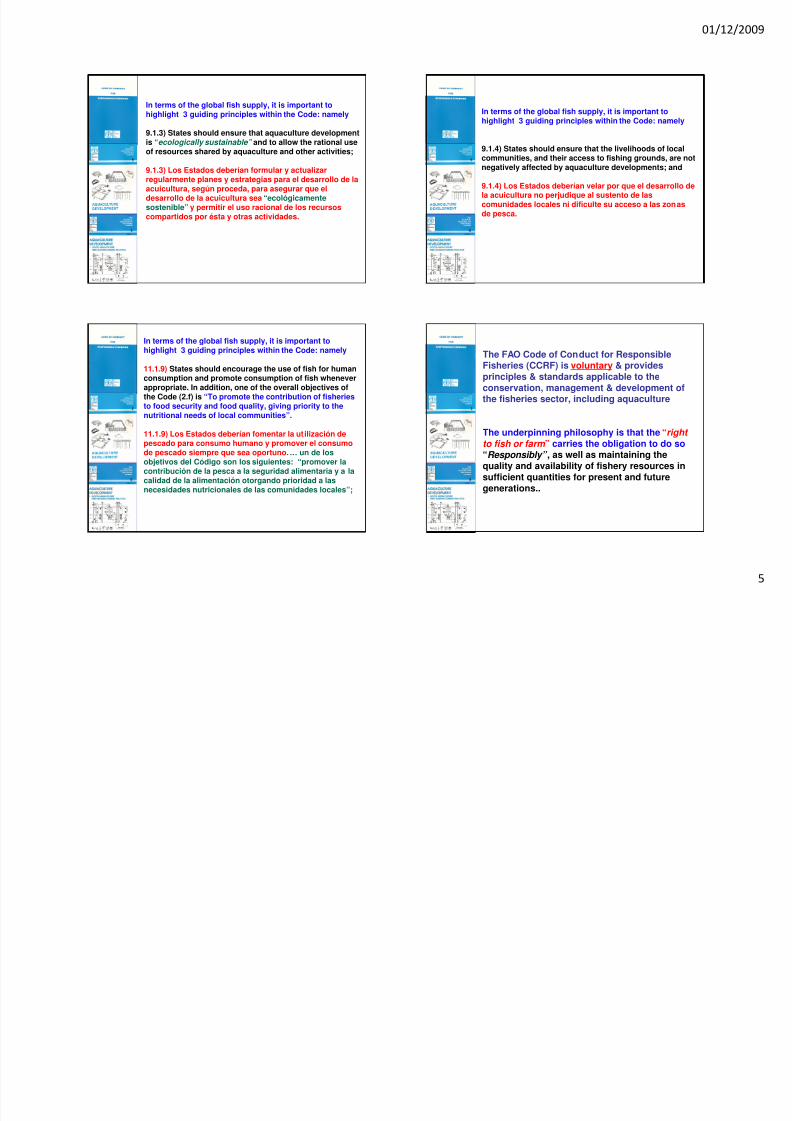
In terms of the global fish supply, it is important tohighlight 3 guiding principles within the Code: namely
9.1.3) States should ensure that aquaculture developmentis “ecologically sustainable” and to allow the rational useof resources shared by aquaculture and other activities;
9.1.3) Los Estados deberían formular y actualizarregularmente planes y estrategias para el desarrollo de laacuicultura, según proceda, para asegurar que eldesarrollo de la acuicultura sea “ecológicamentesostenible” y permitir el uso racional de los recursos
compartidos por ésta y otras actividades.
In terms of the global fish supply, it is important tohighlight 3 guiding principles within the Code: namely
9.1.4) States should ensure that the livelihoods of localcommunities, and their access to fishing grounds, are notnegatively affected by aquaculture developments; and
9.1.4) Los Estados deberían velar por que el desarrollo dela acuicultura no perjudique al sustento de lascomunidades locales ni dificulte su acceso a las zonas
de pesca.
In terms of the global fish supply, it is important tohighlight 3 guiding principles within the Code: namely
11.1.9) States should encourage the use of fish for humanconsumption and promote consumption of fish wheneverappropriate. In addition, one of the overall objectives ofthe Code (2.f) is “To promote the contribution of fisheriesto food security and food quality, giving priority to thenutritional needs of local communities”.
11.1.9) Los Estados deberían fomentar la utilización depescado para consumo humano y promover el consumode pescado siempre que sea oportuno. … un de losobjetivos del Código son los siguientes: “promover lacontribución de la pesca a la seguridad alimentaria y a lacalidad de la alimentación otorgando prioridad a lasnecesidades nutricionales de las comunidades locales”;
The FAO Code of Conduct for ResponsibleFisheries (CCRF) is voluntary & providesprinciples & standards applicable to theconservation, management & development ofthe fisheries sector, including aquaculture
The underpinning philosophy is that the “right
to fish or farm ” carries the obligation to do so“Responsibly” , as well as maintaining thequality and availability of fishery resources insufficient quantities for present and futuregenerations..
7/30/2019 1 PDF Albert Tacon
http://slidepdf.com/reader/full/1-pdf-albert-tacon 6/24
01/12/2009
6
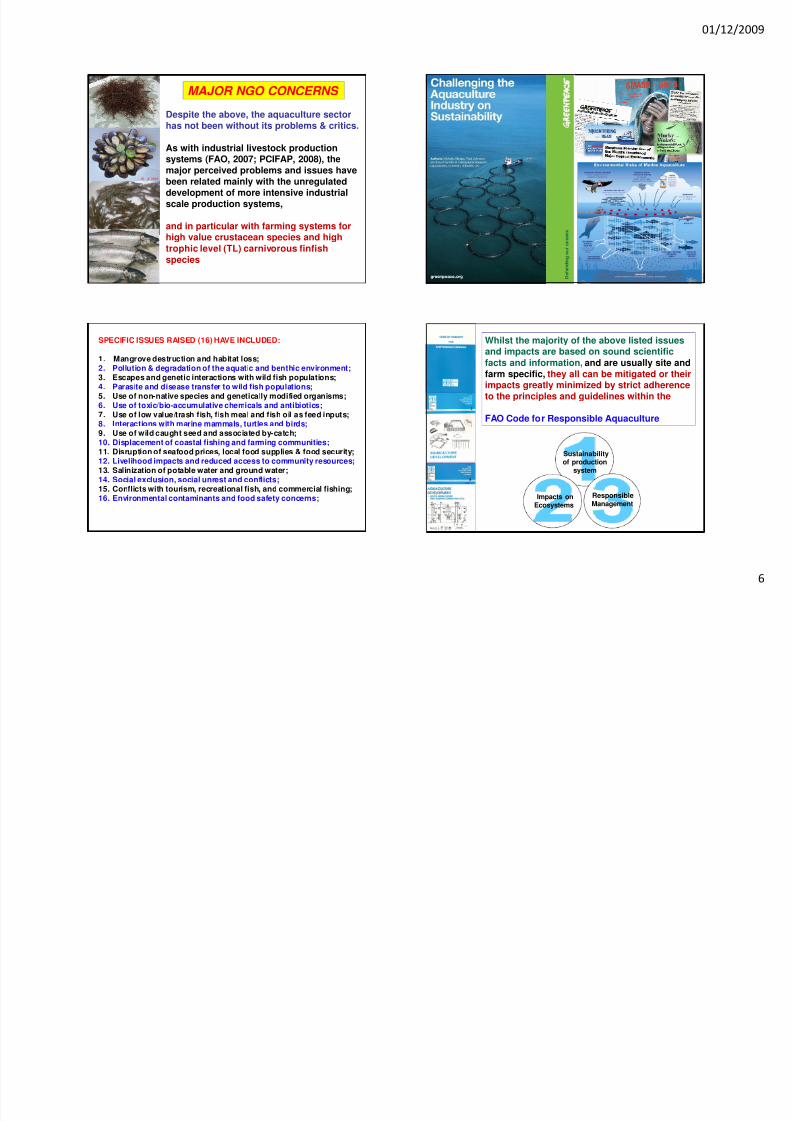
Despite the above, the aquaculture sectorhas not been without its problems & critics.
As with industrial livestock productionsystems (FAO, 2007; PCIFAP, 2008), themajor perceived problems and issues havebeen related mainly with the unregulateddevelopment of more intensive industrialscale production systems,
and in particular with farming systems forhigh value crustacean species and hightrophic level (TL) carnivorous finfishspecies
MAJOR NGO CONCERNS
AT-RESA-16
SPECIFIC ISSUES RAISED (16) HAVE INCLUDED:
1. Mangrove destruction and habitat loss;2. Pollution & degradation of the aquatic and benthic environment;3. Escapes and genetic interactions with wild fish populations;4. Parasite and disease transfer to wild fish populations;5. Use of non-native species and genetically modified organisms;6. Use of toxic/bio-accumulative chemicals and antibiotics;7. Use of low value/trash fish, fish meal and fish oil as feed inputs;
8. Interactions with marine mammals, turtles and birds;9. Use of wild caught seed and associated by-catch;10. Displacement of coastal fishing and farming communities;11. Disruption of seafood prices, local food supplies & food security;12. Livelihood impacts and reduced access to community resources;13. Salinization of potable water and ground water;14. Social exclusion, social unrest and conflicts;15. Conflicts with tourism, recreational fish, and commercial fishing;16. Environmental contaminants and food safety concerns;
Whilst the majority of the above listed issuesand impacts are based on sound scientificfacts and information, and are usually site andfarm specific, they all can be mitigated or theirimpacts greatly minimized by strict adherenceto the principles and guidelines within the
FAO Code for Responsible Aquaculture
Impacts onEcosystems
Sustainabilityof production
system
ResponsibleManagement

7/30/2019 1 PDF Albert Tacon
http://slidepdf.com/reader/full/1-pdf-albert-tacon 7/24
01/12/2009
7
Toward this end, considerable effort has also
recently been focused on the development ofBest Management Practices (BMPs) andaquaculture certification programs so as toshow adherence to the Code and/or to moreenvironmentally responsible or sustainablefarming practices;
Whilst this is certainly a step in the rightdirection, these BMPs and certification
schemes have usually focused only at theproduction level (Article 9.4 of the Code: FAO,1995), and as such have usually ignored thewider ecosystem, social, and food securityissues mentioned within the Code;
Impacts onEcosystems
ResponsibleManagement
Sustainabilityof production
system
In fact, it is increasingly recognizedthat in the fishery sector, as in agri-business, Long-term EconomicViability & Environmental andEcological sustainability go hand inhand.
FOOD SECURITY issues
Last but not least, we must not
forget the resource poor consumer
- 1.4 billion people in thedeveloping world (one in four) stillliving below the poverty line ofUS$1.25 a day
Malnutrition and need to ensure that the food supply of the poor are not
negatively impacted through feed use and feed management practices7
UN PAÍS DESNUTRIDO FLOTANDO
EN UN MAR DE PROTEÍNAS
PROGRAMA
“ALIMENTACIÓN DESDE EL MAR”
7/30/2019 1 PDF Albert Tacon
http://slidepdf.com/reader/full/1-pdf-albert-tacon 8/24
01/12/2009
8
SPECIFIC ISSUES RAISED (16) HAVE INCLUDED:
1. Mangrove destruction and habitat loss;2. Pollution & degradation of the aquatic and benthic environment;3. Escapes and genetic interactions with wild fish populations;4. Parasite and disease transfer to wild fish populations;5. Use of non-native species and genetically modified organisms;6. Use of toxic/bio-accumulative chemicals and antibiotics;7. Use of low value/trash fish, fish meal and fish oil as feed inputs;8. Interactions with marine mammals, turtles and birds;9. Use of wild caught seed and associated by-catch;10. Displacement of coastal fishing and farming communities;11. Disruption of seafood prices, local food supplies & food security;
12. Livelihood impacts and reduced access to community resources;13. Salinization of potable water and ground water;14. Social exclusion, social unrest and conflicts;15. Conflicts with tourism, recreational fish, and commercial fishing;16. Environmental contaminants and food safety concerns;
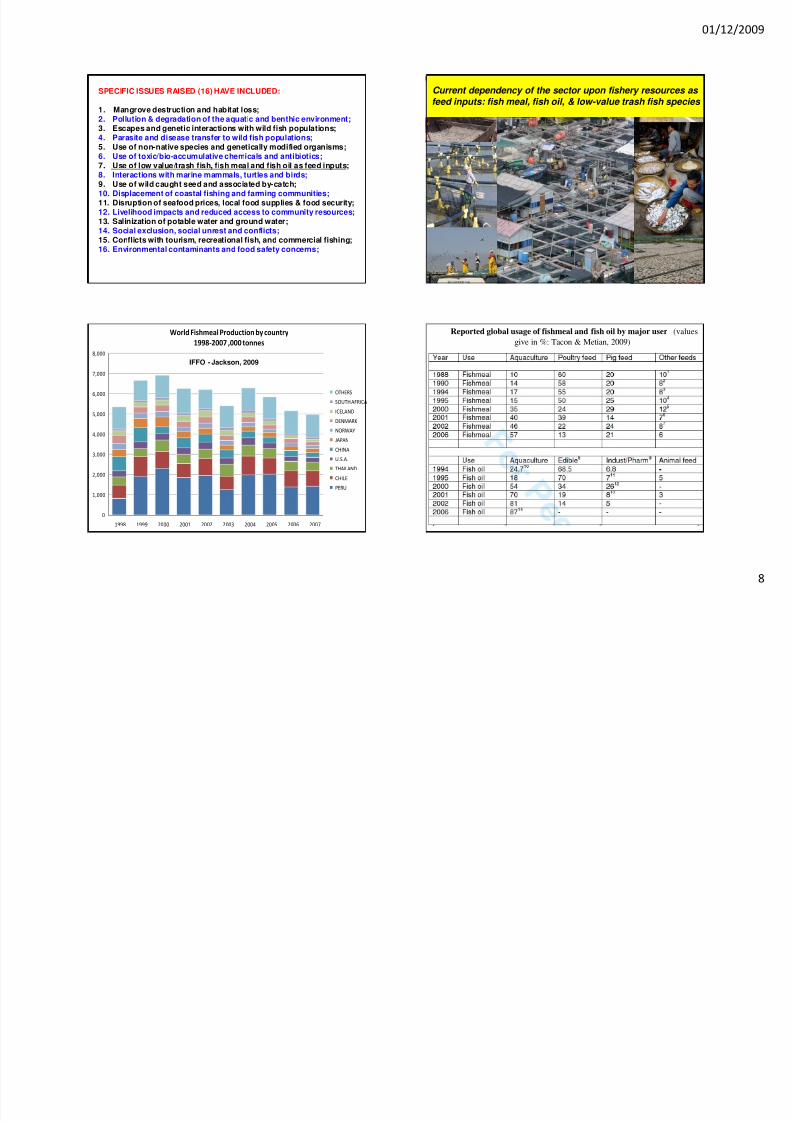
Current dependency of the sector upon fishery resources as
feed inputs: fish meal, fish oil, & low-value trash fish species
0
1,000
2,000
3,000
4,000
5,000
6,000
7,000
8,000
1998 1999 2000 2001 2002 2003 2004 2005 2006 2007
World Fishmeal Production by country
1998-2007 ,000 tonnes
OTHERS
SOUTH AFRICA
ICELAND
DENMARK
NORWAY
JAPAN
CHINA
U.S.A.
THAILAND
CHILE
PERU
IFFO - Jackson, 2009
Reported global usage of fishmeal and fish oil by major user (values
give in %: Tacon & Metian, 2009)
7/30/2019 1 PDF Albert Tacon
http://slidepdf.com/reader/full/1-pdf-albert-tacon 9/24
01/12/2009
9
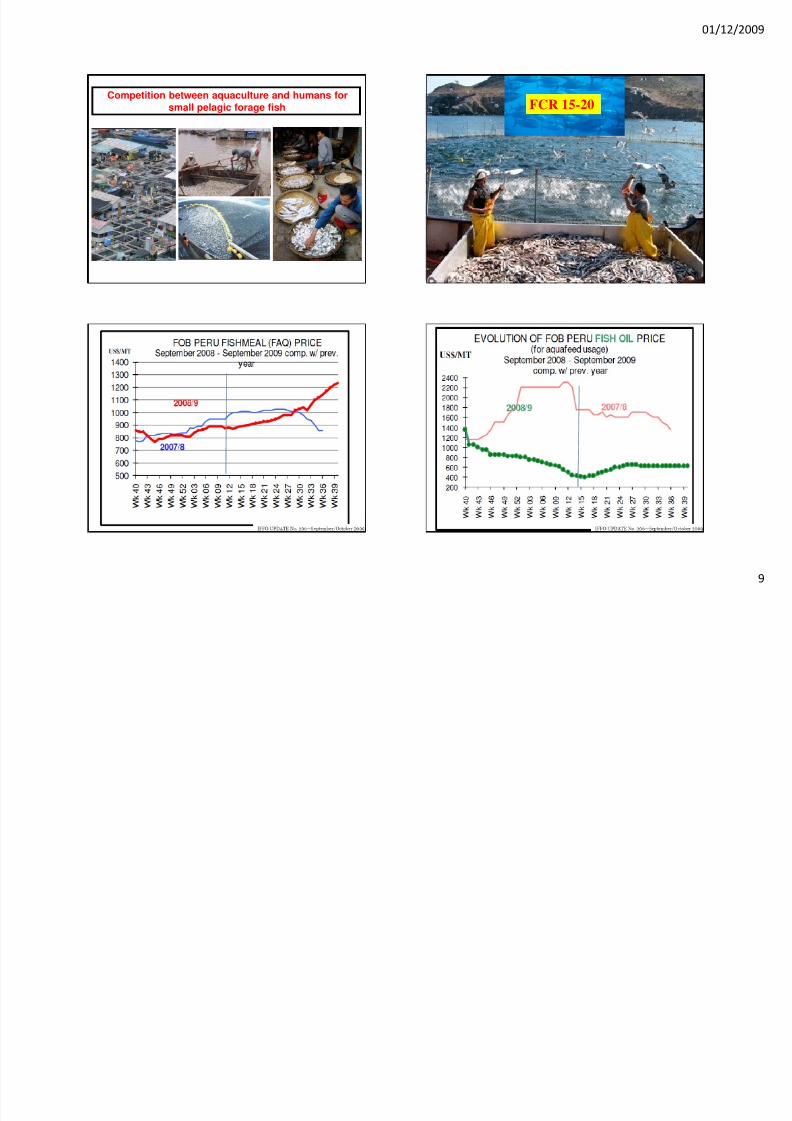
Competition between aquaculture and humans for
small pelagic forage fish FCR 15-20
7/30/2019 1 PDF Albert Tacon
http://slidepdf.com/reader/full/1-pdf-albert-tacon 10/24
01/12/2009
10
7/30/2019 1 PDF Albert Tacon
http://slidepdf.com/reader/full/1-pdf-albert-tacon 11/24
01/12/2009
11
7/30/2019 1 PDF Albert Tacon
http://slidepdf.com/reader/full/1-pdf-albert-tacon 12/24
01/12/2009
12
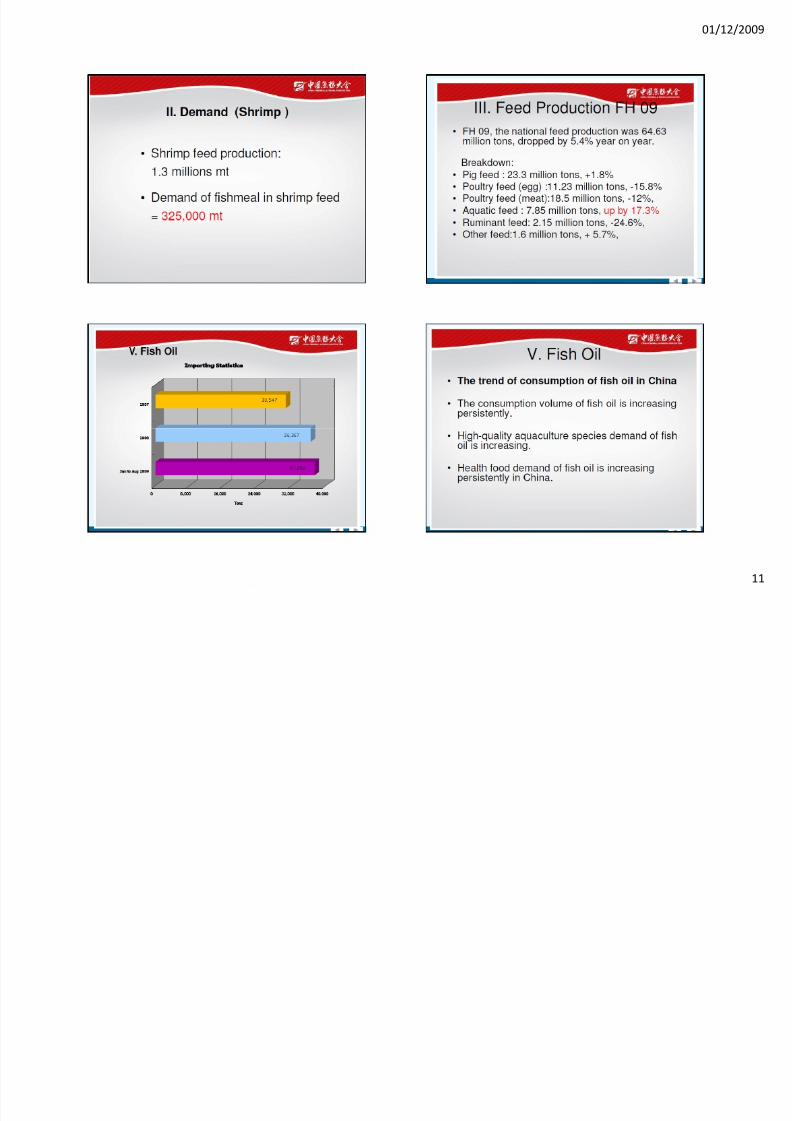
Monthly Fishmeal consumption ChinaUp to Date
0
30000
60000
90000
120000
150000
JANFEBMARAPRMAYJUNJULAUGSEP OCTNOVDI C
M T
2006 2007 2008 2009
Crystal Ocean – Prime Brokers – Weekly Report 46
Seafood/fishery byproducts: meals & oils from seafood/aquacultureprocessing waste/bycatch, including seaweeds, krill, squid etc
Sources of dietary protein, lipids & other essential nutrients
Farmed aquatic animals do not have a specific requirement for a specificingredient (such as fishmeal or fish oil) but require ca. 40 essential nutrients
Animal/rendered products: meat meal, meat & bone meal, feathermeal, poultry by-product meal, blood meal, fats & tallows
Flour/milling products: flour, middlings, mill run, bran, gluten
Brewing/fermentation products: extracted dried yeast, brewers
grains, distillers solubles, SCP, glucans, nucleotides, carotenoids
Plant oilseeds/pulses: oilseed meals, oils, protein concentrates
Agricultural wastes/products: fruit, pulp, leaves, tubers, roots,
kitchen scraps, starches, binders
Others: invertebrates – terrestrial & marine worms
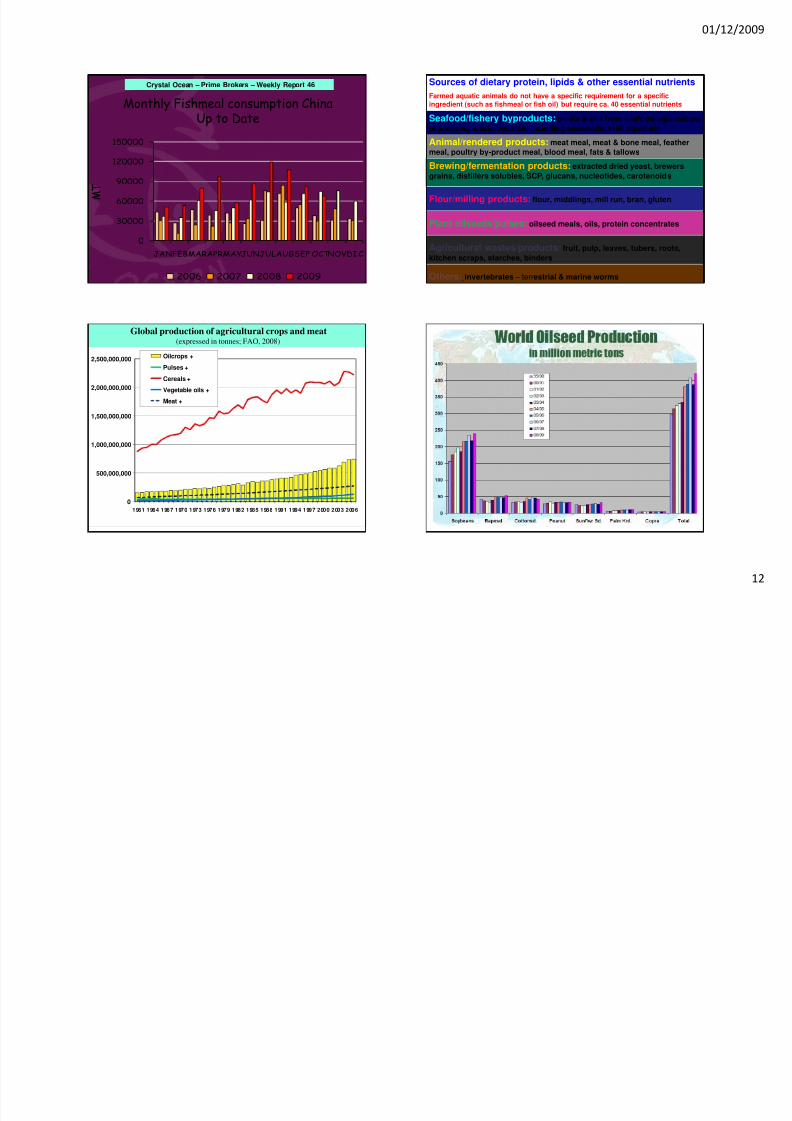
0
500,000,000
1,000,000,000
1,500,000,000
2,000,000,000
2,500,000,000
1961 1964 1967 1970 1973 1976 1979 1982 1985 1988 1991 1994 1997 2000 2003 2006
Oilcrops +
Pulses +
Cereals +
Vegetable oils +
Meat +
Global production of agricultural crops and meat(expressed in tonnes; FAO, 2008)

7/30/2019 1 PDF Albert Tacon
http://slidepdf.com/reader/full/1-pdf-albert-tacon 13/24
01/12/2009
13
Terrestrial animal by-product meals represent the largest source of
animal protein & lipid available to the aquafeed industry
For example, in 2008 the U.S. alone slaughtered:
34.4 million cattle (50% not used for human food),116.5 million hogs (42% not used for human food),9.1 billion chickens (37% not used for human food),271 million turkeys (36% not used for human food)
U.S. generated:8.7 million tonnes ofrendered products in
2008 (4.1PM/4.6FG)97% consumed in USA
Globally: 20-25 mmt ofrendered products
TERRESTRIAL LIVESTOCK PROTEINS & FATSTurning this:
Into this:
7/30/2019 1 PDF Albert Tacon
http://slidepdf.com/reader/full/1-pdf-albert-tacon 14/24
01/12/2009
14
Importance of feed companies & producers to keep
ahead of the competition and spend and invest moreresources into applied research & development
activities – if you don’t your competitors will
- Competition will get better & stronger- Feed ingredient & feed prices will increase
- Shrimp prices will fall as production increases
Bottom line
- Need to reduce farm production costs for farmerto stay in business – if the farmer fails we fail
- Feeds and feeding costs still represent the largestoperating cost item for farmers:
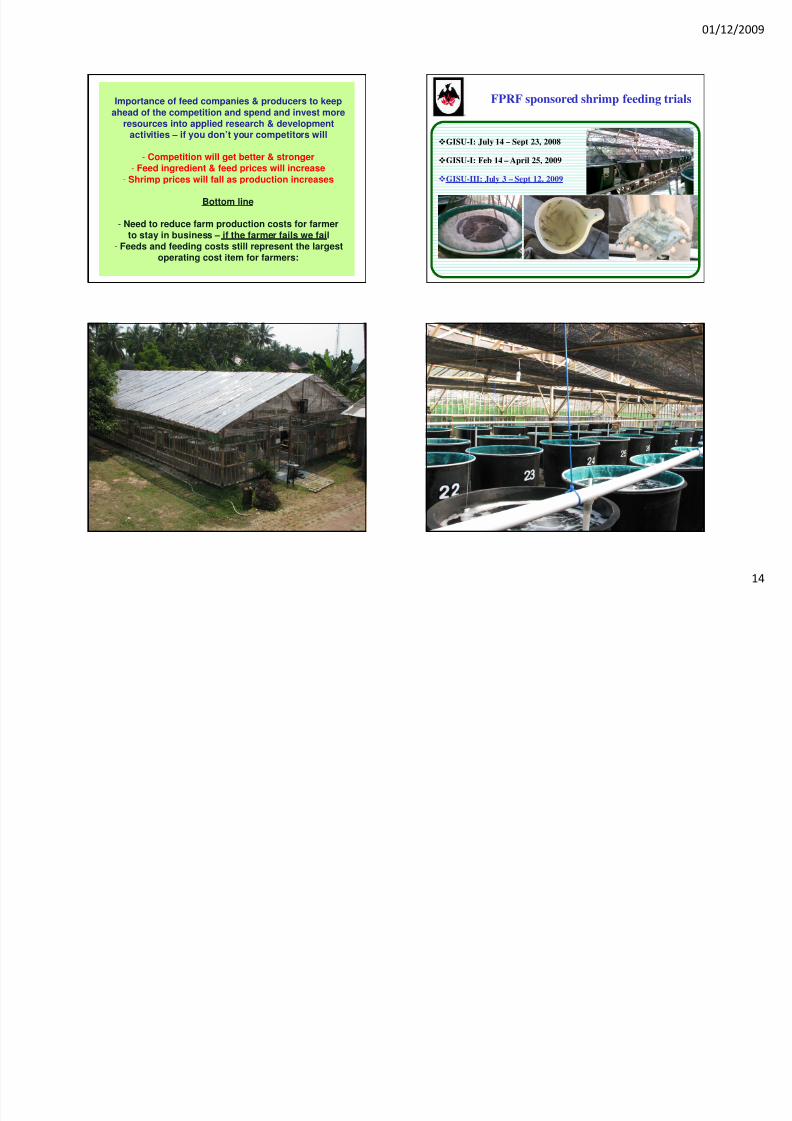
FPRF sponsored shrimp feeding trials
GISU-I: July 14 – Sept 23, 2008
GISU-I: Feb 14 – April 25, 2009
GISU-III: July 3 – Sept 12, 2009
7/30/2019 1 PDF Albert Tacon
http://slidepdf.com/reader/full/1-pdf-albert-tacon 15/24
01/12/2009
15
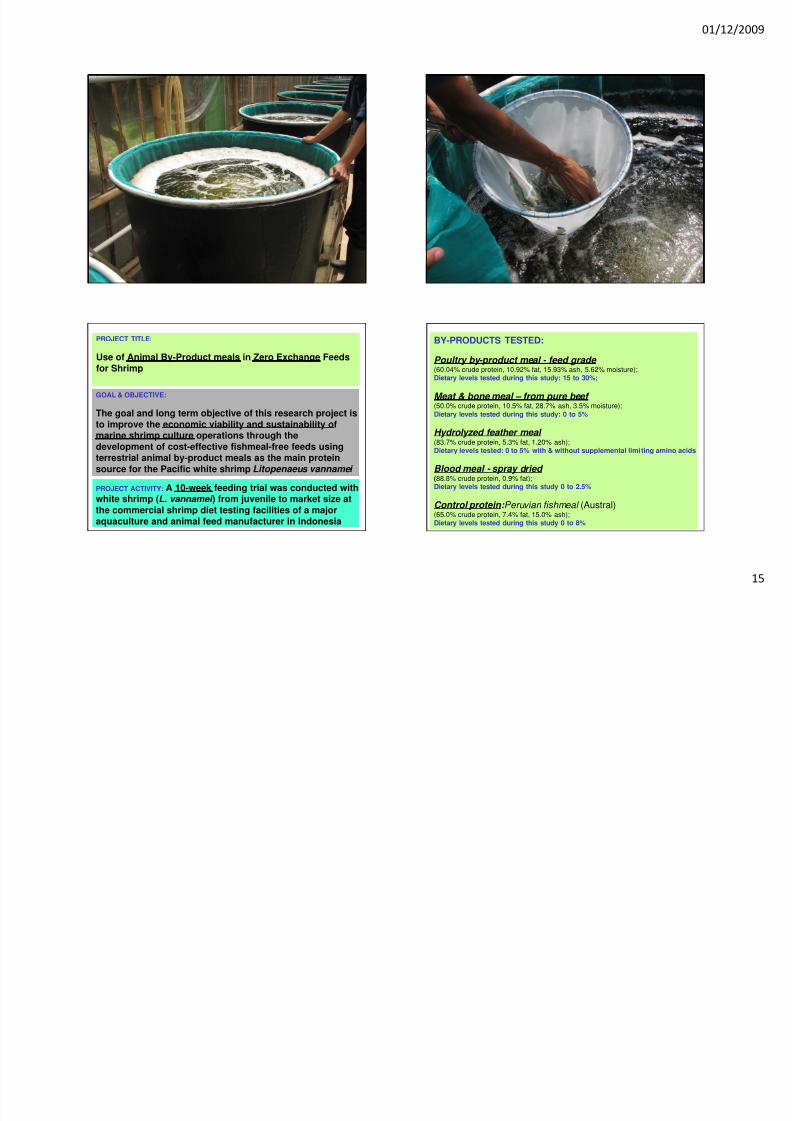
PROJECT TITLE:
Use of Animal By-Product meals in Zero Exchange Feedsfor Shrimp
GOAL & OBJECTIVE:
The goal and long term objective of this research project isto improve the economic viability and sustainability ofmarine shrimp culture operations through thedevelopment of cost-effective fishmeal-free feeds usingterrestrial animal by-product meals as the main proteinsource for the Pacific white shrimp Litopenaeus vannamei
PROJECT ACTIVITY: A 10-week feeding trial was conducted withwhite shrimp (L. vannamei ) from juvenile to market size atthe commercial shrimp diet testing facilities of a majoraquaculture and animal feed manufacturer in Indonesia
BY-PRODUCTS TESTED:
Poultry by-product meal - feed grade (60.04% crude protein, 10.92% fat, 15.93% ash, 5.62% moisture);Dietary levels tested during this study: 15 to 30%;
Meat & bone meal – from pure beef (50.0% crude protein, 10.5% fat, 28.7% ash, 3.5% moisture);
Dietary levels tested during this study: 0 to 5%
Hydrolyzed feather meal (83.7% crude protein, 5.3% fat, 1.20% ash);Dietary levels tested: 0 to 5% with & without supplemental limiting amino acids
Blood meal - spray dried (88.8% crude protein, 0.9% fat);Dietary levels tested during this study 0 to 2.5%
Control protein: Peruvian fishmeal (Austral)(65.0% crude protein, 7.4% fat, 15.0% ash);Dietary levels tested during this study 0 to 8%

7/30/2019 1 PDF Albert Tacon
http://slidepdf.com/reader/full/1-pdf-albert-tacon 16/24
01/12/2009
16
EXPERIMENTAL DIETS & FORMULATIONS
-13 diets were formulated, a control diet containing 8% fishmeal and 2% squid
meal, and 12 diets containing various levels of fishmeal and marineprotein/lipid replacement.- All diets were formulated to contain 33-35% crude protein, 5.5-6.5% lipid, 1.8-t2.0% lysine, 0.75- 0.81% methionine, and a min of 0.8% estimated available P
FEED MANUFACTURE
All 13 experimental diets were produced in Jakarta (Indonesia) using acommercial shrimp feed mill (IDAH 53SA with triple conditioners), with1,600 kg of each diet produced and observations taken during the productionprocess so as to ascertain the effect of ingredient use on energy usage, easeof production, physical characteristics, water stability and handling (if any).
SHRIMP & EXPERIMENTAL CULTURE CONDITIONS
Juvenile shrimp, of the same strain and size, were obtained from a localshrimp hatchery and stocked within 48 round black-coated fiberglassmicrocosm tanks (1m3 water volume, with a conical bottom) at an initialstocking density of 75 shrimp tank-1 (equivalent to a shrimp density of 75 m-3
water volume), with 3 tanks allotted per dietary treatment.
1 2 3 4 5 6 7 8 9 10 11 12 13
8221
15---
16
-
.25
.16+0.3
.65
-221
23---
16
-
.25
.16+0.3
.63
--21
20---
25
-
.22-+0.3
.60
--21
25---
20
-
.19-+0.3
.61
--21
30---
9
-
.16-+0.3
.62
--21
205--
20
-
.22-+0.3
.61
--21
20--5
14
-
.25
.22+0.3
.61
--21
20--5
15
-
--+0.3
.59
--21
20-2.5-
20
-
.22-+0.3
.61
----
30-1-
10
1
.22-+0.3
.60
----
20101.52.5
10
1
.25--0.3
.60
----
30-1-
10
1
.22--0.3
.60
----
30-1-
10
1
.22---
.59
EXPERIMENTAL DIETS
FishmealSquid mealKrill mealFish oil
Poultry b-mealM & B mealBlood mealFeather meal
Soybean meal
Palm oil
MHALysineDCPVits/mins
Price (US $/kg)
WATER QUALITY:
Water quality within the experimental tanks as determined at 8.00 am and 4.00pm over the course of the 10-week experiment varied as follows:
Zero-exchange tanks (treatments 1 to 13) 8am 4pm
Water temperature: 29.2 oC 31.6 oCOxygen: 5.90 mg/l 5.64 mg/lSalinity: 32 to 36 ppt (mean 34 ppt)
pH: 7.2 to 8.2 (mean 7.7)Alkalinity: 87 to 144 mg/l as CaCO3 (mean 116 mg/l)TAN 0 to 1 mg/l (mean 0.20 mg/l)Suspended solids (floc) 1.50 to 4.83 ml (mean 3.45 ml)
Running water tank (treatment 14)
Water temperature: 27.6oC 29.2oCOxygen: 6.32 mg/l 5.96 mg/lSalinity: 30 to 35 ppt (mean 33 ppt)pH: 7.4 to 8.2 (mean 7.9)Alkalinity: 81 to 140 mg/l as CaCO3 (mean 114 mg/l)
0.00
2.00
4.00
6.00
8.00
10.00
12.00
14.00
16.00
18.00
20.00
0 1 2 3 4 5 6 7 8 9 10
m e a n b o d y w e i g h t ( g r )
week
GISU 1
GISU 2
GISU 3
GISU 4
GISU 5
GISU 6
GISU 7
GISU 8
GISU 9
GISU 10
GISU 11
GISU 12
GISU 13
GISU 14
Growth Response of Shrimp Fed with The Experimental Diets

7/30/2019 1 PDF Albert Tacon
http://slidepdf.com/reader/full/1-pdf-albert-tacon 17/24
01/12/2009
17
0.0
0.5
1.0
1.5
2.0
2.5
GISU GISU GISU GISU GISU GISU GISU GISU GISU GISU GISU GISU GISU GISU
1 2 3 4 5 6 7 8 9 10 11 12 13 14
W
e e k l y g r o w t h ( g r / w e e k )
Week 0-2
Week 3-4
Week 5-6
Week 7-8
Week 9-10
84.8980.44
77.78
88.44
80.8983.55
80.44
85.33 86.6783.11 81.78
68.89
81.78 83.11
0.00
20.00
40.00
60.00
80.00
100.00
GISU GISU GISU GISU GISU GISU GISU GISU GISU GISU GISU GISU GISU GISU
1 2 3 4 5 6 7 8 9 10 11 12 13 14
Survival …
GISU - III – LV, 75/m3, 10 weeks
•PBM 15 + FM + SM
•PBM 23 – FM + SM
•PBM 20 – FM –SM
•PBM 25 –
•PBM 30 –
•MBM 5 –•HFM 5+AA –
•HFM 5-AA –
•BM 2.5 –
•Nomar+PBM+BM –
•Nomar+MBM+BM –
•Nomar+PBM+BM-P –
•Nomar+PBM+BM-P/X
•PBM 23 – FM (RW)
IBW FBW FCR ADG AWG Sur (%)
2.75b 18.93f 1.67a 0.22g 1.57e 84.9b
2.70b 18.06ef 1.87ab 0.21efg 1.49de 80.4b
2.70b 17.80ef 1.90ab 0.21efg 1.47de 77.8a
2.65b 17.68ef 1.67a 0.21efg 1.46de 88.4b
2.49b 17.33de 1.87ab 0.21defg 1.44de 80.9b
2.68b
15.97bcd 1.95ab
0.19bdc
1.20bc
81.8b
2.61b 17.78ef 1.88ab 0.21defg 1.48de 80.4b
2.83b 16.78cde 1.85ab 0.19cde 1.36cd 85.3b
2.50b 17.90ef 1.65a 0.22fg 1.50de 86.7b
2.65b 16.73cde 1.85ab 0.20cdef 1.37cd 83.1b
2.72b 15.59bc 2.20bc 0.18bc 1.25bc 81.8b
2.70b 14.87b 2.52bc 0.17b 1.18b 68.9a
2.73b 15.58bc 1.99ab 0.18bc 1.25bc 81.8b
1.98a 11.16a 2.41bc 0.13a 0.89a 83.1b
ECONMIC PERFORMANCE
The most expensive diet in terms of raw material cost was the control FM diet(GISU 1; 6128 Rp/kg), with the best equally performing diets being7.9% cheaper (GISU 3; 5644 Rp/kg), 6.5% cheaper (GISU 9; 5728 Rp/kg),5.7% cheaper (GISU 4; 5779 Rp/kg), 5.2% cheaper (GISU 7; 5810 Rp/kg) and3.1% cheaper (GISU 2; 5936 Rp/kg).
Feed grade poultry byproduct meal: up to a dietary inclusion level of between20 and 25% of the total diet (GISU 3 & 4), with supplemental methionine, andincreasing dietary soybean levels from 16% to between 20 and 25%, withingredient cost savings of between 5.7 and 7.9% compared with respect to asimilar diet containing 8% fishmeal and 2% squid meal.
CONCLUSIONS The results clearly show the nutritional and economic efficacyof totally replacing fishmeal and squid meal within commercial shrimp feedsby using:
Spray dried blood meal: up to a dietary inclusion level of 2.5% of the total diet(GISU 9), with supplemental methionne, and increasing dietary soybean levelsfrom 16% to 20%, with ingredient cost savings of 6.5% compared with respectto a similar diet containing 8% fishmeal and 2% squid meal.
/ /

7/30/2019 1 PDF Albert Tacon
http://slidepdf.com/reader/full/1-pdf-albert-tacon 18/24
01/12/2009
18
Hydrolyzed feather meal: up to a dietary inclusion level of 5% (GISU 7) of thetotal diet, with supplemental lysine and methionine, and decreasing dietarysoybean levels from 16% to 14%, with ingredient cost savings of 5.2%compared with respect to a similar diet containing 8% fishmeal and 2% squidmeal. Surprisingly, shrimp fed the same diet with no supplemental amino acids(GISU 8) showed no significant differences in final body weight or feedefficiency with animal fed the supplemented diet, with consequent ingredientcost savings of 8.4% compared with a diet containing 8% fishmeal and 2%squid meal.
Meat & bone meal from pure beef: results with 5% meat and bone meal (GISU
6) were disappointing, with shrimp displaying significantly lower final bodyweight (P<0.05) poorer FCRs compared with the other treatments.
01/12/2009
7/30/2019 1 PDF Albert Tacon
http://slidepdf.com/reader/full/1-pdf-albert-tacon 19/24
01/12/2009
19
01/12/2009

7/30/2019 1 PDF Albert Tacon
http://slidepdf.com/reader/full/1-pdf-albert-tacon 20/24
01/12/2009
20
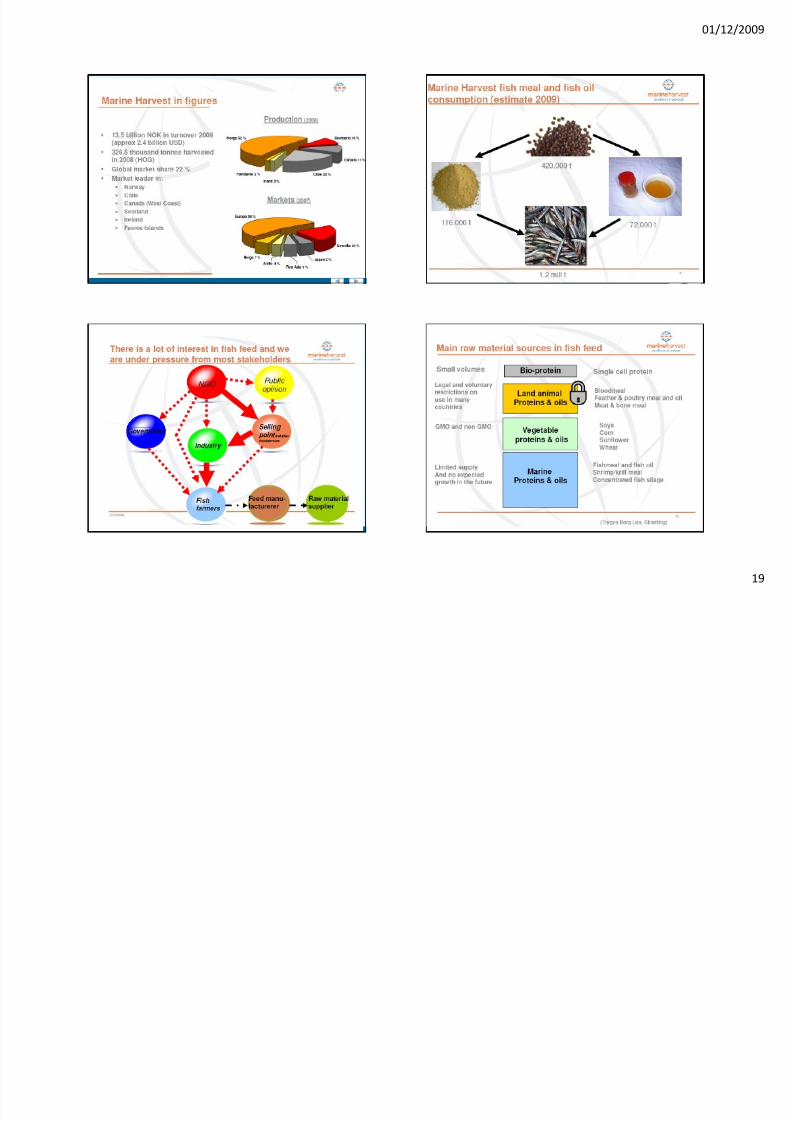
Demand and supply of feed ingredientsfor farmed fish and crustaceans:
trends and prospects
1. Review of the dietary feeding practices employed for theproduction of the major cultivated fish and crustacean species,including major feed ingredients used;2. Review of the total production and market availability of themajor feed ingredient sources, including current usage by sector;3. Review of the major constraints to feed ingredient availabilityand use by the aquaculture sector on a regional and global basis;4. Provide recommended approaches to feed ingredient selectionand usage within dietary feeding regimes for the major cultivatedfish and crustacean species.
01/12/2009
7/30/2019 1 PDF Albert Tacon
http://slidepdf.com/reader/full/1-pdf-albert-tacon 21/24
01/12/2009
21
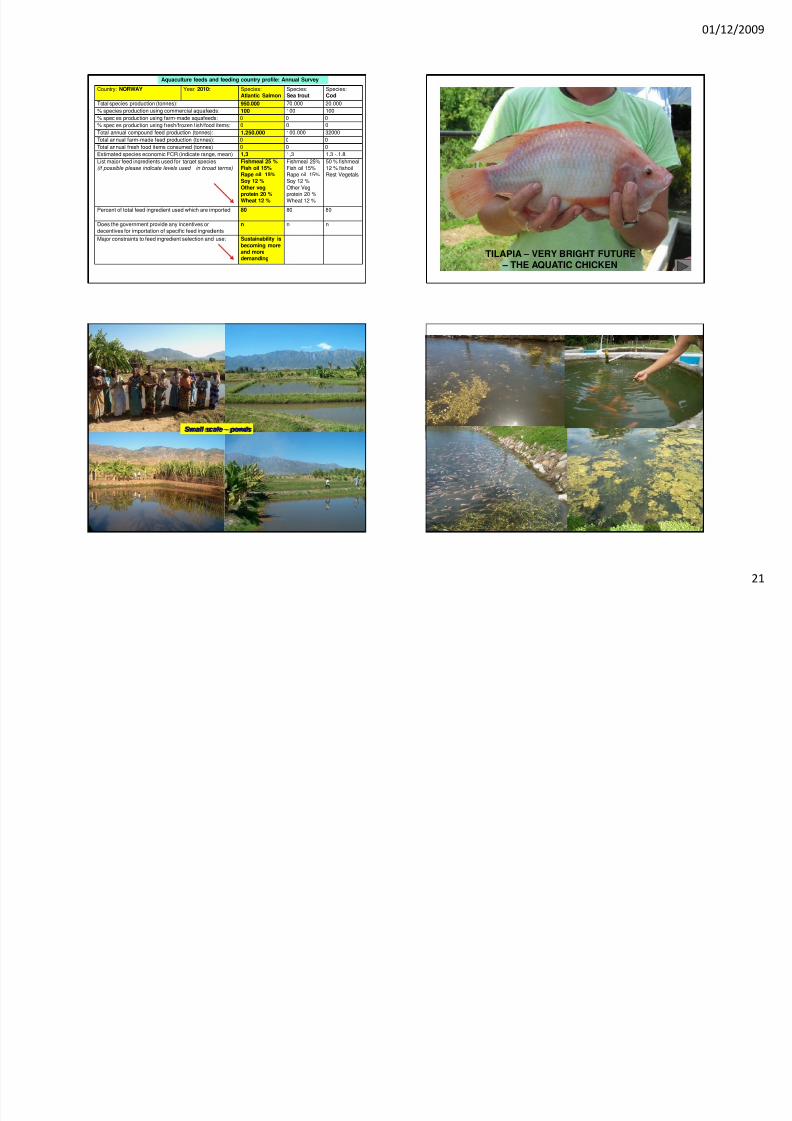
Country: NORWAY Year: 2010: Species:Atlantic Salmon
Species:Sea trout
Species:Cod
Total species production (tonnes): 950.000 70.000 20.000
% species production using commercial aquafeeds: 100 100 100% species production using farm-made aquafeeds: 0 0 0
% species production using fresh/frozen fish/food items: 0 0 0
Total annual compound feed production (tonnes): 1,250,000 100.000 32000
Total annual farm-made feed production (tonnes): 0 0 0
Total annual fresh food items consumed (tonnes) 0 0 0
Estimated species economic FCR (indicate range, mean) 1,3 1,3 1.3 -.1.8
List major feed ingredients used for target species(if possible please indicate levels used – in broad terms)
Fishmeal 25 %Fish oil 15%Rape oil 15%Soy 12 %Other vegprotein 20 %Wheat 12 %
Fishmeal 25%
Fish oil 15%Rape oil 15%Soy 12 %
Other Vegprotein 20 %Wheat 12 %
50 % fishmeal
12 % fishoilRest Vegetals
Percent of total feed ingredient used which are imported 80 80 80
Does the government provide any incentives or
decentives for importation of specific feed ingredients
n n n
Major constraints to feed ingredient selection and use: Sustainability isbecoming moreand moredemanding
Aquaculture feeds and feeding country profile: Annual Survey
TILAPIA – VERY BRIGHT FUTURE – THE AQUATIC CHICKEN
Small scale – ponds
01/12/2009
7/30/2019 1 PDF Albert Tacon
http://slidepdf.com/reader/full/1-pdf-albert-tacon 22/24
01/12/2009
22
01/12/2009
7/30/2019 1 PDF Albert Tacon
http://slidepdf.com/reader/full/1-pdf-albert-tacon 23/24
01/12/2009
23
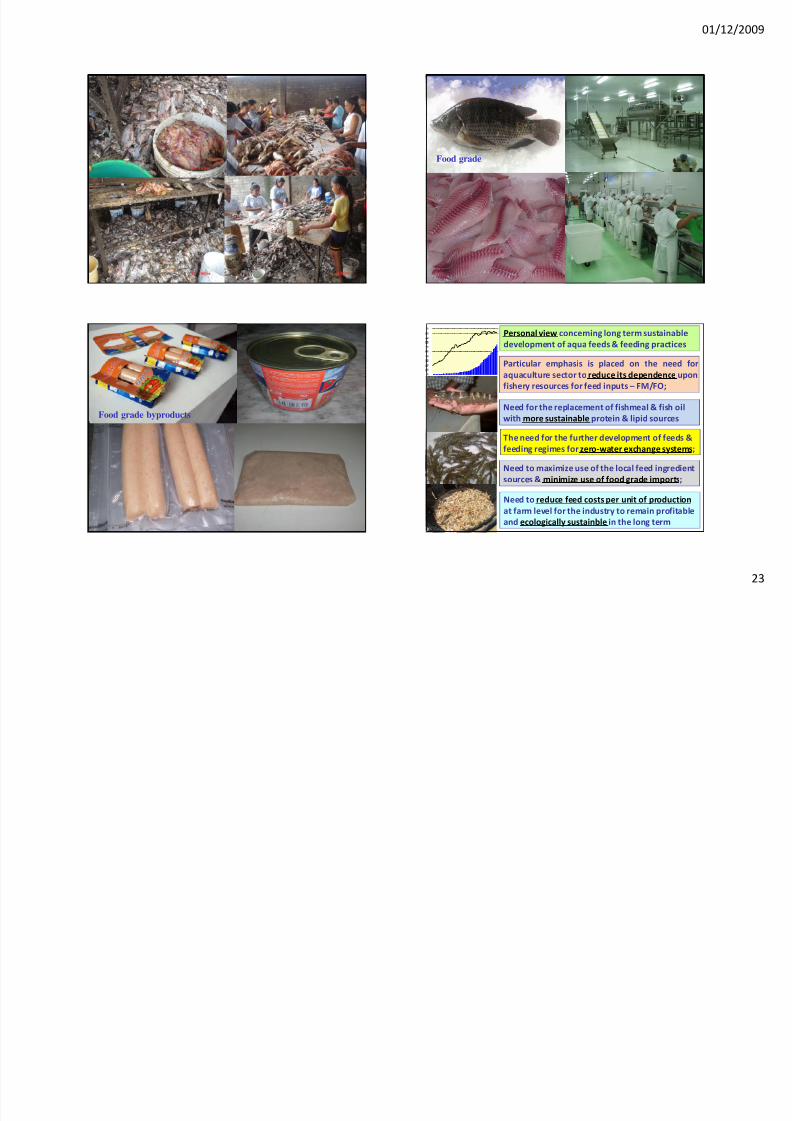
Food grade
Food grade byproducts
Personal view concerning long term sustainable
development of aqua feeds & feeding practices
Particular emphasis is placed on the need for
aquaculture sector to reduce its dependence upon
fishery resources for feed inputs – FM/FO;
Need for the replacement of fishmeal & fish oil
with more sustainable protein & lipid sources
The need for the further development of feeds &
feeding regimes for zero-water exchange systems;
Need to maximize use of the local feed ingredient
sources & minimize use of food grade imports;
Need to reduce feed costs per unit of production
at farm level for the industry to remain profitable
and ecologically sustainble in the long term
01/12/2009

7/30/2019 1 PDF Albert Tacon
http://slidepdf.com/reader/full/1-pdf-albert-tacon 24/24
/ /
24
Aloha y
Muchas Gracias
Related Documents