1 Passenger Traffic 2000 Passenger Traffic 2000 2020 2020 • Road + 67 % m/s - 7% (60%) • Rail + 23% m/s - 2% (8%) • Air + 133% m/s =1% (4%) • Growth Total 65% ( Int 66%) • GDP 108% • CEC 12 source TENSTAC study

1 Passenger Traffic 2000 2020 Road + 67 % m/s - 7% (60%) Rail + 23% m/s - 2% (8%) Air + 133% m/s =1% (4%) Growth Total 65% ( Int 66%) GDP108% CEC 12 source.
Dec 21, 2015
Welcome message from author
This document is posted to help you gain knowledge. Please leave a comment to let me know what you think about it! Share it to your friends and learn new things together.
Transcript

1
Passenger Traffic 2000 2020Passenger Traffic 2000 2020• Road + 67 % m/s - 7% (60%)• Rail + 23% m/s - 2% (8%)• Air + 133% m/s =1% (4%)
• Growth Total 65% ( Int 66%)• GDP 108%
• CEC 12 source TENSTAC study
2
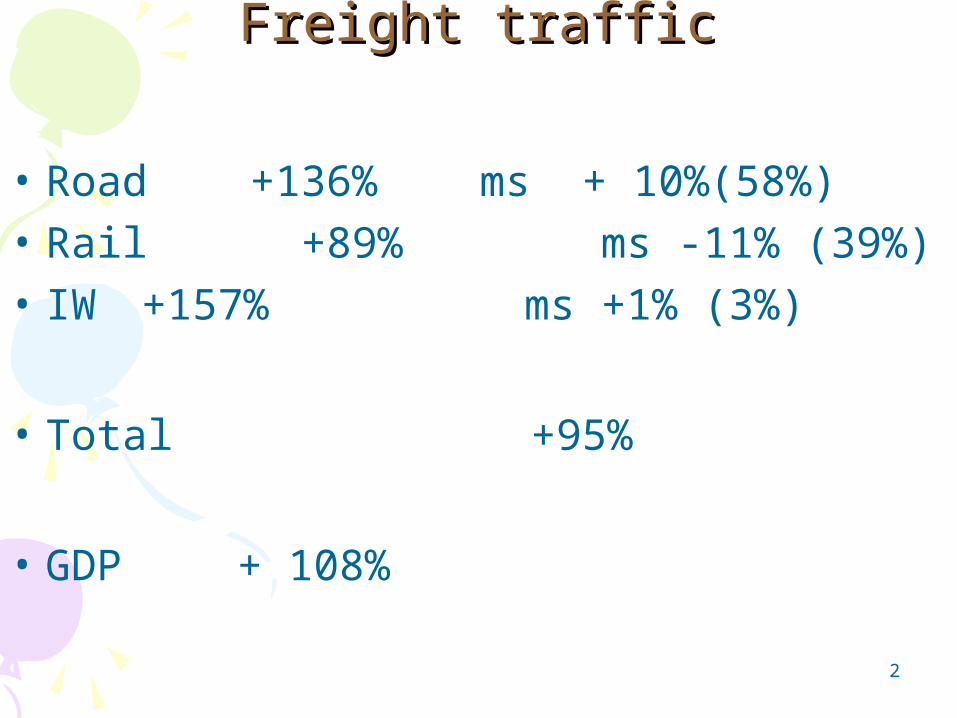
Freight trafficFreight traffic
• Road +136% ms + 10%(58%)• Rail +89% ms -11% (39%)• IW +157% ms +1% (3%)
• Total +95%
• GDP + 108%

3
The Current state of TENsThe Current state of TENs
• Need for change:• Failure to make progress on the
priority projects .• Entry of new Member States .• Widen the geographical coverage but• Concentrate on a limited number of
major routes.

4
• Priority projects – 30 located on major axes and covering the 25 m/s plus Bulgaria and Rumania.
• The 30 projects represent an investment of 225 B € up to 2020.
• The complete network would require 600 B € up to 2020 .
• Focus on rail and maritime transport including the new concept of the Motorways of the Sea.

5
• Guidelines revised to allow up to 20% to be given in financial support-notably for cross- border sections.
• Designation of ‘European Coordinators for certain major cross- border projects.
• Funding problems : EU 15 in the past devoted 1.5% of GDP now less than 1% when traffic is increasing.

6
30 PRIOIRTY PROJECTS 30 PRIOIRTY PROJECTS

7
For the future For the future • Better links to the EU’s new neighbours• Improvement of planning arrangements.• Funding . Less than 1% of GDP is invested
in infrastructure.• EU support programmes :• CARDS – Western Balkans.• TACIS –Eastern Europe and Central Asia.• MEDA – Euro- Mediterranean Pertnership.

8
ConclusionsConclusions• Identified a number of major trans-
national axes.• 3O specific projects on these axes.• High level group established to
identify jointly priority projects linking to neighbouring countries.
Related Documents