1 PASI - Electron Microscopy - Chile Lyman - Nanoparticles AEM Analysis of Nanoparticles Charles Lyman Lehigh University Bethlehem, PA

1 PASI - Electron Microscopy - Chile Lyman - Nanoparticles AEM Analysis of Nanoparticles Charles Lyman Lehigh University Bethlehem, PA.
Dec 21, 2015
Welcome message from author
This document is posted to help you gain knowledge. Please leave a comment to let me know what you think about it! Share it to your friends and learn new things together.
Transcript

1PASI - Electron Microscopy - Chile
Lyman - Nanoparticles
AEM Analysis of
NanoparticlesCharles LymanLehigh UniversityBethlehem, PA

2PASI - Electron Microscopy - Chile
Lyman - Nanoparticles
Nanoparticles
Exhibit an enormous surface-to-volume ratio
Courtesy C. J. Kiely
3PASI - Electron Microscopy - Chile
Lyman - Nanoparticles
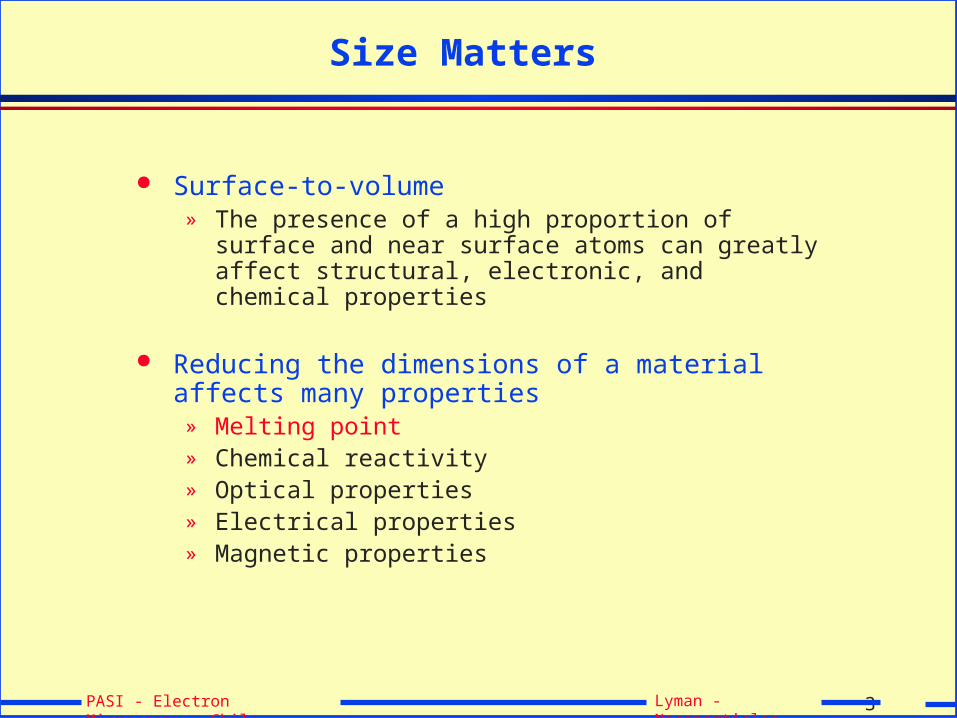
Size Matters
Surface-to-volume» The presence of a high proportion of surface and near
surface atoms can greatly affect structural, electronic, and chemical properties
Reducing the dimensions of a material affects many properties
» Melting point» Chemical reactivity» Optical properties» Electrical properties» Magnetic properties

4PASI - Electron Microscopy - Chile
Lyman - Nanoparticles
Melting Temperature of Nanoparticles

5PASI - Electron Microscopy - Chile
Lyman - Nanoparticles
Catalysis: The Oldest Nanotechnology

6PASI - Electron Microscopy - Chile
Lyman - Nanoparticles
4. Particle Composition - surface composition is most important
Chemical Reactivity

7PASI - Electron Microscopy - Chile
Lyman - Nanoparticles
Analysis of Nanoparticles in Electron Microscopes
Nanoparticles» Bodies of matter < 50-100 nm» May or may not be homogeneous» Must be supported to be analyzed (carbon film)» Weak contrast in TEM, stronger contrast in STEM-ADF» Very small x-ray and EELS signals
Analysis» 1 nA electron probe current» Particles < 10 nm analysis require field-emission STEM» 1 million times magnfication requires high specimen stability
Nanoparticles
Nanoparticle withcore and shell

8PASI - Electron Microscopy - Chile
Lyman - Nanoparticles
Size of the Analysis Region
> 100 µm = 0.1 mm (bulk analysis)
> 100 nm = 0.1 µm (SEM “microanalysis”)X-ray emission spectrometry (XES)Electron backscatter patterns (EBSP)Auger electron spectrometry (AES)X-ray photoelectron spectrometry (XPS)
< 100 nm = 0.1 µm (TEM “nanoanalysis”)X-ray emission spectrometry (XES)Transmission electron diffraction (SAD, CBED)Electron energy loss spectrometry (EELS)Atom probe
9PASI - Electron Microscopy - Chile
Lyman - Nanoparticles
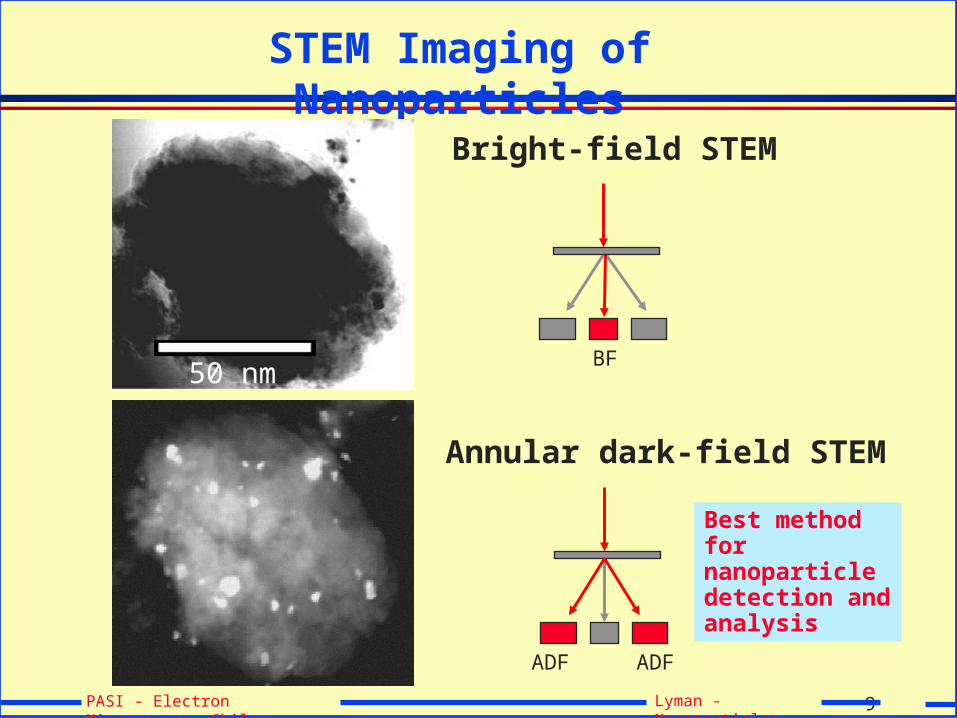
STEM Imaging of Nanoparticles
50 nm
Bright-field STEM
Annular dark-field STEM
Best method for nanoparticle detection and analysis
ADF ADF
BF

10PASI - Electron Microscopy - Chile
Lyman - Nanoparticles
X-ray Collection Geometry in STEM
DetectorStationary or scanning electron beam covering particle
Analyze particles only on the side of support shard facing x-ray detector
X-rays
Particle stability - a serious issue at 1 Mx

11PASI - Electron Microscopy - Chile
Lyman - Nanoparticles
Bimetallic NanoparticlesAre these particles all the same?
Supported Metal Catalyst Microstructure Particle size distribution Bimetallic particle composition distribution Surface segregation Particle shape Crystallography of surface facets and edges Support effects Physical and chemical effects of:
» Gas environment» Metal-support interactions» Preparation and processing variables
Catalytic Properties Activity, selectivity Stability, poisoning resistance, lifetime
Correlation of bimetallic nanoparticle microstructure with catalytic properties
12PASI - Electron Microscopy - Chile
Lyman - Nanoparticles
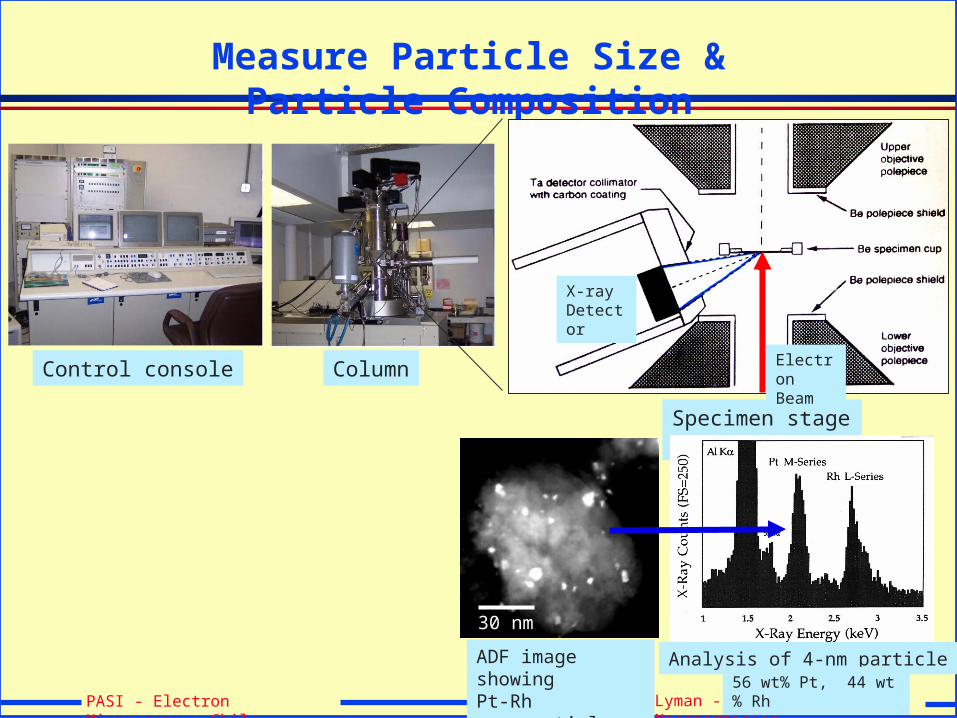
Measure Particle Size & Particle Composition
ColumnControl console
Specimen stage areaV G H B -6 0 3 S T E M F e a tu re s3 0 0 k V F E GO p tim iz e d fo r x -ra y c o lle c tio n 1 n A in 1 .5 n m (F W T M )
N o w w ith a b e rra tio n -c o rre c to r:5 n A in 1 .5 n m (F W T M ) M o re c u rre n t in e le c tro n p ro b e to d e te c t s m a lle r a m o u n ts o f e le m e n ts5 0 p A in 0 .2 n m (F W T M )D e te rm in e n a n o p a rtic le s h a p e
30 nm
Analysis of 4-nm particle56 wt% Pt, 44 wt% Rh
ADF image showing Pt-Rh nanoparticles
X-ray Detector
Electron Beam
13PASI - Electron Microscopy - Chile
Lyman - Nanoparticles
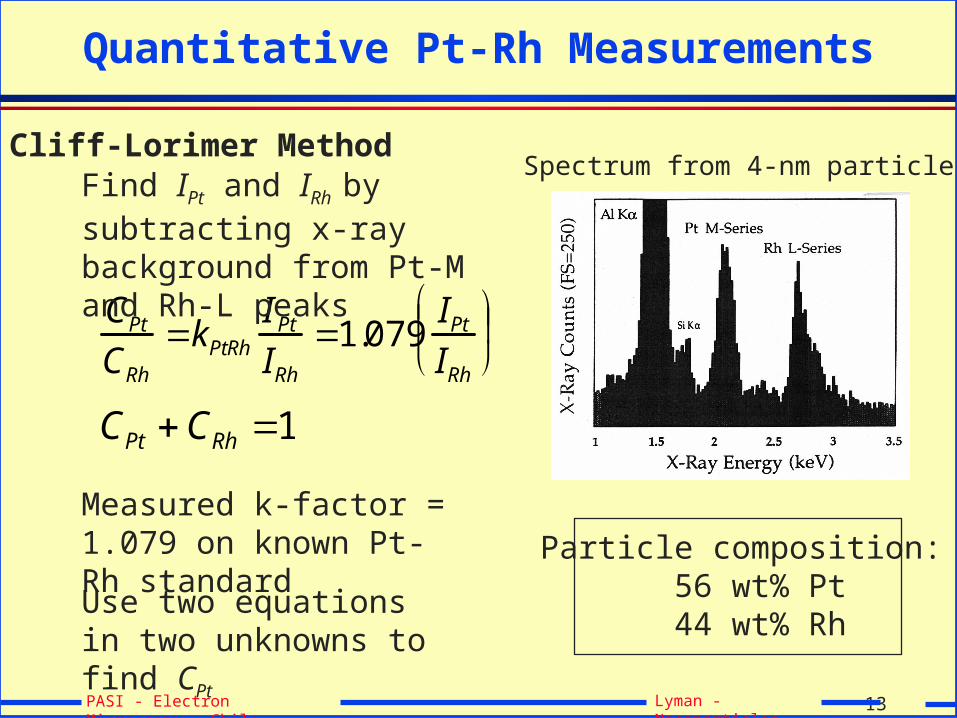
Quantitative Pt-Rh Measurements
CPtCRh
kPtRhIPtIRh
1.079IPtIRh
CPt CRh 1
Measured k-factor = 1.079 on known Pt-Rh standard
Use two equations in two unknowns to find CPt
Find IPt and IRh by subtracting x-ray background from Pt-M and Rh-L peaks
Spectrum from 4-nm particle
Particle composition: 56 wt% Pt 44 wt% Rh
Cliff-Lorimer Method

14PASI - Electron Microscopy - Chile
Lyman - Nanoparticles
Bimetallic Nanoparticle Catalysts
Average Particle Size and
Average Particle Composition
Often poor predictors of catalyst behavior
Analytical Transmission Electron Microscopy (AEM)Composition-Size Diagram
givesSize and Composition Distributions
Good predictor of catalyst behavior
Particle Diameter (nm)
Pt
Co
nte
nt
(wt%
)
Composition and size measured for ~100 indivdual nanoparticles
BulkAnalysisMethods

15PASI - Electron Microscopy - Chile
Lyman - Nanoparticles
Predicted Phase Separation Observed
Dotted miscibility gap was predicted theoretically from similar systems
Two phases observed
Pt-rich phase
Rh-rich phase
Pt-Rh Phase DiagramBulk
C. E. Lyman, et al., Ultramicroscopy, 58 (1995) 25-34

16PASI - Electron Microscopy - Chile
Lyman - Nanoparticles
Applications
Pt-Rh/mordenite» sulfur-tolerant NO reduction catalyst
Pt-Re/-Al2O3
» drying alters catalyst microstructure
Pt-Sn/-Al2O3 » Pt-rich particles aid propane dehydrogenation

17PASI - Electron Microscopy - Chile
Lyman - Nanoparticles
Correlation with NO-Reduction Activity
Rh60/40
17/83
95/5
17Pt/83Rh 60Pt/40RhPtox- Rhred
75Pt/25RhRhox- Ptred
95Pt/5Rh
75/25
Pt-Rh/-alumina
NO H2 1
2N2 H2O
Lakis et al., J. Catal. 154 (1995) 261
Most Active
Pt

18PASI - Electron Microscopy - Chile
Lyman - Nanoparticles
Effect of Adsorbed Gas on PtRh Nanoparticles
Particle Diameter (nm)
Pt
Co
nte
nt
(wt%
)
Pt segregates to the surface
Particle Diameter (nm) P
t C
on
ten
t (w
t%)
After reduction in H2 at 500˚C
Rh segregates to the surface
After reaction in NO + H2 at 300˚C
Gibbsian Equilibrium Surface Segregation
Gas-Adsorption Surface Segregation
Coimpregnation of Pt and Rh Sequential Impregnation, Pt first
C. E. Lyman, et al., Ultramicroscopy 34 (1990) 73-80 C. E. Lyman, et al., Ultramicroscopy, 58 (1995) 25-34
Surface energies: Pt ~ 2.5 J/m2 Rh ~ 2.7 J/m2

19PASI - Electron Microscopy - Chile
Lyman - Nanoparticles
Line Profile Mode: Rh Segregation to Surface
Line Profile: 14 Analysis points across a 10 nm Pt-Rh particle
Matched to calculated profile assuming 5.8 wt% Rh core and monolayers of pure Rh on surface
Conclusion:About 1 monolayer of Rh makes catalyst less active
60/40 catalyst particle ~ 10 nm
C. E. Lyman et al., Proc. 2nd Mexican Congress on Electron Microscopy, Cancun, (1994) SSM16

20PASI - Electron Microscopy - Chile
Lyman - Nanoparticles
Modelling X-ray Analysis: Rh Surface Segregation
Simulation» Match computer simulation line to measured composition-size diagram
Result» 1/2 monolayer of Rh line is close match to measured data
C. E. Lyman et al., Microchimica Acta 132 (2000) 301
Conclusion:Both Pt and Rh exposed on particle surface makes catalyst more active
Pt adsorbs H2
Rh adsorbs NO
95Pt/5Rh catalyst
NO H2 1
2N2 H2OTwo sites required:

21PASI - Electron Microscopy - Chile
Lyman - Nanoparticles
Sulfur Tolerance in NO Reduction CatalystsGas: 400 ppm NO, 0.72% H2, 5 % O2, 13 % CO2 and 8% H2O in N2 balance
Pt/mordenite
Pt-5%Rh/mordenite
S. Choi, M.S. Thesis, Lehigh University (2001)
Most activity is retained when SO2 added
Severe loss of activity when SO2 added

22PASI - Electron Microscopy - Chile
Lyman - Nanoparticles
Rh reduces S-Pt association
Sulfur-poisoned Pt/mordenite
Sulfur-poisoned PtRh/mordenite
ADF image Pt x-ray map S x-ray map X-ray background
S. Choi, M.S. Thesis, Lehigh University (2001)
23PASI - Electron Microscopy - Chile
Lyman - Nanoparticles
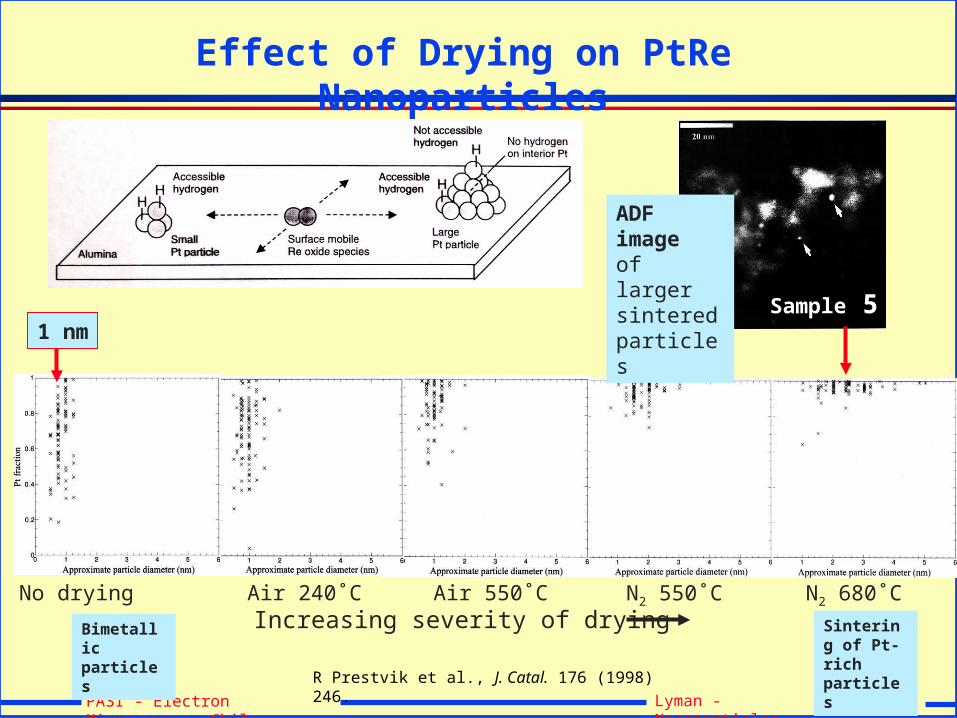
Effect of Drying on PtRe Nanoparticles
No drying Air 240˚C Air 550˚C N2 550˚C N2 680˚CIncreasing severity of drying
R Prestvik et al., J. Catal. 176 (1998) 246.
Sample 5
ADF image of larger sintered particles
1 nm
Bimetallic particles
Sintering of Pt-rich particles

24PASI - Electron Microscopy - Chile
Lyman - Nanoparticles
Pt-Re/Al2O3 Reforming Catalyst
Spectrum from a 1-nm particle
Spectrum from alumina support
ADF image

25PASI - Electron Microscopy - Chile
Lyman - Nanoparticles
Pt-Sn Particles on Different Supports
After reduction all Pt-Sn particles ~ 1nm in diameter
Dispersion
CO Chemisorp
Measured Particle Size
Pt-Sn/-Al2O3 35% 1 nm
Pt-Sn/MgO 9% 1 nm
Pt-Sn/hydrotalcite 18% 1 nm
Evidence of strong metal support interaction (SMSI)
L. Bednarova et al., J. Catal. 211 (2002) 335
Pt-rich particles are most active for propane dehydrogenation
Dispersion vs. Particle Size

26PASI - Electron Microscopy - Chile
Lyman - Nanoparticles
A Role for EELS
Ultra-high spatial resolution» Little beam spreading» Spatial resolution is beam diameter
Other benefits of EELS

27PASI - Electron Microscopy - Chile
Lyman - Nanoparticles
Titania-supported Pt Catalyst
HAADF Image of Pt on TiO2
Oxygen but no titaniumPt particle hanging over edge
Ti should be here
J. Liu, Microsc. Microanal. 10 (2004) 55-76
28PASI - Electron Microscopy - Chile
Lyman - Nanoparticles
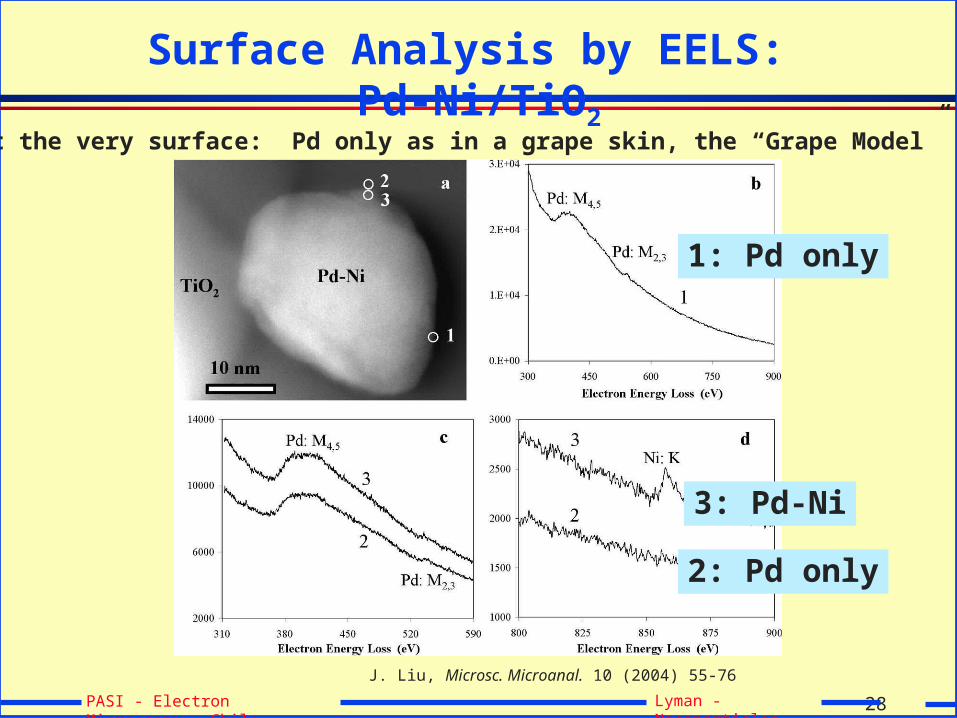
Surface Analysis by EELS: Pd-Ni/TiO2
J. Liu, Microsc. Microanal. 10 (2004) 55-76
At the very surface: Pd only as in a grape skin, the “Grape Model”
1: Pd only
3: Pd-Ni
2: Pd only

29PASI - Electron Microscopy - Chile
Lyman - Nanoparticles
Summary
Nanoparticles often not identical» Composition-size diagram describes population» Analyze at least 100 particles
FEG-STEM required for particles < 10 nm» 1-nA probe current » Quantitative analysis of 1-nm particles with x-rays» Better spatial resolution using EELS
Related Documents