1 Oregon Department of Education (ODE) State School Fund Ways & Means Education Sub-Committee March 24, 2003 Pat Burk, Deputy Superintendent Brian Reeder, Analyst, School Finance

1 Oregon Department of Education (ODE) State School Fund Ways & Means Education Sub-Committee March 24, 2003 Pat Burk, Deputy Superintendent Brian Reeder,
Dec 24, 2015
Welcome message from author
This document is posted to help you gain knowledge. Please leave a comment to let me know what you think about it! Share it to your friends and learn new things together.
Transcript
1
Oregon Department of Education (ODE)
State School Fund
Ways & Means Education Sub-Committee
March 24, 2003
Pat Burk,Deputy Superintendent
Brian Reeder,Analyst, School Finance

2
Agenda
State School Fund
State Education Goals
How School Districts Spend their Money
How our Schools Perform
What Outcomes can be Expected
3
To Meet Oregon’s Education Goals
And ODE’s Prioritized Mission
“…shall provide by law for the establishment of a uniform, and
general system of Common schools…” Article VIII, Section
3, Oregon Constitution
“…the best educated citizens in the nation and the world.”
“Access to a Quality Education must be provided for all of
Oregon’s youth…” ORS 329.035
4
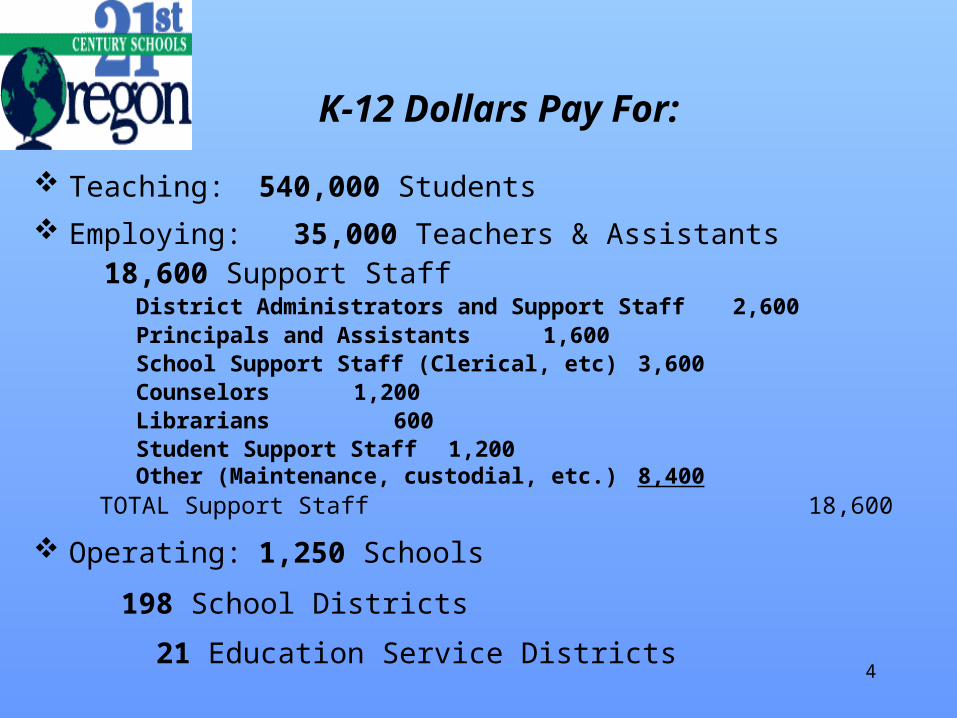
Teaching: 540,000 Students
Employing: 35,000 Teachers & Assistants 18,600 Support Staff District Administrators and Support Staff 2,600 Principals and Assistants 1,600 School Support Staff (Clerical, etc) 3,600 Counselors 1,200 Librarians 600 Student Support Staff 1,200 Other (Maintenance, custodial, etc.) 8,400
TOTAL Support Staff 18,600
Operating: 1,250 Schools
198 School Districts
21 Education Service Districts
K-12 Dollars Pay For:
5
Oregon’s K-12 System
High academic standards with clear expectations for student performance
A system of statewide assessments aligned with the standards
Use of data to drive school improvement and accountability
Assessments at grades 3, 5, 8, and 10
6
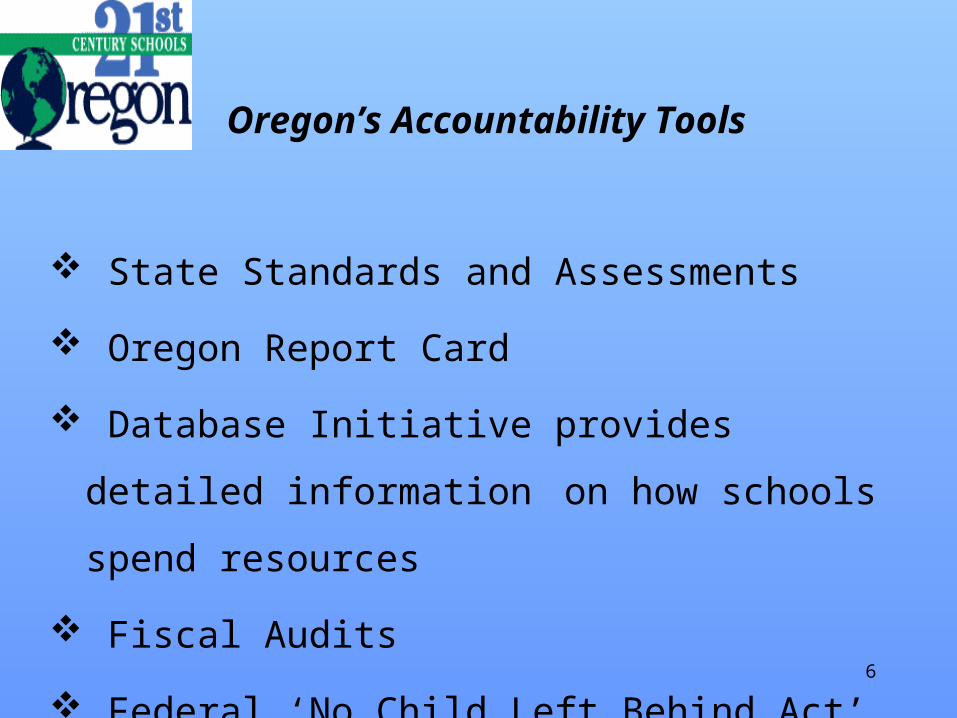
State Standards and Assessments
Oregon Report Card
Database Initiative provides detailed information
on how schools spend resources
Fiscal Audits
Federal ‘No Child Left Behind Act’
Oregon’s Accountability Tools
7
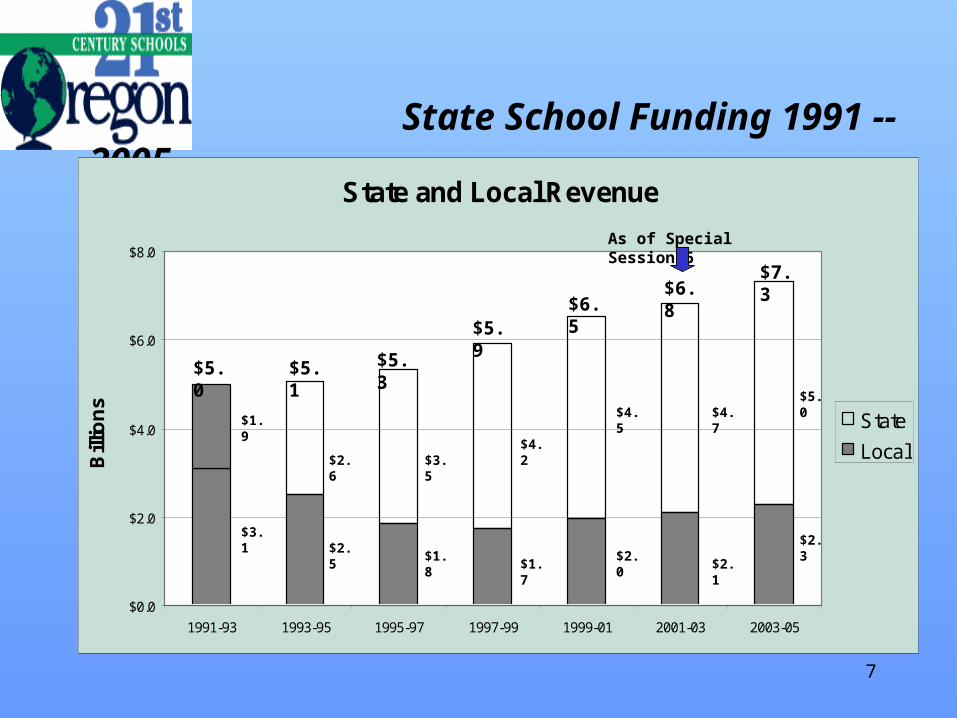
State School Funding 1991 -- 2005
State and Local Revenue
$0.0
$2.0
$4.0
$6.0
$8.0
1991-93 1993-95 1995-97 1997-99 1999-01 2001-03 2003-05
Bill
ion
s
State
Local
$5.0 $5.1 $5.3
$5.9$6.5
$6.8$7.3
$1.9
$3.1
$2.6
$2.5
$3.5
$1.8
$4.2
$1.7
$4.5
$2.0
$4.7
$2.1
$5.0
$2.3
As of Special Session 6
8
Revenue Trends
Why?
- Decrease in local revenues
- Inflation (Personnel, Salaries, Benefits)
- Increases in student enrollment
State School Fund Revenues have increasedbut real Revenues Per Student have declined
9
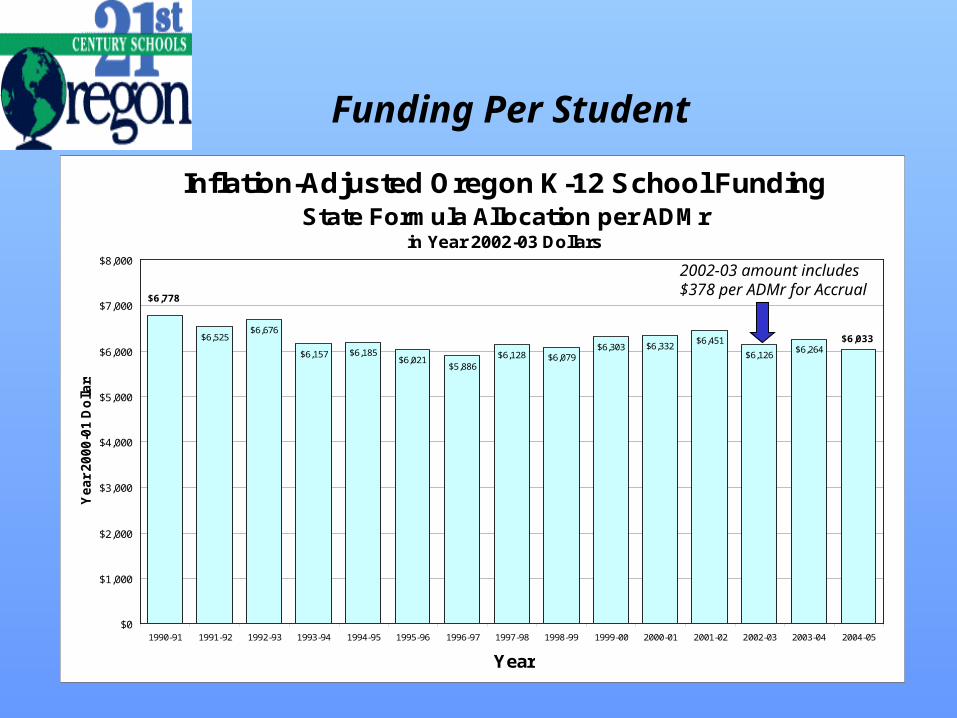
Funding Per Student
Inflation-Adjusted Oregon K-12 School FundingState Formula Allocation per ADMr
in Year 2002-03 Dollars
$6,525$6,676
$6,157 $6,185$6,021
$5,886$6,128 $6,079
$6,303 $6,332$6,451
$6,126$6,264
$6,033
$6,778
$0
$1,000
$2,000
$3,000
$4,000
$5,000
$6,000
$7,000
$8,000
1990-91 1991-92 1992-93 1993-94 1994-95 1995-96 1996-97 1997-98 1998-99 1999-00 2000-01 2001-02 2002-03 2003-04 2004-05
Year
Ye
ar
20
00
-01
Do
llars
2002-03 amount includes $378 per ADMr for Accrual
10
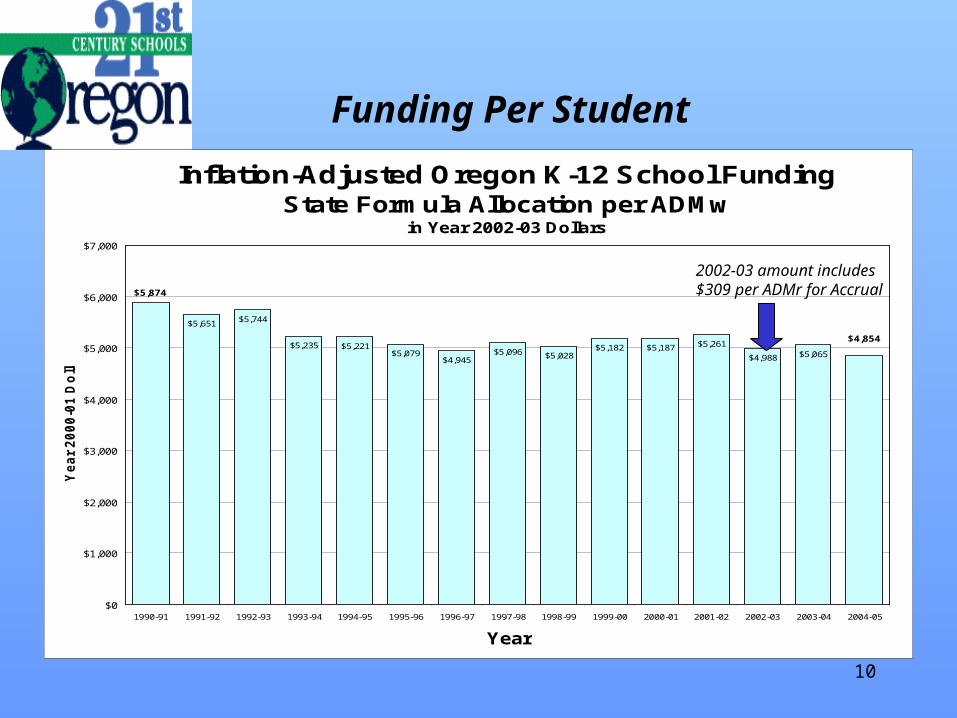
Funding Per Student
Inflation-Adjusted Oregon K-12 School FundingState Formula Allocation per ADMw
in Year 2002-03 Dollars
$5,651 $5,744
$5,235 $5,221$5,079
$4,945$5,096 $5,028
$5,182 $5,187 $5,261
$4,988 $5,065
$4,854
$5,874
$0
$1,000
$2,000
$3,000
$4,000
$5,000
$6,000
$7,000
1990-91 1991-92 1992-93 1993-94 1994-95 1995-96 1996-97 1997-98 1998-99 1999-00 2000-01 2001-02 2002-03 2003-04 2004-05
Year
Ye
ar
20
00
-01
Do
lla
rs
2002-03 amount includes $309 per ADMr for Accrual
11
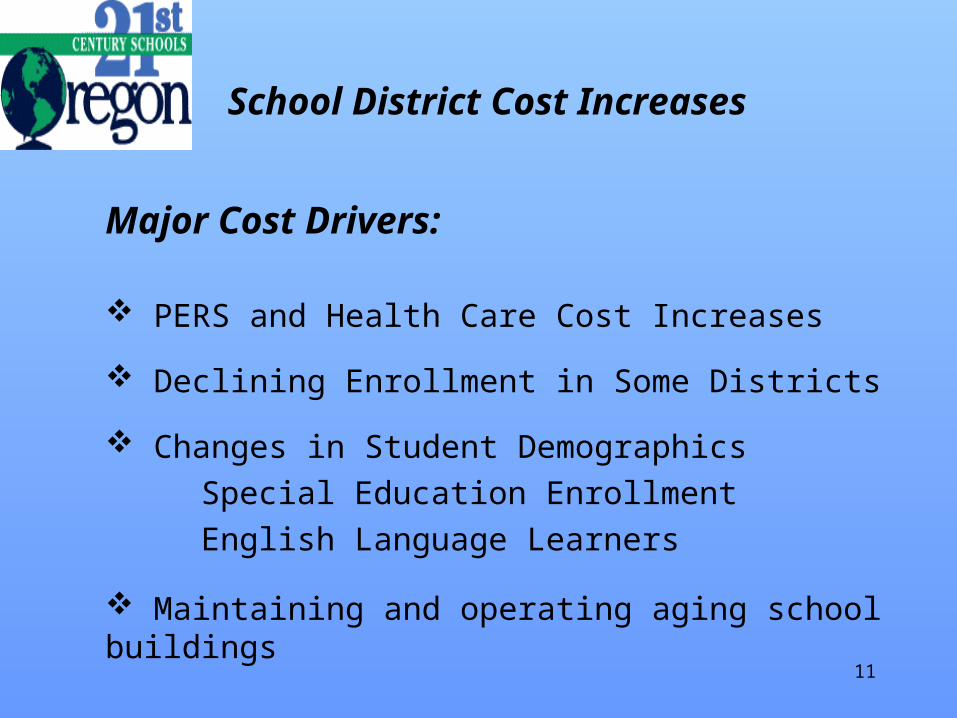
School District Cost Increases
Major Cost Drivers:
PERS and Health Care Cost Increases
Declining Enrollment in Some Districts
Changes in Student Demographics
Special Education Enrollment
English Language Learners
Maintaining and operating aging school buildings

12
198 School Districts 2002-03
Rapid Growth10%
Declining65%
Stable25%
School Districts by Change in Enrollment
13
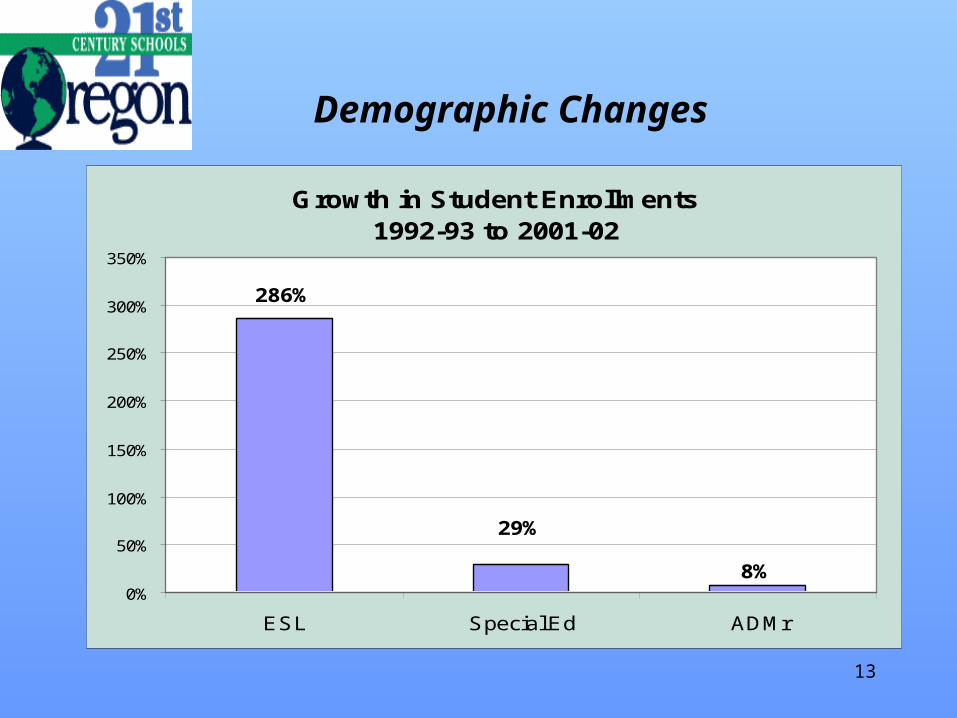
Demographic Changes
Growth in Student Enrollments1992-93 to 2001-02
286%
29%
8%0%
50%
100%
150%
200%
250%
300%
350%
ESL Special Ed ADMr
14
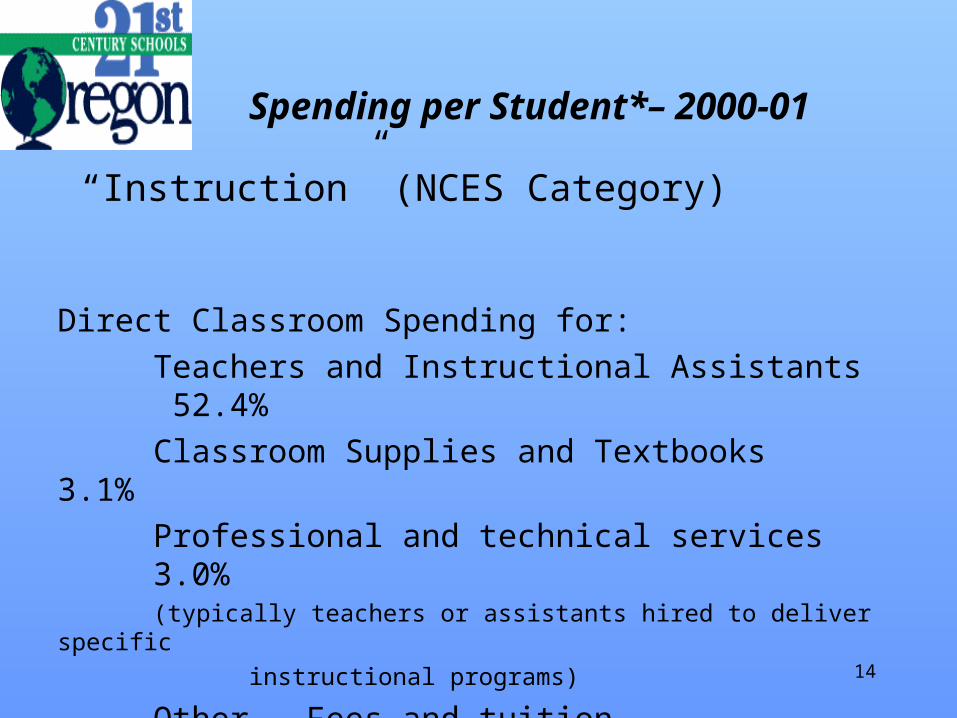
Spending per Student*– 2000-01
“Instruction” (NCES Category)
Direct Classroom Spending for:
Teachers and Instructional Assistants 52.4%
Classroom Supplies and Textbooks 3.1%
Professional and technical services 3.0%(typically teachers or assistants hired to deliver specific
instructional programs)
Other – Fees and tuition .7%
TOTAL (just below national average) 59.2%
* Per Secretary of State K-12 Audit
15
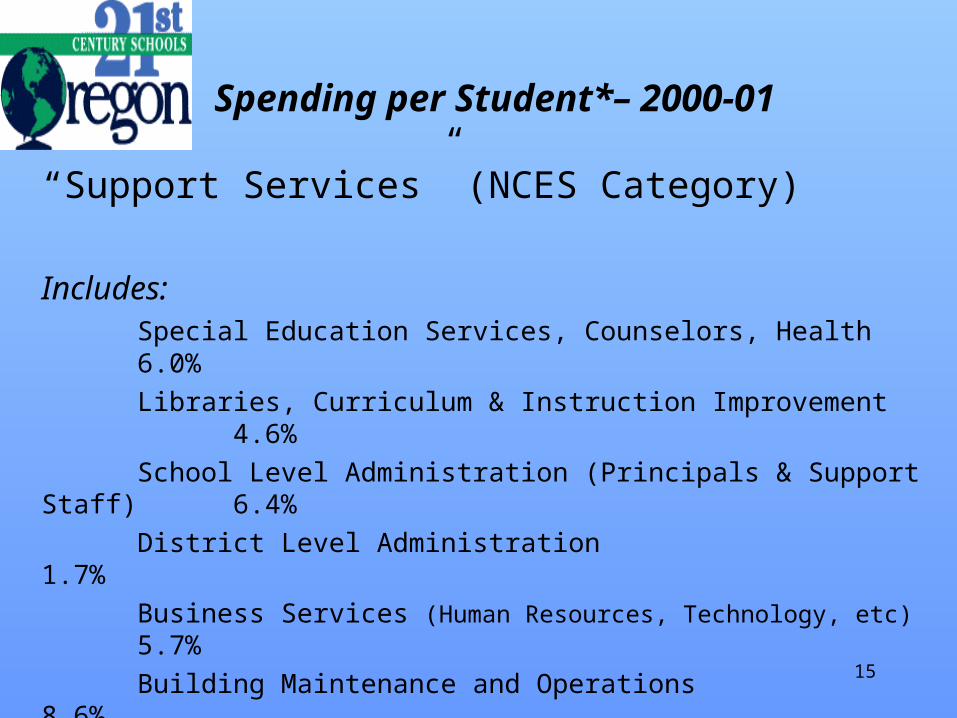
Spending per Student*– 2000-01
“Support Services” (NCES Category)
Includes:Special Education Services, Counselors, Health 6.0%
Libraries, Curriculum & Instruction Improvement 4.6%
School Level Administration (Principals & Support Staff) 6.4%
District Level Administration 1.7%
Business Services (Human Resources, Technology, etc) 5.7%
Building Maintenance and Operations 8.6%
Transportation 4.2%
TOTAL 37.2%
* Per Secretary of State K-12 Audit
16
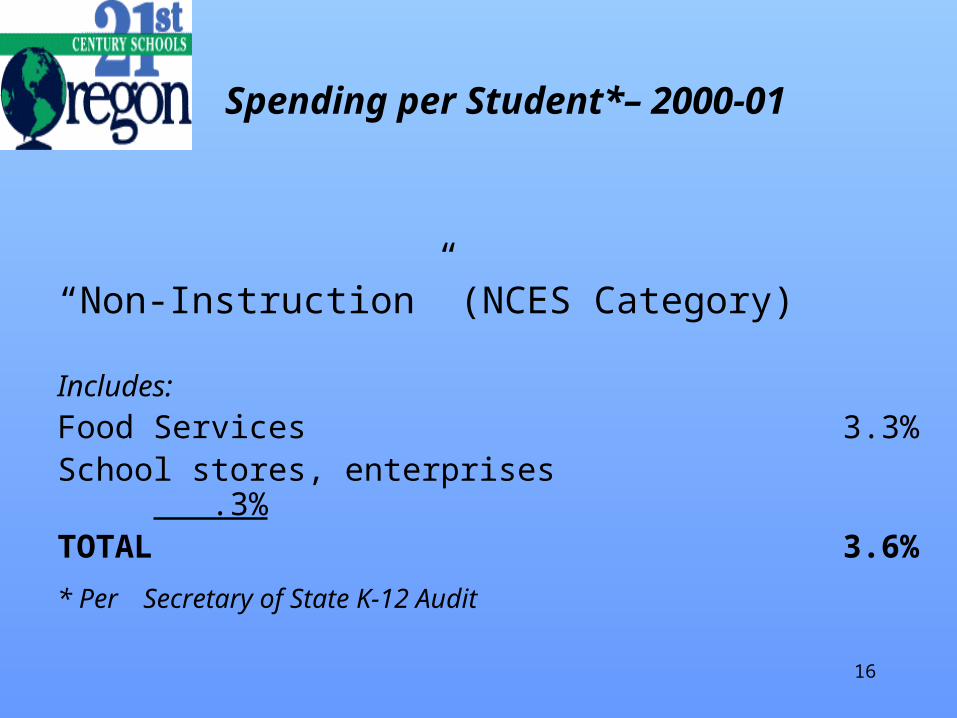
“Non-Instruction” (NCES Category)
Includes:
Food Services 3.3%School stores, enterprises .3%TOTAL 3.6%
* Per Secretary of State K-12 Audit
Spending per Student*– 2000-01
17
A Decade of Progress
1992-2002
The focus on high standards is paying off -
Strong progress on state assessments
Declining dropout rates
High SAT and ACT scores
High percentage of college-bound students
18
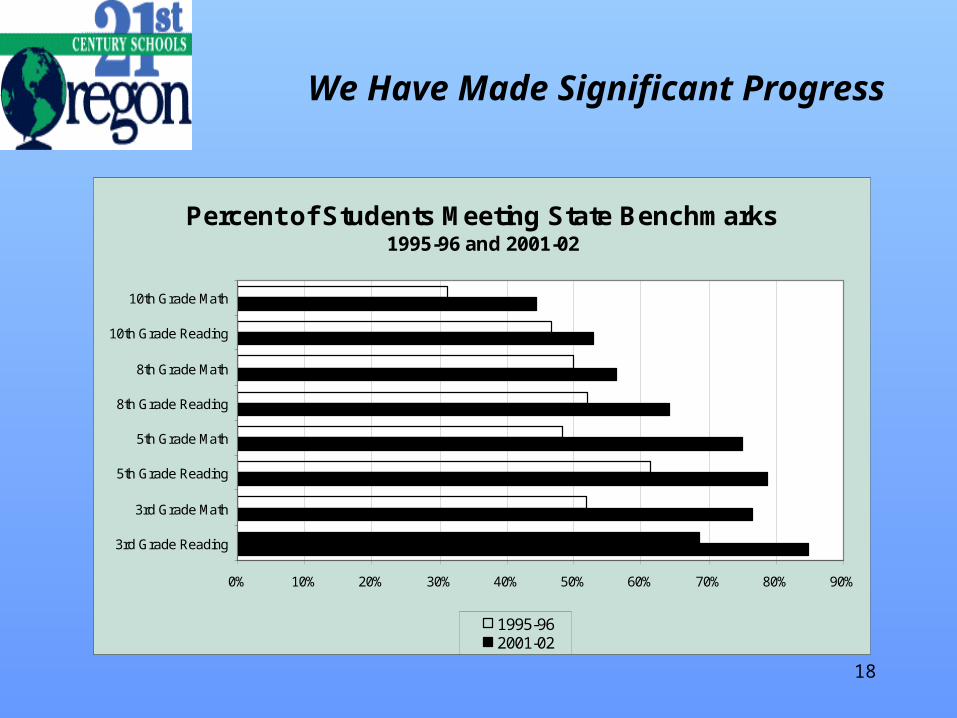
We Have Made Significant Progress
Percent of Students Meeting State Benchmarks1995-96 and 2001-02
0% 10% 20% 30% 40% 50% 60% 70% 80% 90%
3rd Grade Reading
3rd Grade Math
5th Grade Reading
5th Grade Math
8th Grade Reading
8th Grade Math
10th Grade Reading
10th Grade Math
1995-962001-02
19
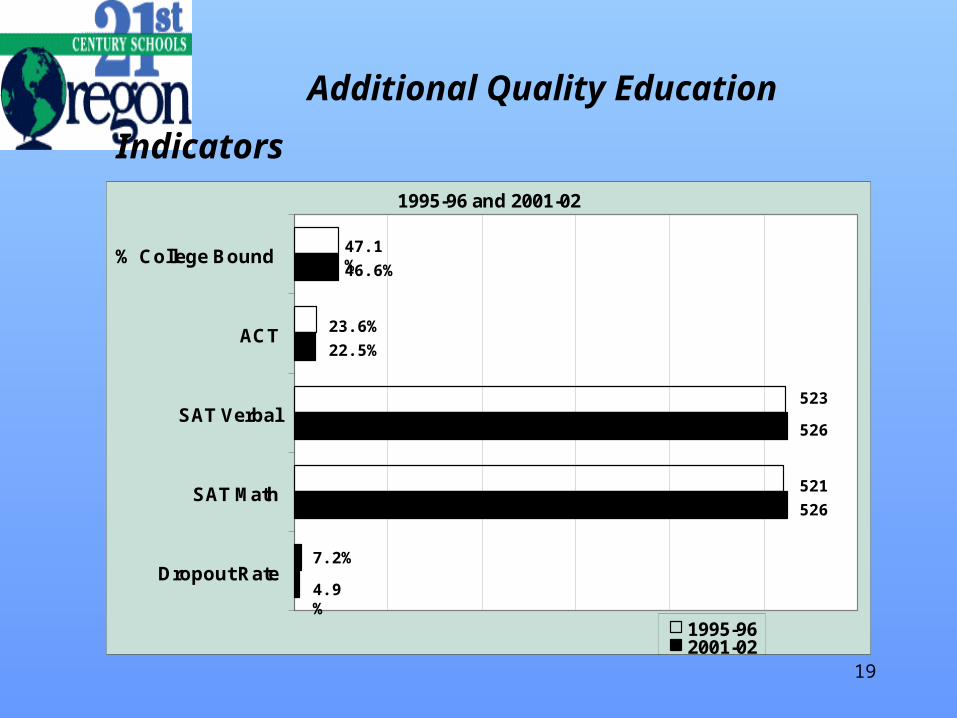
Additional Quality Education Indicators
1995-96 and 2001-02
Dropout Rate
SAT Math
SAT Verbal
ACT
% College Bound
1995-962001-02
47.1%
46.6%
23.6%
22.5%
523
526
521
526
7.2%
4.9%

20
But we have not yet met our goals
Many students are not reaching the high standards necessary for them to succeed in the 21st century
Significant Achievement Gaps exist in performance of Hispanic and African American students and students in poverty
Student dropout rates are still too high
Paperwork takes time away from teaching

21
2001-03 Budget
State School Fund Reductions from Close of Session(Millions of Dollars)
Cuts thru 5th Special Session* $ 149.7
December Reductions 46.2
Measure 28 failure 95.0
MUPL Shortfall** 8.3
TOTAL State Reductions $ 299.2 -5.7%*Includes Special Session 5 reduction of $132 Million plus common school fund adjustment of $17.7 Million. Does not include $211 Million accrual adjustment.
**Medicare Upper Payment Limit (MUPL) Revenue Shortfall is an estimate from DAS
22
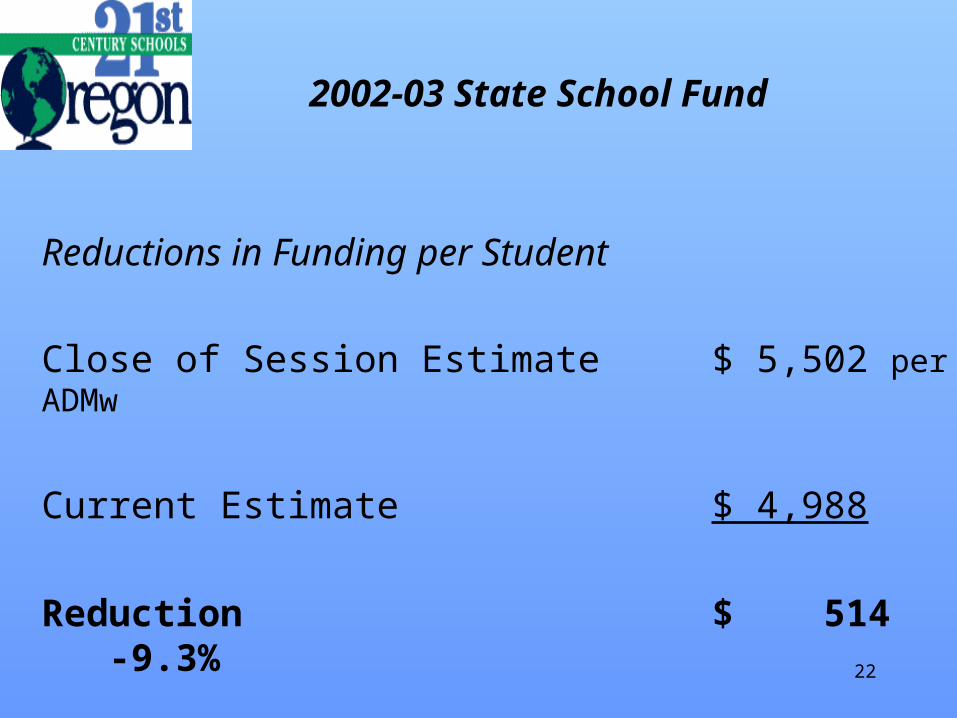
2002-03 State School Fund
Reductions in Funding per Student
Close of Session Estimate $ 5,502 per ADMw
Current Estimate $ 4,988
Reduction $ 514 -9.3%

23
2003-05 Budget
State School Fund – in millions
Without Cuts* GBB CutState Funding 6,010 5,050 960
Local Revenues 2,269 2,269 0
Total $8,279 $7,319 $ 960
* Based on expected level of spending in 2001-03 before cuts made
necessary by revenue shortfalls.
24
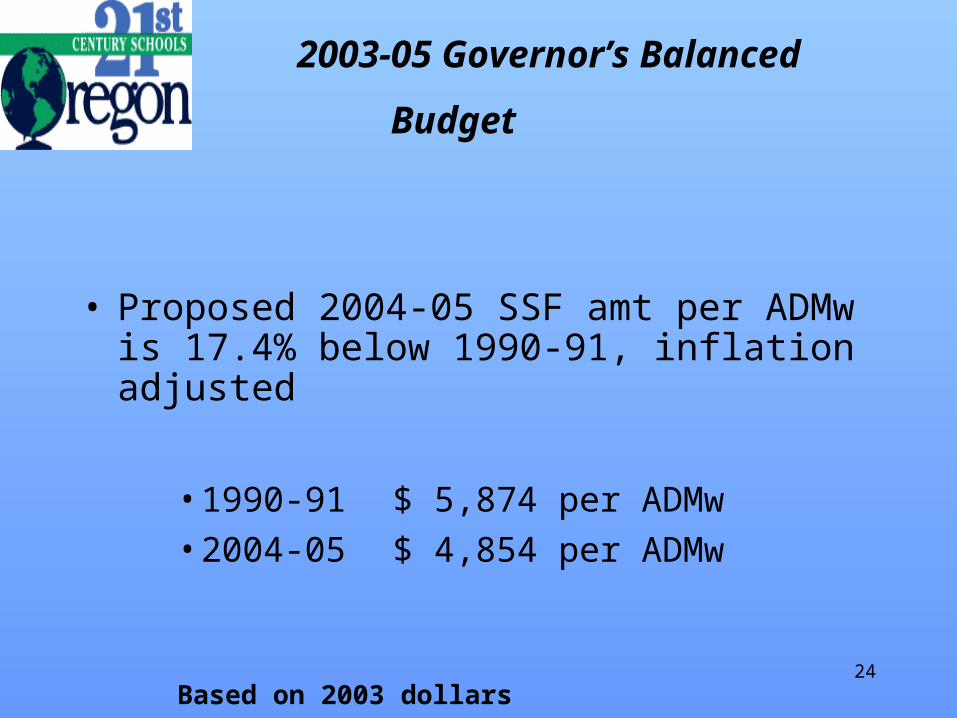
2003-05 Governor’s Balanced Budget
• Proposed 2004-05 SSF amt per ADMw is 17.4% below 1990-91, inflation adjusted
• 1990-91 $ 5,874 per ADMw
• 2004-05 $ 4,854 per ADMw
Based on 2003 dollars
25
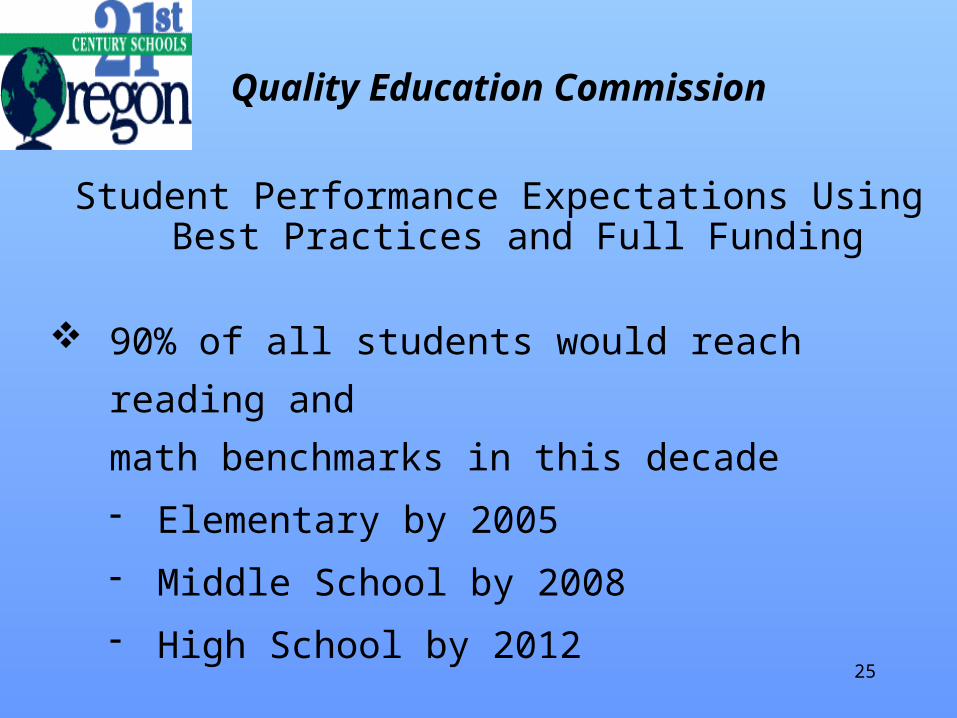
Quality Education Commission
Student Performance Expectations Using Best Practices and Full Funding
90% of all students would reach reading and
math benchmarks in this decade
Elementary by 2005
Middle School by 2008
High School by 2012

26
Governor’s Assumptions
No cost of living or step increases for teachers—saves $257 million No salary increases for school-level administrative staff—saves $15 million No wage increases for school-level classified staff—saves $23 million No increase for district-level administration and services—saves $34 million No increase in health insurance or other benefits costs—saves $144 million No increase in costs for supplies and services—saves $86 million
Total Savings = $559 million
Add-back to maintain school days = $100 million
Net Savings = $459 million
2003-05 Governor’s Budget - $5.05 Billion

27
2003-05 Governor’s Budget - $5.05 Billion
Example of Program Impacts
Reduce central administration and business services by 15%
Reduce school-level administration by 15%
Eliminate:
- 1.0 elementary specialists per school—total of 750 statewide
- 2.0 middle school teachers per school—total of 520 statewide
- 4.5 high school teachers per school—total of 770 statewide
Increase:
- Average middle school class size from 23 to 25 students
- Average high school class size from 24 to 27 students
28
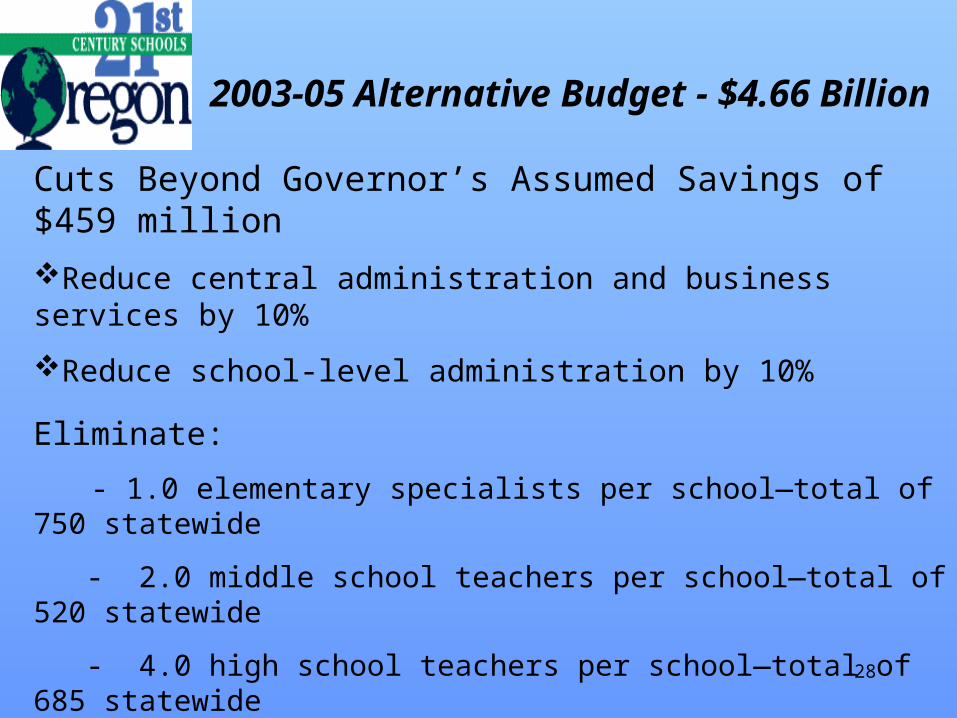
Cuts Beyond Governor’s Assumed Savings of $459 million
Reduce central administration and business services by 10%
Reduce school-level administration by 10%
Eliminate:
- 1.0 elementary specialists per school—total of 750 statewide
- 2.0 middle school teachers per school—total of 520 statewide
- 4.0 high school teachers per school—total of 685 statewide
Increase:
- Average middle school class size from 23 to 25 students
- Average high school class size from 24 to 26 students
2003-05 Alternative Budget - $4.66 Billion
29
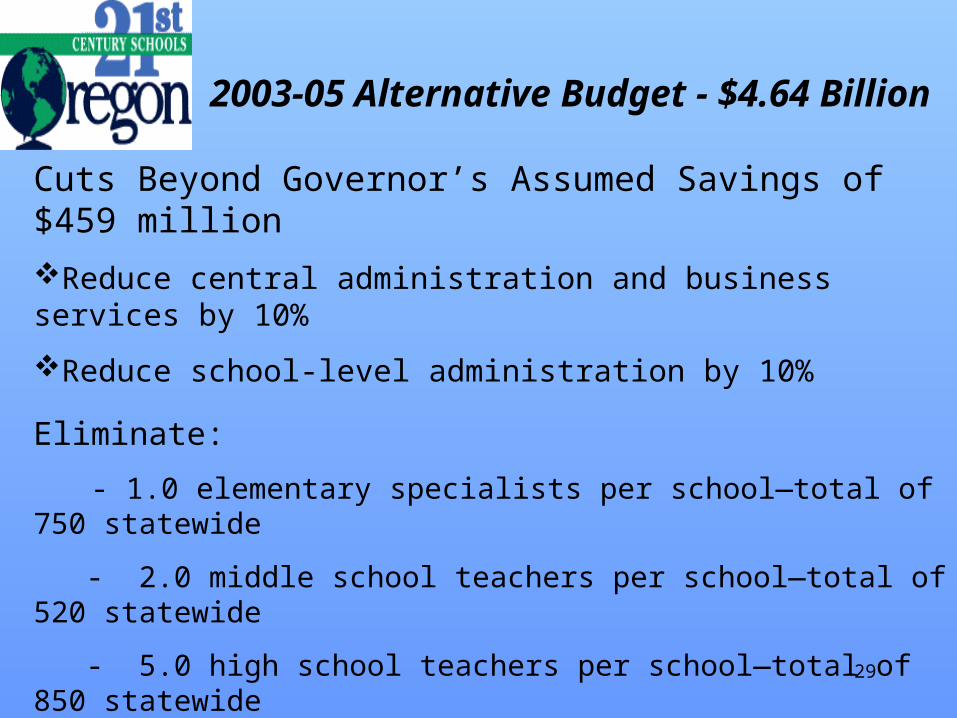
Cuts Beyond Governor’s Assumed Savings of $459 million
Reduce central administration and business services by 10%
Reduce school-level administration by 10%
Eliminate:
- 1.0 elementary specialists per school—total of 750 statewide
- 2.0 middle school teachers per school—total of 520 statewide
- 5.0 high school teachers per school—total of 850 statewide
Increase:
- Average middle school class size from 23 to 25 students
- Average high school class size from 24 to 27 students
2003-05 Alternative Budget - $4.64 Billion

30
Questions and Discussion
Visit our website at www.ode.state.or.usVisit our website at www.ode.state.or.us
Related Documents