1 of 41 Copyright © 2011 Worth Publishers· International Economics· Feenstra/Taylor, 2/e. Chapter 1: Trade in the Global Economy Trade in the Global Economy Prepared by: Fernando Quijano Dickinson State University 1 1 International Trade 2 Migration and Foreign Direct Investment

1 of 41 Copyright © 2011 Worth Publishers· International Economics· Feenstra/Taylor, 2/e. Chapter 1: Trade in the Global Economy Trade in the Global Economy.
Dec 24, 2015
Welcome message from author
This document is posted to help you gain knowledge. Please leave a comment to let me know what you think about it! Share it to your friends and learn new things together.
Transcript

1 of 41Copyright © 2011 Worth Publishers· International Economics· Feenstra/Taylor, 2/e.
Cha
pter
1:
Tra
de in
the
Glo
bal E
cono
my
Trade in the Global Economy
Prepared by:Fernando QuijanoDickinson State University
11 International Trade
2 Migration and Foreign Direct Investment

2 of 41Copyright © 2011 Worth Publishers· International Economics· Feenstra/Taylor, 2/e.
Cha
pter
1:
Tra
de in
the
Glo
bal E
cono
my
Introduction
On April 14, 2010, the Eyjafjallajokull volcano in Iceland roared to life after being dormant for more than two centuries.
An event like this has dramatic consequences for international trade, the movement of goods and services across borders.
Roughly 100,000 flights to and from Northern Europe were cancelled, and billions of dollars in air freight and millions of travelers were delayed, cancelled, or re-routed.
In April 2010 the ash from Iceland's Eyjafjallajokull volcano disrupted air travel in Northern Europe and beyond.

3 of 41Copyright © 2011 Worth Publishers· International Economics· Feenstra/Taylor, 2/e.
Cha
pter
1:
Tra
de in
the
Glo
bal E
cono
my
Introduction
In this book, we will study international trade in goods and services.
We will learn the economic forces that determine what that trade looks like:
• what products are traded• who trades them• at what quantities and prices they are traded• what the benefits and costs of trade are.
We will also learn about policies that governments use to shape trade patterns among countries.

4 of 41Copyright © 2011 Worth Publishers· International Economics· Feenstra/Taylor, 2/e.
Cha
pter
1:
Tra
de in
the
Glo
bal E
cono
my
1 International Trade
The Basics of World Trade
Countries buy and sell goods and services from one another constantly.
An export is a product sold from one country to another.
An import is a product bought by one country from another.
5 of 41Copyright © 2011 Worth Publishers· International Economics· Feenstra/Taylor, 2/e.
Cha
pter
1:
Tra
de in
the
Glo
bal E
cono
my
1 International Trade
The Basics of World Trade
A country’s trade balance is the difference between its total value of exports and its total value of imports (usually including both goods and services).
Countries that export more than they import, such as China in recent years, run a trade surplus, whereas countries that import more than they export, such as the United States, run a trade deficit.
The bilateral trade balance is the difference of exports and imports between two countries.

6 of 41Copyright © 2011 Worth Publishers· International Economics· Feenstra/Taylor, 2/e.
Cha
pter
1:
Tra
de in
the
Glo
bal E
cono
my
An iPod Has Global Value. Ask the (Many) Countries That Make It.
Who makes the Apple iPod?
Apple outsources the entire manufacture of the device to a number of Asian enterprises
The iPod, like many other products, is made in several countries by dozens of companies, with each stage of production contributing a different amount to the final value
The real value of the iPod doesn’t lie in its parts or even in putting those parts together. The bulk of the iPod’s value is in the conception and design of the iPod
HEADLINES

7 of 41Copyright © 2011 Worth Publishers· International Economics· Feenstra/Taylor, 2/e.
Cha
pter
1:
Tra
de in
the
Glo
bal E
cono
my
1 International Trade
The Basics of World Trade
The iPod is valued at about $150 when it leaves the dock in China en route to the United States.
It doesn’t really make sense to count the entire $150 iPod as a Chinese export to the United States, as is done in official trade statistics, when only $4 is the value-added in China.
The difference between the value of the iPod when it leaves China and the cost of parts and materials purchased in China and imported from other countries.
8 of 41Copyright © 2011 Worth Publishers· International Economics· Feenstra/Taylor, 2/e.
Cha
pter
1:
Tra
de in
the
Glo
bal E
cono
my
APPLICATION
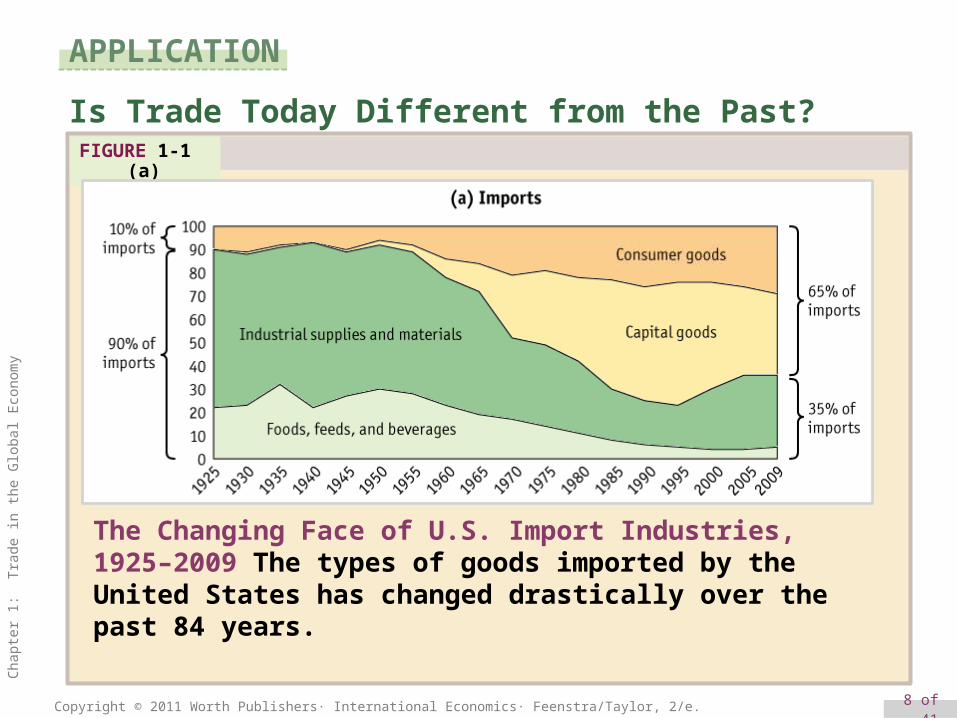
Is Trade Today Different from the Past?FIGURE 1-1 (a)
The Changing Face of U.S. Import Industries, 1925–2009 The types of goods imported by the United States has changed drastically over the past 84 years.

9 of 41Copyright © 2011 Worth Publishers· International Economics· Feenstra/Taylor, 2/e.
Cha
pter
1:
Tra
de in
the
Glo
bal E
cono
my
Is Trade Today Different from the Past?FIGURE 1-1 (b)
The Changing Face of U.S. Export Industries, 1925–2009 The types of exported by the United States has also changed drastically over the past 84 years.
APPLICATION
10 of 41Copyright © 2011 Worth Publishers· International Economics· Feenstra/Taylor, 2/e.
Cha
pter
1:
Tra
de in
the
Glo
bal E
cono
my
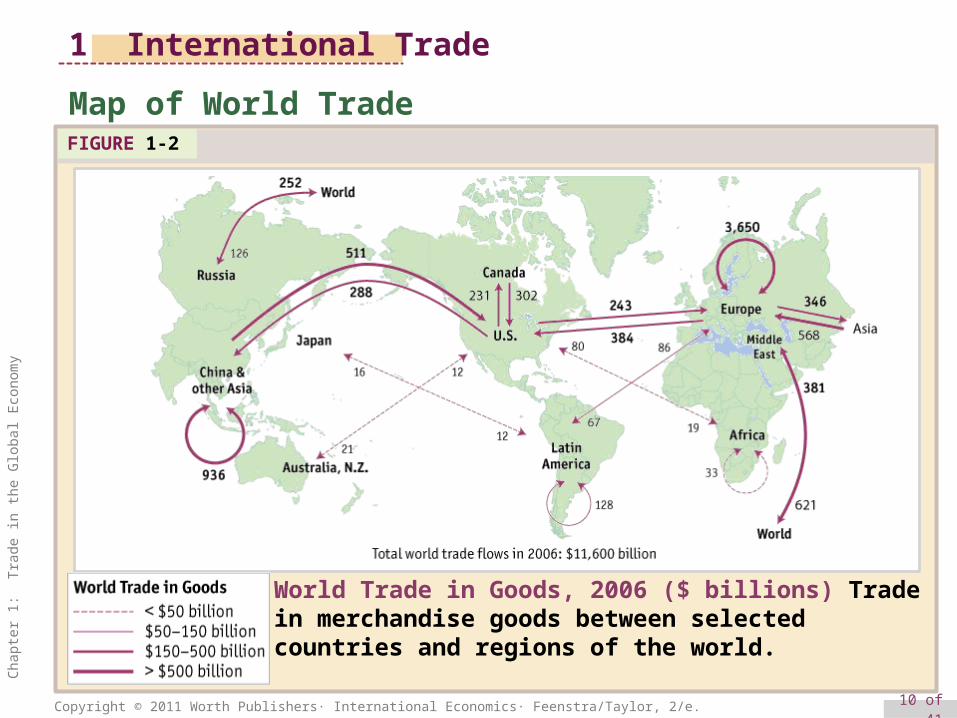
Map of World TradeFIGURE 1-2
World Trade in Goods, 2006 ($ billions) Trade in merchandise goods between selected countries and regions of the world.
1 International Trade

11 of 41Copyright © 2011 Worth Publishers· International Economics· Feenstra/Taylor, 2/e.
Cha
pter
1:
Tra
de in
the
Glo
bal E
cono
my
Map of World Trade
TABLE 1-1
Shares of World Trade, Accounted for by Selected Regions, 2006
European and U.S. Trade
.
1 International Trade
12 of 41Copyright © 2011 Worth Publishers· International Economics· Feenstra/Taylor, 2/e.
Cha
pter
1:
Tra
de in
the
Glo
bal E
cono
my
Map of World Trade
European and U.S. Trade The largest amount of trade shown in Figure 1-2 is the flow of goods within Europe.
Trade between European countries is high because import tariffs (taxes on international trade) are low.
In addition to large trade flows among the European countries, there are also large trade flows between the United States and Europe.
1 International Trade

13 of 41Copyright © 2011 Worth Publishers· International Economics· Feenstra/Taylor, 2/e.
Cha
pter
1:
Tra
de in
the
Glo
bal E
cono
my
Map of World Trade
Trade in the Americas There is also a large amount of trade recorded within the Americas, that is, between North America, Central America, South America, and the Caribbean.
Trade within the Americas is about one-third of trade within Europe, and the vast majority of that trade is within the North American Free Trade Area, consisting of Canada, the United States, and Mexico.
1 International Trade

14 of 41Copyright © 2011 Worth Publishers· International Economics· Feenstra/Taylor, 2/e.
Cha
pter
1:
Tra
de in
the
Glo
bal E
cono
my
Map of World Trade
Trade with Asia All the exports from Asia totaled about $3.1 trillion in 2006, or more than one-quarter (27%) of world trade, as shown in Table 1-1.
Remember that this total includes only trade in goods and omits trade in services, which is becoming increasingly important.
1 International Trade

15 of 41Copyright © 2011 Worth Publishers· International Economics· Feenstra/Taylor, 2/e.
Cha
pter
1:
Tra
de in
the
Glo
bal E
cono
my
Map of World Trade
Other Regions The exports of the Middle East and Russia combined (together with countries around Russia like Azerbaijan, Kazakhstan, etc.) total $1.0 trillion, or another 9% of world trade.
And then there is Africa. The European nations have the closest trade links with Africa, reflecting both their proximity and the former colonial status of some African countries.
1 International Trade

16 of 41Copyright © 2011 Worth Publishers· International Economics· Feenstra/Taylor, 2/e.
Cha
pter
1:
Tra
de in
the
Glo
bal E
cono
my
Trade Compared with GDP
So far, we have discussed the value of trade crossing international borders.
But there is a second way that trade is often reported, and that is as a ratio of trade to a country’s gross domestic product (GDP), the value of all final goods produced in a year.
For the United States, the average value of imports and exports (for goods and services) expressed relative to GDP was 15% in 2008.
1 International Trade

17 of 41Copyright © 2011 Worth Publishers· International Economics· Feenstra/Taylor, 2/e.
Cha
pter
1:
Tra
de in
the
Glo
bal E
cono
my
Trade Compared with GDPTABLE 1-2
Trade/GDP Ratio in 2008 Countries with the highest ratios of trade to GDP tend to be small in economic size. Countries with the lowest ratios of trade to GDP tend to be very large in economic size.
1 International Trade

18 of 41Copyright © 2011 Worth Publishers· International Economics· Feenstra/Taylor, 2/e.
Cha
pter
1:
Tra
de in
the
Glo
bal E
cono
my
Barriers to Trade
The term trade barriers refers to all factors that influence the amount of goods and services shipped across international borders.
1 International Trade

19 of 41Copyright © 2011 Worth Publishers· International Economics· Feenstra/Taylor, 2/e.
Cha
pter
1:
Tra
de in
the
Glo
bal E
cono
my
Barriers to Trade
This diagram shows total trade in merchandise goods and services for each country divided by GDP.
There was a considerable increase in the ratio of trade to GDP between 1890 and 1913. This trend was ended by World War I and the Great Depression
Most of the industrial countries shown did not reach the level of trade prevailing in 1913 until the 1970s.
FIGURE 1-3
1 International Trade
Trade in Goods and Services Relative to GDP
20 of 41Copyright © 2011 Worth Publishers· International Economics· Feenstra/Taylor, 2/e.
Cha
pter
1:
Tra
de in
the
Glo
bal E
cono
my
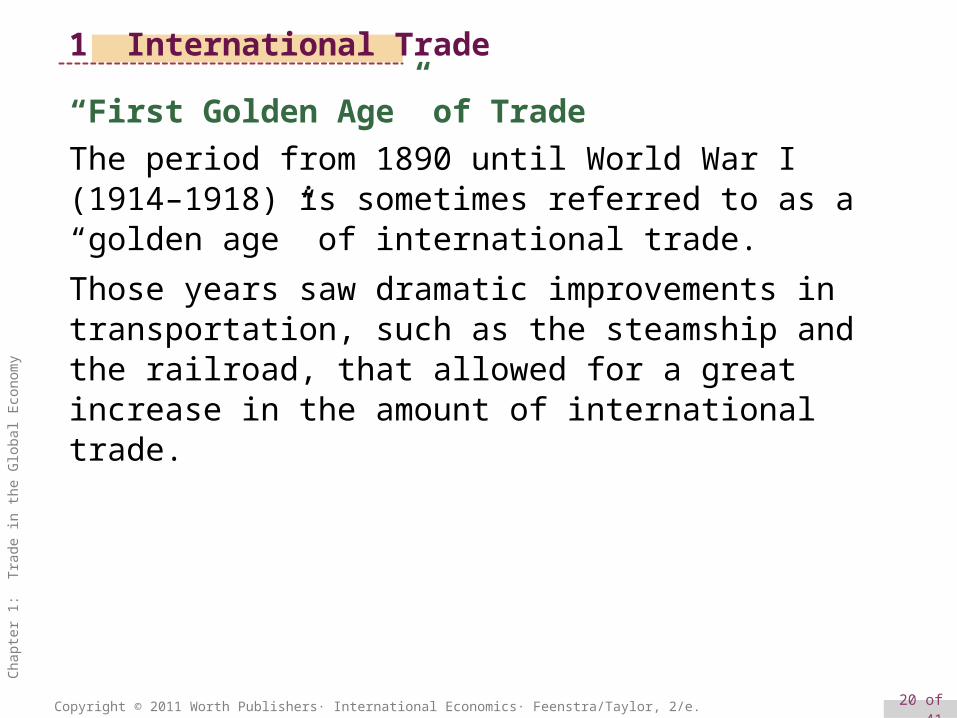
“First Golden Age” of Trade
The period from 1890 until World War I (1914–1918) is sometimes referred to as a “golden age” of international trade.
Those years saw dramatic improvements in transportation, such as the steamship and the railroad, that allowed for a great increase in the amount of international trade.
1 International Trade

21 of 41Copyright © 2011 Worth Publishers· International Economics· Feenstra/Taylor, 2/e.
Cha
pter
1:
Tra
de in
the
Glo
bal E
cono
my
“First Golden Age” of Trade
Interwar Period Signed into law in June 1930, the Smoot-Hawley Tariff Act raised tariffs to as high as 60% on many categories of imports.
These tariffs were applied by the United States to protect farmers and other industries, but they backfired by causing other countries to retaliate.
Canada retaliated by applying high tariffs of its own against the United States; France used import quotas, a limitation on the quantity of an imported good allowed into a country, to restrict imports from the United States.
1 International Trade

22 of 41Copyright © 2011 Worth Publishers· International Economics· Feenstra/Taylor, 2/e.
Cha
pter
1:
Tra
de in
the
Glo
bal E
cono
my
FIGURE 1-4
Average Worldwide Tariffs, 1860–2000 This diagram shows the world average tariff for 35 countries from 1860 to 2000.
Interwar Period“First Golden Age” of Trade
1 International Trade

23 of 41Copyright © 2011 Worth Publishers· International Economics· Feenstra/Taylor, 2/e.
Cha
pter
1:
Tra
de in
the
Glo
bal E
cono
my
“Second Golden Age” of Trade
In addition to the end of World War II and tariff reductions under the General Agreement on Tariffs and Trade, improved transportation costs contributed to the growth in trade.
The shipping container, invented in 1956, allowed goods to be moved by ship, rail, and truck more cheaply than before.
World trade grew steadily after 1950 in dollar terms and as a ratio to GDP. For this reason, the period after 1950 is called the “second golden age” of trade and globalization.
1 International Trade

24 of 41Copyright © 2011 Worth Publishers· International Economics· Feenstra/Taylor, 2/e.
Cha
pter
1:
Tra
de in
the
Glo
bal E
cono
my
50 years ago Malcom McLean, an entrepreneur from North Carolina, loaded a ship with 58 35-foot containers and sailed from Newark, N.J., to Houston.
McLean was the first to design a transportation system around the packaging of cargo in huge metal boxes that could be loaded and unloaded by cranes.
HEADLINESA Sea Change in Shipping 50 Years Ago
A fully loaded container ship can carry thousands of containers.
Replacing break-bulk with cargo containers dramatically reduced shipping costs, reinvigorating markets and fueling the world economy.

25 of 41Copyright © 2011 Worth Publishers· International Economics· Feenstra/Taylor, 2/e.
Cha
pter
1:
Tra
de in
the
Glo
bal E
cono
my
The Financial CrisisFIGURE 1-5
Change in the Value of Trade, 2007–2009 (percent)
As a result of a worldwide financial crisis and economic recession, the value of trade plummeted between early 2008 and early 2009.
1 International Trade

26 of 41Copyright © 2011 Worth Publishers· International Economics· Feenstra/Taylor, 2/e.
Cha
pter
1:
Tra
de in
the
Glo
bal E
cono
my
2 Migration and Foreign Direct Investment Map of MigrationFIGURE 1-6
Foreign-Born Migrants, 2005 (millions) This figure shows the number of foreign-born migrants living in selected countries and regions of the world for 2005 in millions of people.

27 of 41Copyright © 2011 Worth Publishers· International Economics· Feenstra/Taylor, 2/e.
Cha
pter
1:
Tra
de in
the
Glo
bal E
cono
my
Map of Migration
European and U.S. Immigration Prior to 2004 the European Union (EU) consisted of 15 countries in western Europe, and labor mobility was very open.
After 10 more countries joined the EU on May 1, 2004, (and 2 more countries joined in 2007) a large difference in per capita income and wages in these countries created a strong incentive for labor migration.
The per capita incomes of these new countries were only about one-quarter of the average per capita incomes in those western European countries that were already EU members.
2 Migration and Foreign Direct Investment

28 of 41Copyright © 2011 Worth Publishers· International Economics· Feenstra/Taylor, 2/e.
Cha
pter
1:
Tra
de in
the
Glo
bal E
cono
my
Map of Migration
European and U.S. Immigration
In the United States, the concern that immigration will drive down wages applies to Mexican migration and is amplified by the exceptionally high number of illegal immigrants.
2 Migration and Foreign Direct Investment

29 of 41Copyright © 2011 Worth Publishers· International Economics· Feenstra/Taylor, 2/e.
Cha
pter
1:
Tra
de in
the
Glo
bal E
cono
my
Map of Foreign Direct InvestmentFIGURE 1-7
Stock of Foreign Direct Investment, 2006 ($ billions) This figure shows the stock of foreign direct investment between selected countries and regions of the world for 2006 in billions of dollars.
2 Migration and Foreign Direct Investment

30 of 41Copyright © 2011 Worth Publishers· International Economics· Feenstra/Taylor, 2/e.
Cha
pter
1:
Tra
de in
the
Glo
bal E
cono
my
Map of Foreign Direct Investment
The majority of world flows of foreign direct investment occur between industrial countries.
In 2006 more than one-third of the world flows of FDI were within Europe or between Europe and the United States, and 90% of the world flows of FDI were into or out of the OECD countries.
2 Migration and Foreign Direct Investment

31 of 41Copyright © 2011 Worth Publishers· International Economics· Feenstra/Taylor, 2/e.
Cha
pter
1:
Tra
de in
the
Glo
bal E
cono
my
Map of Foreign Direct Investment
Horizontal FDI The majority of foreign direct investment occurs between industrial countries, when a firm from one industrial country owns a company in another industrial country. We refer to these flows between industrial countries as horizontal FDI.
Vertical FDI The other form of foreign direct investment occurs when a firm from an industrial country owns a plant in a developing country, which we call vertical FDI. Low wages are the principal reasons that firms shift production abroad to developing countries.
2 Migration and Foreign Direct Investment

32 of 41Copyright © 2011 Worth Publishers· International Economics· Feenstra/Taylor, 2/e.
Cha
pter
1:
Tra
de in
the
Glo
bal E
cono
my
Map of Foreign Direct Investment
European and U.S. FDI The largest stocks of FDI are
within Europe; these stocks amounted to $5.6 trillion in 2006, or nearly one-half of the world total.
FDI in the Americas Brazil and Mexico are two of the largest recipients of FDI among developing countries, after China.
2 Migration and Foreign Direct Investment
FDI with Asia China has become the largest recipient country for FDI in Asia and the fourth largest recipient of FDI in the world.

33 of 41Copyright © 2011 Worth Publishers· International Economics· Feenstra/Taylor, 2/e.
Cha
pter
1:
Tra
de in
the
Glo
bal E
cono
my
1. The trade balance of a country is the difference between the value of its exports and the value of its imports, and is determined by macroeconomic conditions in the country.
K e y T e r m KEY POINTS

34 of 41Copyright © 2011 Worth Publishers· International Economics· Feenstra/Taylor, 2/e.
Cha
pter
1:
Tra
de in
the
Glo
bal E
cono
my
2. The type of goods being traded between countries has changed from the period before World War I, when standardized goods (raw materials and basic processed goods like steel) were predominant. Today, the majority of trade occurs in highly processed consumer and capital goods, which might cross borders several times during the manufacturing process.
K e y T e r m KEY POINTS

35 of 41Copyright © 2011 Worth Publishers· International Economics· Feenstra/Taylor, 2/e.
Cha
pter
1:
Tra
de in
the
Glo
bal E
cono
my
3. A large portion of international trade is between industrial countries. Trade within Europe and between Europe and the United States accounts for over one-third of world trade.
K e y T e r m KEY POINTS

36 of 41Copyright © 2011 Worth Publishers· International Economics· Feenstra/Taylor, 2/e.
Cha
pter
1:
Tra
de in
the
Glo
bal E
cono
my
4. Many of the trade models we study emphasize the differences between countries, but it is also possible to explain trade between countries that are similar. Similar countries will trade different varieties of goods with each other.
K e y T e r m KEY POINTS

37 of 41Copyright © 2011 Worth Publishers· International Economics· Feenstra/Taylor, 2/e.
Cha
pter
1:
Tra
de in
the
Glo
bal E
cono
my
5. Larger countries tend to have smaller shares of trade relative to GDP because so much of their trade occurs internally. Hong Kong (China) and Malaysia have ratios of trade to GDP that exceed 100%, whereas the United States’ ratio of trade to GDP in 2008 was 15%.
K e y T e r m KEY POINTS

38 of 41Copyright © 2011 Worth Publishers· International Economics· Feenstra/Taylor, 2/e.
Cha
pter
1:
Tra
de in
the
Glo
bal E
cono
my
6. The majority of world migration occurs into developing countries as a result of restrictions on immigration into wealthier, industrial countries.
K e y T e r m KEY POINTS
39 of 41Copyright © 2011 Worth Publishers· International Economics· Feenstra/Taylor, 2/e.
Cha
pter
1:
Tra
de in
the
Glo
bal E
cono
my
7. International trade in goods and services acts as a substitute for migration and allows workers to improve their standard of living through working in export industries, even when they cannot migrate to earn higher incomes.
K e y T e r m KEY POINTS

40 of 41Copyright © 2011 Worth Publishers· International Economics· Feenstra/Taylor, 2/e.
Cha
pter
1:
Tra
de in
the
Glo
bal E
cono
my
8. The majority of world flows of foreign direct investment occur between industrial countries. In 2006 more than one-third of the world flows of FDI were within Europe or between Europe and the United States, and 90% of the world flows of FDI were into or out of the OECD countries.
K e y T e r m KEY POINTS

41 of 41Copyright © 2011 Worth Publishers· International Economics· Feenstra/Taylor, 2/e.
Cha
pter
1:
Tra
de in
the
Glo
bal E
cono
my
international trade
migration
foreign direct investment (FDI)
export
import
trade balance
K e y T e r m KEY TERMS
trade surplus
trade deficit
bilateral trade balance
value-added
offshoring
import tariffs
gross domestic product (GDP)
trade barriers
import quotas
horizontal FDI
vertical FDI
Related Documents


![White Paper on International Economy and Trade …White Paper on International Economy and Trade 2019 [Outline] July 2019 Trade Policy Bureau Ministry of Economy, Trade and Industry1](https://static.cupdf.com/doc/110x72/5e9cc27f2dba9e66db7ea99a/white-paper-on-international-economy-and-trade-white-paper-on-international-economy.jpg)


