1 Objective Compare of two matched-paired means using two samples from each population. Hypothesis Tests and Confidence Intervals of two dependent means use the t-distribution Section 9.4 Inferences About Two Means (Matched Pairs)

Welcome message from author
This document is posted to help you gain knowledge. Please leave a comment to let me know what you think about it! Share it to your friends and learn new things together.
Transcript
1
Objective
Compare of two matched-paired means using two samples from each population.
Hypothesis Tests and Confidence Intervals of two dependent means use the t-distribution
Section 9.4Inferences About Two Means
(Matched Pairs)
2
Definition
Two samples are dependent if there is some relationship between the two samples so that each value in one sample is paired with a corresponding value in the other sample.
Two samples can be treated as the matched pairs of values.
3
Examples
• Blood pressure of patients before they are given medicine and after they take it.
• Predicted temperature (by Weather Forecast) and the actual temperature.
• Heights of selected people in the morning and their heights by night time.
• Test scores of selected students in Calculus-I and their scores in Calculus-II.
4
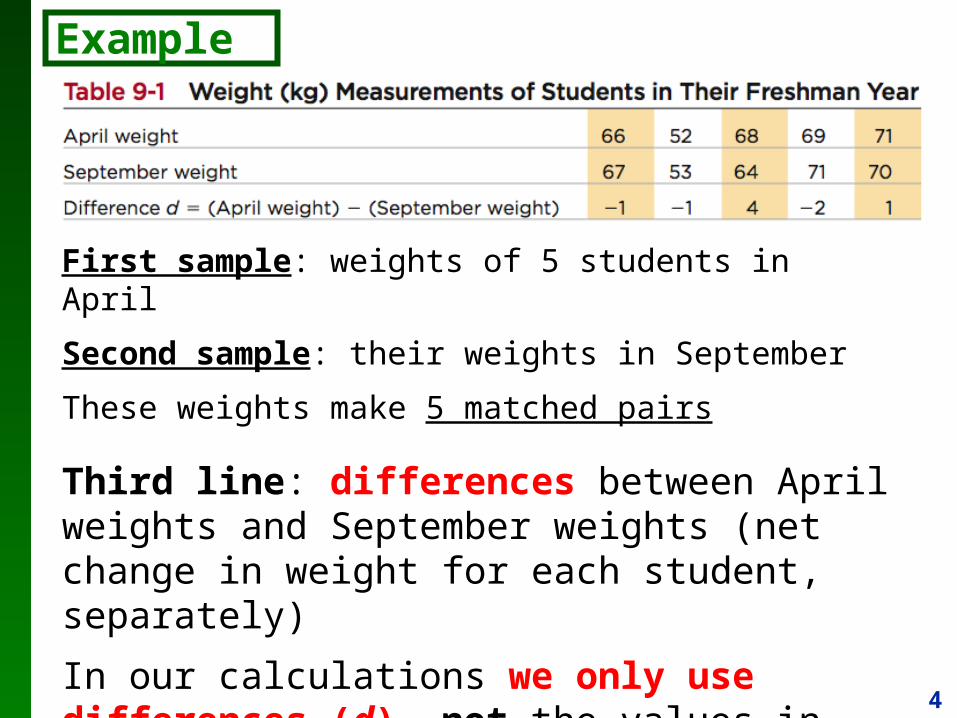
Example 1
First sample: weights of 5 students in April
Second sample: their weights in September
These weights make 5 matched pairs
Third line: differences between April weights and September weights (net change in weight for each student, separately)
In our calculations we only use differences (d), not the values in the two samples.
5
Notation
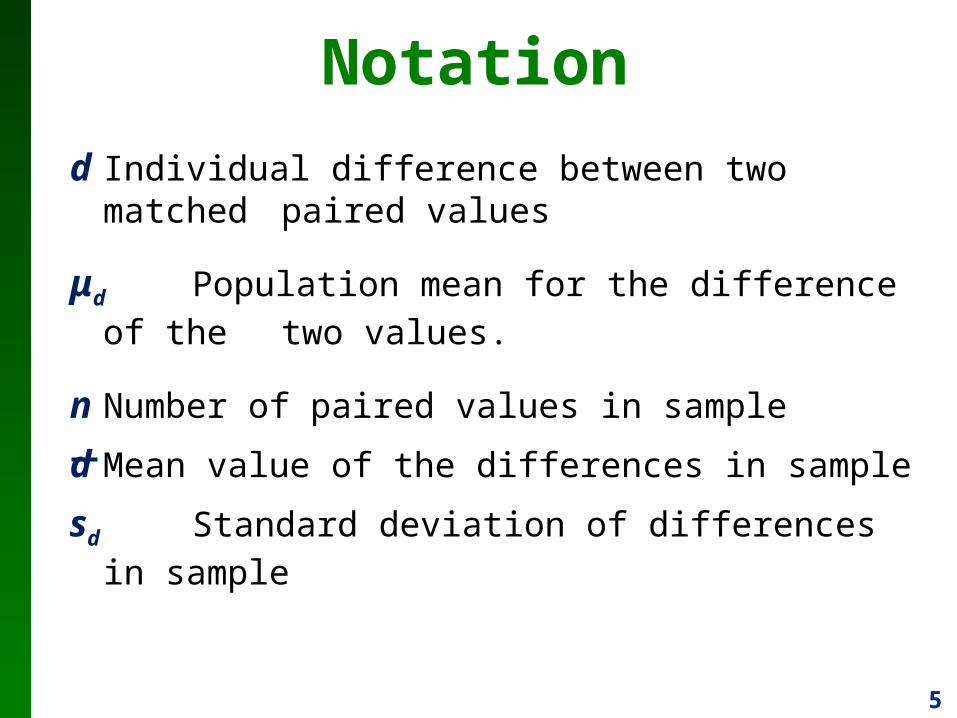
d Individual difference between two matched paired values
μd Population mean for the difference of the two values.
n Number of paired values in sample
d Mean value of the differences in sample
sd Standard deviation of differences in sample
6
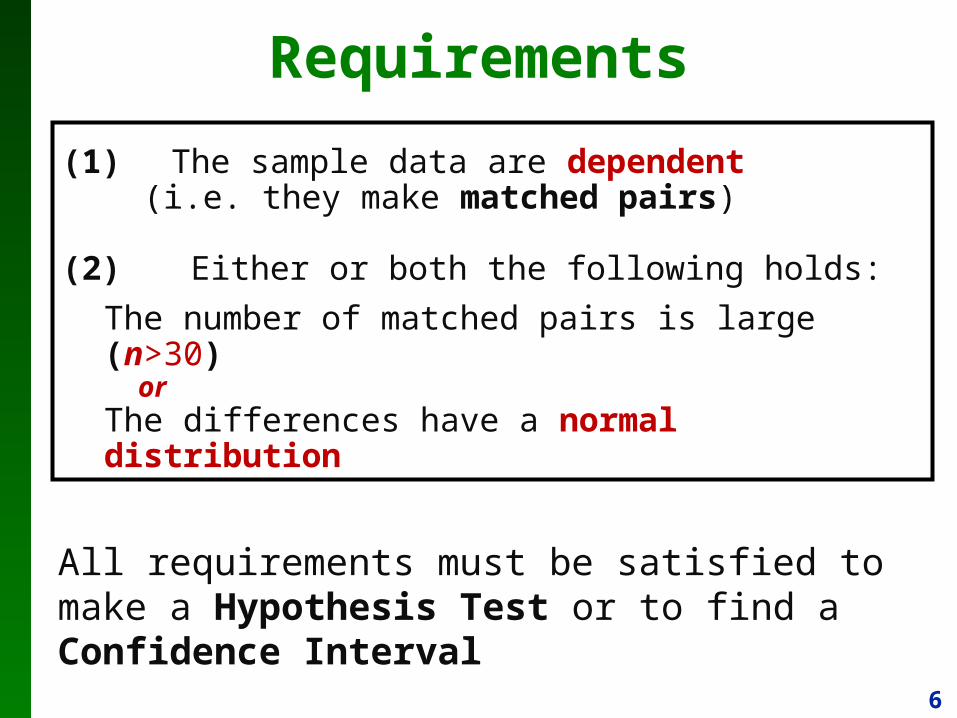
(1) The sample data are dependent (i.e. they make matched pairs)
(2) Either or both the following holds:
The number of matched pairs is large (n>30) orThe differences have a normal distribution
Requirements
All requirements must be satisfied to make a Hypothesis Test or to find a Confidence Interval
7
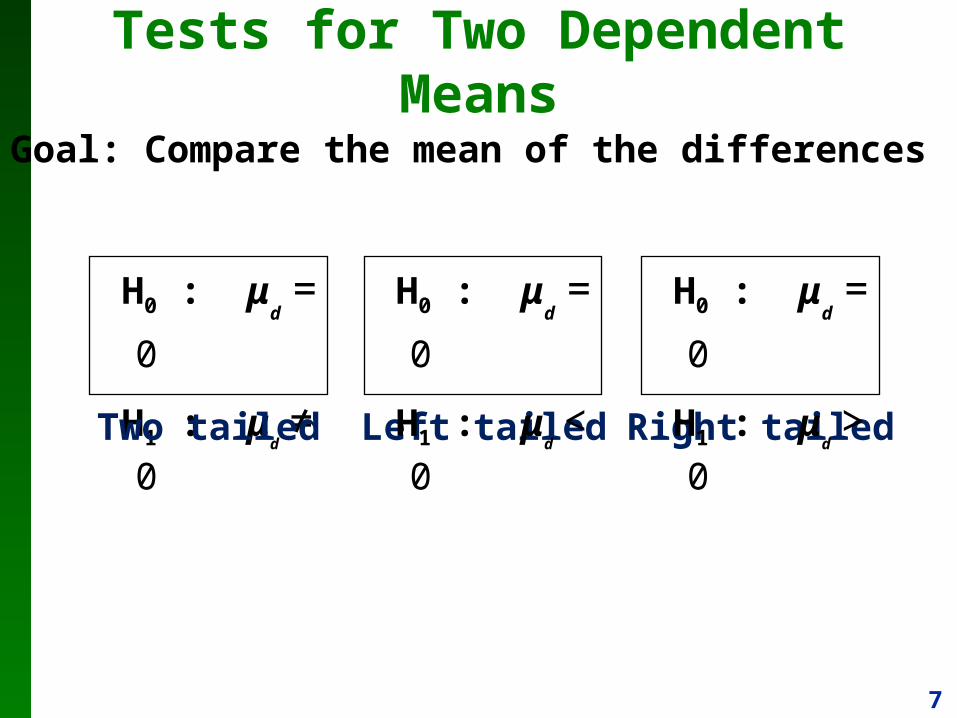
Tests for Two Dependent Means
Goal: Compare the mean of the differences
H0 : μd =
0
H1 : μd ≠ 0
Two tailed Left tailed Right tailed
H0 : μd =
0
H1 : μd < 0
H0 : μd =
0
H1 : μd > 0
8
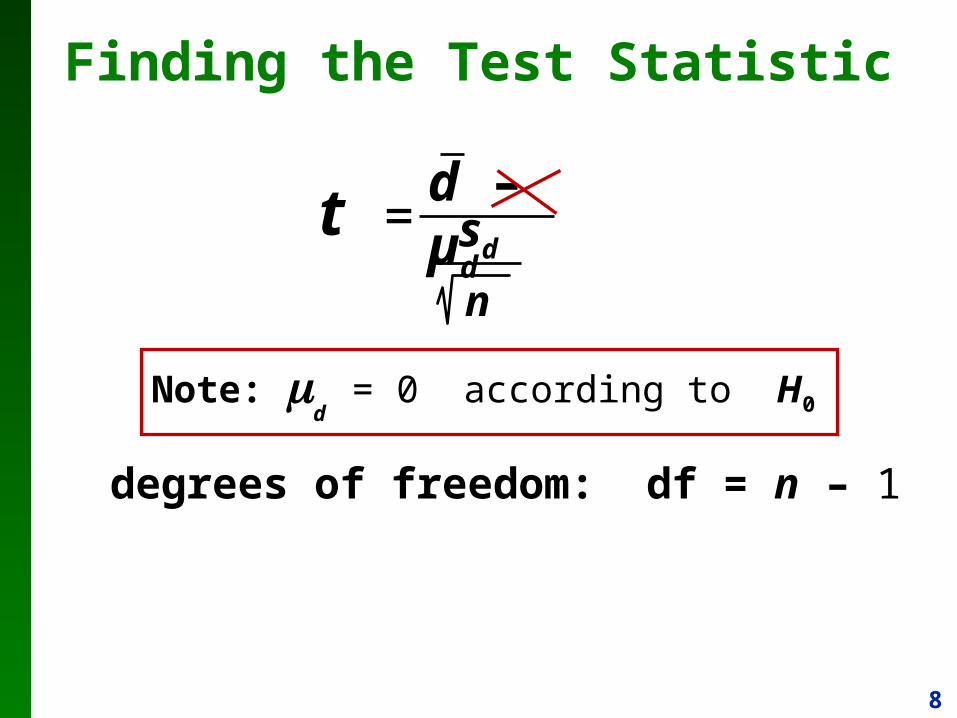
t = d – µdsdn
degrees of freedom: df = n – 1
Note: d
= 0 according to H0
Finding the Test Statistic
9
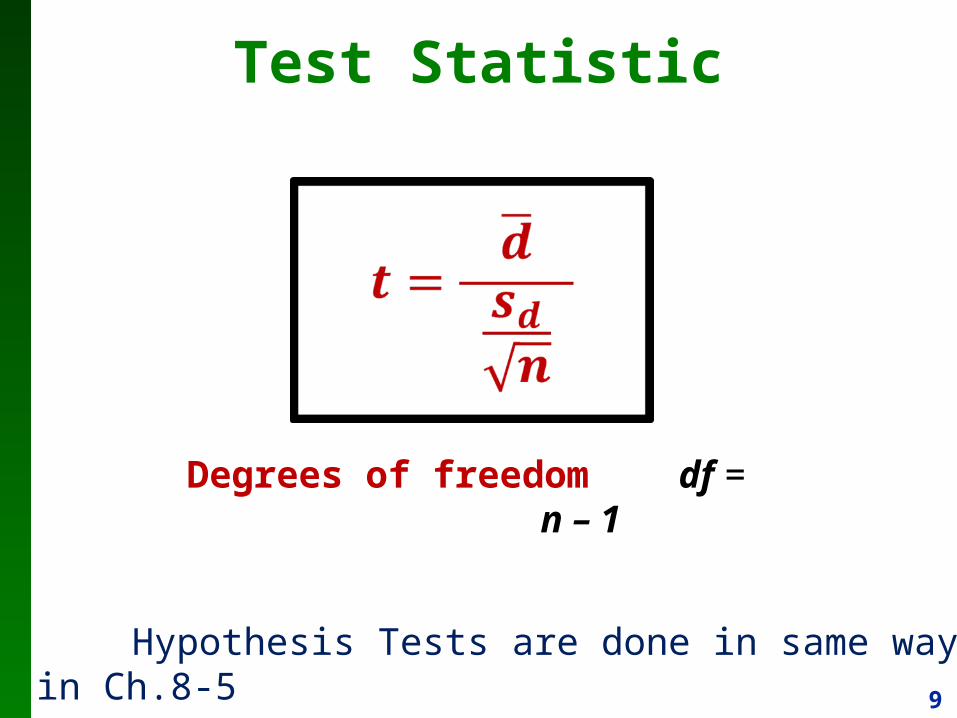
Test Statistic
Note: Hypothesis Tests are done in same way as in Ch.8-5
Degrees of freedom df = n – 1
10
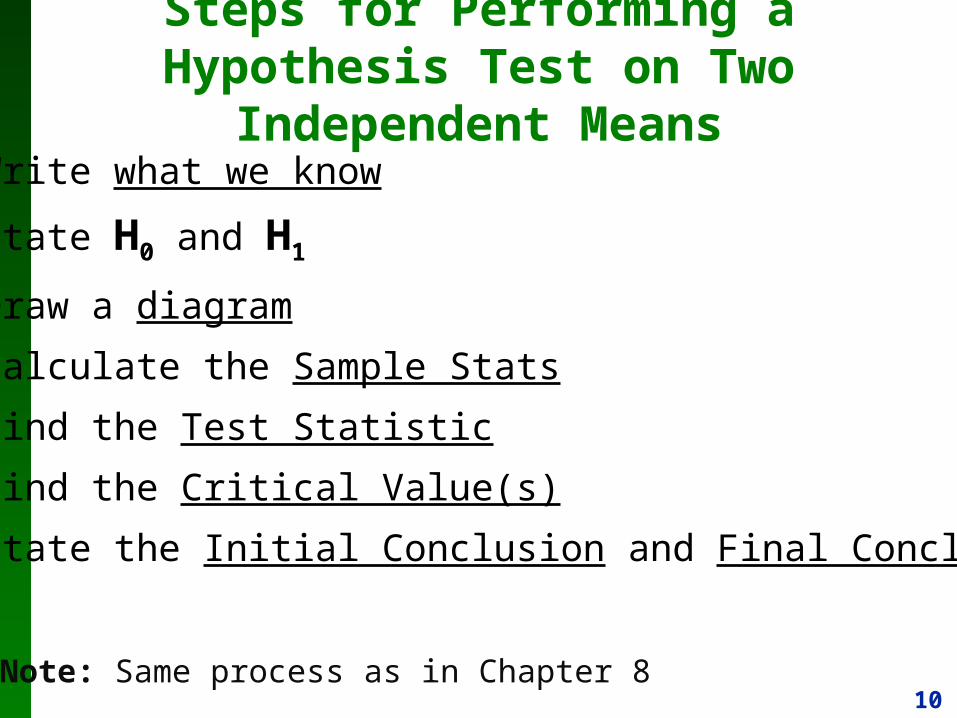
Steps for Performing a Hypothesis Test on Two Independent Means
• Write what we know
• State H0 and H1
• Draw a diagram
• Calculate the Sample Stats
• Find the Test Statistic
• Find the Critical Value(s)
• State the Initial Conclusion and Final Conclusion
Note: Same process as in Chapter 8
11
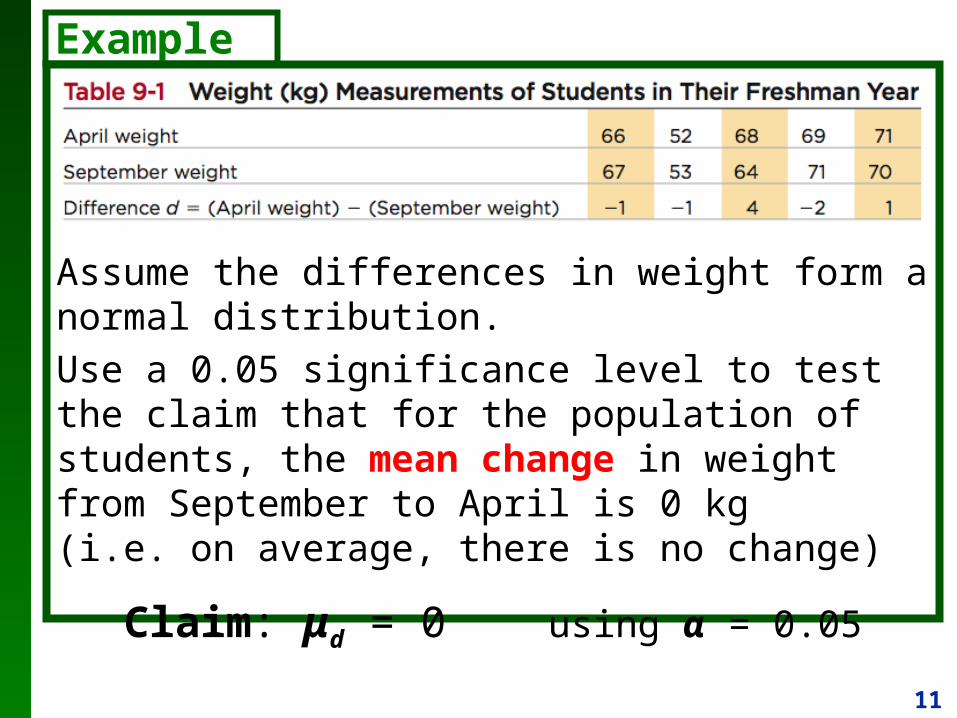
Example 1
Assume the differences in weight form a normal distribution.
Use a 0.05 significance level to test the claim that for the population of students, the mean change in weight from September to April is 0 kg (i.e. on average, there is no change)
Claim: μd = 0 using α = 0.05
12
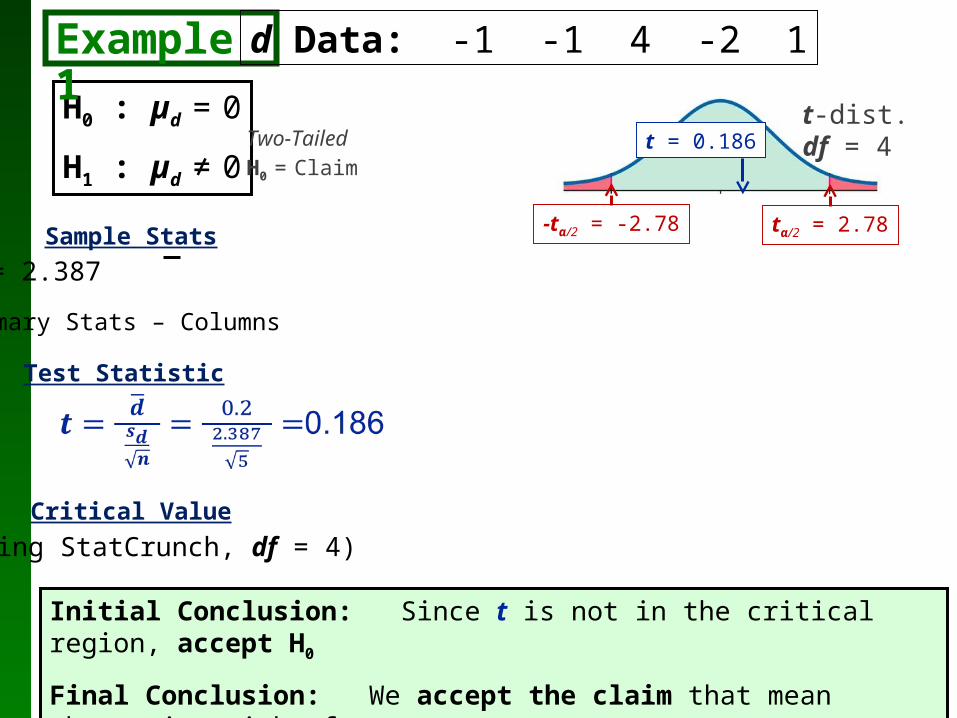
H0 : µd = 0
H1 : µd ≠ 0t = 0.186
tα/2 = 2.78
t-dist.df = 4
Test Statistic
Critical Value
Initial Conclusion: Since t is not in the critical region, accept H0
Final Conclusion: We accept the claim that mean change in weight from
September to April is 0 kg.
-tα/2 = -2.78
Example 1
tα/2 = t0.025 = 2.78 (Using StatCrunch, df = 4)
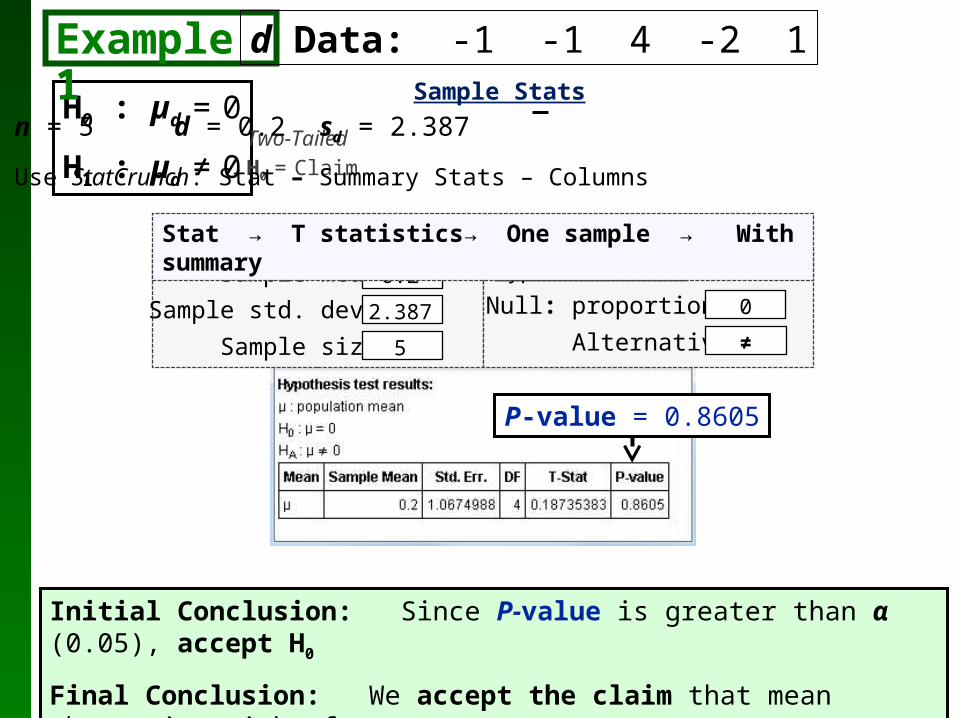
d Data: -1 -1 4 -2 1
Sample Stats
n = 5 d = 0.2 sd = 2.387
Use StatCrunch: Stat – Summary Stats – Columns
Two-TailedH0 = Claim
13
H0 : µd = 0
H1 : µd ≠ 0Two-TailedH0 = Claim
Initial Conclusion: Since P-value is greater than α (0.05), accept H0
Final Conclusion: We accept the claim that mean change in weight from
September to April is 0 kg.
Example 1 d Data: -1 -1 4 -2 1Sample Stats
n = 5 d = 0.2 sd = 2.387
Use StatCrunch: Stat – Summary Stats – Columns
Null: proportion=
Alternative
Sample mean:
Sample std. dev.:
Sample size:
● Hypothesis Test0.2
2.387
5
0
≠
P-value = 0.8605
Stat → T statistics→ One sample → With summary
14
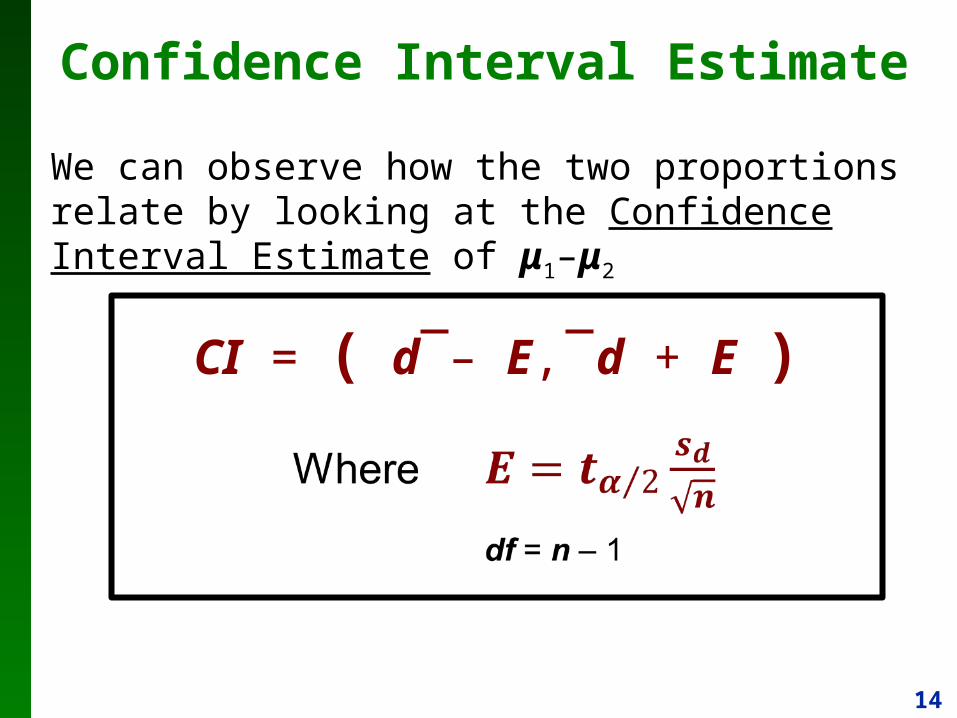
Confidence Interval Estimate
We can observe how the two proportions relate by looking at the Confidence Interval Estimate of μ1–μ2
CI = ( d – E, d + E )
15
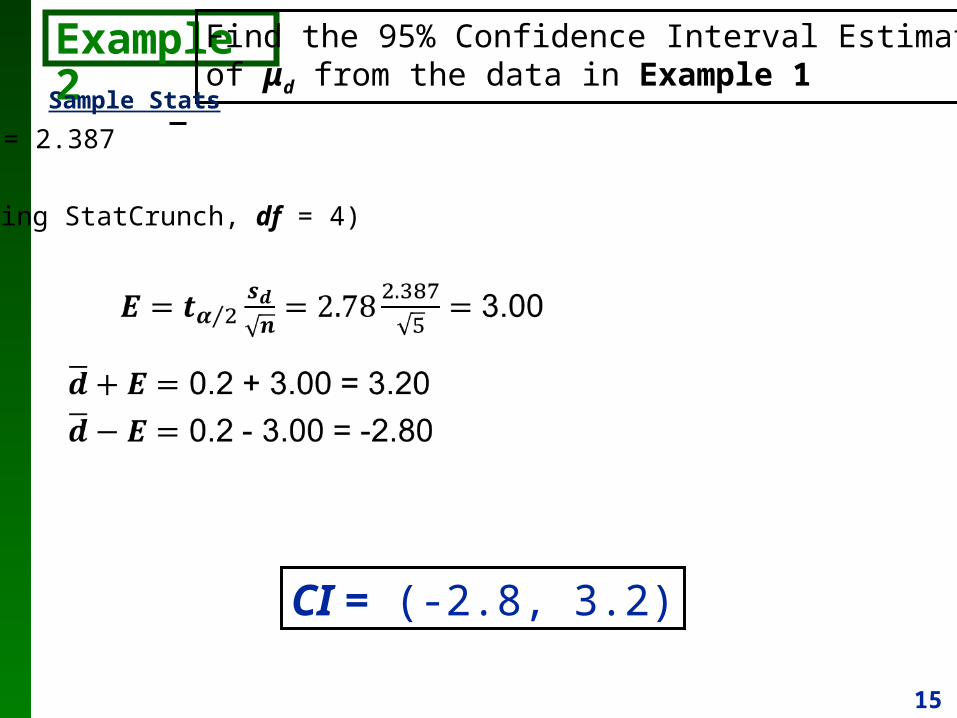
Example 2 Find the 95% Confidence Interval Estimate of μd from the data in Example 1
Sample Stats
n = 5 d = 0.2 sd = 2.387
CI = (-2.8, 3.2)
tα/2 = t0.025 = 2.78 (Using StatCrunch, df = 4)
16
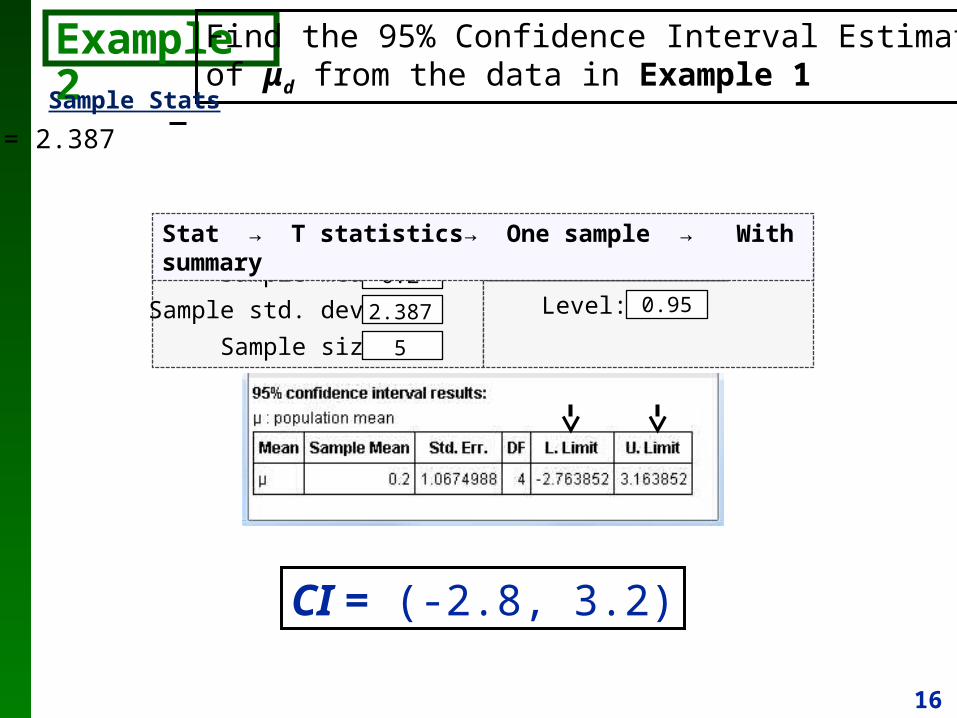
Example 2 Find the 95% Confidence Interval Estimate of μd from the data in Example 1
Sample Stats
n = 5 d = 0.2 sd = 2.387
Level:Sample mean:
Sample std. dev.:
Sample size:
● Confidence Interval0.2
2.387
5
0.95
Stat → T statistics→ One sample → With summary
CI = (-2.8, 3.2)

17
18
Objective
Compare of two population variances using two samples from each population.
Hypothesis Tests and Confidence Intervals of two variances use the F-distribution
Section 9.5Comparing Variation in Two Samples
19
(1) The two populations are independent
(2) The two samples are random samples
(3) The two populations are normally distributed(Very strict!)
Requirements
All requirements must be satisfied to make a Hypothesis Test or to find a Confidence Interval
20
Important
The first sample must have a larger sample standard deviation s1 than the second sample. i.e. we must have
s1 ≥ s2
If this is not so, i.e. if s1 < s2 , then we will need to switch the indices 1 and 2
21
Notationσ1 First population standard deviation
s1 First sample standard deviation
n1 First sample size
σ2 Second population standard deviation
s2 Second sample standard deviation
n2 Second sample size
Note: Use index 1 on sample/population with the larger sample standard deviation (s)
22
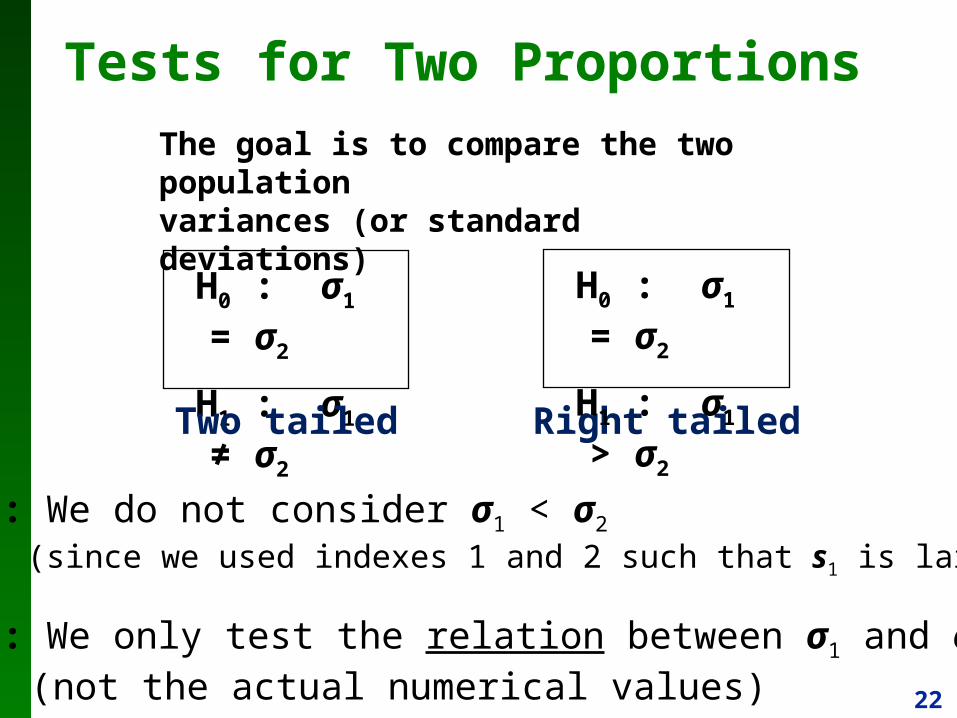
Tests for Two Proportions
H0 : σ1 = σ2
H1 : σ1 ≠ σ2
Two tailed Right tailed
Note: We do not consider σ1 < σ2
(since we used indexes 1 and 2 such that s1 is larger)
Note: We only test the relation between σ1 and σ2
(not the actual numerical values)
The goal is to compare the two population variances (or standard deviations)
H0 : σ1 = σ2
H1 : σ1 > σ2
23
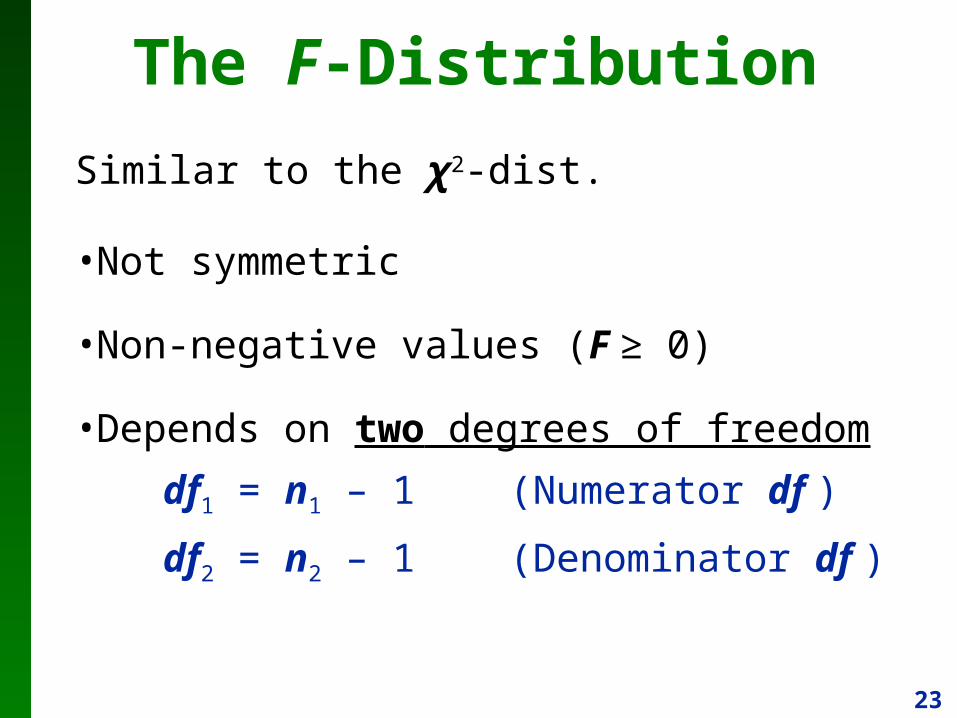
The F-Distribution
Similar to the χ2-dist.
•Not symmetric
•Non-negative values (F ≥ 0)
•Depends on two degrees of freedom
df1 = n1 – 1 (Numerator df )
df2 = n2 – 1 (Denominator df )
24
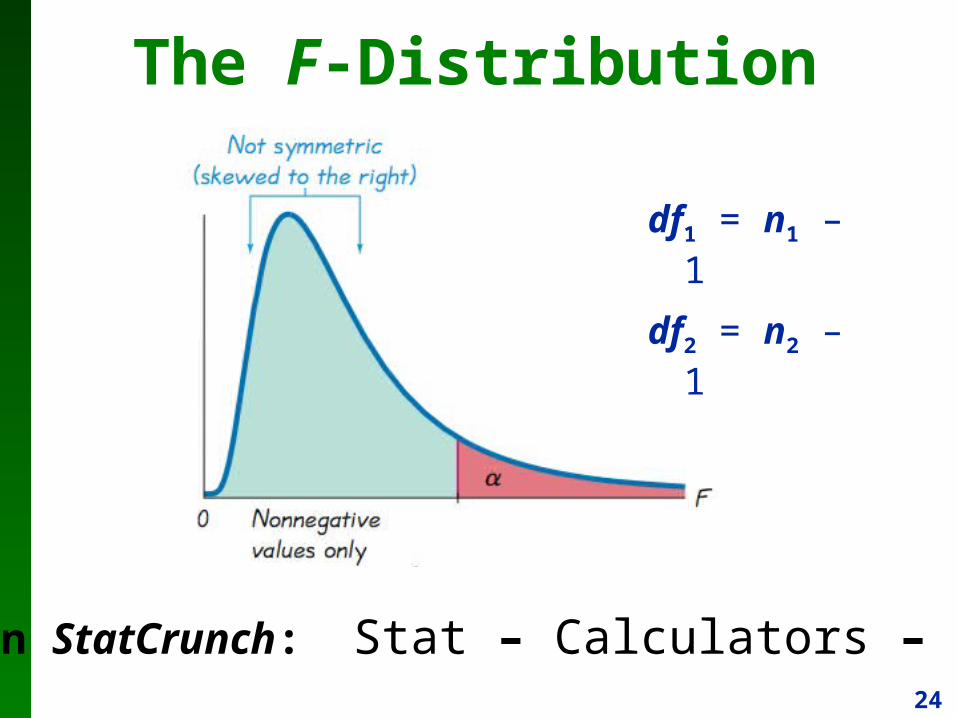
The F-Distribution
On StatCrunch: Stat – Calculators – F
df1 = n1 – 1
df2 = n2 – 1
25
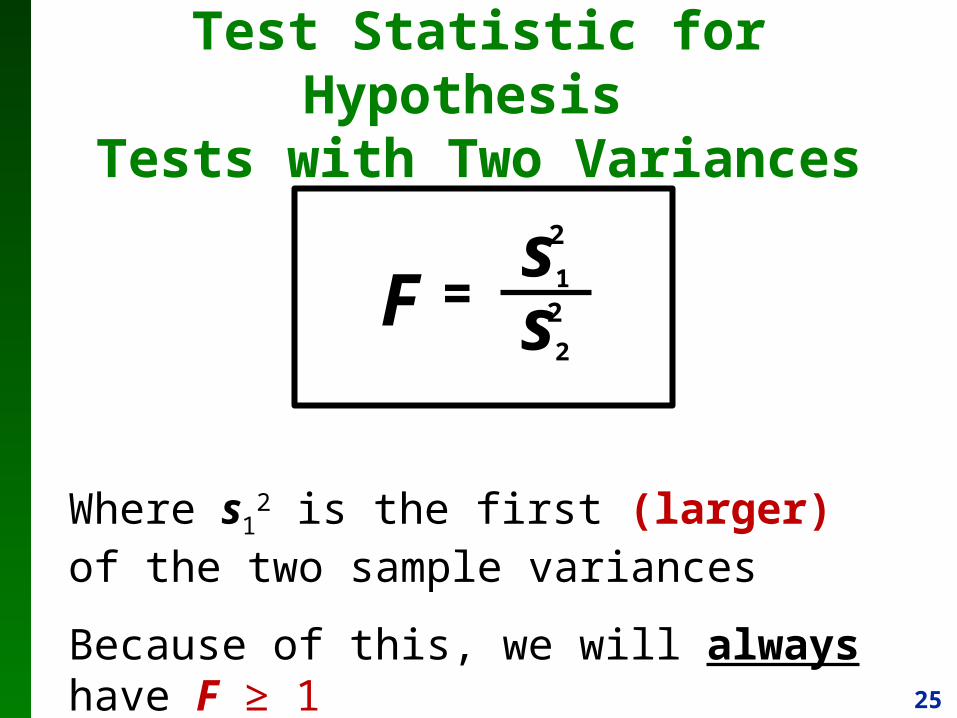
s1F = s2
2
2
Test Statistic for Hypothesis Tests with Two Variances
Where s12 is the first (larger) of the two sample variances
Because of this, we will always have F ≥ 1
26
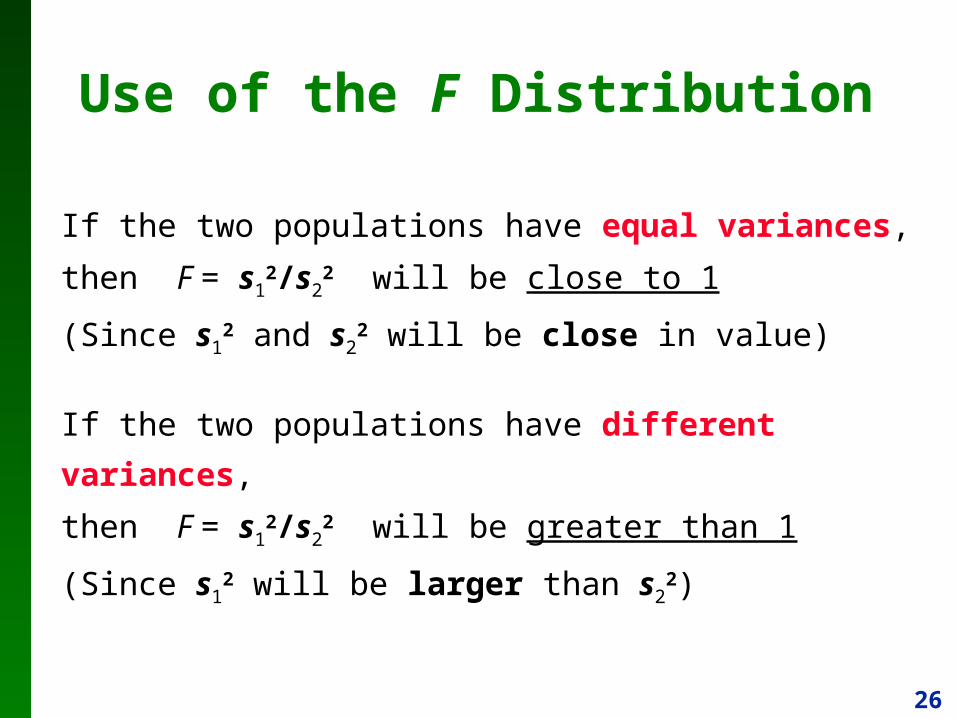
If the two populations have equal variances,
then F = s12/s2
2 will be close to 1
(Since s12 and s2
2 will be close in value)
If the two populations have different variances,
then F = s12/s2
2 will be greater than 1
(Since s12 will be larger than s2
2)
Use of the F Distribution
27
Conclusions from the F-Distribution
Values of F close to 1 are evidence in favor
of the claim that the two variances are equal.
Large values of F, are evidence against this
claim (i.e. it suggest there is some difference
between the two)
28
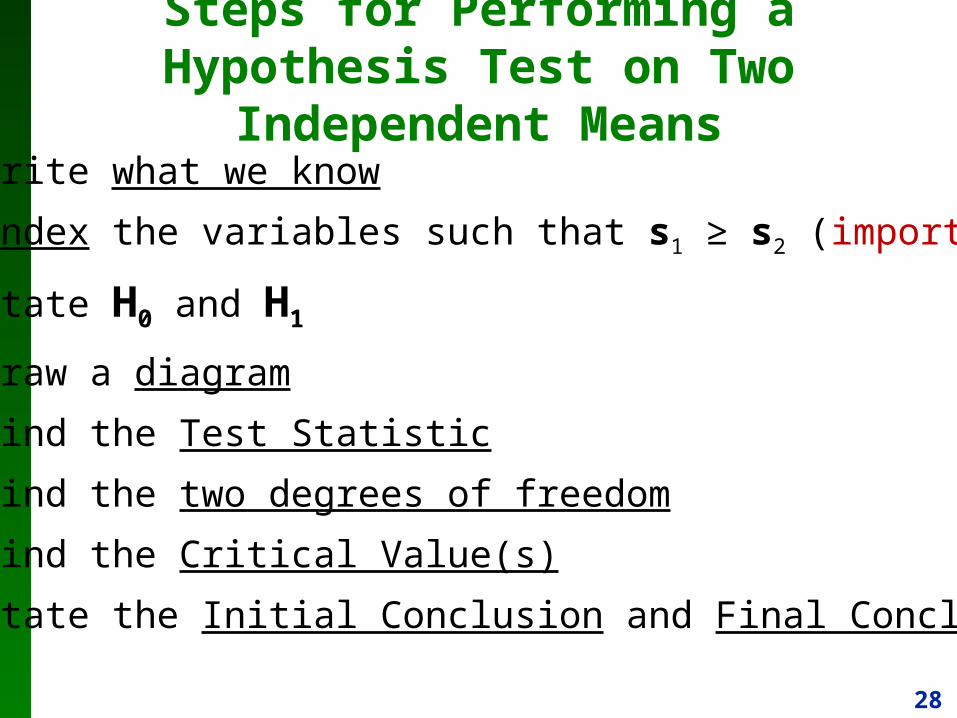
Steps for Performing a Hypothesis Test on Two Independent Means
• Write what we know
• Index the variables such that s1 ≥ s2 (important!)
• State H0 and H1
• Draw a diagram
• Find the Test Statistic
• Find the two degrees of freedom
• Find the Critical Value(s)
• State the Initial Conclusion and Final Conclusion
29
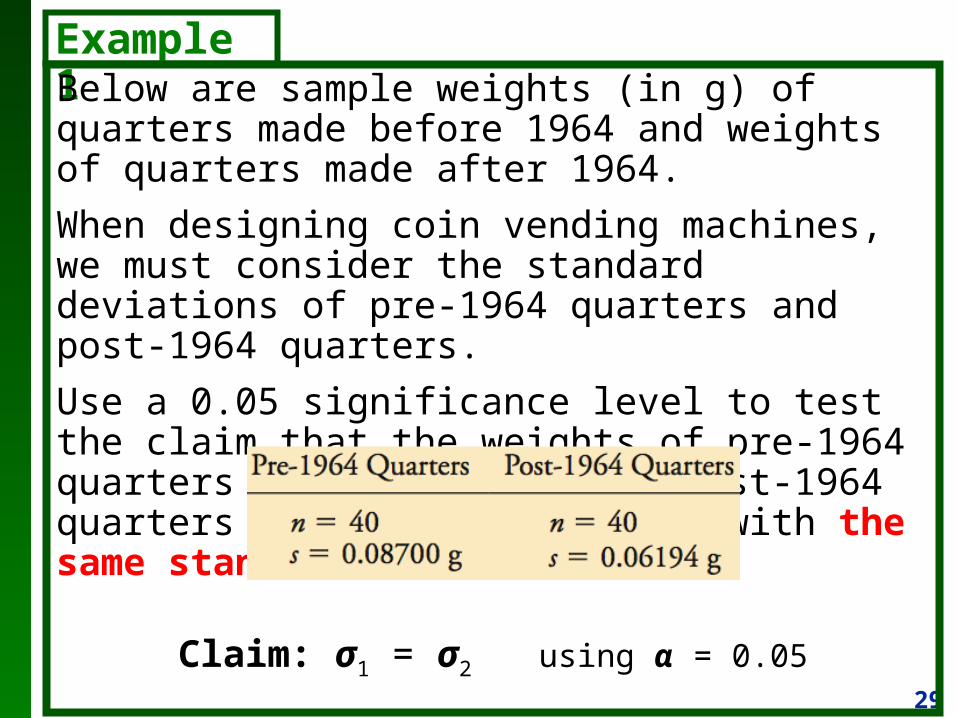
Example 1Below are sample weights (in g) of quarters made before 1964 and weights of quarters made after 1964.
When designing coin vending machines, we must consider the standard deviations of pre-1964 quarters and post-1964 quarters.
Use a 0.05 significance level to test the claim that the weights of pre-1964 quarters and the weights of post-1964 quarters are from populations with the same standard deviation.
Claim: σ1 = σ2 using α = 0.05
30
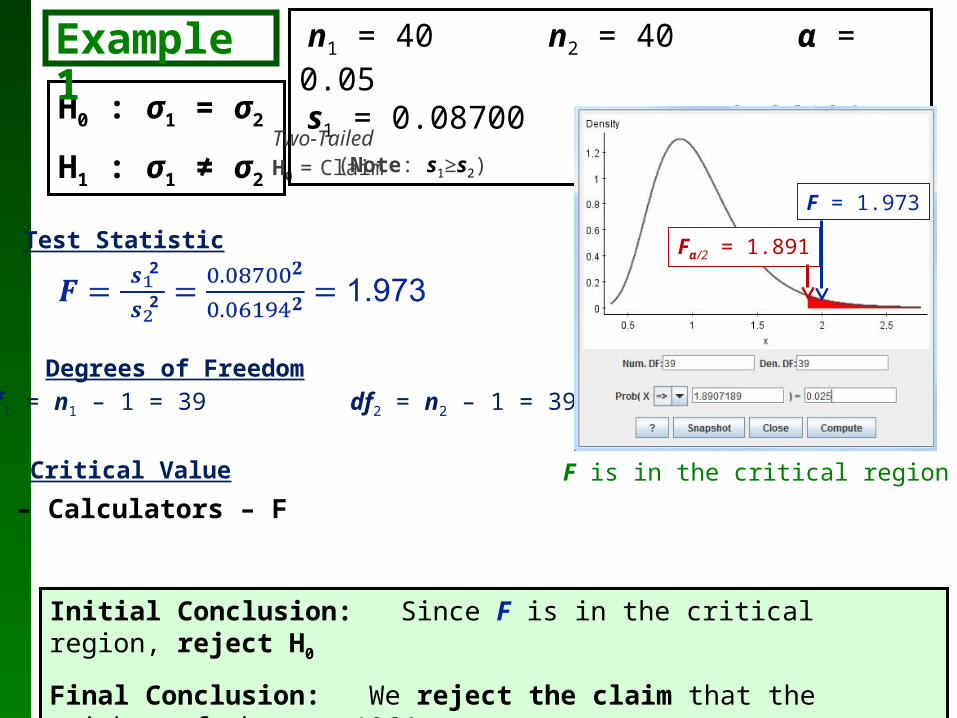
H0 : σ1 = σ2
H1 : σ1 ≠ σ2
Test Statistic
Critical Value
Initial Conclusion: Since F is in the critical region, reject H0
Final Conclusion: We reject the claim that the weights of the pre-1964 and post-1964 quarters have the same standard
deviation
Example 1
Using StatCrunch: Stat – Calculators – F
Fα/2 = F0.025 = 1.891
Two-TailedH0 = Claim
n1 = 40 n2 = 40 α = 0.05 s1 = 0.08700 s2 = 0.06194 (Note: s1≥s2)
2
2
Degrees of Freedomdf1 = n1 – 1 = 39 df2 = n2 – 1 = 39
Fα/2 = 1.891
F = 1.973
F is in the critical region
31
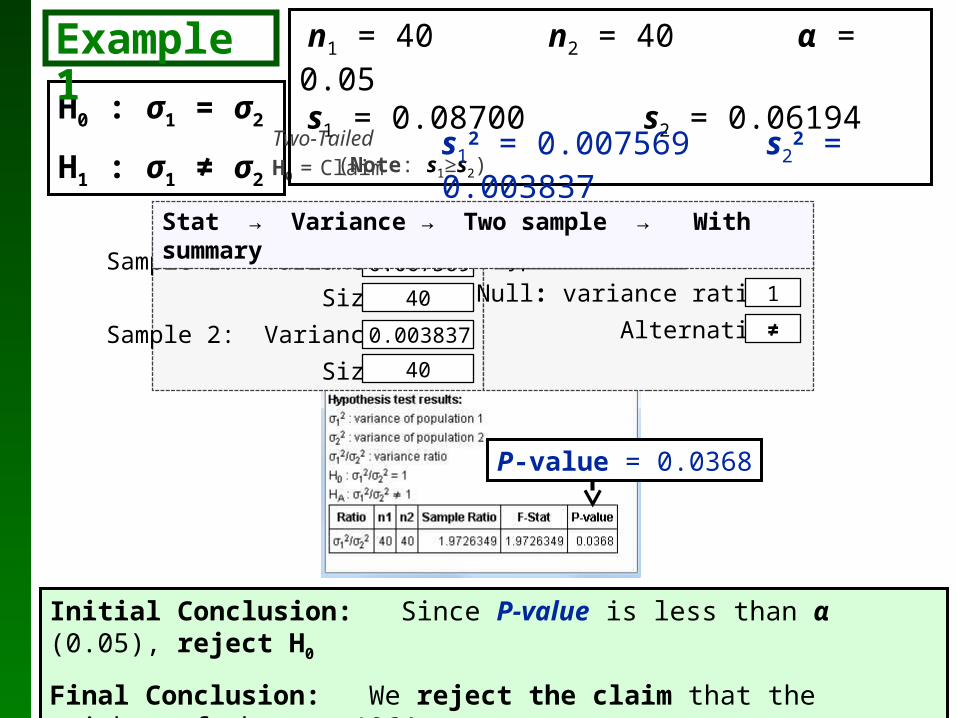
H0 : σ1 = σ2
H1 : σ1 ≠ σ2
Initial Conclusion: Since P-value is less than α (0.05), reject H0
Final Conclusion: We reject the claim that the weights of the pre-1964 and post-1964 quarters have the same standard
deviation
Example 1
Two-TailedH0 = Claim
n1 = 40 n2 = 40 α = 0.05 s1 = 0.08700 s2 = 0.06194 (Note: s1≥s2)
Null: variance ratio=
Alternative
Sample 1: Variance:
Size:
Sample 2: Variance:
Size:
● Hypothesis Test0.007569
P-value = 0.0368
Stat → Variance → Two sample → With summary
s12 = 0.007569 s2
2 = 0.003837
0.003837
40
40
1
≠
Related Documents


