1 Northeast Massachusetts Regional Health Dialogue Massachusetts Department of Public Health June 4, 2007

1 Northeast Massachusetts Regional Health Dialogue Massachusetts Department of Public Health June 4, 2007.
Dec 17, 2015
Welcome message from author
This document is posted to help you gain knowledge. Please leave a comment to let me know what you think about it! Share it to your friends and learn new things together.
Transcript
1
Northeast Massachusetts Regional Health Dialogue
Massachusetts Department of Public Health
June 4, 2007
2
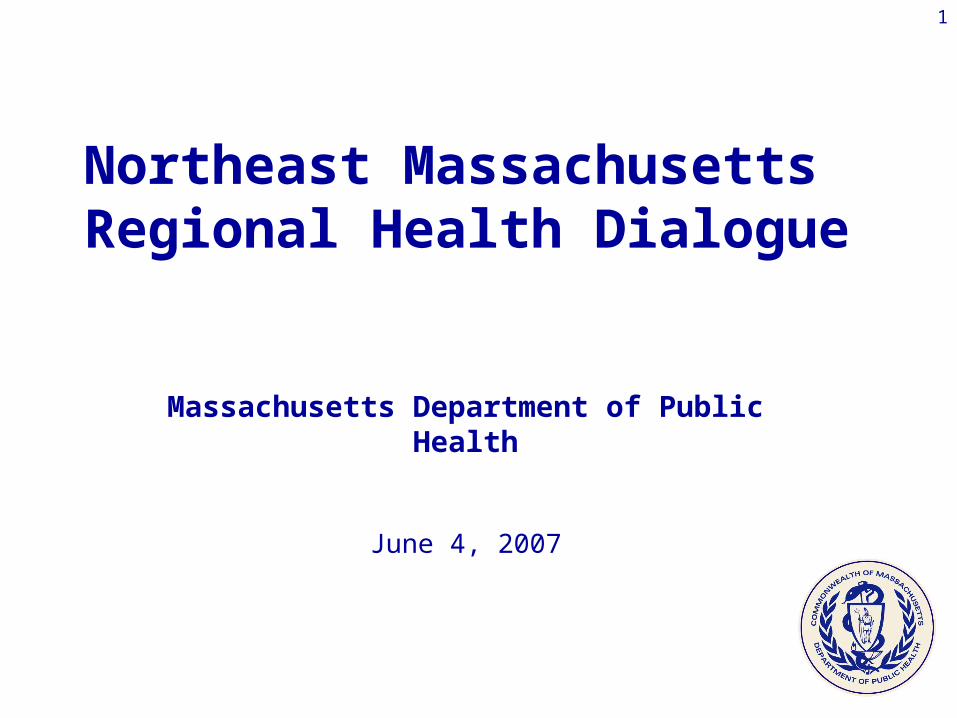
Goals for holding regional dialogues
• Introduce new DPH leadership
• Present latest health data on your particular region
• Talk with residents and providers about data and identify areas of need
• Gather feedback to inform process of setting DPH priorities
3
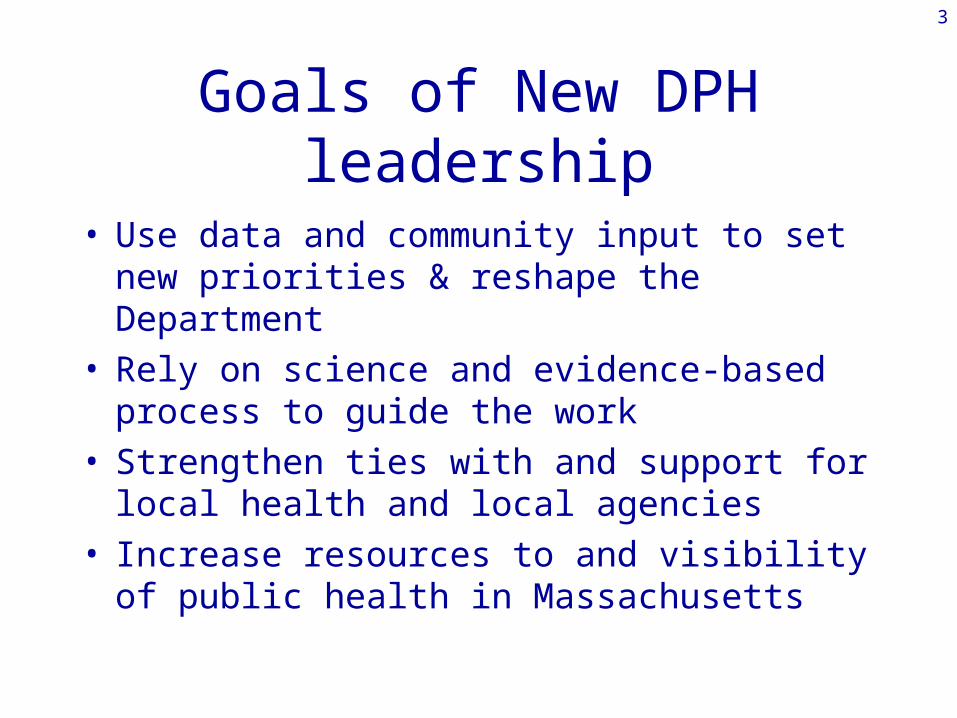
Goals of New DPH leadership
• Use data and community input to set new priorities & reshape the Department
• Rely on science and evidence-based process to guide the work
• Strengthen ties with and support for local health and local agencies
• Increase resources to and visibility of public health in Massachusetts
4
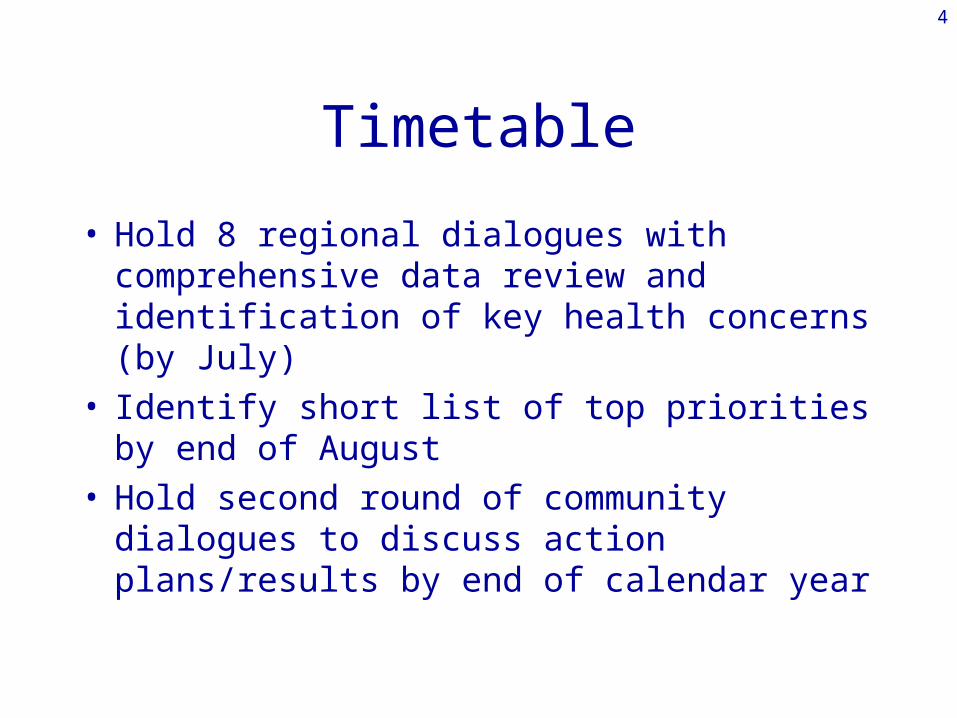
Timetable
• Hold 8 regional dialogues with comprehensive data review and identification of key health concerns (by July)
• Identify short list of top priorities by end of August
• Hold second round of community dialogues to discuss action plans/results by end of calendar year
5
Socio-Demographic Indicators and Health Care Access
6
WesternRegion Central
Region
SoutheastRegion
Metro WestRegion
NortheastRegion
BostonRegion
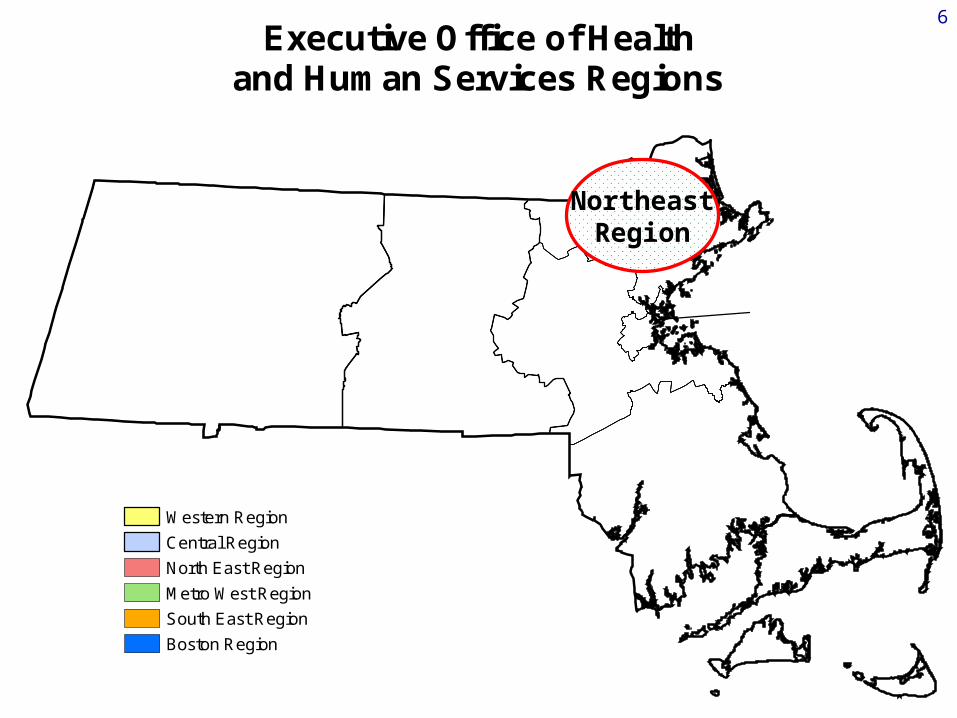
Executive Office of Healthand Human Services Regions
Western Region
Central Region
North East Region
Metro West Region
South East Region
Boston Region
NortheastRegion
7
A few comments about the limitations of this presentation
• A regional analysis has its drawbacks• Variability within a region – urban vs.
rural/suburban (i.e. Lawrence vs. the rest of the region)
• Variability by sub-population – race matters, poverty matters
• Our data don’t reflect all the important health indicators
8
BOXFORD
NEWBURY
ESSEX
ROWLEY
HAMILTON
SALISBURY
DUNSTABLE
MIDDLETON
TOPSFIELD
WEST NEWBURY
WENHAM
GEORGETOWN
MERRIMAC
GROVELAND
ROCKPORT
MANCHESTER
NAHANT
IPSWICH
ANDOVER
HAVERHILL
WESTFORD
BILLERICA
DRACUT
METHUEN
LYNN
LOWELL
PEABODY
BEVERLY
TEWKSBURY
CHELMSFORD
DANVERS
SAUGUS
AMESBURY
SALEM
READING
MEDFORD
NORTH READING
MALDEN
NORTH ANDOVER
GLOUCESTER
TYNGSBOROUGH
LYNNFIELD
WAKEFIELD
LAWRENCE
STONEHAM
NEWBURYPORT
MELROSE
EVERETT
MARBLEHEAD
SWAMPSCOTT!.
Population > 10,000
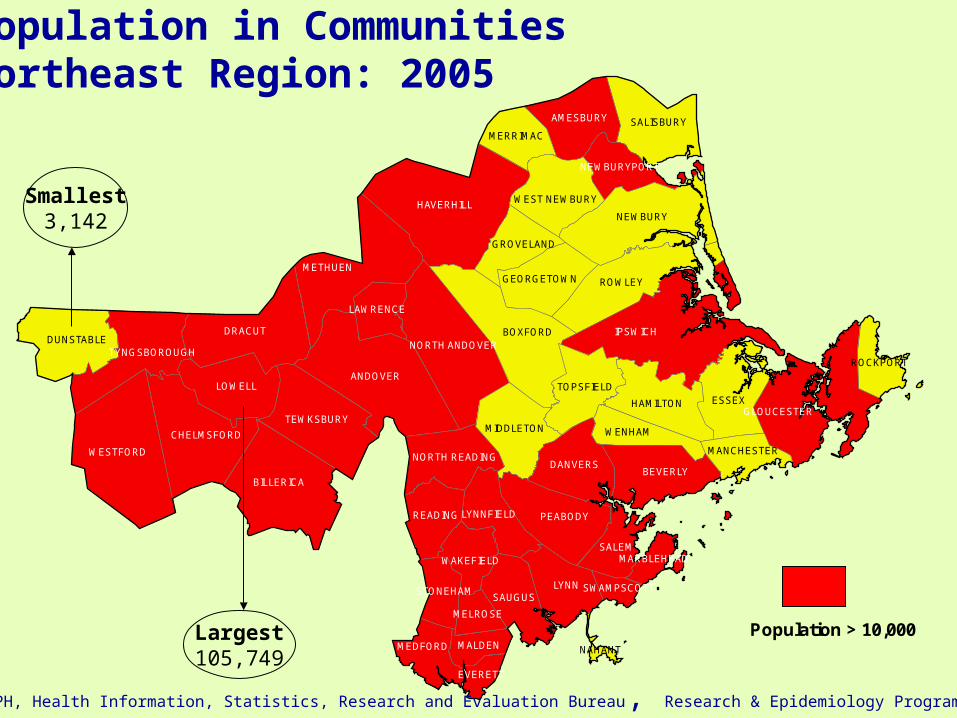
Population in CommunitiesNortheast Region: 2005
Smallest3,142
Largest105,749
Source: MDPH, Health Information, Statistics, Research and Evaluation Bureau, Research & Epidemiology Program
9
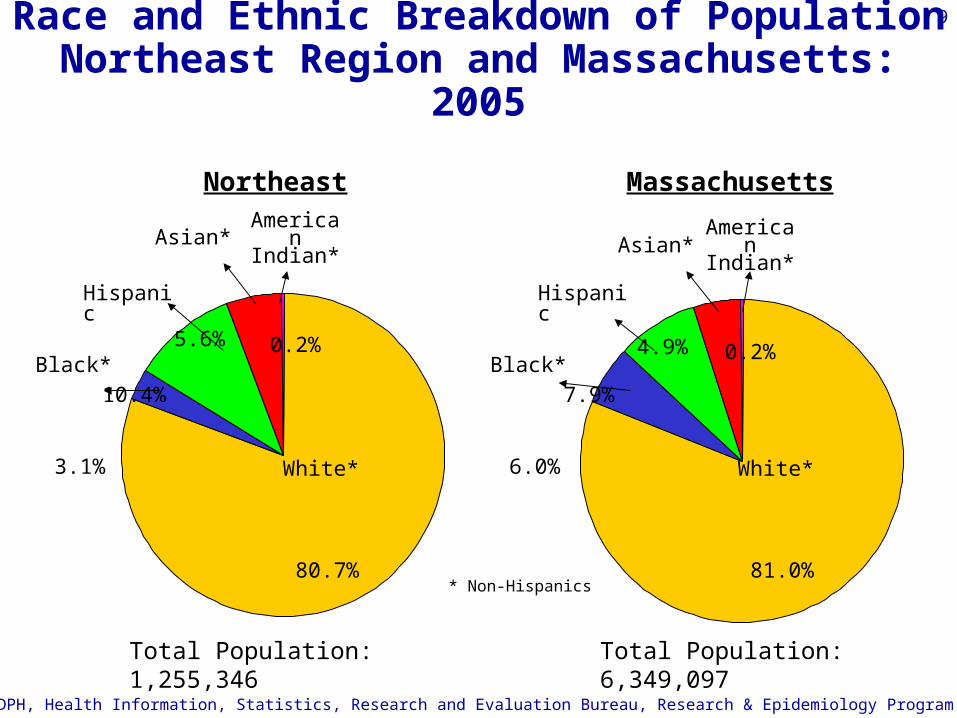
Race and Ethnic Breakdown of PopulationNortheast Region and Massachusetts: 2005
Northeast Massachusetts
White*
80.7%
Black*
3.1%
Hispanic 10.4%
Asian*
5.6%
* Non-Hispanics
White*
81.0%
Black*
6.0%
Hispanic
7.9%
Asian*
4.9%
Source: MDPH, Health Information, Statistics, Research and Evaluation Bureau, Research & Epidemiology Program
American Indian*
0.2%
American Indian*
0.2%
Total Population: 1,255,346 Total Population: 6,349,097
10
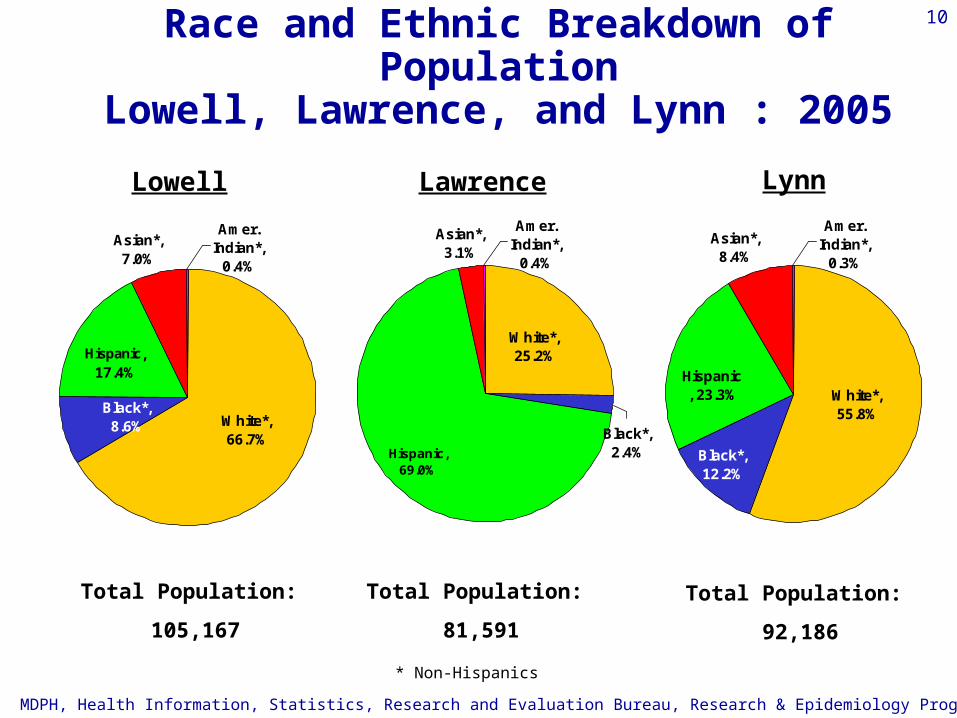
Race and Ethnic Breakdown of PopulationLowell, Lawrence, and Lynn : 2005
Asian*, 3.1%
Hispanic, 69.0%
Black*, 2.4%
White*, 25.2%
Amer. Indian*,
0.4%
Asian*, 7.0%
Hispanic, 17.4%
Black*, 8.6% White*,
66.7%
Amer. Indian*,
0.4%
Lowell
* Non-Hispanics
Lawrence
Source: MDPH, Health Information, Statistics, Research and Evaluation Bureau, Research & Epidemiology Program
Total Population:
105,167
Total Population:
81,591
Asian*, 8.4%
Hispanic, 23.3%
Black*, 12.2%
White*, 55.8%
Amer. Indian*,
0.3%
Total Population:
92,186
Lynn
11
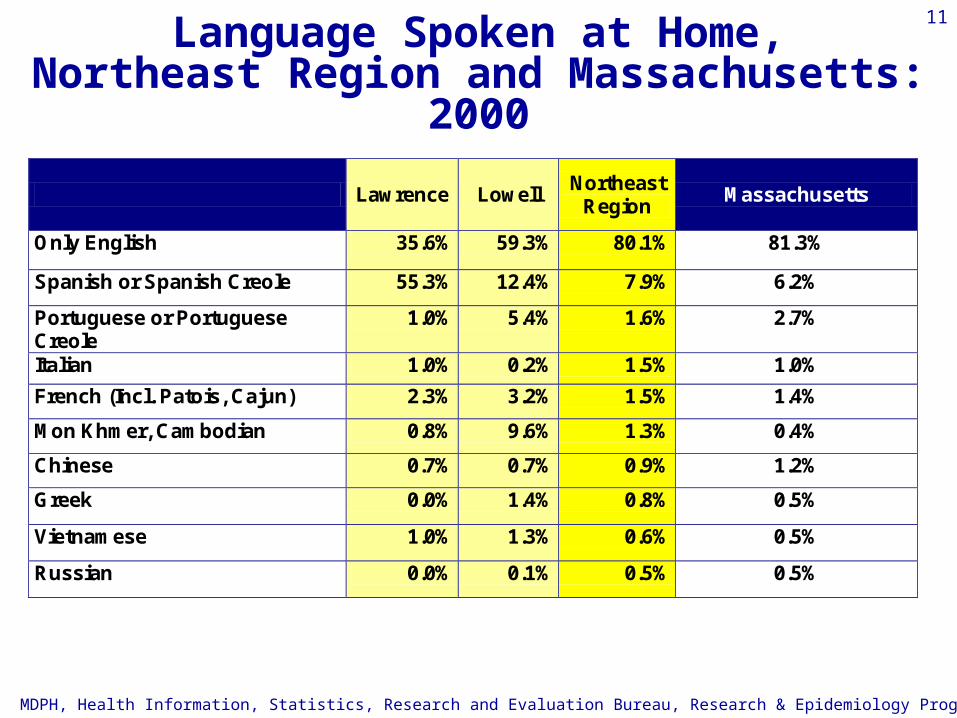
Language Spoken at Home,Northeast Region and Massachusetts: 2000
Lawrence Lowell Northeast
Region Massachusetts
Only English 35.6% 59.3% 80.1% 81.3%
Spanish or Spanish Creole 55.3% 12.4% 7.9% 6.2%
Portuguese or Portuguese Creole
1.0% 5.4% 1.6% 2.7%
Italian 1.0% 0.2% 1.5% 1.0%
French (Incl. Patois, Cajun) 2.3% 3.2% 1.5% 1.4%
Mon Khmer, Cambodian 0.8% 9.6% 1.3% 0.4%
Chinese 0.7% 0.7% 0.9% 1.2%
Greek 0.0% 1.4% 0.8% 0.5%
Vietnamese 1.0% 1.3% 0.6% 0.5%
Russian 0.0% 0.1% 0.5% 0.5%
Source: MDPH, Health Information, Statistics, Research and Evaluation Bureau, Research & Epidemiology Program
12
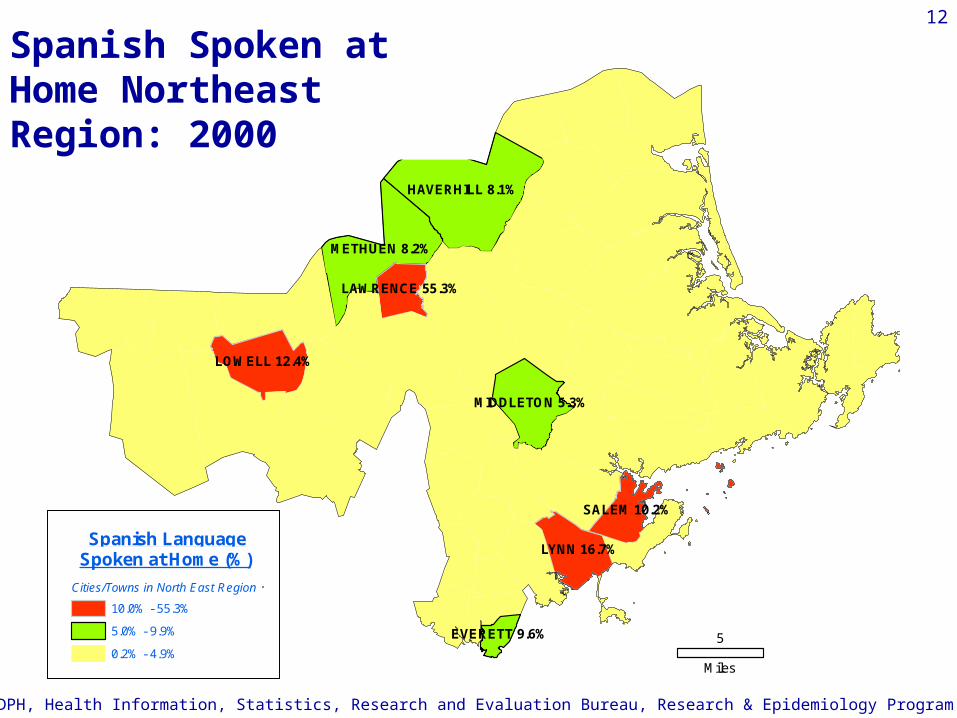
LOWELL 12.4%
LYNN 16.7%
SALEM 10.2%
LAWRENCE 55.3%
HAVERHILL 8.1%
METHUEN 8.2%
MIDDLETON 5.3%
EVERETT 9.6%
Spanish LanguageSpoken at Home (%)
Cities/Towns in North East Region
10.0% - 55.3%
5.0% - 9.9%
0.2% - 4.9%
North East Region
5
Miles
Spanish Spoken at Home Northeast Region: 2000
Source: MDPH, Health Information, Statistics, Research and Evaluation Bureau, Research & Epidemiology Program

13
Socio-Demographic IndicatorsNortheast Region and Massachusetts: 2000
Lawrence Lowell Lynn Northeast
Region
MA Overall US Overall
Per Capita Income
$13,360
$17,557 $17,492 $25,748 $25,952 $21,587
Those living below 100% poverty
24.3% 16.8% 16.5% 8.3% 9.3% 12.4%
Children < 18 living below 100% poverty
31.7% 23.2% 22.9% 11.2% 12.0% 16.1%
Less than a High School Education
19.8% 12.9% 10.1% 15.7% 15.2% 19.6%
Speak language other than English at home
64.4% 40.7% 34.2% 19.9% 18.7% 17.9%
Foreign born
30.6% 22.1% 22.8% 12.6% 12.2% 11.1%
Unemployed
11.3% 6.9% 6.5% 6.6%
Source: MDPH, Health Information, Statistics, Research and Evaluation Bureau, Research & Epidemiology Program
14
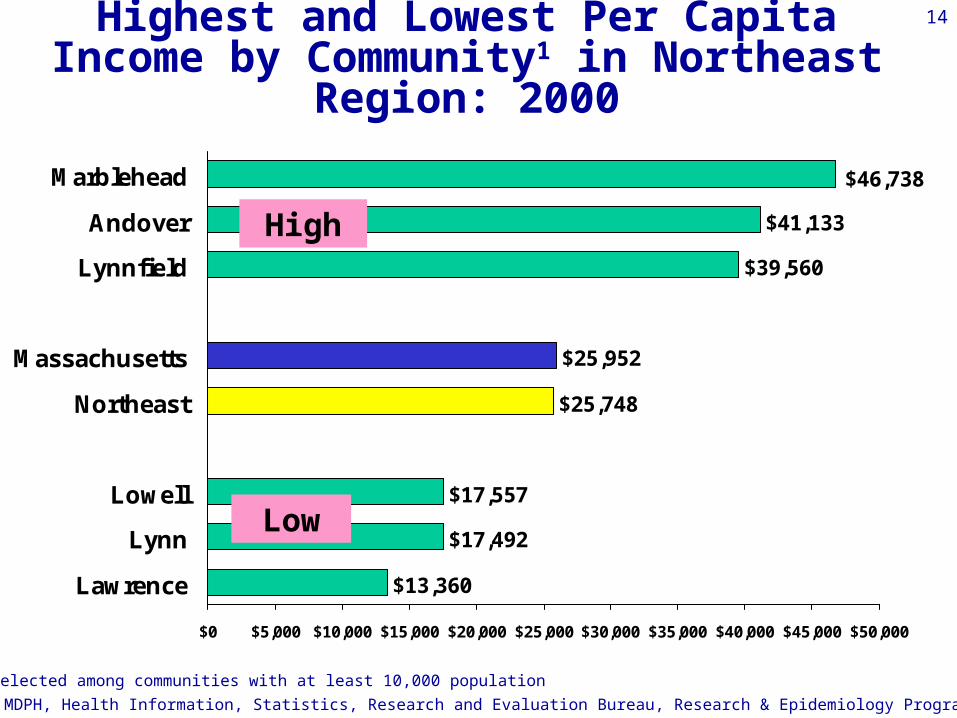
$13,360
$17,492
$17,557
$25,748
$25,952
$39,560
$41,133
$46,738
$0 $5,000 $10,000 $15,000 $20,000 $25,000 $30,000 $35,000 $40,000 $45,000 $50,000
Lawrence
Lynn
Lowell
Northeast
Massachusetts
Lynnfield
Andover
Marblehead
Highest and Lowest Per Capita Income by Community1 in Northeast Region: 2000
High
Low
1 Selected among communities with at least 10,000 population
Source: MDPH, Health Information, Statistics, Research and Evaluation Bureau, Research & Epidemiology Program
15
Birth Indicators
A major concern with infant deaths
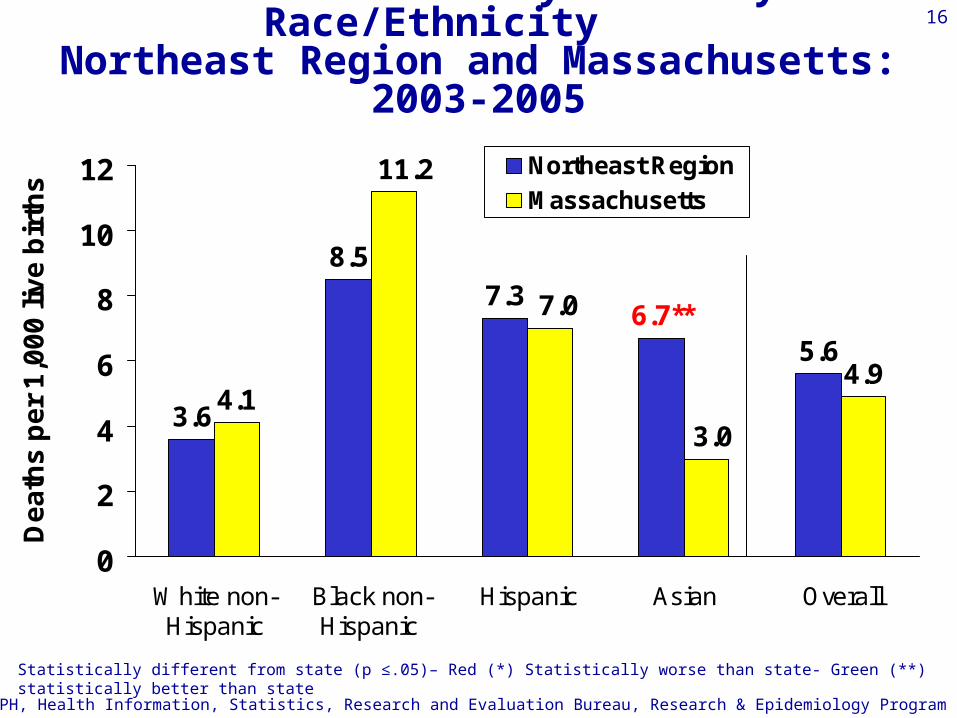
16
3.6
8.57.3
5.6
4.14.9
6.7**
3.0
7.0
11.2
0
2
4
6
8
10
12
White non-Hispanic
Black non-Hispanic
Hispanic Asian Overall
De
ath
s p
er
1,0
00
liv
e b
irth
s
Northeast Region
Massachusetts
Infant Mortality Rates by Race/Ethnicity Northeast Region and Massachusetts: 2003-2005
Source: MDPH, Health Information, Statistics, Research and Evaluation Bureau, Research & Epidemiology Program
Statistically different from state (p ≤.05)– Red (*) Statistically worse than state- Green (**) statistically better than state

17
5.1
7.0
8.5
4.5
0
1
2
3
4
5
6
7
8
9
1990 1991 1992 1993 1994 1995 1996 1997 1998 1999 2000 2001 2002 2003 2004 2005
Year
IMR
(#
de
ath
s/1
,00
0 l
ive
bir
ths
)Infant Mortality Rate (IMR)
Northeast Region and Massachusetts: 1990-2005
Massachusetts
Northeast Region
Source: MDPH, Health Information, Statistics, Research and Evaluation Bureau, Research & Epidemiology Program
Infant Mortality Rate: deaths of infants less than one year of age per 1000 live births
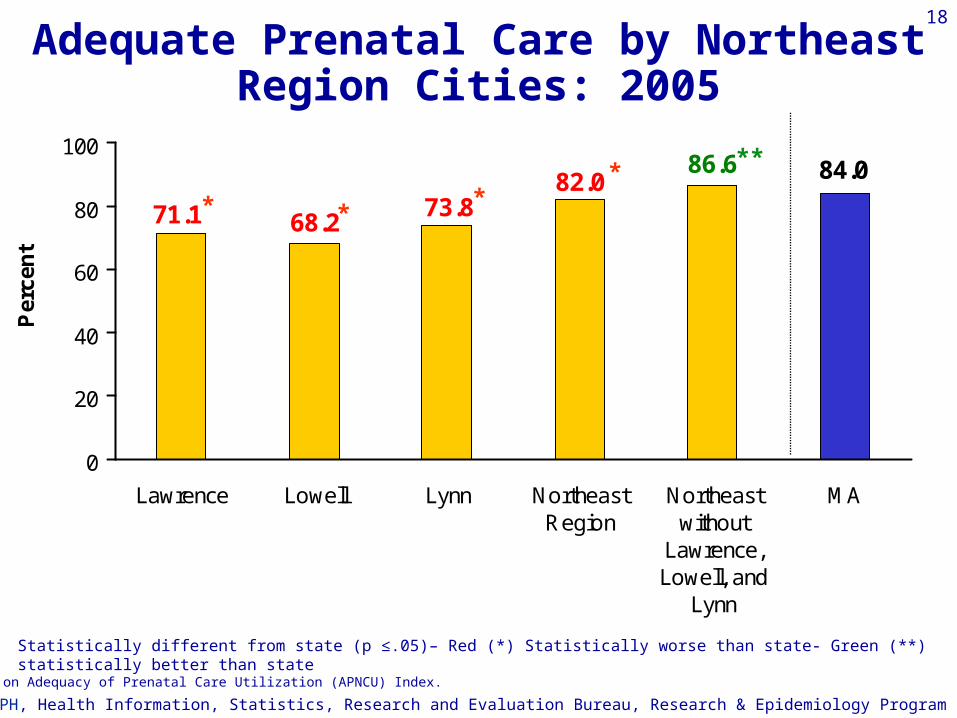
18
Adequate Prenatal Care by Northeast Region Cities: 2005
86.682.0
73.871.1 68.2
84.0
0
20
40
60
80
100
Lawrence Lowell Lynn NortheastRegion
Northeastwithout
Lawrence,Lowell, and
Lynn
MA
Per
cen
t
Source: MDPH, Health Information, Statistics, Research and Evaluation Bureau, Research & Epidemiology Program
* *
Based on Adequacy of Prenatal Care Utilization (APNCU) Index.
Statistically different from state (p ≤.05)– Red (*) Statistically worse than state- Green (**) statistically better than state
*
***
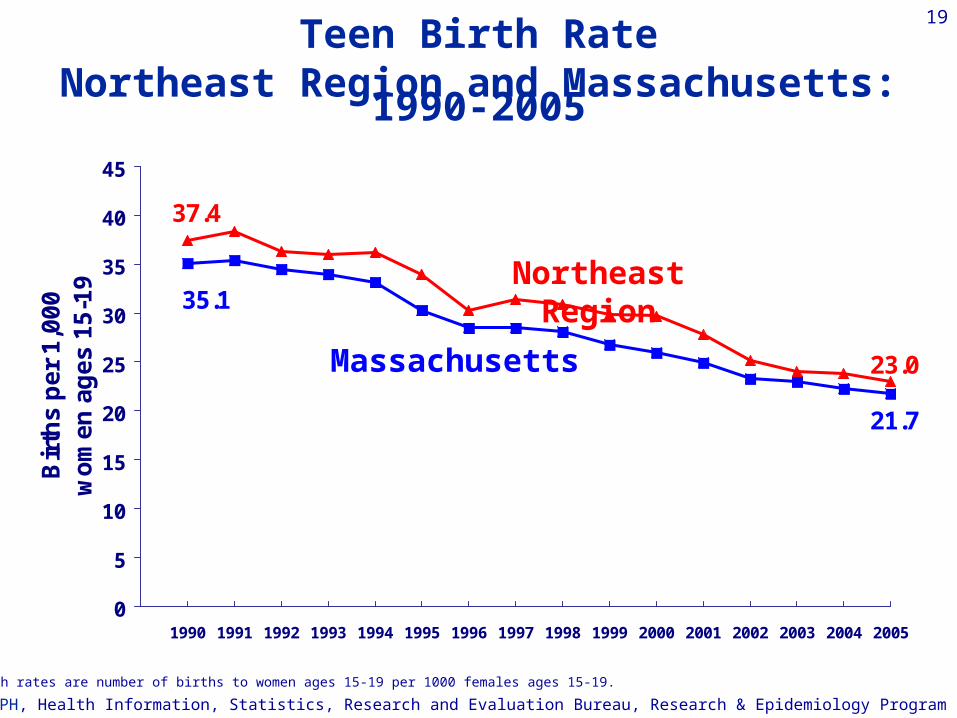
19
21.7
35.1
37.4
23.0
0
5
10
15
20
25
30
35
40
45
1990 1991 1992 1993 1994 1995 1996 1997 1998 1999 2000 2001 2002 2003 2004 2005
Bir
ths
pe
r 1
,00
0
wo
me
n a
ge
s 1
5-1
9
Teen Birth RateNortheast Region and Massachusetts: 1990-2005
Massachusetts
Northeast Region
Source: MDPH, Health Information, Statistics, Research and Evaluation Bureau, Research & Epidemiology Program
Teen birth rates are number of births to women ages 15-19 per 1000 females ages 15-19.
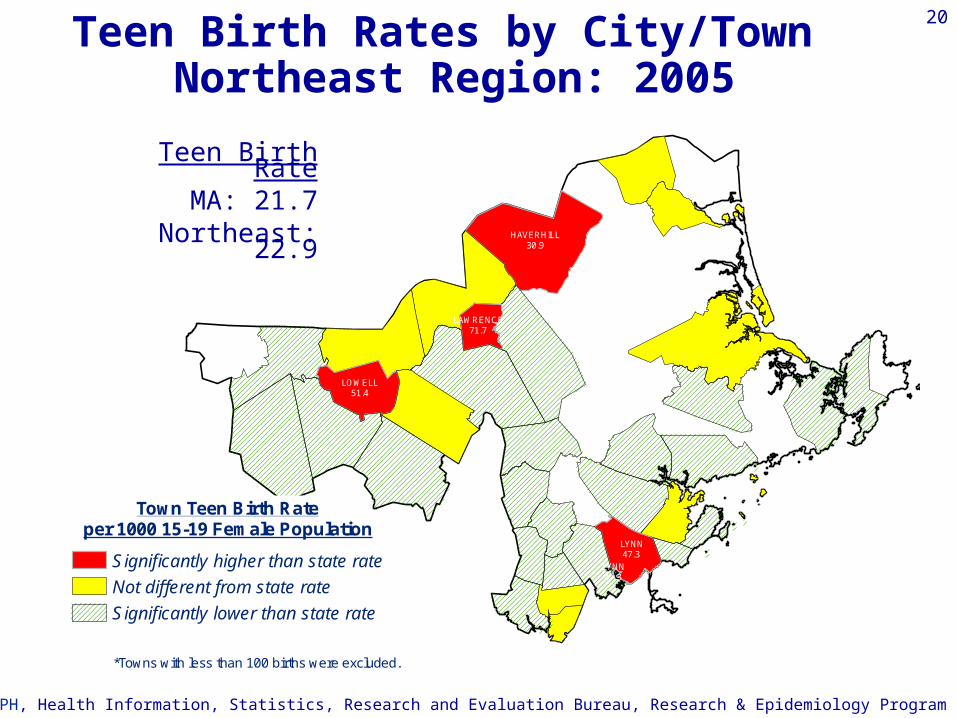
20
HAVERHILL30.9
LYNN47.3
LOWELL51.4
LAWRENCE71.7
LYNN47.3
Teen Birth Rates by Towns*North East Region Births 2005
Town Teen Birth Rateper 1000 15-19 Female Population
Significantly higher than state rate
Not different from state rate
Significantly lower than state rate
*Towns with less than 100 births were excluded.
Teen Birth Rates by City/Town Northeast Region: 2005
Source: MDPH, Health Information, Statistics, Research and Evaluation Bureau, Research & Epidemiology Program
Teen Birth RateMA: 21.7
Northeast: 22.9
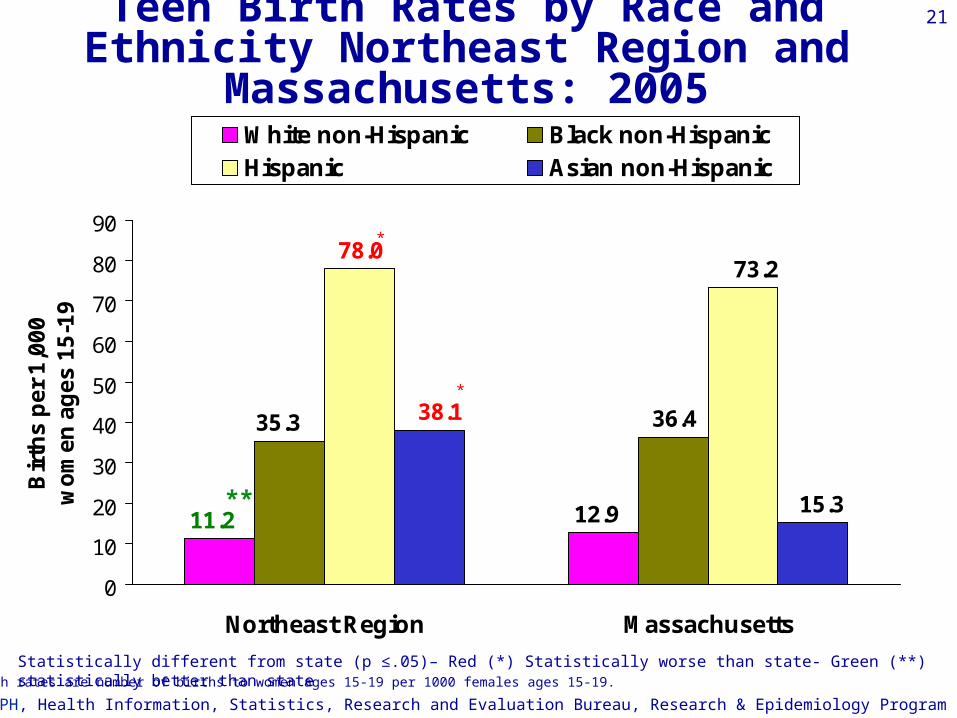
21Teen Birth Rates by Race and Ethnicity Northeast Region and Massachusetts: 2005
36.4
12.911.2
35.3
78.073.2
15.3
38.1
0
10
20
30
40
50
60
70
80
90
Northeast Region Massachusetts
Bir
ths
pe
r 1
,00
0
wo
me
n a
ge
s 1
5-1
9
White non-Hispanic Black non-HispanicHispanic Asian non-Hispanic
Source: MDPH, Health Information, Statistics, Research and Evaluation Bureau, Research & Epidemiology Program
**
Teen birth rates are number of births to women ages 15-19 per 1000 females ages 15-19.
Statistically different from state (p ≤.05)– Red (*) Statistically worse than state- Green (**) statistically better than state
*
*
22
Leading Causes of Death
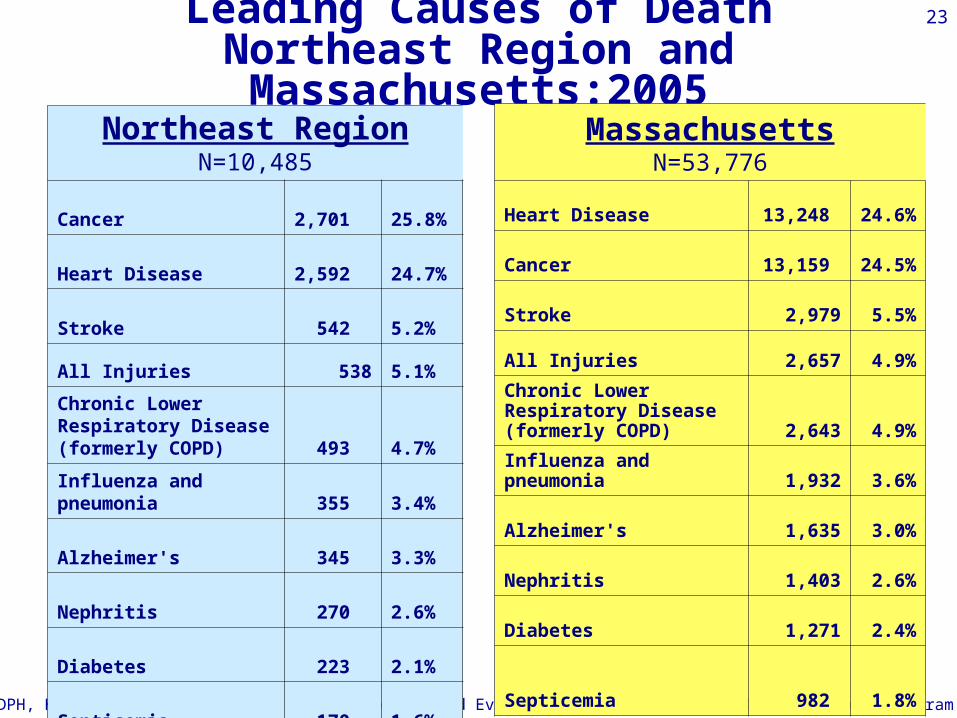
23Leading Causes of DeathNortheast Region and Massachusetts:2005
Source: MDPH, Health Information, Statistics, Research and Evaluation Bureau, Research & Epidemiology Program
MassachusettsN=53,776
Heart Disease
13,248 24.6%
Cancer
13,159 24.5%
Stroke 2,979 5.5%
All Injuries 2,657 4.9%
Chronic Lower Respiratory Disease (formerly COPD)
2,643 4.9%
Influenza and pneumonia 1,932 3.6%
Alzheimer's 1,635 3.0%
Nephritis 1,403 2.6%
Diabetes 1,271 2.4%
Septicemia
982 1.8%
Northeast RegionN=10,485
Cancer 2,701 25.8%
Heart Disease 2,592 24.7%
Stroke 542 5.2%
All Injuries 538 5.1%
Chronic Lower Respiratory Disease (formerly COPD)
493 4.7%
Influenza and pneumonia
355 3.4%
Alzheimer's 345 3.3%
Nephritis 270 2.6%
Diabetes 223 2.1%
Septicemia 170 1.6%
24
Chronic Disease Outcomes and Overweight/Obesity

25Adults who are Overweight1 by EOHHS Region, Massachusetts:
1995 & 2005
57.8
49.5 45.7 43.5 44.6
50.2
35.7
45.1
52.057.5
60.8
55.952.6
56.1
0
10
20
30
40
50
60
70
Western Central Northeast MetroWest
Southeast Boston MA
Per
cen
t
1995 2005
Source: MDPH, Health Information, Statistics, Research and Evaluation Bureau, Massachusetts Behavioral Risk Factor Surveillance System (BRFSS), Health Survey Program
1 Overweight: BMI greater than or equal to 25
Statistically different from state (p ≤.05)– Red (*) Statistically worse than state- Green (**) statistically better than state

26Heart Disease Mortality Ratesby EOHHS Region
Massachusetts: 2003-2005
182.5195.1
159.8
186.3188.8 196.8177.9
0
100
200
300
Western Central Northeast MetroWest
Southeast Boston MA
De
ath
s
pe
r 1
00
,00
0
Age-adjusted to the 2000 US standard population. Source: MDPH, Health Information, Statistics, Research and Evaluation Bureau, Research & Epidemiology Program
*
**
*
Statistically different from state (p ≤.05)– Red (*) Statistically worse than state- Green (**) statistically better than state
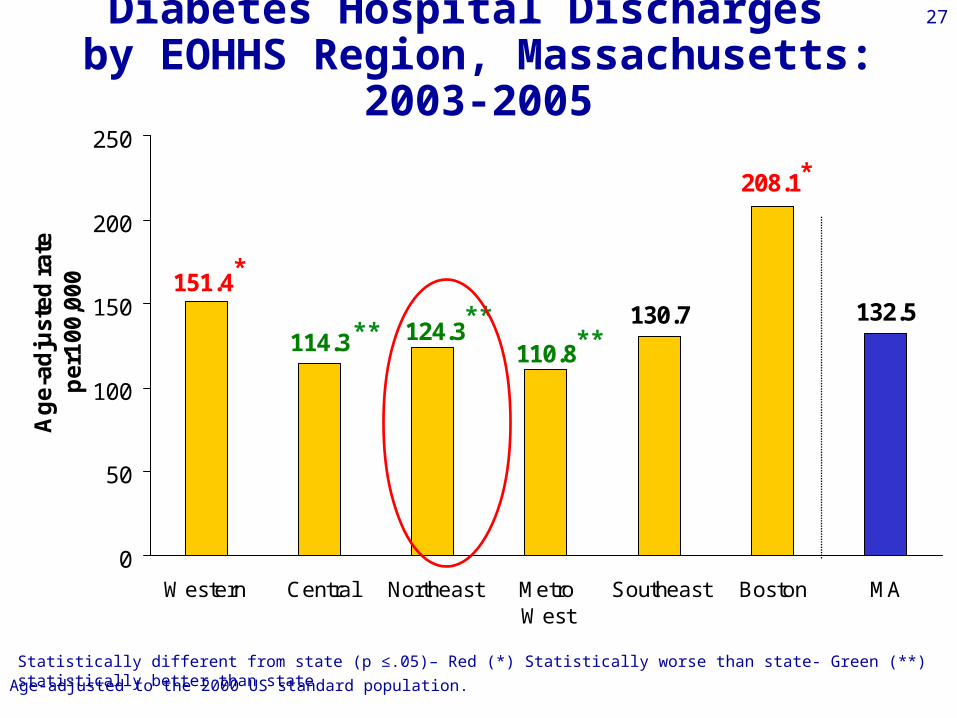
27Diabetes Hospital Discharges by EOHHS Region, Massachusetts: 2003-2005
130.7 132.5
110.8124.3
151.4
114.3
208.1
0
50
100
150
200
250
Western Central Northeast MetroWest
Southeast Boston MA
Ag
e-a
dju
ste
d r
ate
pe
r10
0,0
00
Age-adjusted to the 2000 US standard population. Source: Division of Health Care Finance and Policy. Calendar Year 2003-2005. Inpatient Hospital Discharge Database
*
****
**
*
Statistically different from state (p ≤.05)– Red (*) Statistically worse than state- Green (**) statistically better than state

28Diabetes Mortality Rate by Race/EthnicityNortheast Region and Massachusetts: 2003-2005
17
34
3937
29
1614
16
0
5
10
15
20
25
30
35
40
45
50
Northeast Region Massachusetts
De
ath
s p
er
10
0,0
00
White non-Hispanic Black non-Hispanic
Hispanic Asian non-Hispanic
Age-adjusted to the 2000 US standard population. Source: MDPH, Health Information, Statistics, Research and Evaluation Bureau, Research & Epidemiology Program
Statistically different from state (p ≤.05)– Red (*) Statistically worse than state- Green (**) statistically better than state

29
Cancer
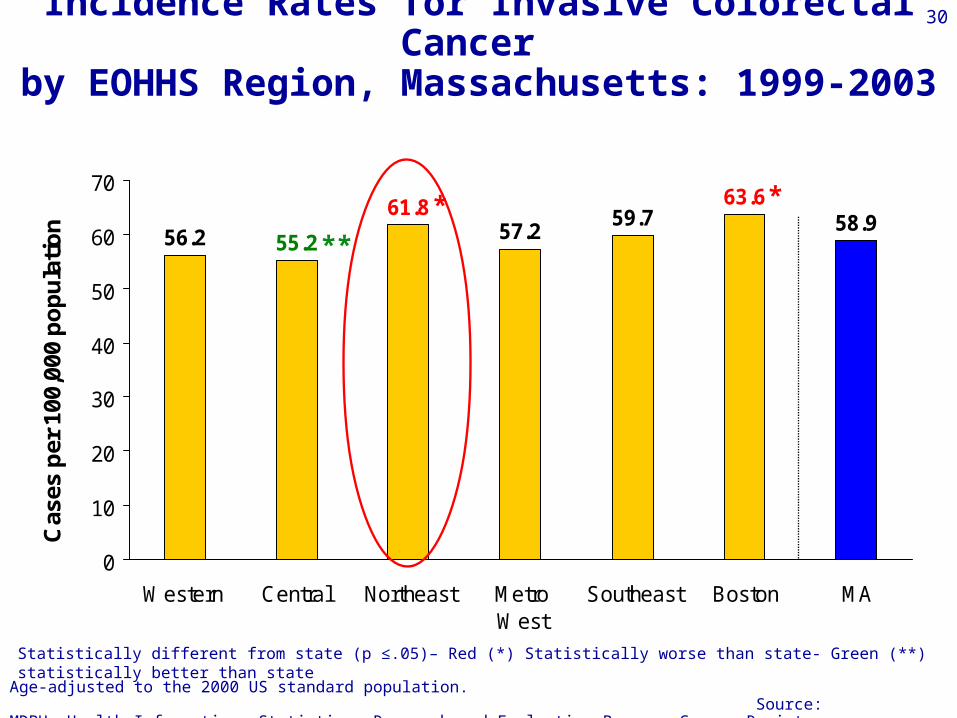
30Incidence Rates for Invasive Colorectal Cancer by EOHHS Region, Massachusetts: 1999-2003
56.258.9
61.8
55.2 57.2
63.659.7
0
10
20
30
40
50
60
70
Western Central Northeast MetroWest
Southeast Boston MA
Cas
es p
er 1
00,0
00 p
op
ula
tio
n
Age-adjusted to the 2000 US standard population. Source: MDPH, Health Information, Statistics, Research and Evaluation Bureau, Cancer Registry
**
*
Statistically different from state (p ≤.05)– Red (*) Statistically worse than state- Green (**) statistically better than state
*

31Incidence Rates for Invasive Lung Cancer by EOHHS Region, Massachusetts: 1999-2003
72.076.7
67.2 69.965.1
77.777.5
0
25
50
75
100
Western Central Northeast MetroWest
Southeast Boston MA
Cas
es p
er 1
00,0
00 p
op
ula
tio
n
Age-adjusted to the 2000 US standard population. Source: MDPH, Health Information, Statistics, Research and Evaluation Bureau, Cancer Registry
*
Statistically different from state (p ≤.05)– Red (*) Statistically worse than state- Green (**) statistically better than state
*** *
**

32
54
79*
5665
16
3727
34
0
10
20
30
40
50
60
70
80
90
Northeast Region Massachusetts
Dis
ch
arg
es
pe
r 1
00
,00
0
White non-Hispanic Black non-Hispanic
Hispanic Asian non-Hispanic
Lung Cancer Incidence Rates by Race and Ethnicity, Northeast Region &
Massachusetts: 2003-2005
Statistically different from state (p ≤.05)– Red (*) Statistically worse than state- Green (**) statistically better than stateAge-adjusted to the 2000 US standard population. Source: Division of Health Care Finance and Policy. Calendar Year 2003- 2005. Hospital Discharges
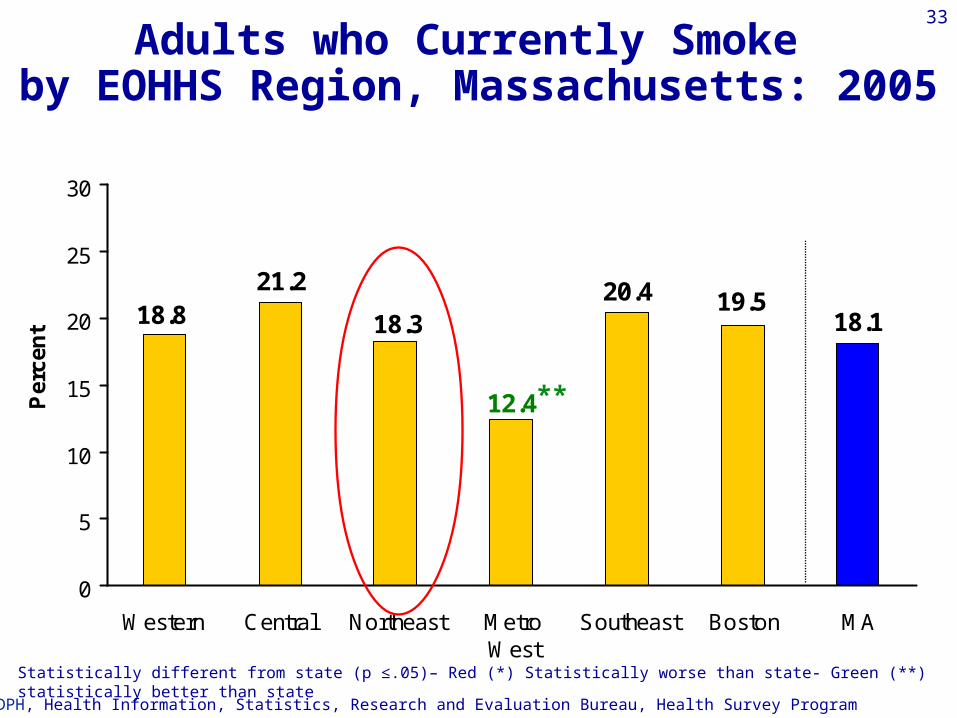
33
Adults who Currently Smoke by EOHHS Region, Massachusetts: 2005
20.418.1
12.4
18.318.821.2
19.5
0
5
10
15
20
25
30
Western Central Northeast MetroWest
Southeast Boston MA
Per
cen
t
Source: MDPH, Health Information, Statistics, Research and Evaluation Bureau, Health Survey Program
**
Statistically different from state (p ≤.05)– Red (*) Statistically worse than state- Green (**) statistically better than state

34
Percent of Mothers Smoking During Pregnancy for Largest Communities
Northeast Region: 2005 % Smokers Births
Massachusetts 7.2% 5,555 76,653Northeast Region 7.2% 1,140 15,924
LowestMelrose 3.2%** 9 285North Andover 2.8%** 9 324Andover 2.0%** 6 292
HighestGloucester 12.5%* 34 272Dracut 11.8%* 44 372Lowell 11.4%* 190 1,667
Source: MDPH, Health Information, Statistics, Research and Evaluation Bureau, Research & Epidemiology Program
Statistically different from state (p ≤.05)– Red (*) Statistically worse than state- Green (**) statistically better than state
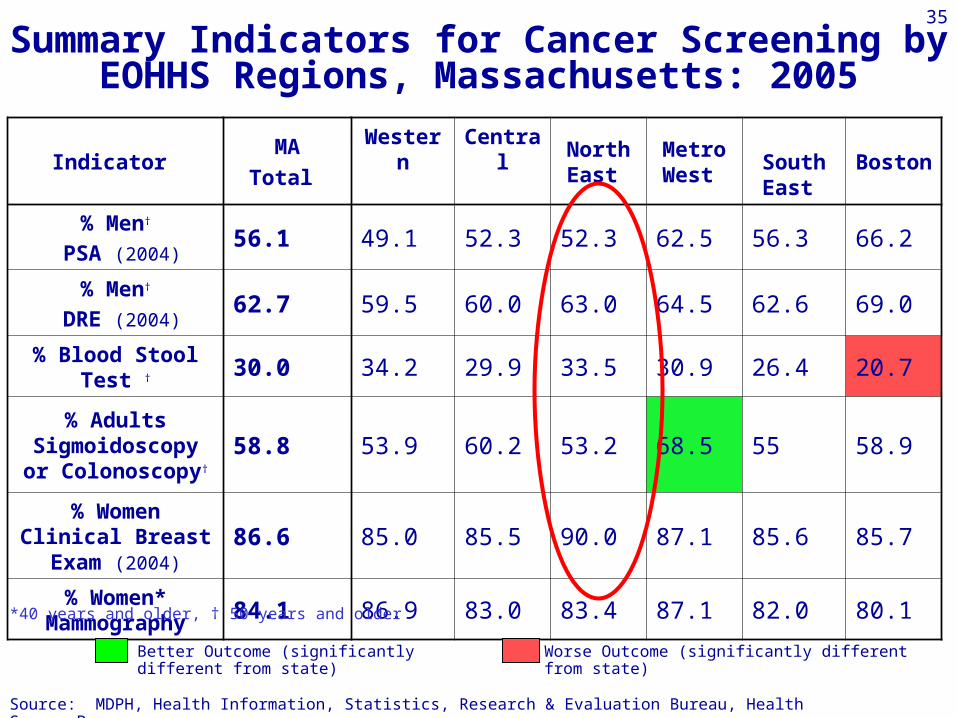
35
Indicator MA
Total Western
Central North
East Metro West
South East
Boston
% Men†
PSA (2004)56.1 49.1 52.3 52.3 62.5 56.3 66.2
% Men†
DRE (2004)62.7 59.5 60.0 63.0 64.5 62.6 69.0
% Blood Stool Test † 30.0 34.2 29.9 33.5 30.9 26.4 20.7
% Adults Sigmoidoscopy or
Colonoscopy†
58.8 53.9 60.2 53.2 68.5 55 58.9
% Women Clinical Breast Exam (2004)
86.6 85.0 85.5 90.0 87.1 85.6 85.7
% Women* Mammography 84.1 86.9 83.0 83.4 87.1 82.0 80.1
Summary Indicators for Cancer Screening by EOHHS Regions, Massachusetts: 2005
Better Outcome (significantly different from state) Worse Outcome (significantly different from state)
*40 years and older, † 50 years and older
Source: MDPH, Health Information, Statistics, Research & Evaluation Bureau, Health Survey Program
36
Indicator
MA
Total Western
Central Northeast Metro
West
South East
Boston
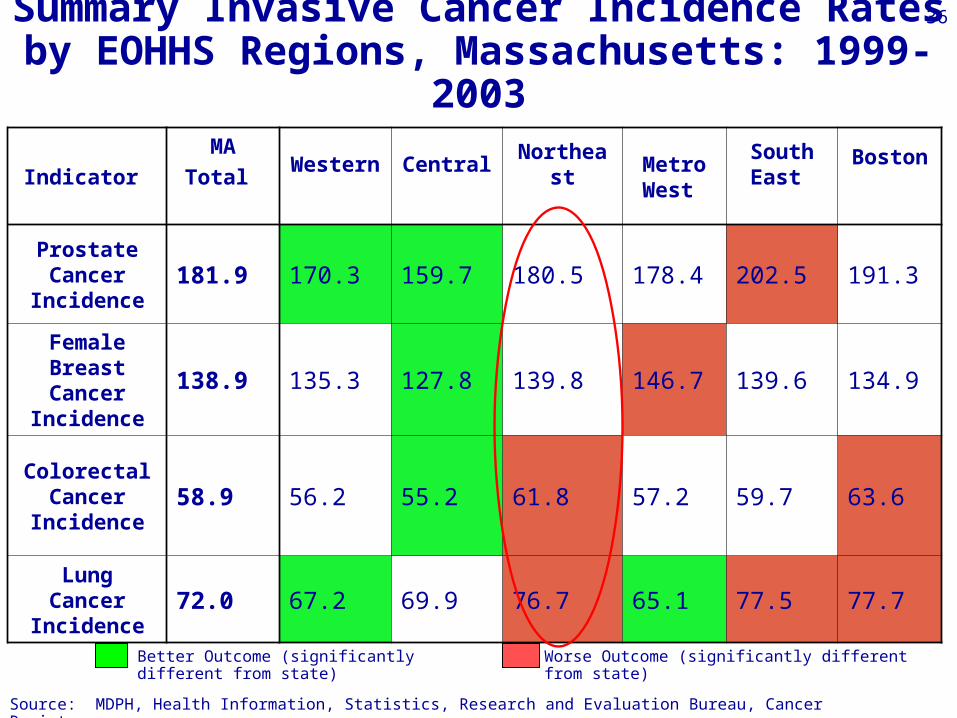
Prostate Cancer
Incidence181.9 170.3 159.7 180.5 178.4 202.5 191.3
Female Breast Cancer
Incidence
138.9 135.3 127.8 139.8 146.7 139.6 134.9
Colorectal Cancer
Incidence58.9 56.2 55.2 61.8 57.2 59.7 63.6
Lung Cancer Incidence 72.0 67.2 69.9 76.7 65.1 77.5 77.7
Summary Invasive Cancer Incidence Ratesby EOHHS Regions, Massachusetts: 1999-2003
Source: MDPH, Health Information, Statistics, Research and Evaluation Bureau, Cancer Registry
Better Outcome (significantly different from state) Worse Outcome (significantly different from state)

37
Substance Abuse
38
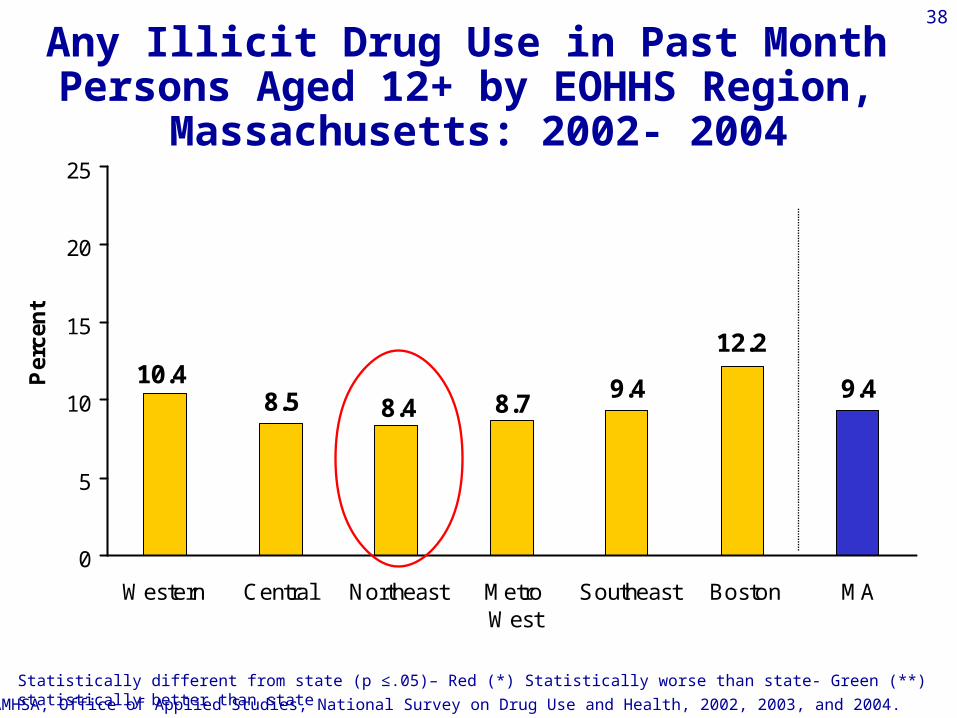
Any Illicit Drug Use in Past Month Persons Aged 12+ by EOHHS Region,
Massachusetts: 2002- 2004
9.4 9.48.78.4
10.48.5
12.2
0
5
10
15
20
25
Western Central Northeast MetroWest
Southeast Boston MA
Per
cen
t
Source: SAMHSA, Office of Applied Studies, National Survey on Drug Use and Health, 2002, 2003, and 2004.
Statistically different from state (p ≤.05)– Red (*) Statistically worse than state- Green (**) statistically better than state
39
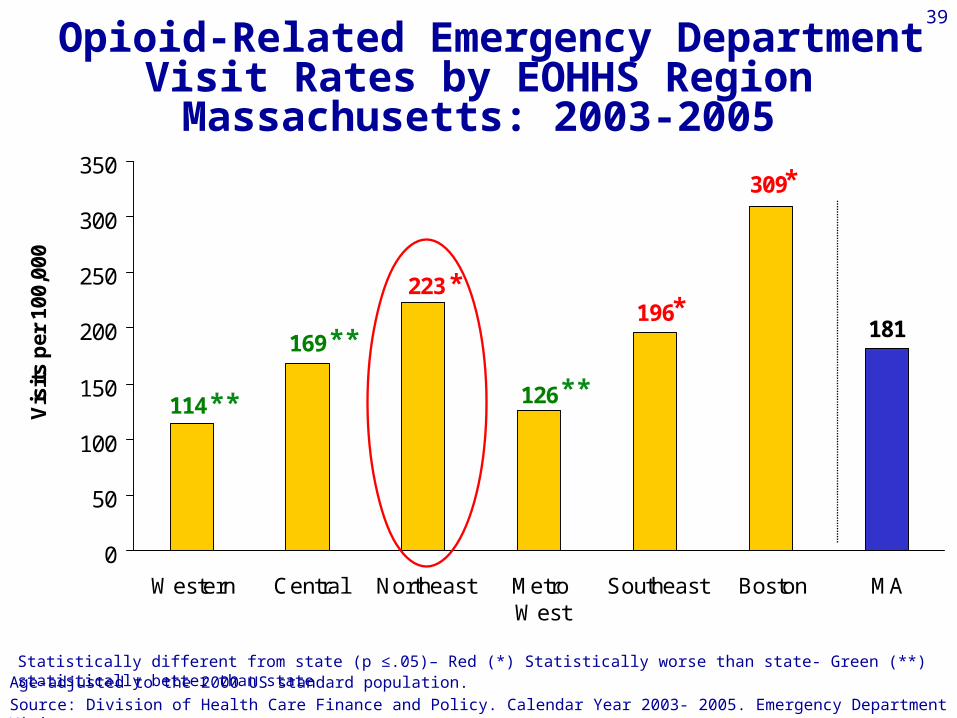
Opioid-Related Emergency Department Visit Rates by EOHHS Region
Massachusetts: 2003-2005
181196
126
223
114
169
309
0
50
100
150
200
250
300
350
Western Central Northeast MetroWest
Southeast Boston MA
Vis
its
per
100
,000
**
**
*
*
*
**
Statistically different from state (p ≤.05)– Red (*) Statistically worse than state- Green (**) statistically better than stateAge-adjusted to the 2000 US standard population. Source: Division of Health Care Finance and Policy. Calendar Year 2003- 2005. Emergency Department Visits

40Opioid-Related Emergency Department Visit Rates
by Race/EthnicityLawrence, Lowell, and Lynn vs. Massachusetts: 2003-2005
187220
188237
10
662
409
207184
95134
182
282
38
0
100
200
300
400
500
600
700
Lawrence Lowell Lynn Massachusetts
Vis
its
per
100
,000
White non-Hispanic Black non-Hispanic
Hispanic Asian non-Hispanic
*
*
Statistically different from state (p ≤.05)– Red (*) Statistically worse than state- Green (**) statistically better than stateAge-adjusted to the 2000 US standard population. Source: Division of Health Care Finance and Policy. Calendar Year 2003- 2005. Emergency Department Visits
**
*
****

41 Opioid-Related Fatal Overdosesby EOHHS Region, Massachusetts: 2003-2005
8.110.1
6.0
9.5
6.7 6.5
10.8
0
10
20
30
Western Central Northeast Metro West Southeast Boston MA
Dea
ths
per
100
,000
po
pu
lati
on
** **
**
*
Age-adjusted to the 2000 US standard population. Source: MDPH, Health Information, Statistics, Research and Evaluation Bureau, Research & Epidemiology Program
Statistically different from state (p ≤.05)– Red (*) Statistically worse than state- Green (**) statistically better than state

42
Injury/Violence
43
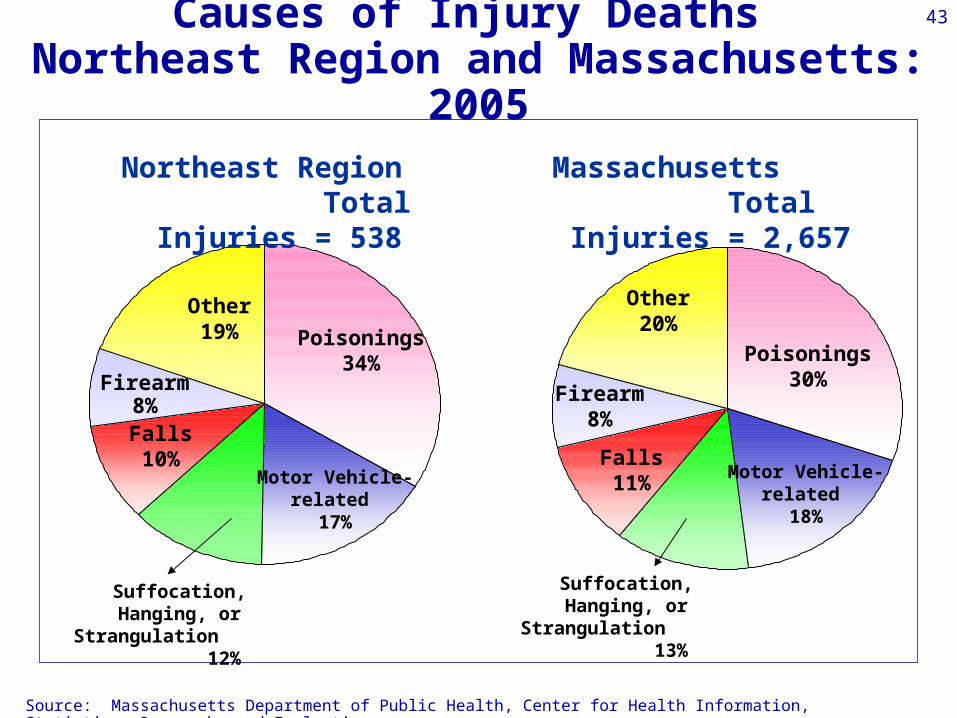
Causes of Injury Deaths Northeast Region and Massachusetts: 2005
Northeast Region Total Injuries = 538
Source: Massachusetts Department of Public Health, Center for Health Information, Statistics, Research, and Evaluation
Massachusetts Total Injuries = 2,657
Poisonings 30%
Firearm 8%
Falls 11%
Suffocation, Hanging, or Strangulation
13%
Motor Vehicle-related
18%
Other20%
Poisonings 34%
Firearm 8%
Suffocation, Hanging, or Strangulation
12%
Motor Vehicle-related
17%
Falls 10%
Other19%

44
Hospitalization Rates for Fall-Related Injuries Ages 65+ by EOHHS Region Massachusetts: 2003-2005
2024
23332254 2311 2275
2146**
2443*
0
500
1000
1500
2000
2500
3000
Western Central Northeast Metro West Southeast Boston MassachusettsTotal
Ho
spit
al D
isch
arg
es p
er 1
00,0
00
Statistically different from state (p ≤.05)– Red (*) Statistically worse than state- Green (**) statistically better than state
Source: MDPH, Health Information, Statistics, Research and Evaluation Bureau, Research & Epidemiology Program

45
Hospital Discharge Rates for Fall-Related Injuries by EOHHS Region Massachusetts: 2003-2005
380 379 375 374338 *
357 *
419 *
0
100
200
300
400
500
Western Central Northeast Metro West Southeast Boston MA
Dis
ch
arg
es
pe
r 1
00
,00
0
Age-adjusted to the 2000 US standard population.Source: Division of Health Care Finance and Policy. Calendar Year 2003-2005. Emergency Visits
Statistically different from state (p ≤.05)– Red (*) Statistically worse than state- Green (**) statistically better than state
46
Infectious Diseases
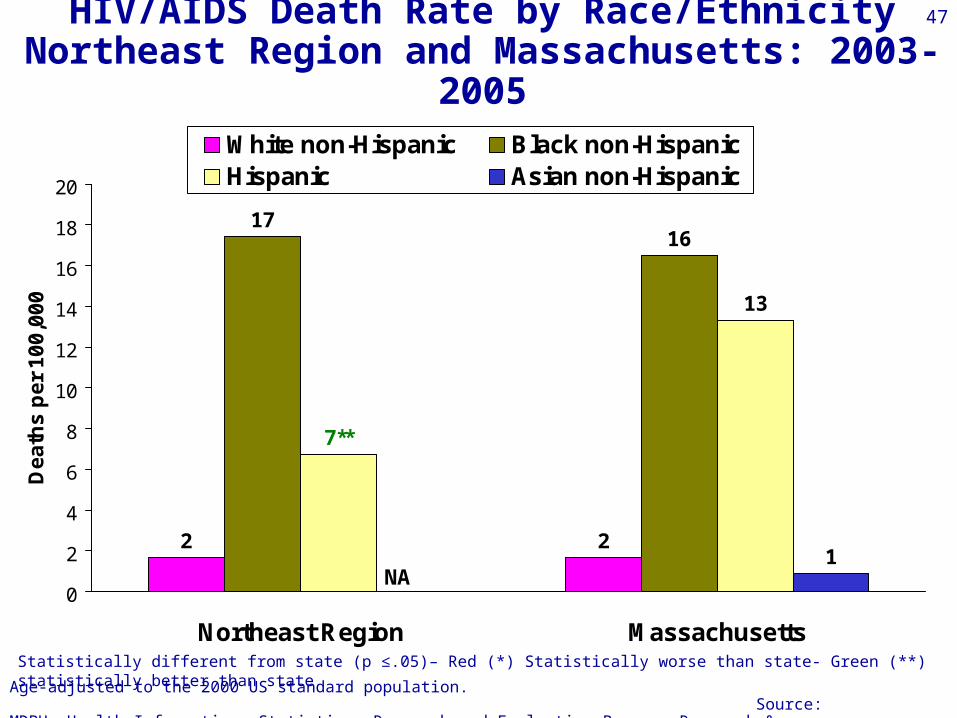
47HIV/AIDS Death Rate by Race/EthnicityNortheast Region and Massachusetts: 2003-2005
2 2
1716
13
1
7**
0
2
4
6
8
10
12
14
16
18
20
Northeast Region Massachusetts
De
ath
s p
er
10
0,0
00
White non-Hispanic Black non-HispanicHispanic Asian non-Hispanic
NA
Statistically different from state (p ≤.05)– Red (*) Statistically worse than state- Green (**) statistically better than state
Age-adjusted to the 2000 US standard population. Source: MDPH, Health Information, Statistics, Research and Evaluation Bureau, Research & Epidemiology Program
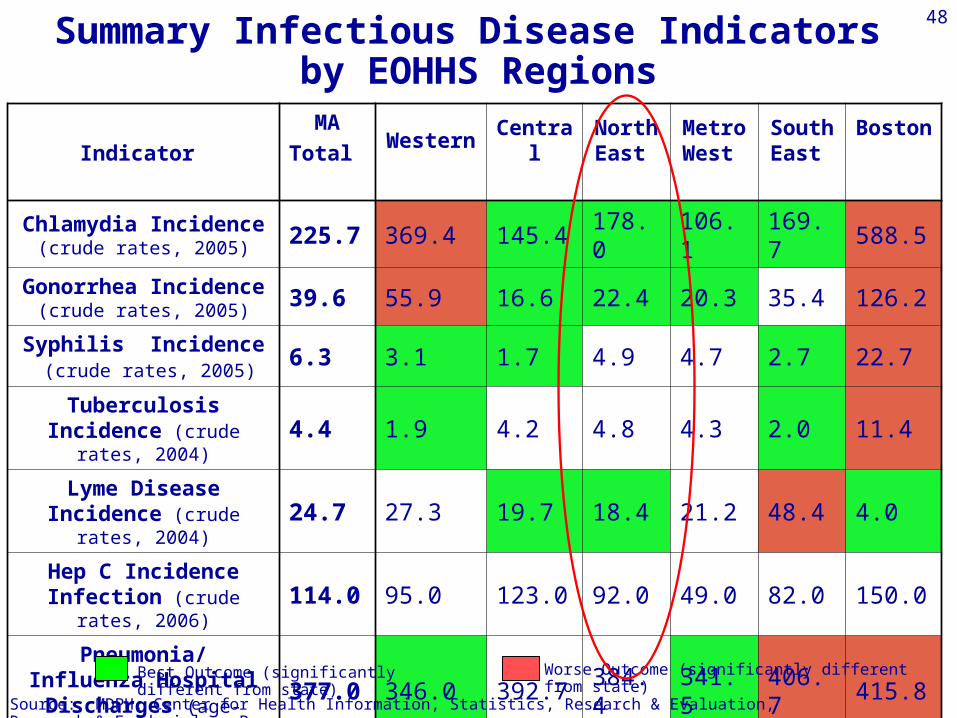
48
Indicator
MA
Total Western
Central
North East
Metro West
South East
Boston
Chlamydia Incidence (crude rates, 2005)
225.7 369.4 145.4 178.0 106.1 169.7 588.5
Gonorrhea Incidence (crude rates, 2005)
39.6 55.9 16.6 22.4 20.3 35.4 126.2
Syphilis Incidence (crude rates, 2005)
6.3 3.1 1.7 4.9 4.7 2.7 22.7
Tuberculosis Incidence (crude rates, 2004)
4.4 1.9 4.2 4.8 4.3 2.0 11.4
Lyme Disease Incidence (crude rates, 2004)
24.7 27.3 19.7 18.4 21.2 48.4 4.0
Hep C Incidence Infection (crude rates, 2006)
114.0 95.0 123.0 92.0 49.0 82.0 150.0
Pneumonia/ Influenza Hospital Discharges
(age-adjusted, 2005)377.0 346.0 392.7 384.4 341.5 406.7 415.8
Summary Infectious Disease Indicators by EOHHS Regions
Source: MDPH, Center for Health Information, Statistics, Research & Evaluation, Research & Epidemiology Program
Best Outcome (significantly different from state) Worse Outcome (significantly different from state)

49
Asthma indicators
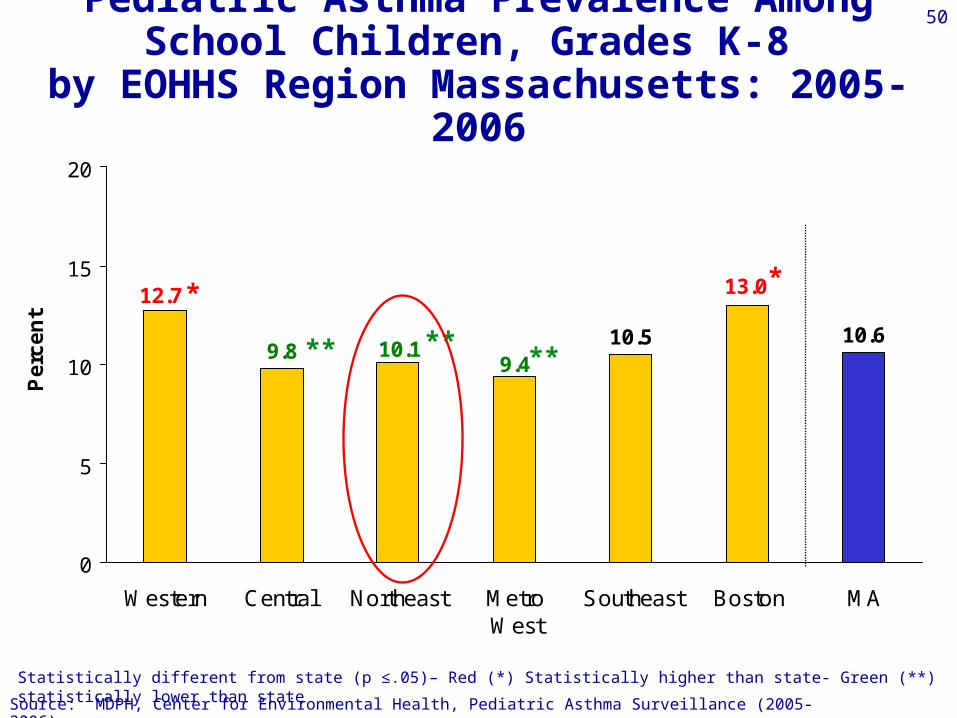
50Pediatric Asthma Prevalence Among School Children, Grades K-8
by EOHHS Region Massachusetts: 2005-2006
10.5 10.69.4
10.1
12.7
9.8
13.0
0
5
10
15
20
Western Central Northeast MetroWest
Southeast Boston MA
Pe
rce
nt
Source: MDPH, Center for Environmental Health, Pediatric Asthma Surveillance (2005-2006)
**
** ****
Statistically different from state (p ≤.05)– Red (*) Statistically higher than state- Green (**) statistically lower than state
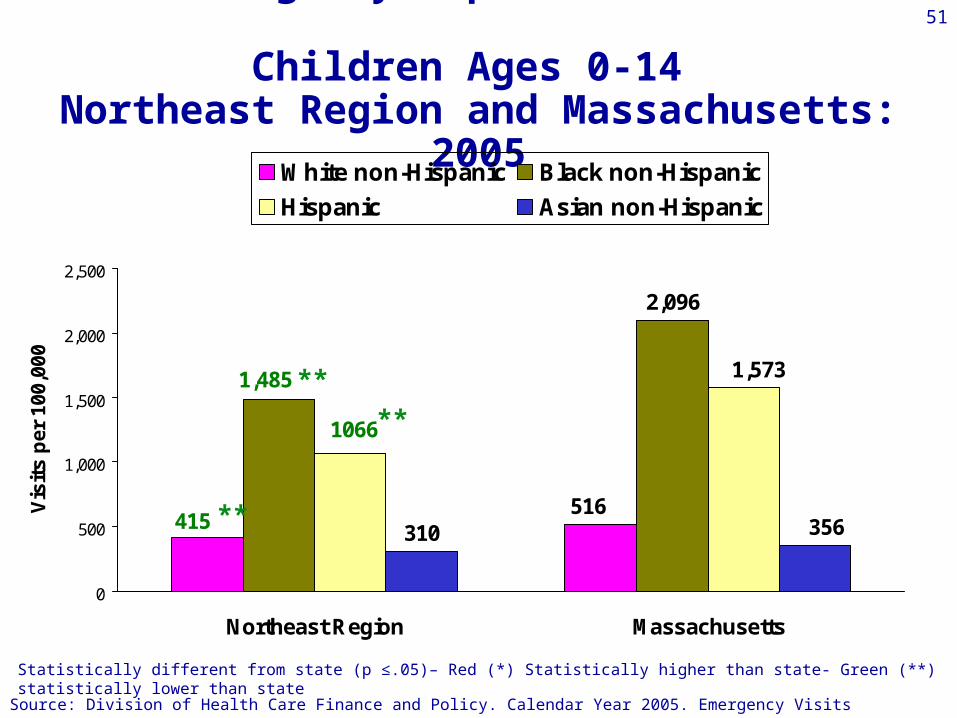
51Asthma Emergency Department Visit Rates Children Ages 0-14
Northeast Region and Massachusetts: 2005
2,096
310415516
1,485
1066
1,573
356
0
500
1,000
1,500
2,000
2,500
Northeast Region Massachusetts
Vis
its
per
100
,000
White non-Hispanic Black non-Hispanic
Hispanic Asian non-Hispanic
**
**
Source: Division of Health Care Finance and Policy. Calendar Year 2005. Emergency Visits
Statistically different from state (p ≤.05)– Red (*) Statistically higher than state- Green (**) statistically lower than state
**

52
LYNN1570.8
LAWRENCE1494.5
Pediatric Asthma Emergency Visit Rates by Towns*Among Chilldren Ages <5
North East Region - Massachusetts 2004-2005
Emergency Visit Rates by Townsper 100,000
Significantly higher than state rate
Not different from state rate
Significantly lower than state rate
*Towns with less than 5 cases in the period were excluded.
Massachusetts State Total Rate: 1,136.2
Source: Division of Health Care Finance and Policy. Calendar Year 2005. Emergency Visits
Pediatric Asthma Emergency Visit Rates by Towns*Among Children Ages <5
Northeast Region – Massachusetts 2004-2005
53
Refugee Health Indicators

54
Refugee Arrivals: Northeast Region Fiscal Year 2002-2006
• 1,312 refugees resettled over 5 years
• Increasing diversity in population
• 45% age <19 at arrival
• Cities/Towns with largest number of arrivals: Lowell, Lynn, Malden
0
50
100
150
200
250
FY02 FY03 FY04 FY05 FY06
Africa E/SEAsia
Eur/CAsia Am/Carib
NrE/SAsia
Source: MDPH, Refugee and Immigrant Health Program and the Bureau of Communicable Disease Control Office of Integrated Surveillance and Informatics
55
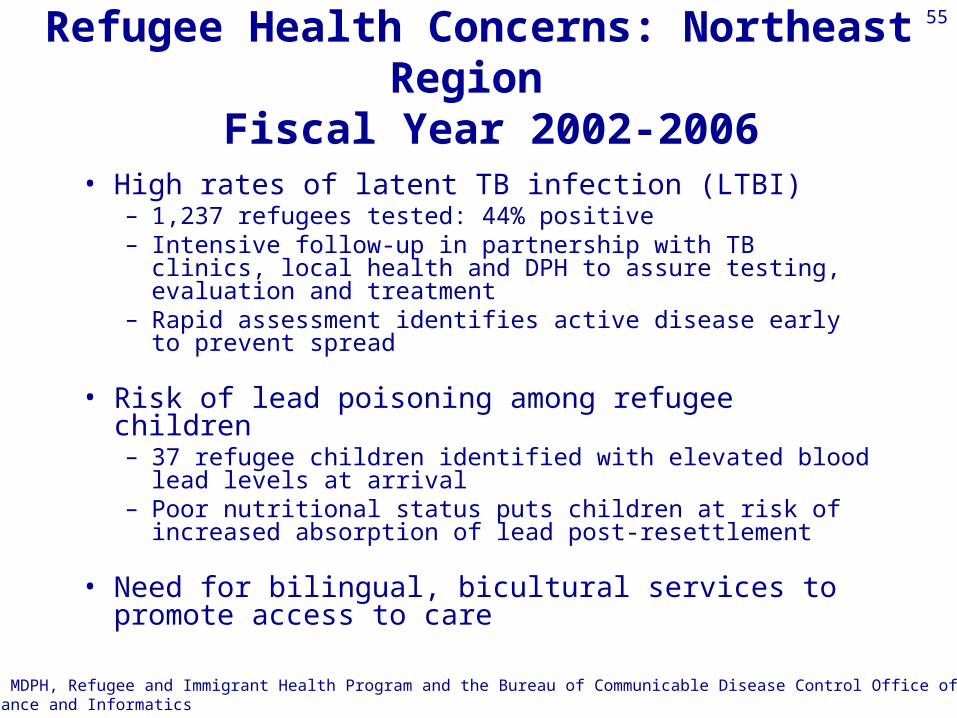
Refugee Health Concerns: Northeast Region Fiscal Year 2002-2006
• High rates of latent TB infection (LTBI)– 1,237 refugees tested: 44% positive– Intensive follow-up in partnership with TB clinics, local health
and DPH to assure testing, evaluation and treatment– Rapid assessment identifies active disease early to prevent
spread
• Risk of lead poisoning among refugee children– 37 refugee children identified with elevated blood lead levels
at arrival– Poor nutritional status puts children at risk of increased
absorption of lead post-resettlement
• Need for bilingual, bicultural services to promote access to care
Source: MDPH, Refugee and Immigrant Health Program and the Bureau of Communicable Disease Control Office of Integrated Surveillance and Informatics

56
Summary
• Excluding the larger communities, the Northeast region is a relatively healthy place to live:– Hypertension and diabetes hospitalizations are lower
than the State– Homicides, STDs, HIV/AIDS, and pediatric asthma are
lower than the State– Injuries related to motor vehicles, firearms, and falls
have lower rates than the State• Residents of larger communities are
disproportionately affected by:– Lack of access to adequate prenatal care, especially in
Lawrence, Lowell, and Lynn– Infant mortality– Colorectal and lung cancer– Opioid related ER visits and fatal overdoses
57
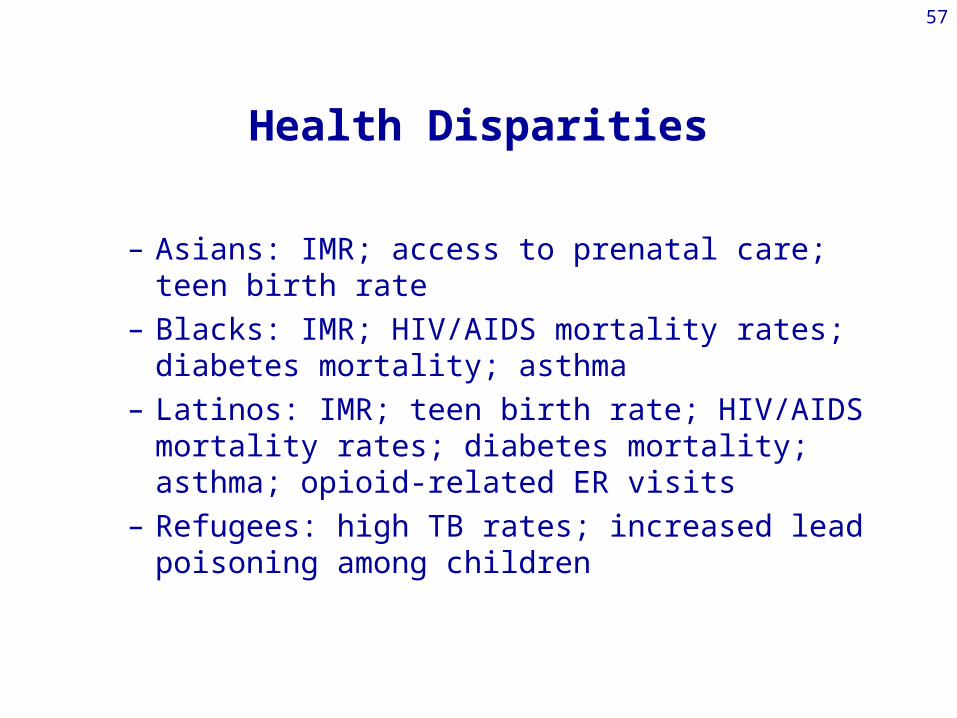
Health Disparities
– Asians: IMR; access to prenatal care; teen birth rate
– Blacks: IMR; HIV/AIDS mortality rates; diabetes mortality; asthma
– Latinos: IMR; teen birth rate; HIV/AIDS mortality rates; diabetes mortality; asthma; opioid-related ER visits
– Refugees: high TB rates; increased lead poisoning among children
58
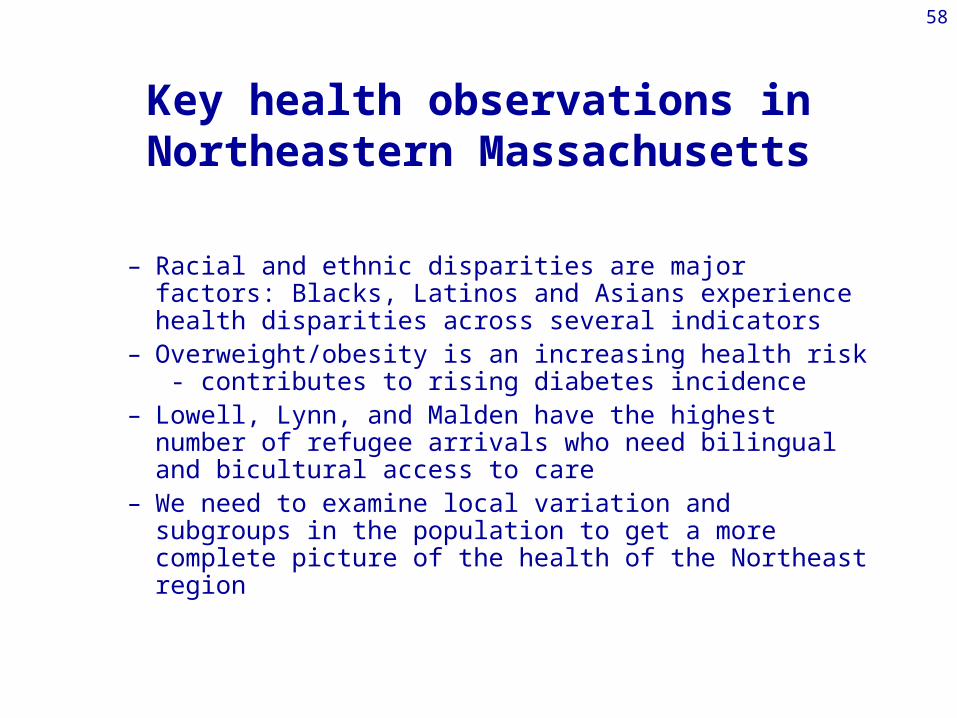
Key health observations in Northeastern Massachusetts
– Racial and ethnic disparities are major factors: Blacks, Latinos and Asians experience health disparities across several indicators
– Overweight/obesity is an increasing health risk - contributes to rising diabetes incidence
– Lowell, Lynn, and Malden have the highest number of refugee arrivals who need bilingual and bicultural access to care
– We need to examine local variation and subgroups in the population to get a more complete picture of the health of the Northeast region
59
How Can You Access these Data?• Hard Copies: (617) 624-5674
• Data Questions: (617) 624-5640
• TDD/TTY: (617) 624-6001
• DPH Website:
mass.gov/dph/bhsre/resep/resep.htm
• For other questions or suggestions:
[email protected], 617-624-6021
• For more detailed community data:
http://masschip.state.ma.us/

60
Q/A
Related Documents