las School of the Environment and Earth Sciences, Duke Univer tment of Civil and Environmental Engineering, Duke University Bringing Photosynthesis to the Atmosphere: a feedback on terrestrial water cycling Gabriel Katul 1,2 & Ram Oren 1

1 Nicholas School of the Environment and Earth Sciences, Duke University 2 Department of Civil and Environmental Engineering, Duke University Bringing.
Dec 29, 2015
Welcome message from author
This document is posted to help you gain knowledge. Please leave a comment to let me know what you think about it! Share it to your friends and learn new things together.
Transcript

1Nicholas School of the Environment and Earth Sciences, Duke University
2Department of Civil and Environmental Engineering, Duke University
Bringing Photosynthesis to the Atmosphere: a feedback on terrestrial
water cycling
Gabriel Katul1,2 & Ram Oren1
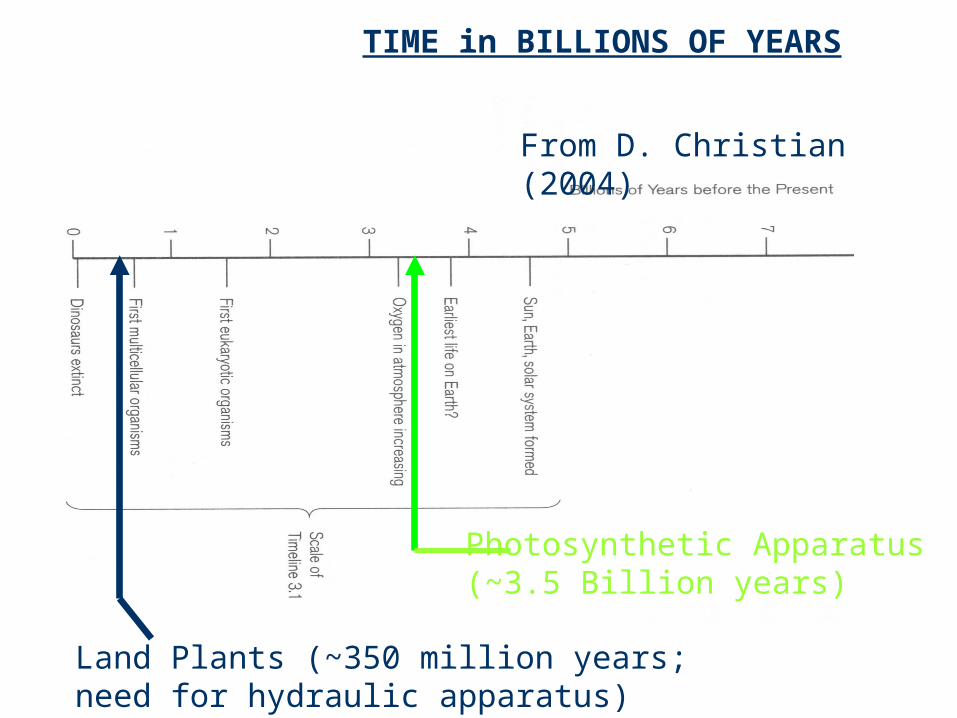
Photosynthetic Apparatus (~3.5 Billion years)
Land Plants (~350 million years; need for hydraulic apparatus)
TIME in BILLIONS OF YEARS
From D. Christian (2004)
Background:
The evolution of land plants required hydraulic adjustments that permitted the display of the photosynthetic machinery within a desiccating atmosphere.
Background:
A productive display of this machinery necessitates a vertical distribution of chlorophyll so that the light-use efficiency of the organism is increased relative to a concentrated display of chlorophyll.
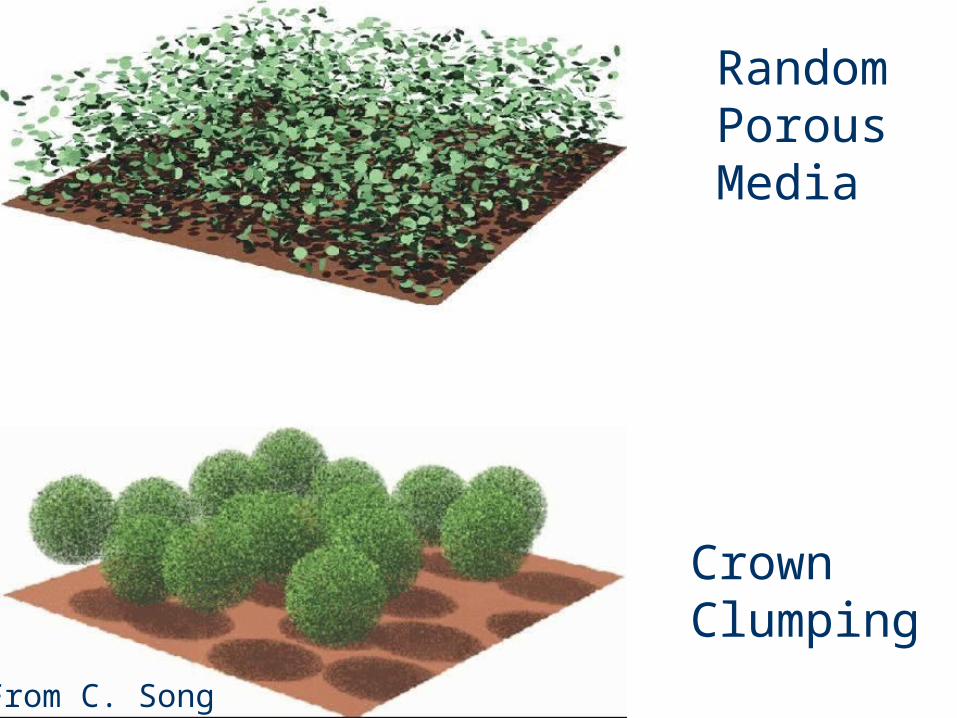
RandomPorousMedia
CrownClumping
From C. Song

Background
This vertical distribution required certain “engineering solutions” to permit water to be supplied to leaves enclosed in an envelope that permits a controlled exchange of CO2 for
water vapor

Question
Is there some connections between these ‘engineering solutions’ and the photosynthetic properties of the plant?
Contemporary approaches neglect this connection.

Introduction – 1:
There is growing evidence that ecophysiological properties are correlated to hydraulic properties.
Brodribb and Feild (2000) reported strong correlation between maximum carboxylation capacity and stem hydraulic conductivity.

Background - 1:Field Experiments
Data include conifers, vessel-less and vessel bearing taxa from New Caledonia and Tasmania (data from Brodribb and Feild, 2000)
Leuning (2002)

Background – 2:Field Experiments
• Numerous ecophysiological studies reported linkages between canopy photosynthesis and conductance.
• Many hydraulic studies reported linkages between plant hydraulics and photosynthesis (e.g. Hubbard et al., 2001).
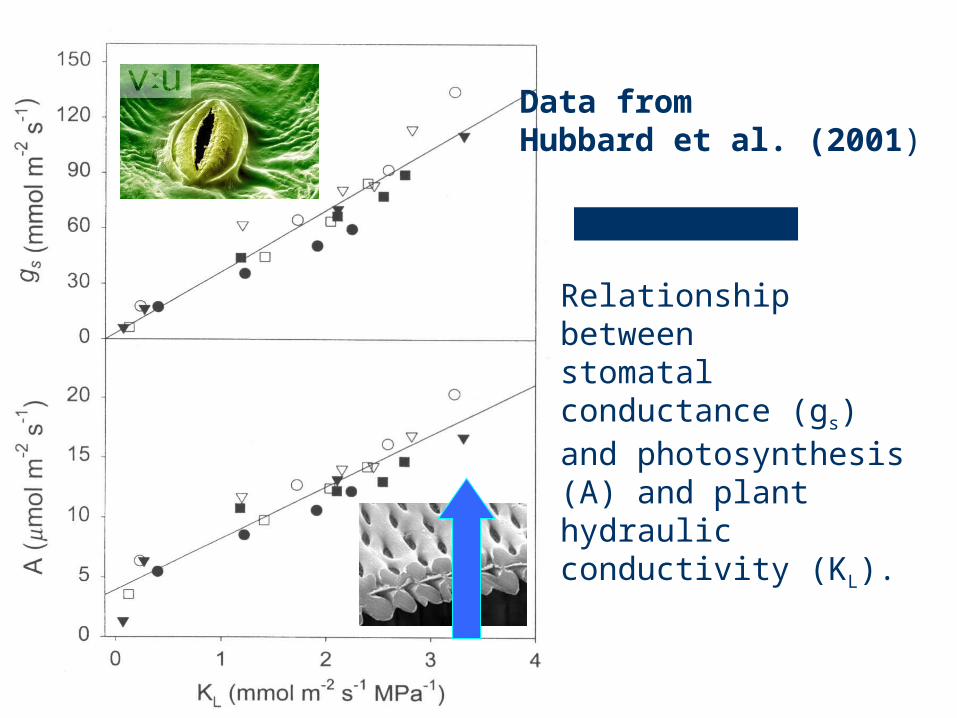
Relationship between stomatal conductance (gs) and photosynthesis (A) and plant hydraulic conductivity (KL).
Data from Hubbard et al. (2001)

Background – 4:Missing Link
To date, no analytic framework has been developed to relate hydraulic and ecophysiological properties.
This study proposes an “equilibrium hypothesis” for coupled CO2 & H2O to arrive at analytic expressions between soil-plant hydraulics and ecophysiological
properties
Hypothesis - 1:
The basic hypothesis is that hydraulic and eco-physiological properties co-evolve at time scales relevant to stand development.

Hypothesis – cont’d:
• The hydraulic and ecophysiological parameters
evolve so that the maximum biochemical demand
for carbon uptake is in equilibrium with the
maximum carbon gain permissible by the soil-root-
xylem hydraulics.

Hydraulic Supply: Water Transport in Plants

resr
esw rr
J
Soil Water Status
Soil Water CharacteristicCurve
Soil Hydraulic Conductivity Function and RAI
Hydraulic Supply: Water Transport in Plants

e
reG
tl
Onset of Cavitation
Root-to-Epidermis [Simplest Model]
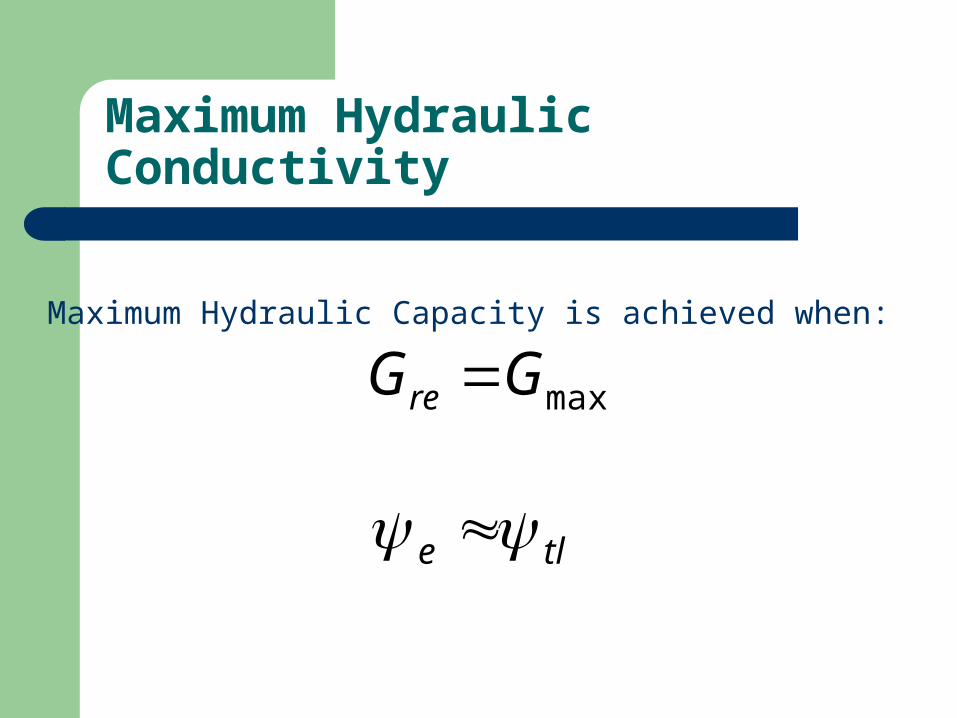
Maximum Hydraulic Capacity is achieved when:
tle
maxGGre
Maximum Hydraulic Conductivity

From Hacke et al. (2000): Pinus taeda

Sperry et al. (2000) demonstrated that plant pressure is close the cavitation threshold within the root-xylem system.
tle

Stomatal Closure – and Xylem Pressure
Stomatal closure observed during drought is a result of a decline in plant hydraulic conductance in the xylem of the roots.
This can explains why stomatal conductance shuts down at suction levels well below the turgor suction.

Vascular Plants
New processes associated with the evolution of a larger
and more complex plant body became more limiting to
gas exchange than those occurring within individual
cells (Sperry, 2000; Katul et al., 2003)

Gas Exchange - Stomata

ss DgLAIE 6.1
Water Loss from Epidermis to Atmosphere:
Setting E = Jw (Steady State) and noting that:
is
ns CC
Ag
s
is
resr
tlsn D
CC
rrLAIA
6.1
1
min,
Hence, the maximum hydraulic supply of CO2 (per LAI)

d
i
in R
C
CA
2
*1
Biochemical Demand for CO2
Farquhar et al. (1980):
Equate maximum hydraulic supply to maximum biochemical demand and solve for Ci
2
*1
min, 6.1
1
i
i
s
ia
resr
tlsn C
C
D
CC
rrLAIA

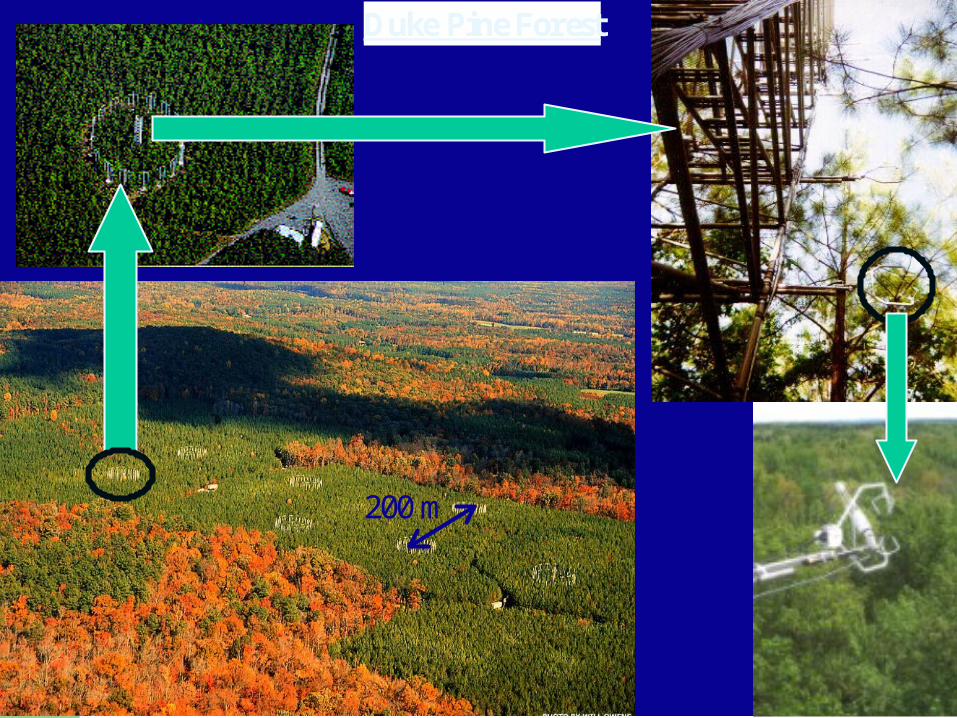
200 m
Duke Pine Forest

Implications to FACE: Conductance/Down-regulation
Reference State: The nothing changed except atmospheric CO2 scenario:
amba
amb
ambambc
elva
elv
elvelvc
ambamba
ambs
elvelva
elvs
ambn
elvn
C
V
C
V
Cg
Cg
A
A
2
max,
2
max,
1
1
15.1max,
max, amb
c
elvc
V
V

Implications to FACE
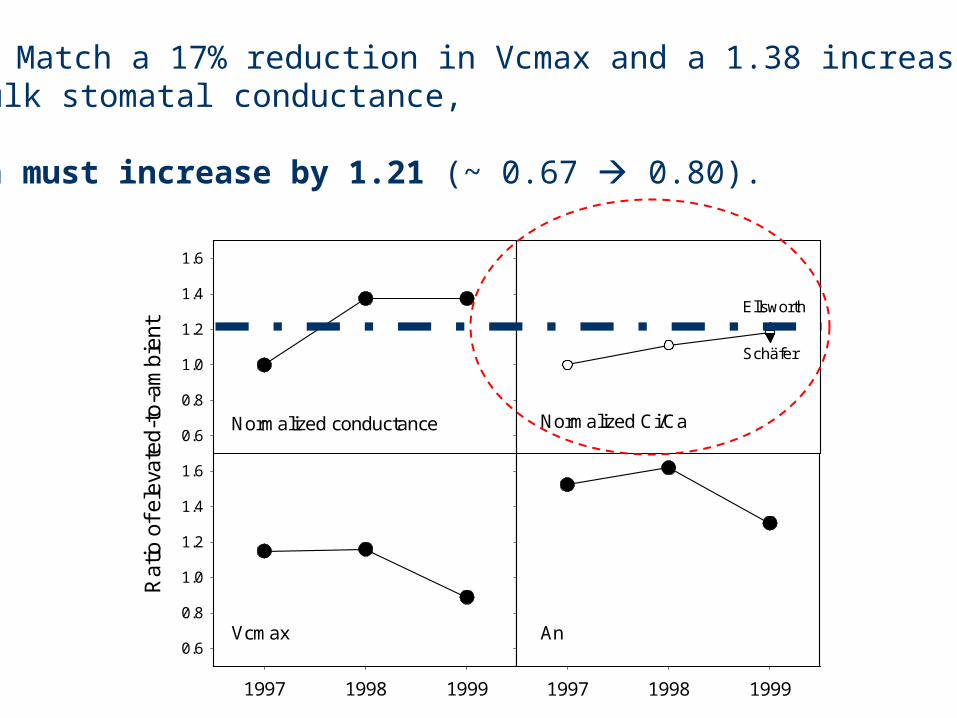
Rogers and Ellsworth (2002) report a reduction in Vcmax of 25% (for older foliage). Photosynthesis-weighted Vcmax
drops by ~ 17%.
Schafer et al. (2002) – bulk canopy conductance increased by ~ 25% but no change in LAI.
0.6
0.8
1.0
1.2
1.4
1.6
1997 1998 1999
Rat
io o
f ele
vate
d-t
o-am
bien
t
0.6
0.8
1.0
1.2
1.4
1.6
Normalized conductance Normalized Ci/Ca
Ellsworth
Schäfer
Vcmax
1997 1998 1999
An
To Match a 17% reduction in Vcmax and a 1.38 increasein bulk stomatal conductance,
Ci/Ca must increase by 1.21 (~ 0.67 0.80).

Experiment: SETRES II
SouthEast Tree Research and Education Site (SETRES) – 2.
A large-scale genotype nutrition interaction experiment designed to quantify the effects of fertilization on C- cycling in a managed southern pine forest in North Carolina
(operated by the U.S. Forest Service).

SETRES I & II Fertilization Experiment
After 6 years of fertilization
Fertilization Rate (~11 g N m-2 y-1):
Leaf Area Index Doubled (1.65 3.51)
Maximum Leaf Carboxilation Capacity Increased
by about 20%.
Respiring Biomass Increased by ~ 48%.
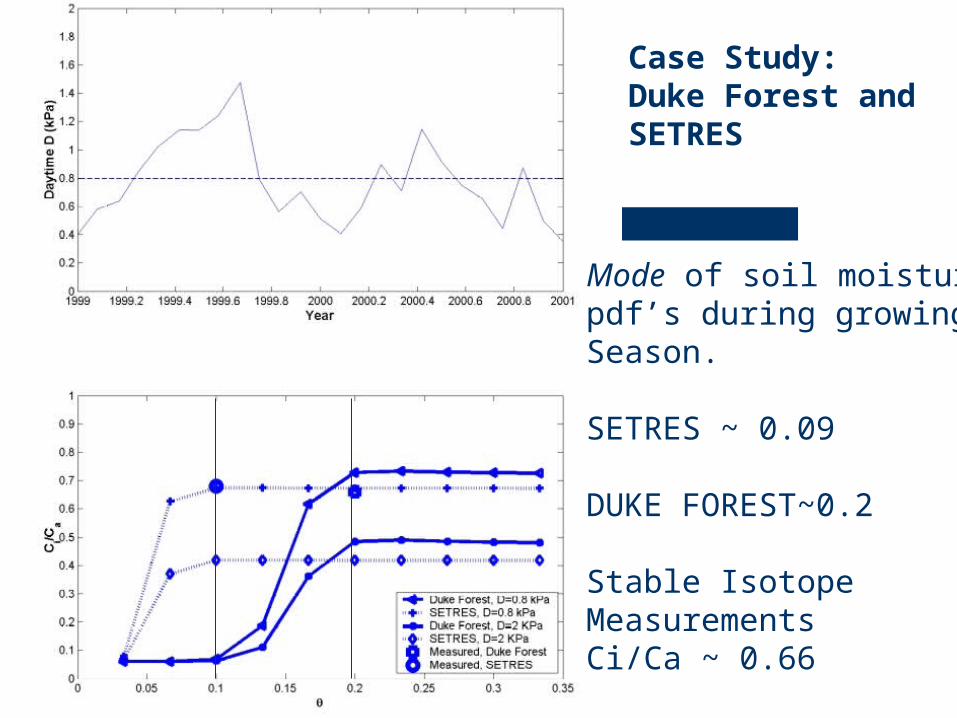
Case Study: Duke Forest and SETRES
Mode of soil moisturepdf’s during growingSeason.
SETRES ~ 0.09
DUKE FOREST~0.2
Stable Isotope MeasurementsCi/Ca ~ 0.66

Fertilization Increases Vcmax
Leaf Nitrogen

)2(
)1(
)1(
)2(
)2(max,
)1(max,
)1(
)2(
)2(max
)1(max
ref
ref
s
s
c
c
g
g
LAI
LAI
g
g
LAI
LAI
V
V
Effect of N-Fertilization on Vcmax (SETRES –I & II)
18.150
125
51.3
65.1)(
max
)(max c
c
fc
V
V
Using LAI (from SETRES – II) and sapflux based measurements (from SETRES – I ) of
17.14.852.100)(max
)(max c
cf
c VV
Gas Exchange Measurements (SETRES – II):
refg
General Remark:
Equilibrium model provides some constraints on how shifts in plant hydraulic and physiological properties affect photosynthesis and water uptake.
Hydraulic shifts already measured in the Prototype (Schafer, Oren) and physiological shifts reported in FACE, the next logical question is whether N x CO2 effects can be predicted by the equilibrium model.

Engineering Solutions – Climate /Reproduction?
Emergence of land plants from aquatic habitat also required engineering solutions for re-production (mainly - pollen and its dispersal).
Is there some connection between the ‘engineering solutions’ for plant hydraulics and pollen dispersal?
Timely Topic: Pollen Dispersal of GM Trees
Increased use of GM trees is now being considered and debated within the policy arena.
The “finger-print” of this increase is perhaps evident in the number of permit applications to the USDA-APHIS, now exceeding 150 types of transgenic trees (Mann and Plummer 2002).
Quantifying GM pine pollen and seed dispersal pattern is a necessary first step to assessing gene flow, landscape change, and other unforeseen ecological risk – especially with elevated atmospheric CO2 (LaDaux and Clark, 2001).

x=LongitudinalDistance (m)
y=LateralDistance (m)
z=Vertical Distance (m)
Uplifting
Mean WindDirection
d
d
Pr(d)DispersalKernel

List
Litu

Reproductive (16 years) and Harvesting Ages (25 years)are used in model calculations. Stand attributes are based on Leaf area measurements and site index for the stand at Duke Forest.
POLLEN SIMULATIONS FOR PINE PLANTATIONS

Duke Forest, NC

Dispersal Kernels for the two stand ages
Kernel calculations excluded pollen that escaped the atmospheric boundary layer top or experienced travel times in excess of 1 hour.
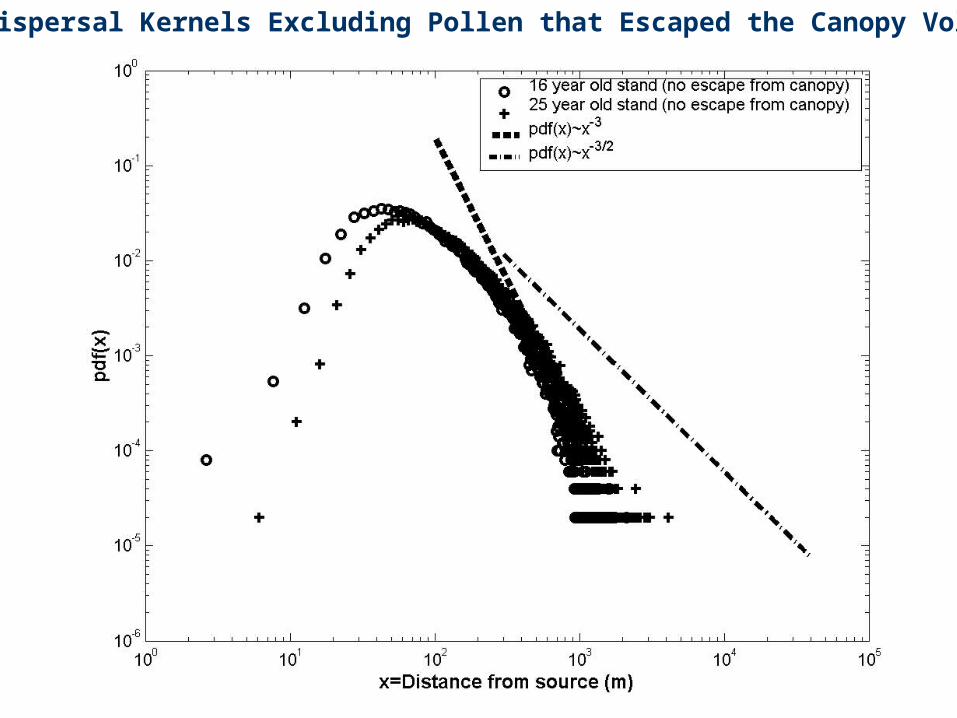
Dispersal Kernels Excluding Pollen that Escaped the Canopy Volume

Oilseed rape Frequency of hybrid formation (GM and non-GM) was 0.156% at 200 m
Maize (corn ) Most pollen fell within 5 m, 98% of the pollen remained within a 25–50 m.
Cultivated rice Pollen horizontal movement was limited to 10 m.
Potato Isolation distance of 20 m appears adequate for transgenic potatoes. However, maximum distances for which pollen particles were detected is 80 m.
Cotton Pollen trapped decrease to 0.03% at 50 m from the source.
Apples Maximum distance pollen particles were detected is 56 m
Crop Comments
Wheat Maximum distance pollen were detected is 20 m
Biocontainment zones for few GM crops

1. Conifer pollen is NOT likely to be of negligible viability at those distances (viability diminishes due to excess UV-B, cold air temperatures, or dehydration).
2. Given the long dispersal distances reported here, a regulatory framework that distinguishes between annual (and perennial) crops and forests is only logical.
Results

Broader Conclusions
The evolution of land plants required hydraulic adjustments that permitted the display of the photosynthetic machinery within a desiccating atmosphere.
Does this ‘equilibrium’ between plant hydraulic and photosynthetic properties also govern reproductive strategies?
Related Documents