1 New Hampshire Coalition on New Hampshire Coalition on Aging Annual Meeting Aging Annual Meeting October 28, 2009 October 28, 2009 “…to raise new ideas and improve policy debates through quality information and analysis on issues shaping New Hampshire’s future.” Board of Directors Donna Sytek, Chair John B. Andrews John D. Crosier, Sr. William H. Dunlap Sheila T. Francoeur Chuck Morse Todd I. Selig Stuart V. Smith, Jr. James E. Tibbetts Brian F. Walsh Kimon S. Zachos Martin L. Gross, Chair Emeritus Staff Steve Norton, Executive Director Ryan Tappin Cathy Arredondo Watching the World Change

1 New Hampshire Coalition on Aging Annual Meeting October 28, 2009 “…to raise new ideas and improve policy debates through quality information and analysis.
Dec 16, 2015
Welcome message from author
This document is posted to help you gain knowledge. Please leave a comment to let me know what you think about it! Share it to your friends and learn new things together.
Transcript
1
New Hampshire Coalition on Aging New Hampshire Coalition on Aging Annual MeetingAnnual Meeting
October 28, 2009October 28, 2009
“…to raise new ideas and improve policy debates through quality information and analysis on issues shaping New Hampshire’s future.”
Board of DirectorsDonna Sytek, Chair
John B. Andrews
John D. Crosier, Sr.
William H. Dunlap
Sheila T. Francoeur
Chuck Morse
Todd I. Selig
Stuart V. Smith, Jr.
James E. Tibbetts
Brian F. Walsh
Kimon S. Zachos
Martin L. Gross, Chair Emeritus
StaffSteve Norton, Executive Director
Ryan Tappin
Cathy Arredondo
Watching the World Change
2
Takeaways
• Challenge Myths
• Each Community Needs to Watch and Understand The Power of Demographics
• Planning for Workforce Issues
• Realities require different approaches
3
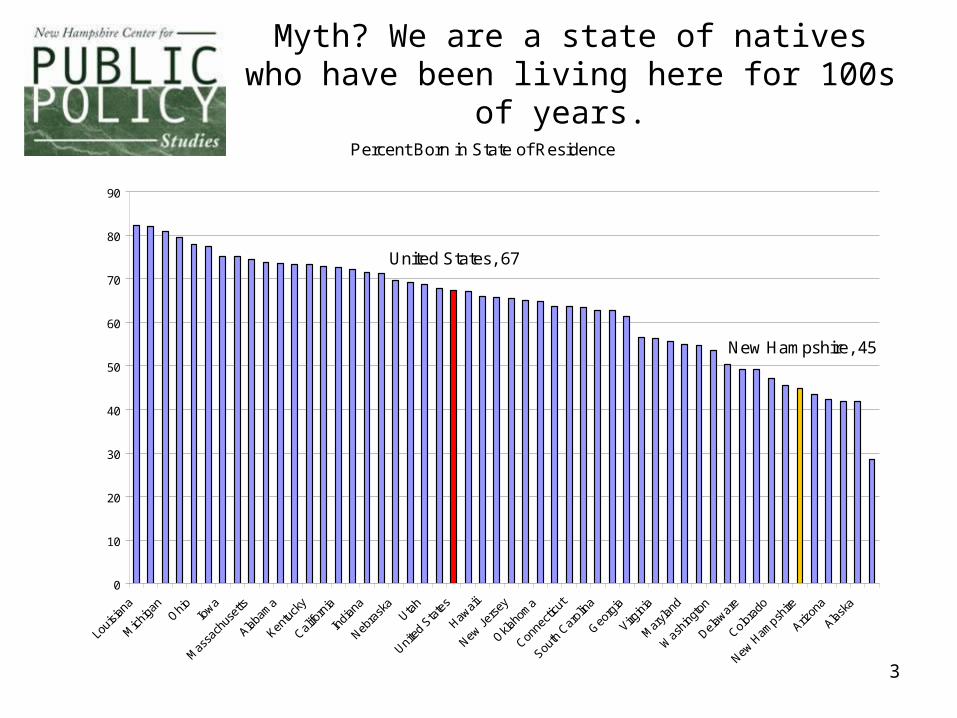
Myth? We are a state of natives who have been living here for 100s of years.
Percent Born in State of Residence
New Hampshire, 45
United States, 67
0
10
20
30
40
50
60
70
80
90
Louis
iana
Mich
igan
Ohio Iowa
Mas
sach
uset
ts
Alabam
a
Kentu
cky
Califo
rnia
India
na
Nebra
ska
Utah
United
Sta
tes
Hawaii
New Je
rsey
Oklaho
ma
Conne
cticu
t
South
Car
olina
Georg
ia
Virgini
a
Mar
yland
Was
hingt
on
Delawar
e
Colora
do
New H
amps
hire
Arizon
a
Alaska
4
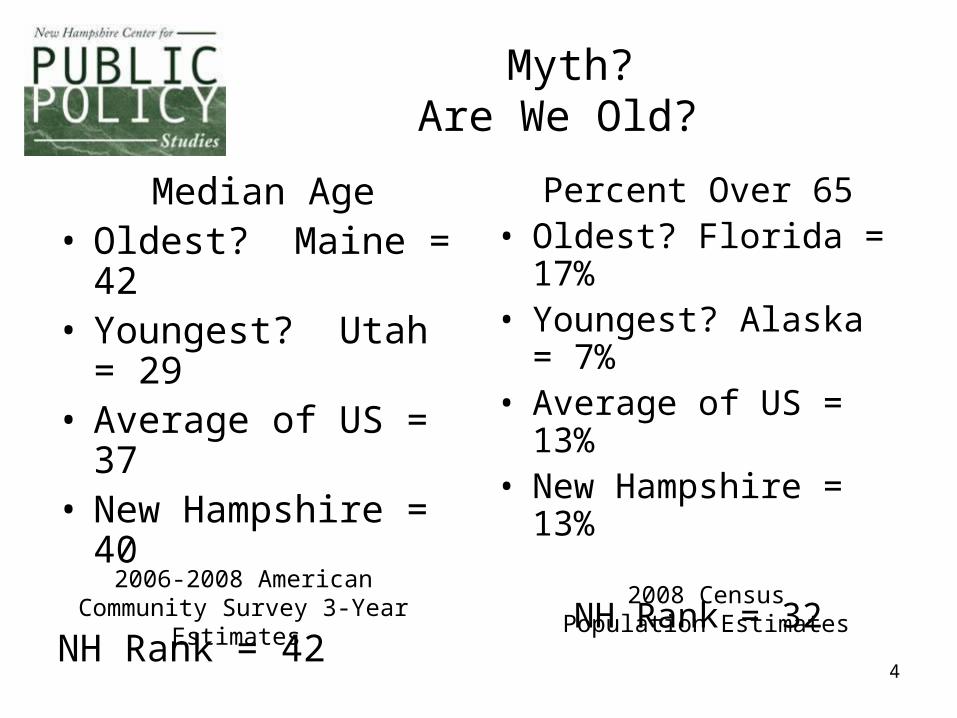
Myth?Are We Old?
Median Age• Oldest? Maine = 42• Youngest? Utah = 29• Average of US = 37• New Hampshire = 40
NH Rank = 42
Percent Over 65• Oldest? Florida = 17%• Youngest? Alaska =
7%• Average of US = 13%• New Hampshire = 13%
NH Rank = 32
2006-2008 American Community Survey 3-Year Estimates 2008 Census Population
Estimates

5
Why Challenge These Myths?

6
Pay Attention to Demographics and Decisions Made Which Impact Migration

7
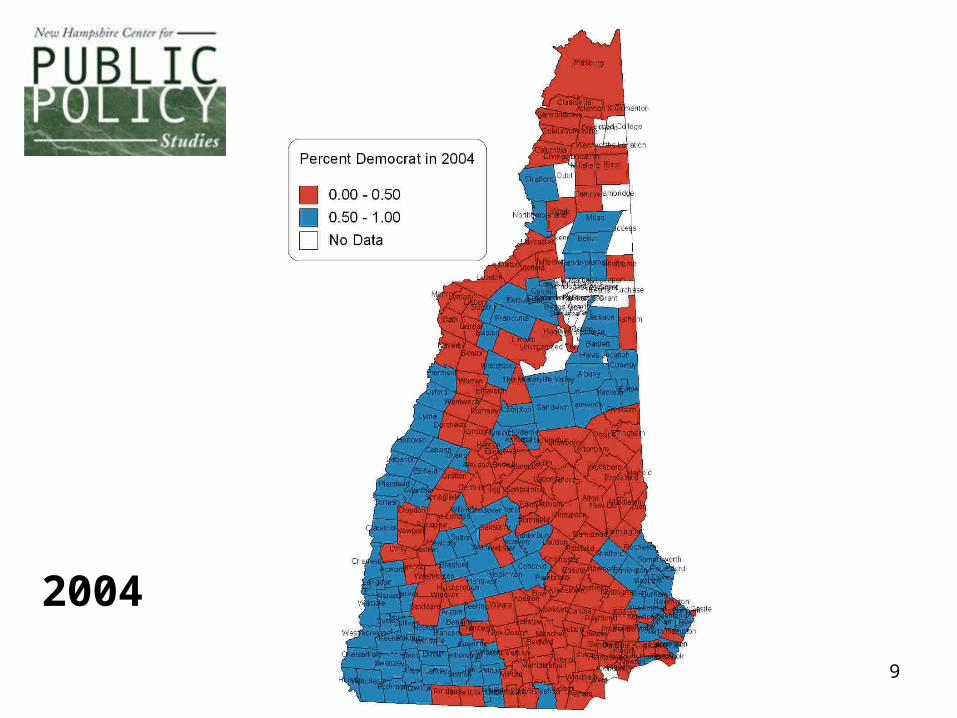
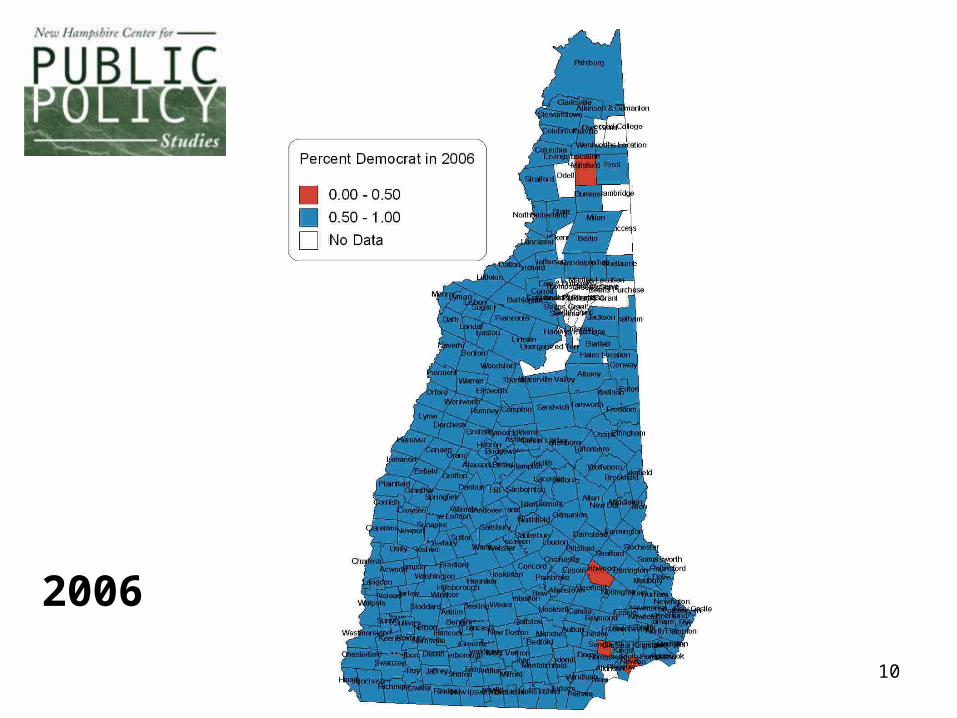
One Implication?
Voting Patterns Change
1984

8
1992
9
2004
10
2006

11
2008

12
What does the Future Look Like? We Don’t Really Know
Source: US Bureau of Economic Analysis
Ratio of Personal Income per Capita - NH to US
-15.0%
-10.0%
-5.0%
0.0%
5.0%
10.0%
15.0%
1970
1972
1974
1976
1978
1980
1982
1984
1986
1988
1990
1992
1994
1996
1998
2000
2002
2004

13
Aging Will HappenPopulation Projections by AgeOffice of Employment Security
674,885751,538 759,294 748,822 724,970 706,558
147,970
191,403 245,952 311,144 383,087 437,194
0
200,000
400,000
600,000
800,000
1,000,000
1,200,000
1,400,000
1,600,000
2000 2010 2015 2020 2025 2030
65+25-6415-24
5-14
14
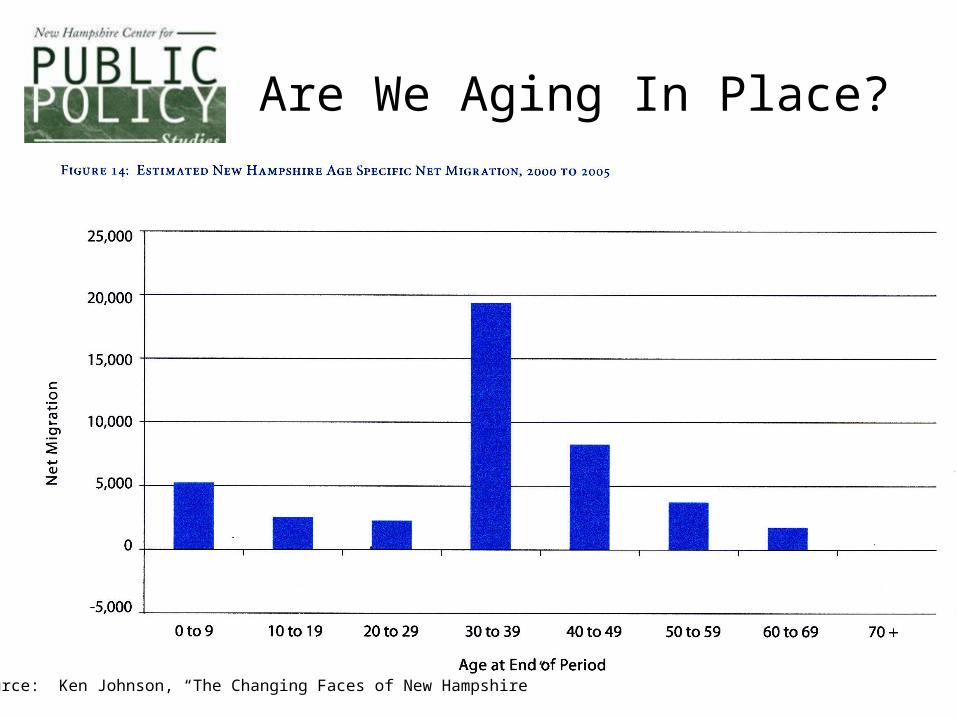
Are We Aging In Place?
Source: Ken Johnson, “The Changing Faces of New Hampshire”
15
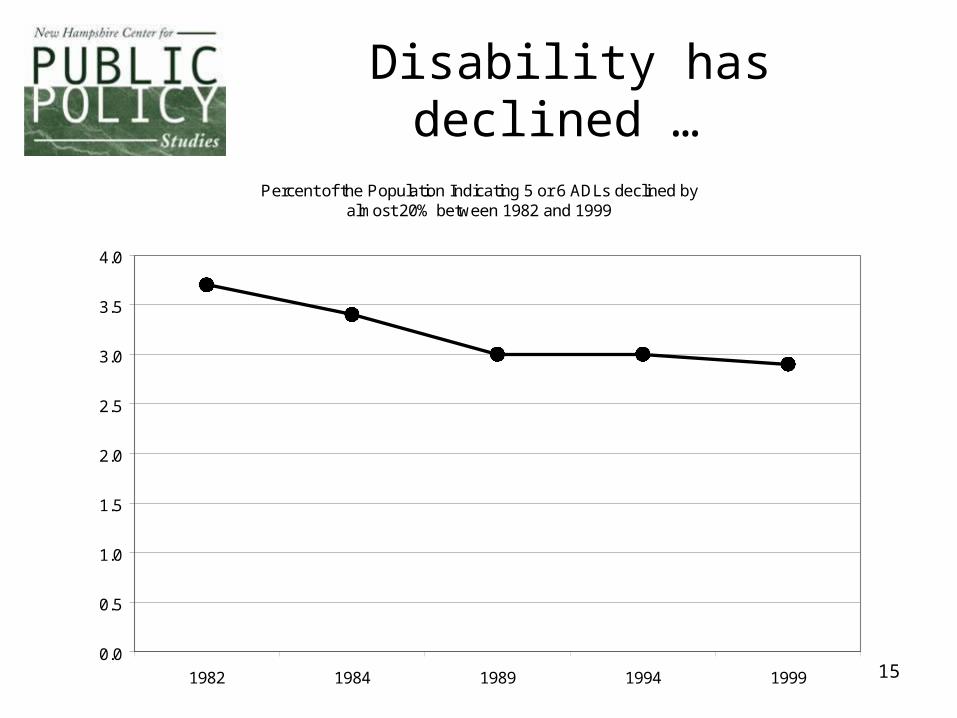
Disability has declined …
Percent of the Population Indicating 5 or 6 ADLs declined by almost 20% between 1982 and 1999
0.0
0.5
1.0
1.5
2.0
2.5
3.0
3.5
4.0
1982 1984 1989 1994 1999

16
17
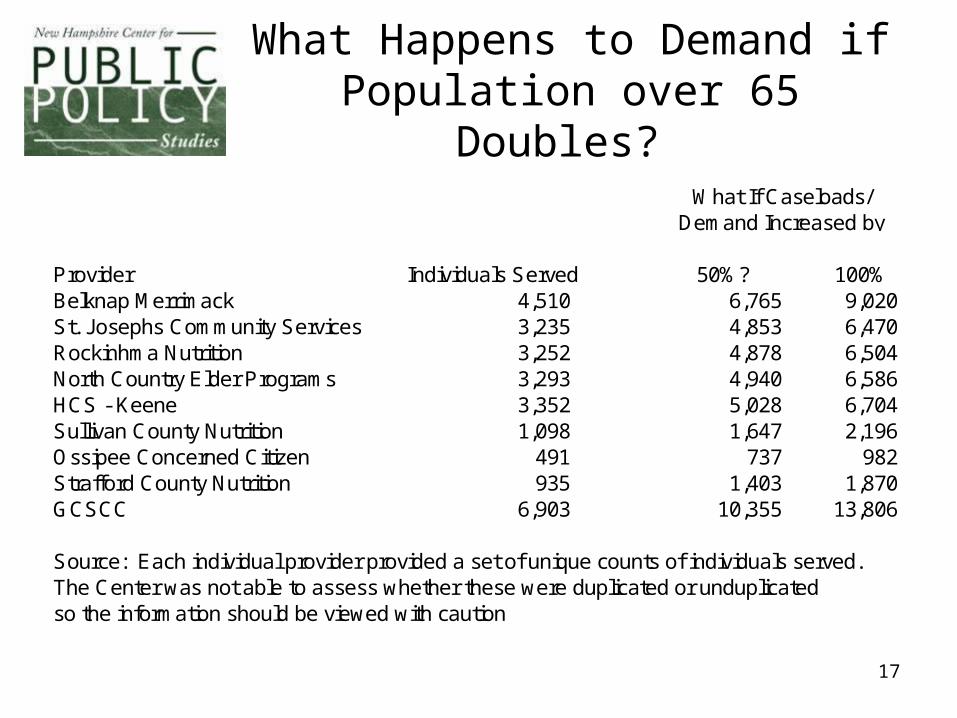
What Happens to Demand if Population over 65 Doubles?
Provider Individuals Served 50%? 100%Belknap Merrimack 4,510 6,765 9,020 St. Josephs Community Services 3,235 4,853 6,470 Rockinhma Nutrition 3,252 4,878 6,504 North Country Elder Programs 3,293 4,940 6,586 HCS - Keene 3,352 5,028 6,704 Sullivan County Nutrition 1,098 1,647 2,196 Ossipee Concerned Citizen 491 737 982 Strafford County Nutrition 935 1,403 1,870 GCSCC 6,903 10,355 13,806
Source: Each individual provider provided a set of unique counts of individuals served. The Center was not able to assess whether these were duplicated or unduplicatedso the information should be viewed with caution
What If Caseloads/ Demand Increased by
18
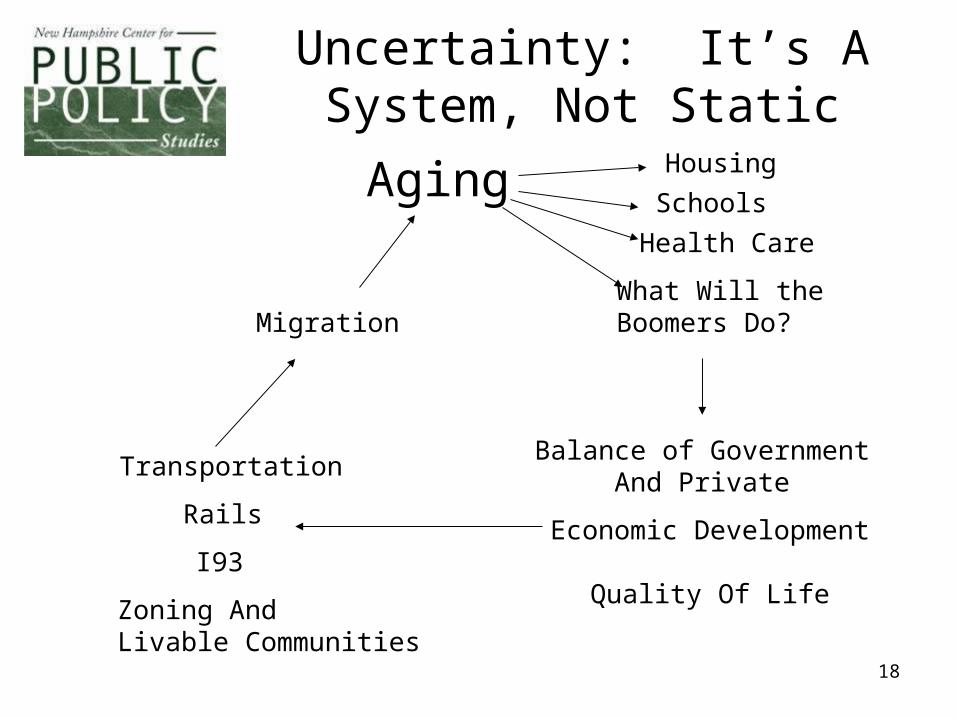
AgingSchools
Housing
Health Care
What Will the Boomers Do?
Balance of GovernmentAnd Private
Economic Development
Quality Of Life
Transportation
Rails
I93
Zoning And Livable Communities
Migration
Uncertainty: It’s A System, Not Static
19
Major Policy Levers Which May Affect Issue of Aging and Migration
• Transportation • Housing Prices• ‘Retaining Youth’ Initiatives (55 Initiative, the
Arts)• Information Highway• Conservation, Quality of Life, Water and Sewer• Business Development• State and Community Investment• Taking Advantage of Regional Opportunities
20
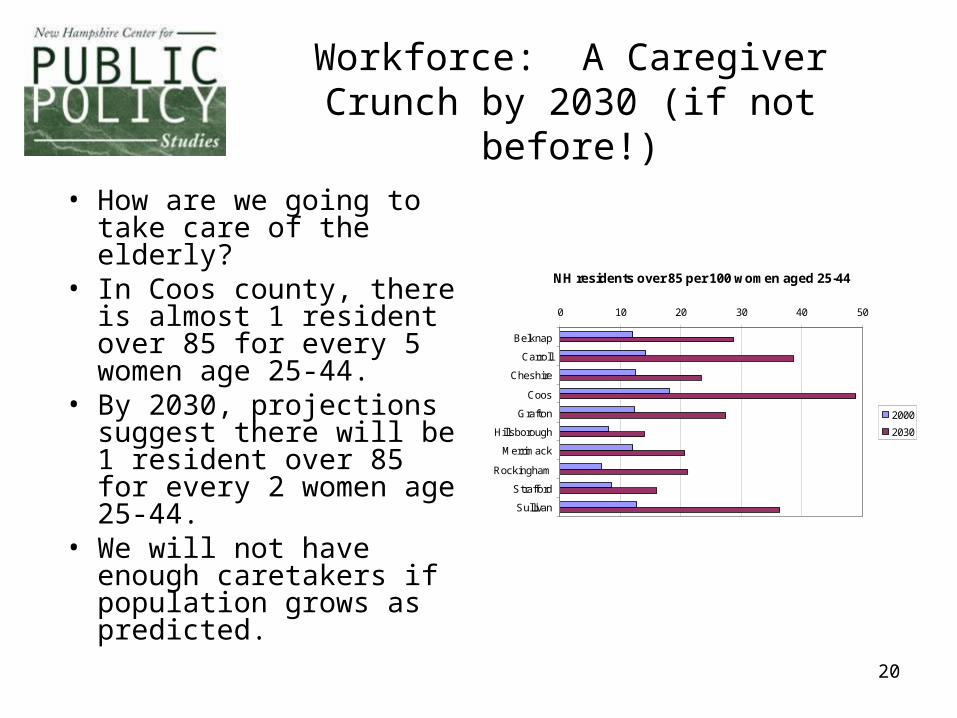
Workforce: A Caregiver Crunch by 2030 (if not before!)
• How are we going to take care of the elderly?
• In Coos county, there is almost 1 resident over 85 for every 5 women age 25-44.
• By 2030, projections suggest there will be 1 resident over 85 for every 2 women age 25-44.
• We will not have enough caretakers if population grows as predicted.
NH residents over 85 per 100 women aged 25-44
0 10 20 30 40 50
Belknap
Carroll
Cheshire
Coos
Grafton
Hillsborough
Merrimack
Rockingham
Strafford
Sullivan
2000
2030
21
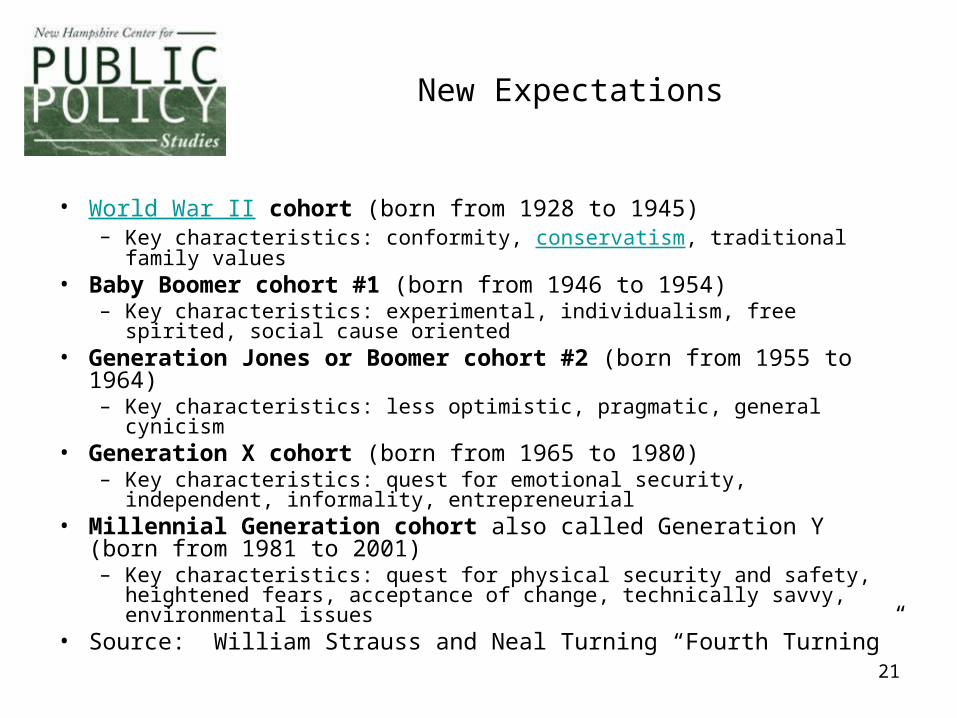
New Expectations
• World War II cohort (born from 1928 to 1945) – Key characteristics: conformity, conservatism, traditional family values
• Baby Boomer cohort #1 (born from 1946 to 1954) – Key characteristics: experimental, individualism, free spirited, social
cause oriented • Generation Jones or Boomer cohort #2 (born from 1955 to 1964)
– Key characteristics: less optimistic, pragmatic, general cynicism • Generation X cohort (born from 1965 to 1980)
– Key characteristics: quest for emotional security, independent, informality, entrepreneurial
• Millennial Generation cohort also called Generation Y (born from 1981 to 2001) – Key characteristics: quest for physical security and safety, heightened
fears, acceptance of change, technically savvy, environmental issues • Source: William Strauss and Neal Turning “Fourth Turning”
22
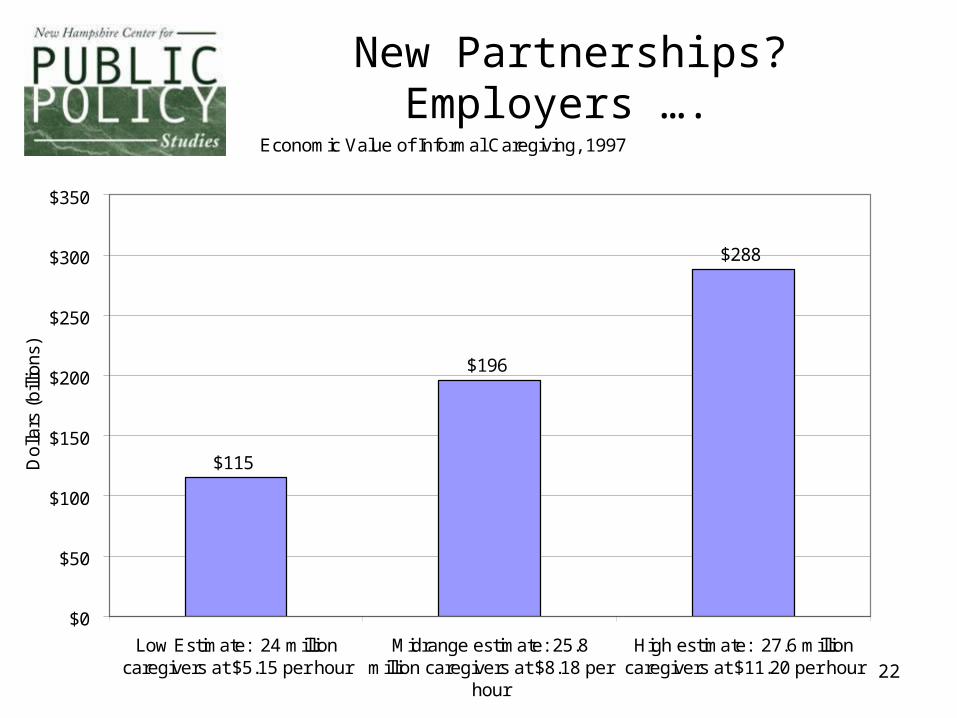
New Partnerships? Employers ….
Economic Value of Informal Caregiving, 1997
$115
$196
$288
$0
$50
$100
$150
$200
$250
$300
$350
Low Estimate: 24 millioncaregivers at $5.15 per hour
Midrange estimate: 25.8million caregivers at $8.18 per
hour
High estimate: 27.6 millioncaregivers at $11.20 per hour
Dol
lars
(bi
llion
s)
23
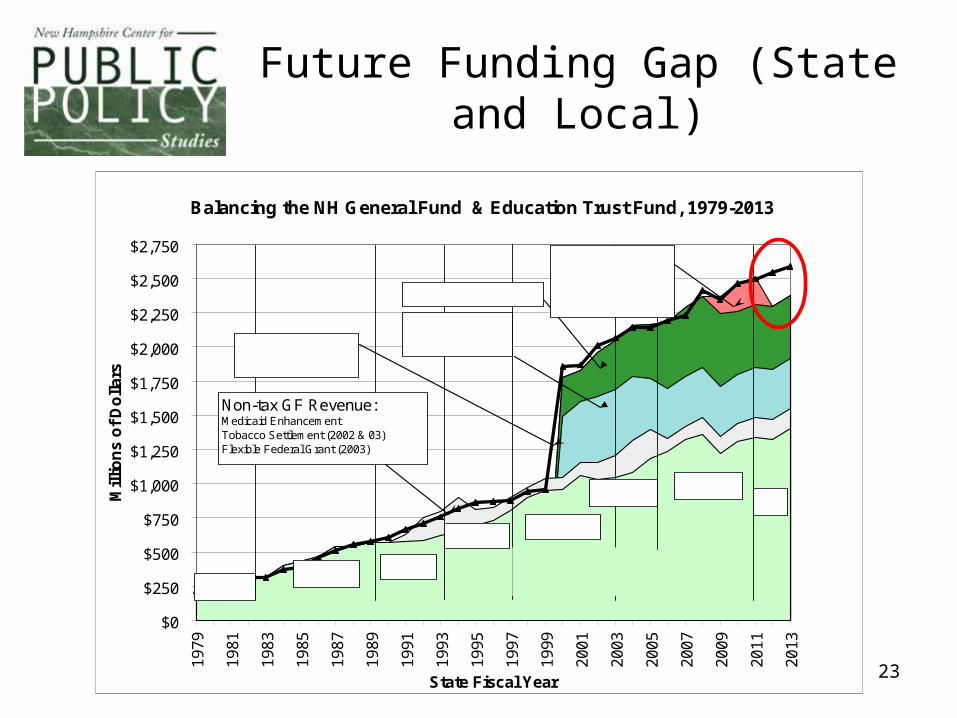
Balancing the NH General Fund & Education Trust Fund, 1979-2013
$0
$250
$500
$750
$1,000
$1,250
$1,500
$1,750
$2,000
$2,250
$2,500
$2,750
1979
1981
1983
1985
1987
1989
1991
1993
1995
1997
1999
2001
2003
2005
2007
2009
2011
2013
State Fiscal Year
Mil
lio
ns
of
Do
llar
s
Non-tax GF Revenue:Medicaid EnhancementTobacco Settlement (2002 & 03)Flexible Federal Grant (2003)
GF + ETF Expenditures
Merrill
GreggSununuGallen
Shaheen
Benson
Regular General Fund Taxes and Revenues
Statewide Property Tax
Other ETF Taxes
Lynch?
Stimulus (ARRA of 2009)
and JUA
Future Funding Gap (State and Local)
24
What is NH?
The Tech Corridor?
The Lakes RegionThe North Country
The Seacoast
The Capital RegionThe Monadnock Region
Mt Washington Valley
25
The Future is Uncertain but Opportunities Exist
• Speed of Change • Watch the Demographics
– Recession changing migration patterns Recession changes income – Aging will occur. – Yes, we are aging, but when do real problems emerge?
• Do the right models of care exist for a new generation?– Transportation (where are people living?)– Other services (meals on wheels, congregate meals, adult home and
adult day care?) • Changing disability and demand for services offer new opportunities
and partnerships– Mental Health/Health Care Needs?– Employers and care giving (we have childcare ….) ?
• Budget Realities require different approaches
Related Documents