1 National Household Travel Survey (NHTS) Add-on Status Model Task Force Data Committee October 17, 2008

Welcome message from author
This document is posted to help you gain knowledge. Please leave a comment to let me know what you think about it! Share it to your friends and learn new things together.
Transcript

1
National Household Travel Survey (NHTS) Add-on Status
Model Task Force Data CommitteeOctober 17, 2008

2
Presentation Overview
Funding and NHTS Background
Sampling Plan
Current Status
Discussion
3
Funding and NHTS Background
Funding approved by MPOAC via PL Funds
– Total cost for 12,000 urban samples is $2,100,000
– Data analysis & tabulation $500,000
– FDOT allocated $350,000 for 2,000 rural samples

4
Funding and NHTS Background
Daily data collected includes:
– Purpose of the trip (work, shopping, etc.)
– Means of transportation used (car, bus, subway, walk, etc.)
– How long the trip took (i.e., travel time)
– Time of day when the trip took place
– Day of week when the trip took place
– Private vehicle trip details
number of people in the vehicle (i.e., vehicle occupancy)
driver characteristics (age, sex, worker status, education level, etc.)
vehicle attributes (make, model, model year, amount of miles driven in a year)

5
Funding and NHTS Background
Data used to:
– Quantify travel behavior
– Analyze changes in travel characteristics over time
– Relate travel behavior to the demographics of the traveler
– Study the relationship of demographics and travel over time
Data items not included:
– Travel costs
– Information on specific routes
– Longitudinal information
– Reasons for specific mode

6
Sampling Plan
Proposed Sampling Plan– Region 1 – Collier, Lee, Charlotte, Sarasota, and Manatee (Census 2000
Households: 545,158 )– Region 2 – Duval, St. Johns, Clay, Nassau, and Alachua (Census 2000
Households: 613,890 )– Region 3 – Leon, Gadsen, Wakulla, Walton, Okaloosa, Santa Rosa, Escambia,
and Bay (Census 2000 Households: 424,149 )– Region 4 – Broward, Miami-Dade, Palm Beach, Indian River, St. Lucie, and Martin
(Census 2000 Households: 2,150,666 )– Region 5 – Orange, Osceola, Seminole, Lake, Sumter, Brevard, Volusia, and
Marion (Census 2000 Households: 1,040,095 )– Region 7 – District 7 (except Citrus) and Polk (Census 2000 Households:
1,196,954 )– Region 8 – Rural counties not in the first six (Census 2000 Households: 370,209 )

7
Sampling Plan
Sample Size Confidence Interval (95% CL)
RegionNumber of Households Original Revised Original Revised
1 545,158 1,096 1,200 ± 3.0% ± 2.8%
2 613,890 1,234 1,234 ± 2.8% ± 2.8%
3 424,149 852 1,200 ± 3.4% ± 2.8%
4 2,150,666 4,322 4,116 ± 1.5% ± 1.5%
5 1,040,095 2,090 2,000 ± 2.1% ± 2.2%
7 1,196,954 2,406 2,250 ± 2.0% ± 2.1%
8 370,209 2,000 2,000 ± 2.2% ± 2.2%
Total 6,341,121 14,000 14,000 ± 0.8% ± 0.8%

8
Sampling Plan
Region Sample Size
Region 1 1,200
Region 2 1,224
Region 3 1,200
Region 4 4,116
Region 5 2,000
Region 7 2,250
Region 8 2,000
9
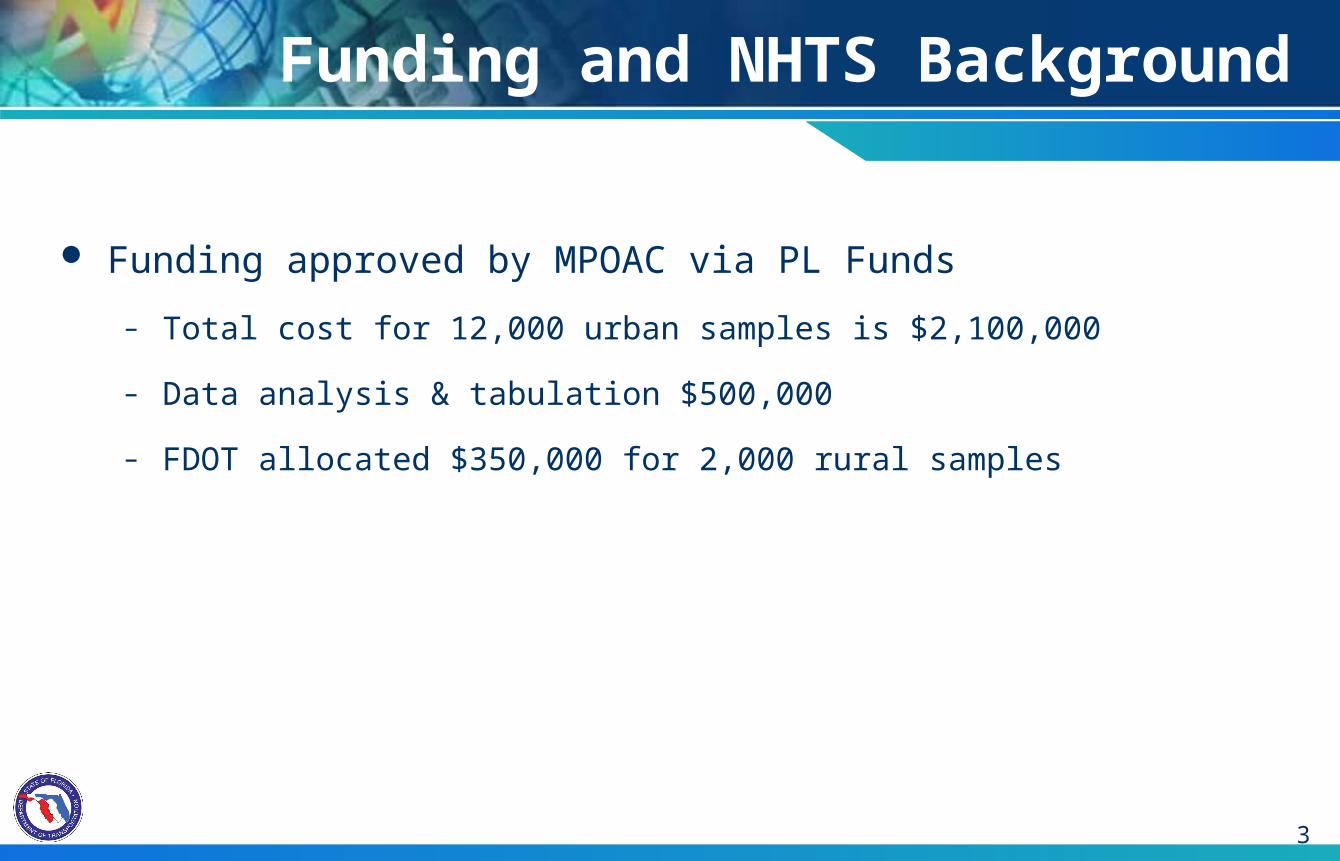
Sampling Plan
MPO Sample Size
Each MPO will be sampled such that atleast 80% of the sampled
households from the MPO are included in the region sample
Why do this?
– Makes data collection more cost effective
– Ensures sufficient samples for segmentation
10
Sampling Plan
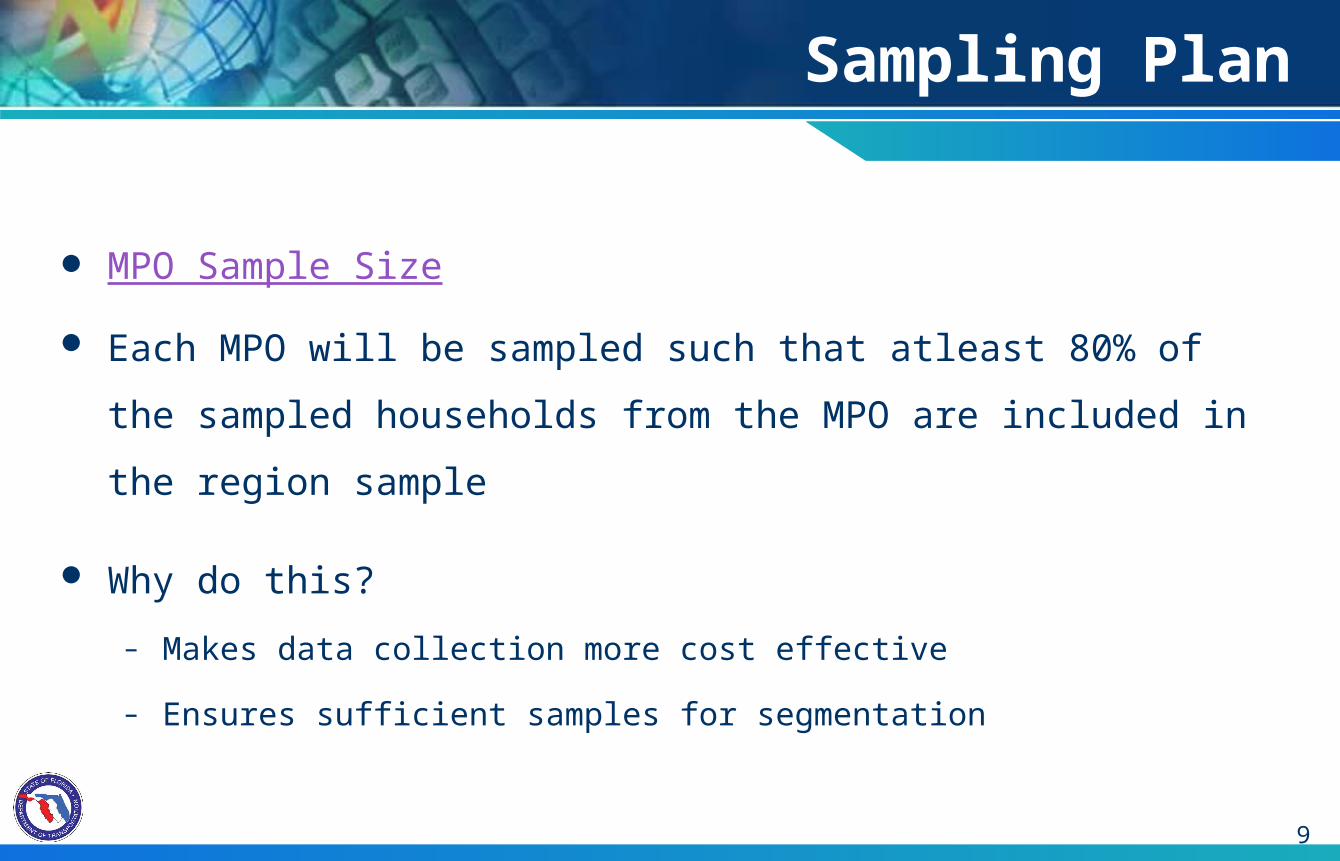
Rural Counties
FDOT District Total Households Sample SizeConfidence Interval (95% CL)
1 83,828 453 ± 4.6%
2 125,436 678 ± 3.8%
3 51,894 280 ± 5.9%
5 21,284 115 ± 9.2%
6 35,106 190 ± 7.1%
7 52,661 284 ± 5.8%
Rural Total 370,209 2,000 ± 2.2%

11
Current Status
Very positive response rate
Slated to complete in April 2009
Region
Category Total FL
Total Target Sample Size 14,000 14,000
Useable Households (final) as of 10/14/2008 6,278 6,278
% of Completion Goal 44.8% 44.8%
Extended (Retrieval) HH Cooperation Rate (%) 74.1% 74.1%

12
Current Status
0%
10%
20%
30%
40%
50%
60%
70%
80%
90%
100%
Per
cen
t C
om
ple
te
Region 1 Region 2 Region 3 Region 4 Region 5 Region 7 Region 8
Sampling Region
Statewide Completion

13
0%
10%
20%
30%
40%
50%
60%
70%
80%
90%
100%
Per
cen
t C
om
ple
te
Charlotte County-Punta Gorda MPO
Collier County MPO Lee County MPO Sarasota/ManateeMPO
North Florida TPO Gainesville MTPO
MPO
Region 1 and Region 2
Current Status

14
Current Status
0%
10%
20%
30%
40%
50%
60%
70%
80%
90%
100%
Per
cen
t C
om
ple
te
Bay CountyTPO
CapitalRegion
TPA
Florida-Alabama
TPO
Okaloosa-Walton TPO
BrowardMPO
IndianRiver
CountyMPO
MartinCounty
MPO
Miami-Dade PalmBeachCounty
MPO
St. LucieTPO
MPO
Region 3 and Region 4

15
Current Status
0%
10%
20%
30%
40%
50%
60%
70%
80%
90%
100%
Pe
rce
nt
Co
mp
lete
Brevard MPO Lake-SumterMPO
Ocala/MarionCounty TPO
METROPLANOrlando
Volusia CountyMPO
HernandoCounty MPO
HillsboroughCounty MPO
Pasco CountyMPO
Pinellas CountyMPO
Polk TPO
MPO
Region 5 and Region 7

16
Current Status
10%
11%
12%
13%
14%
15%
Sunday Monday Tuesday Wednesday Thursday Friday Saturday
Travel Day of Week

17
Discussion
Related Documents