1 Methods for Methods for Estimating Estimating Reliability Reliability Dr. Shahram Yazdani

1 Methods for Estimating Reliability Dr. Shahram Yazdani.
Dec 16, 2015
Welcome message from author
This document is posted to help you gain knowledge. Please leave a comment to let me know what you think about it! Share it to your friends and learn new things together.
Transcript
1
Methods for Methods for Estimating Estimating ReliabilityReliability
Dr. Shahram Yazdani
Dr. Shahram Yazdani
2
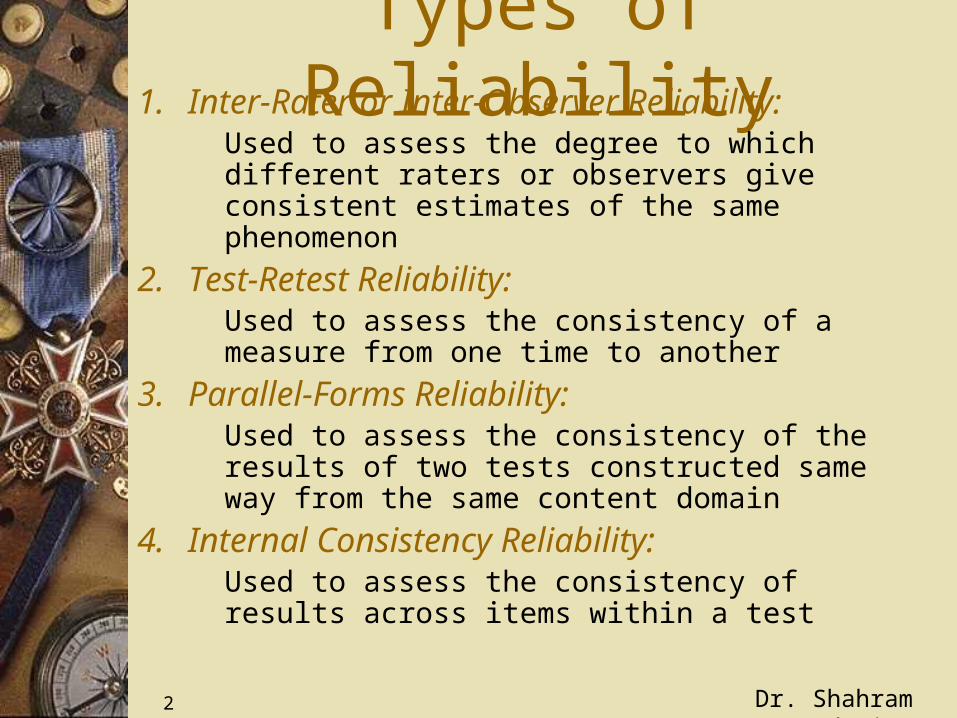
Types of Reliability1. Inter-Rater or Inter-Observer Reliability:
Used to assess the degree to which different raters or observers give consistent estimates of the same phenomenon
2. Test-Retest Reliability:Used to assess the consistency of a measure from one time to another
3. Parallel-Forms Reliability:Used to assess the consistency of the results of two tests constructed same way from the same content domain
4. Internal Consistency Reliability:Used to assess the consistency of results across items within a test
Dr. Shahram Yazdani
3
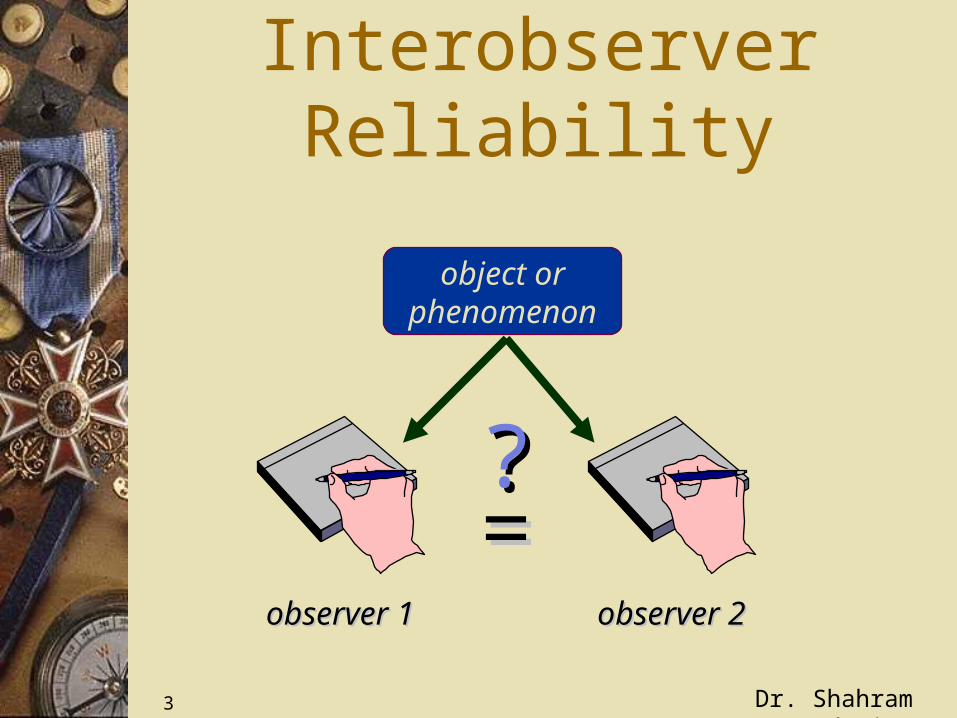
Interrater or Interobserver
Reliability
object orphenomenon
observer 1observer 1 observer 2observer 2
==??
Dr. Shahram Yazdani
4
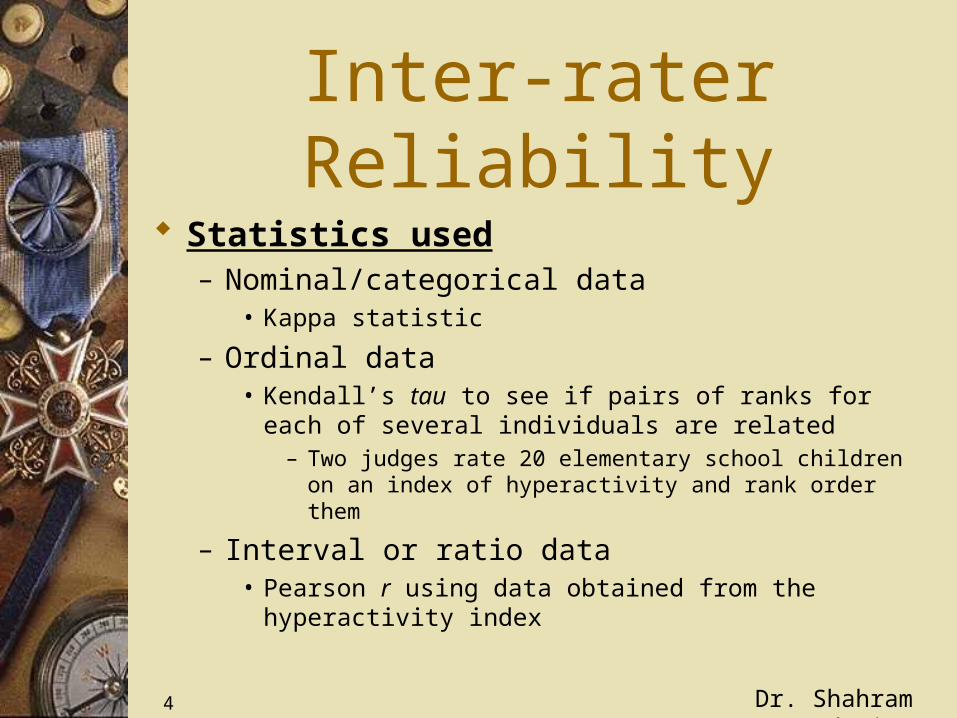
Inter-rater Reliability Statistics used
– Nominal/categorical data• Kappa statistic
– Ordinal data• Kendall’s tau to see if pairs of ranks for each of several
individuals are related– Two judges rate 20 elementary school children on an index of
hyperactivity and rank order them
– Interval or ratio data• Pearson r using data obtained from the hyperactivity index
Dr. Shahram Yazdani
5
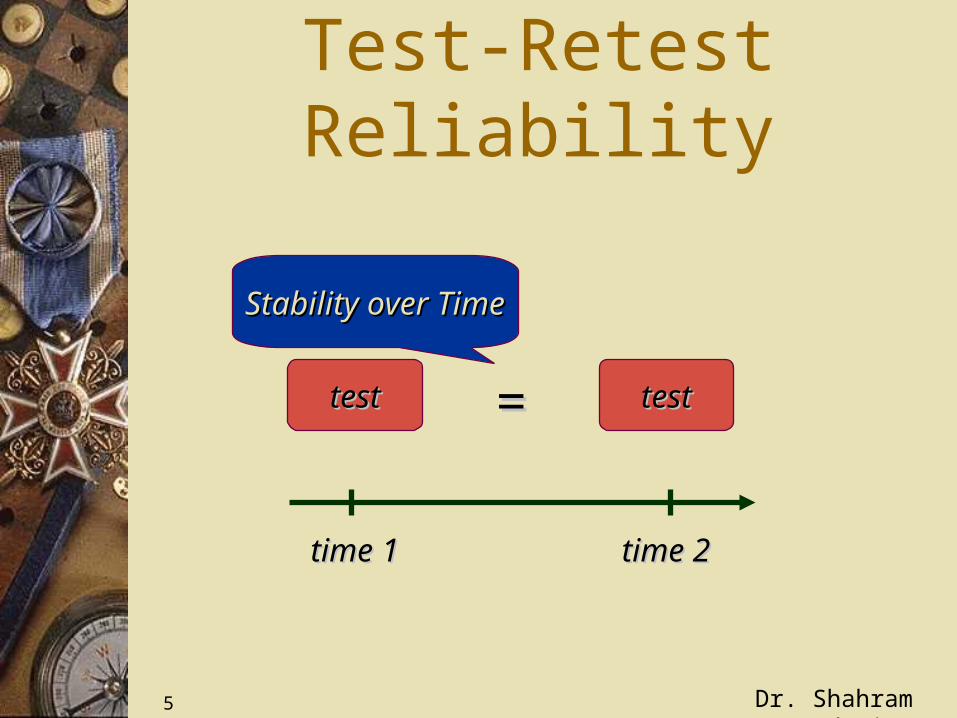
Test-Retest Reliability
testtest testtest
time 1time 1 time 2time 2
==
Stability over TimeStability over Time
Dr. Shahram Yazdani
6
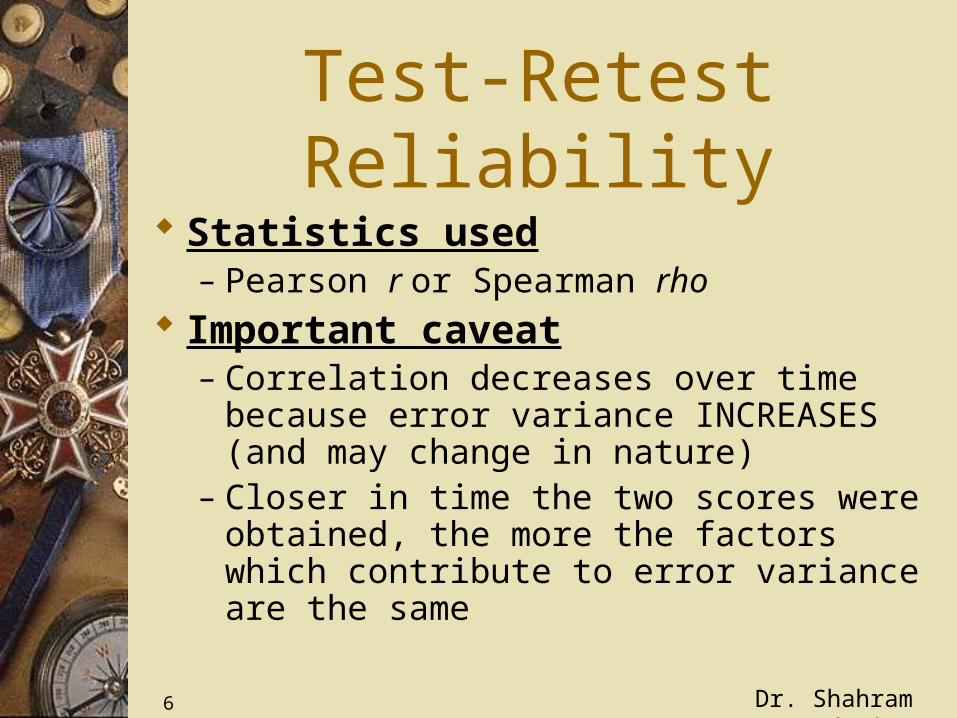
Test-Retest Reliability
Statistics used– Pearson r or Spearman rho
Important caveat– Correlation decreases over time because error
variance INCREASES (and may change in nature)
– Closer in time the two scores were obtained, the more the factors which contribute to error variance are the same
Dr. Shahram Yazdani
7
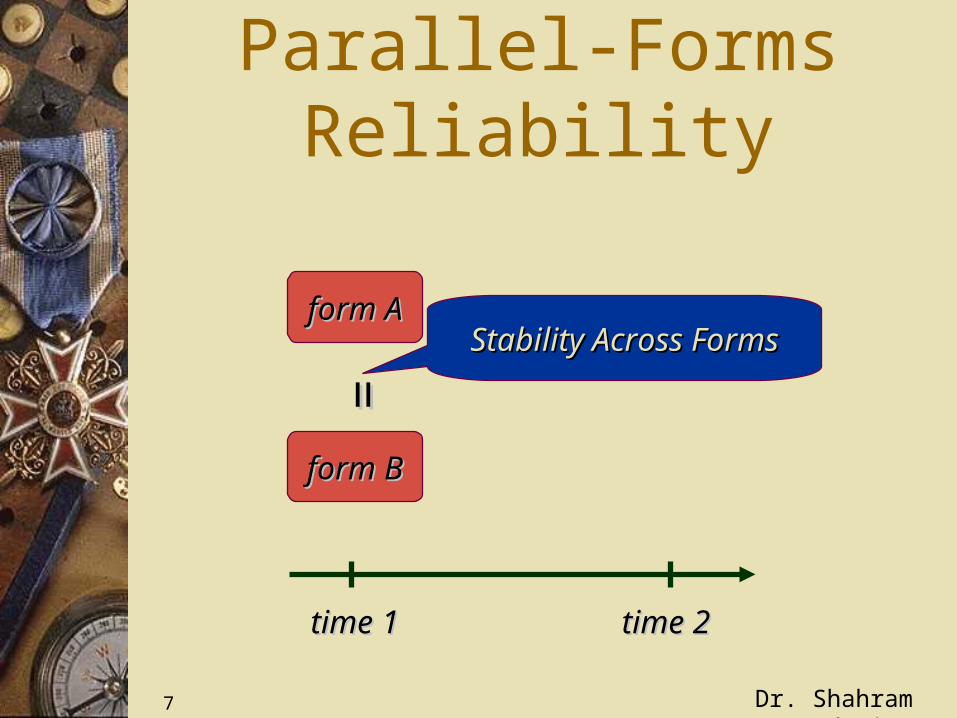
Parallel-Forms Reliability
time 1time 1 time 2time 2
form Bform B
form Aform AStability Across FormsStability Across Forms
==
Dr. Shahram Yazdani
8
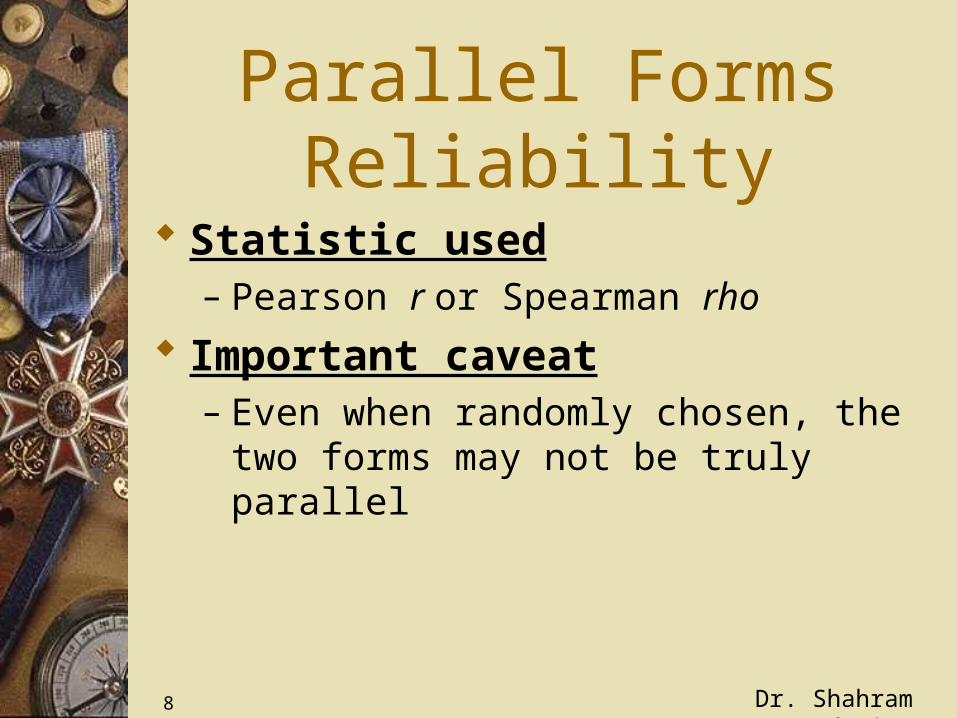
Parallel Forms Reliability
Statistic used– Pearson r or Spearman rho
Important caveat– Even when randomly chosen, the two forms
may not be truly parallel
Dr. Shahram Yazdani
9
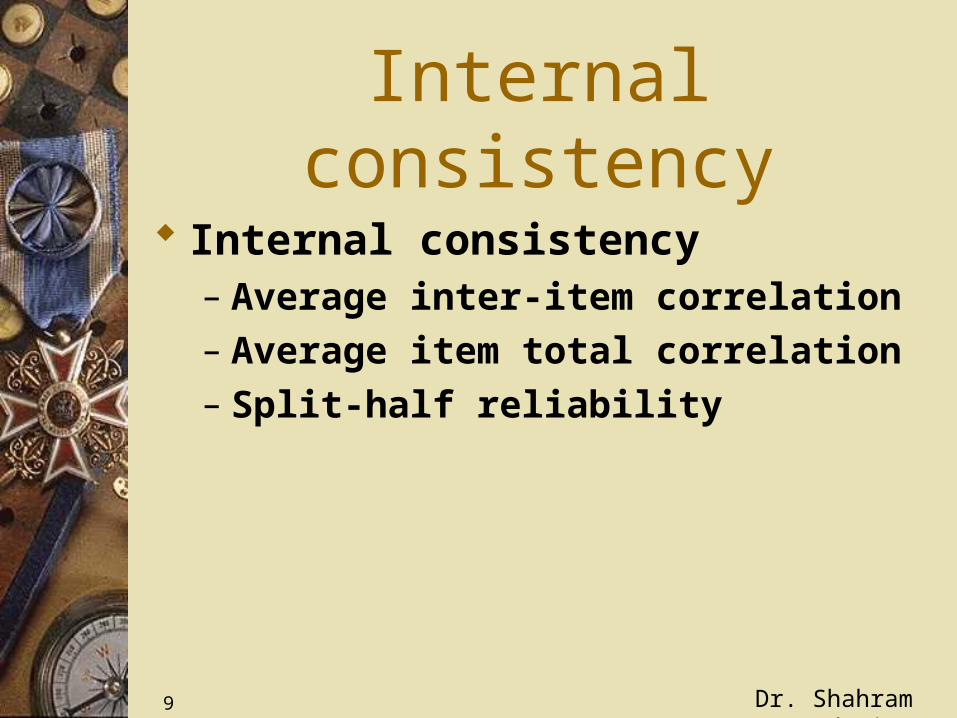
Internal consistency Internal consistency
– Average inter-item correlation– Average item total correlation– Split-half reliability
Dr. Shahram Yazdani
10
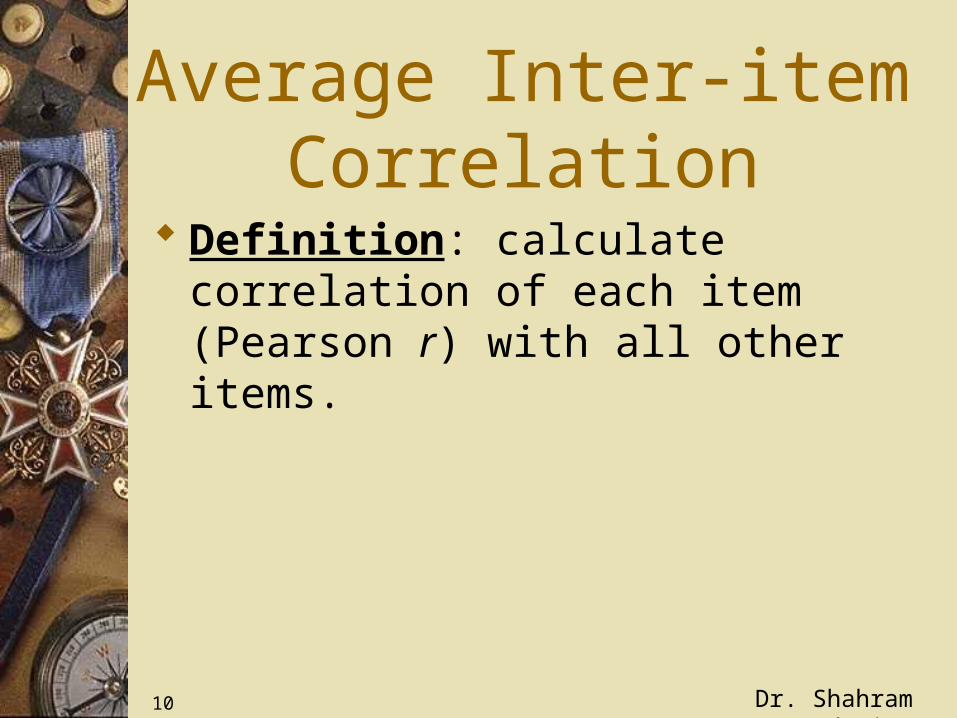
Average Inter-item Correlation
Definition: calculate correlation of each item (Pearson r) with all other items.
Dr. Shahram Yazdani
11
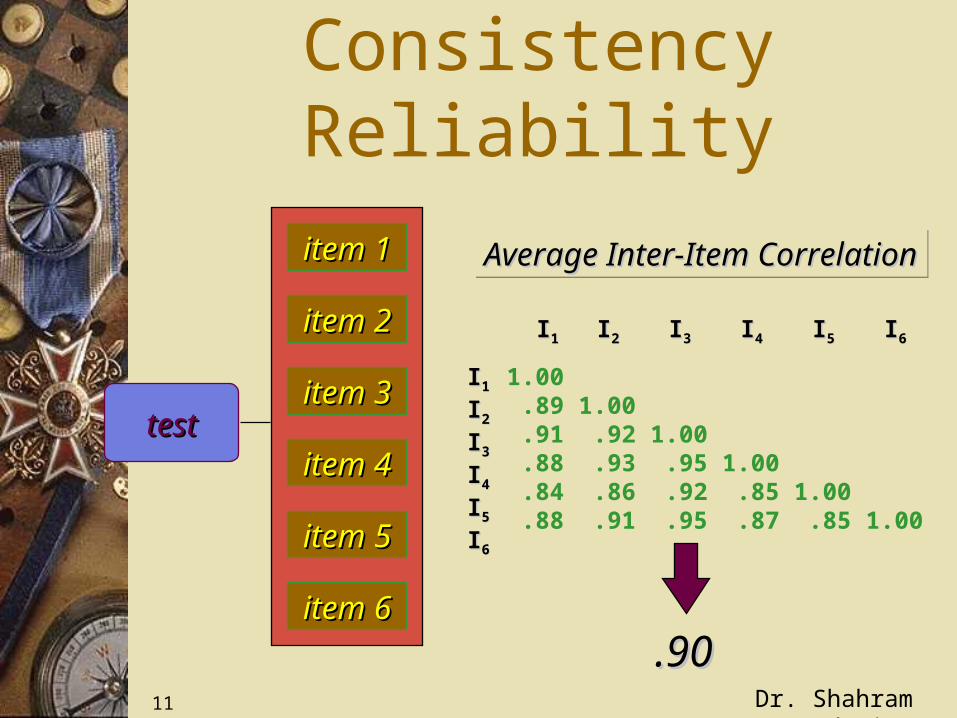
Internal Consistency Reliability
testtest
item 1item 1
item 2item 2
item 3item 3
item 4item 4
item 5item 5
item 6item 6
1.00.89 1.00.91 .92 1.00.88 .93 .95 1.00.84 .86 .92 .85 1.00.88 .91 .95 .87 .85 1.00
II11 II22 II33 II44 II55 II66
II11
II22
II33
II44
II55
II66
Average Inter-Item CorrelationAverage Inter-Item CorrelationAverage Inter-Item CorrelationAverage Inter-Item Correlation
.90.90
Dr. Shahram Yazdani
12
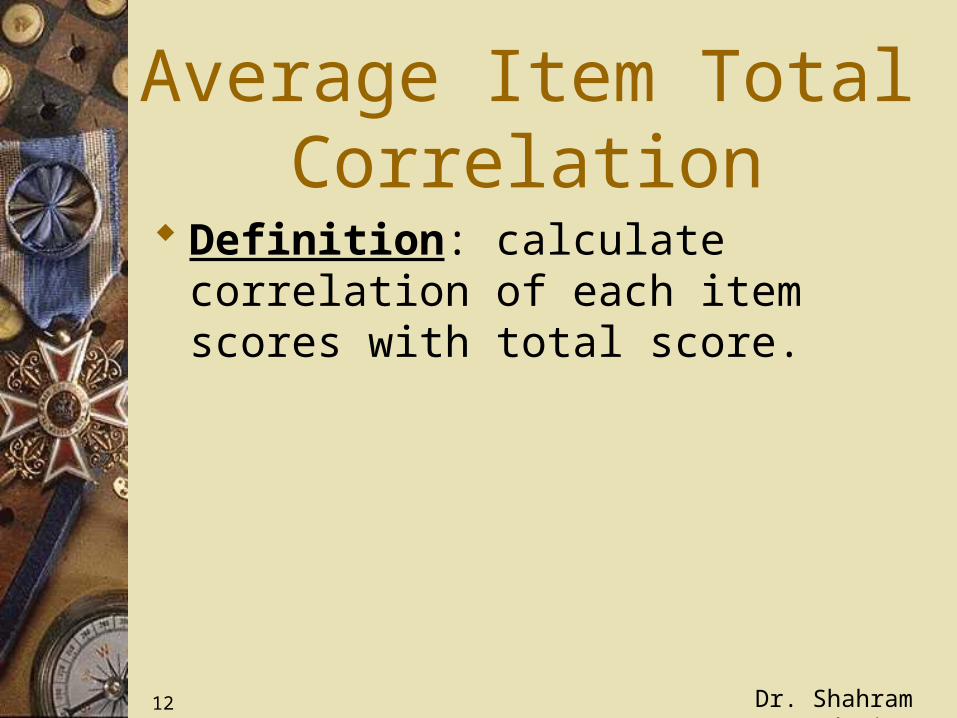
Average Item Total Correlation
Definition: calculate correlation of each item scores with total score.
Dr. Shahram Yazdani
13
testtest
item 1item 1
item 2item 2
item 3item 3
item 4item 4
item 5item 5
item 6item 6
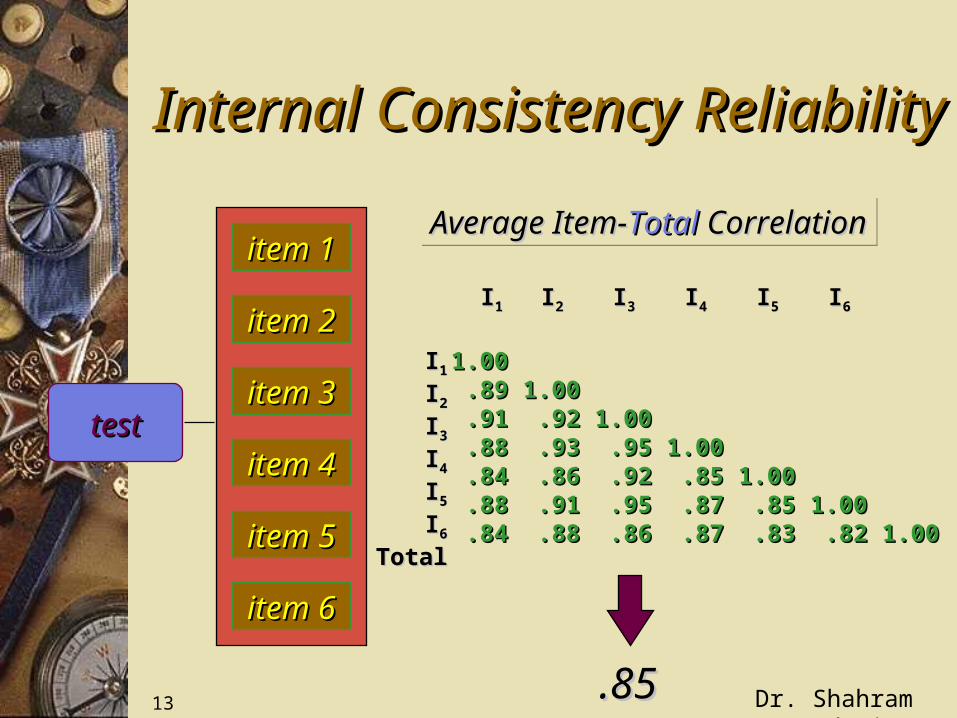
1.001.00.89.89 1.00 1.00.91.91 .92.92 1.00 1.00.88.88 .93.93 .95.95 1.00 1.00.84.84 .86.86 .92.92 .85.85 1.00 1.00.88.88 .91.91 .95.95 .87.87 .85.85 1.00 1.00.84.84 .88.88 .86.86 .87.87 .83.83 .82.82 1.001.00
II11 II22 II33 II44 II55 II66
II11
II22
II33
II44
II55
II66
TotalTotal
Average Item-Average Item-Total Total CorrelationCorrelationAverage Item-Average Item-Total Total CorrelationCorrelation
.85.85
Internal Consistency Internal Consistency ReliabilityReliability
Dr. Shahram Yazdani
14
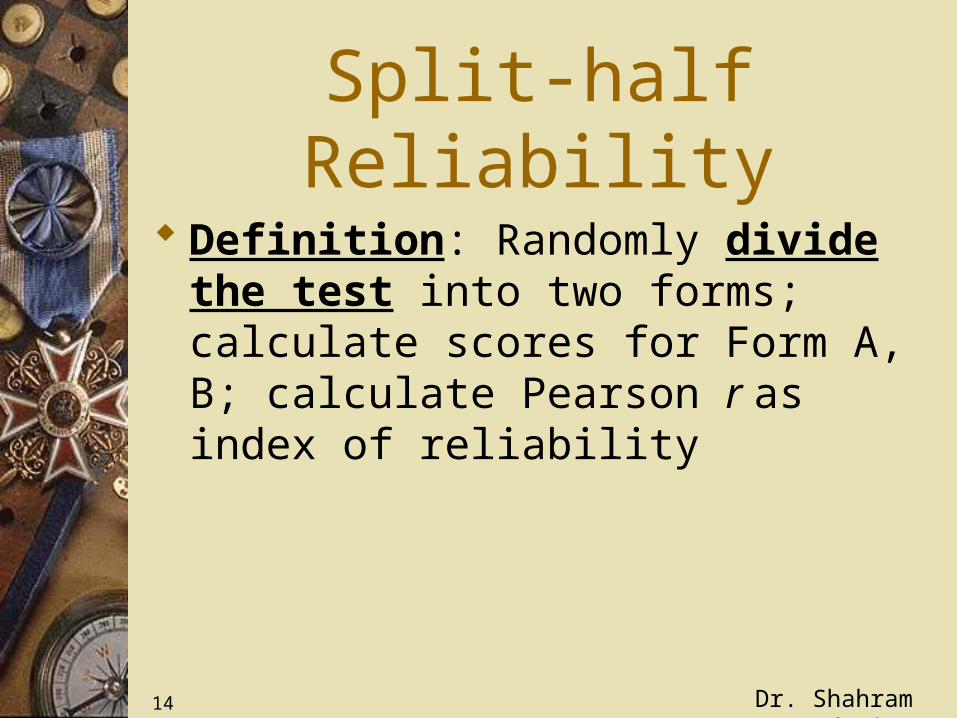
Split-half Reliability Definition: Randomly divide the test into
two forms; calculate scores for Form A, B; calculate Pearson r as index of reliability
Dr. Shahram Yazdani
15
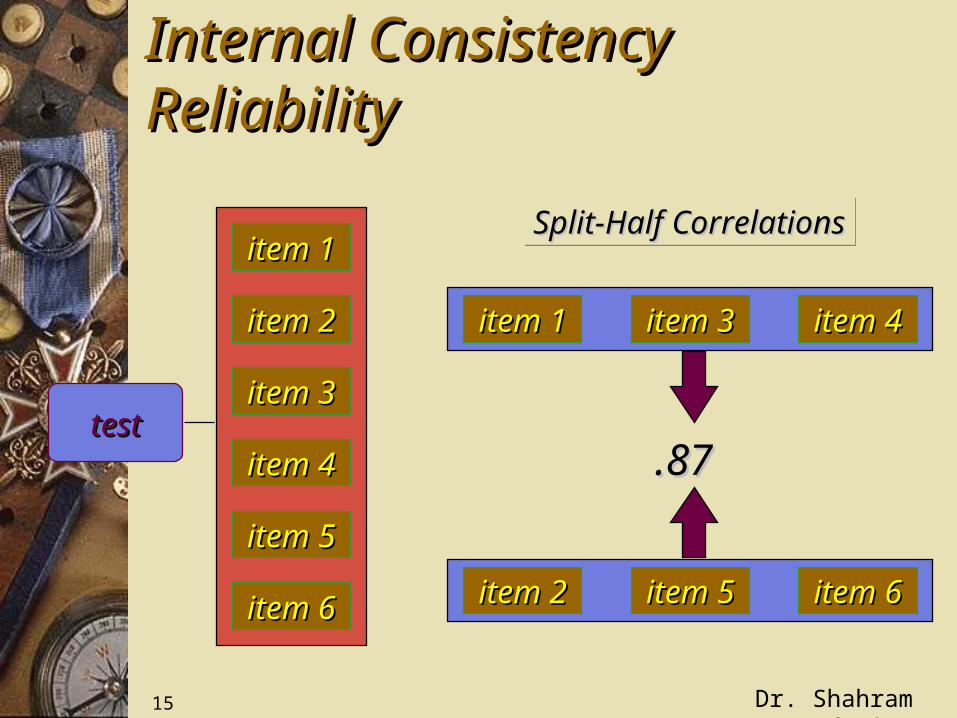
testtest
item 1item 1
item 2item 2
item 3item 3
item 4item 4
item 5item 5
item 6item 6
Split-Half CorrelationsSplit-Half CorrelationsSplit-Half CorrelationsSplit-Half Correlations
item 1item 1 item 3item 3 item 4item 4
item 2item 2 item 5item 5 item 6item 6
.87.87
Internal Consistency Internal Consistency ReliabilityReliability

Dr. Shahram Yazdani
16
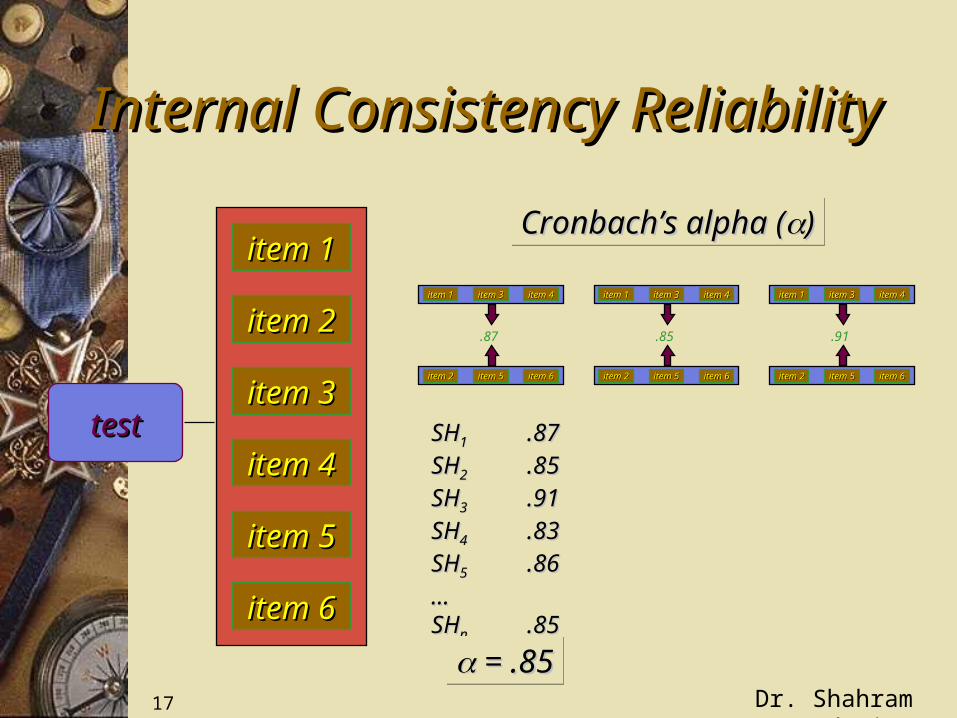
Cronbach’s alpha & Kuder-Richardson-20
Measures the extent to which items on a test are homogeneous; mean of all possible split-half combinations– Kuder-Richardson-20 (KR-20): for
dichotomous data– Cronbach’s alpha: for non-dichotomous data
Dr. Shahram Yazdani
17
testtest
item 1item 1
item 2item 2
item 3item 3
item 4item 4
item 5item 5
item 6item 6
Cronbach’s alpha (Cronbach’s alpha ())Cronbach’s alpha (Cronbach’s alpha ())
.87
item 1item 1 item 3item 3 item 4item 4
item 2item 2 item 5item 5 item 6item 6
.85
item 1item 1 item 3item 3 item 4item 4
item 2item 2 item 5item 5 item 6item 6
.91
item 1item 1 item 3item 3 item 4item 4
item 2item 2 item 5item 5 item 6item 6
SHSH11 .87.87
SHSH22 .85.85
SHSH33 .91.91
SHSH44 .83.83
SHSH55 .86.86
......SHSHnn .85.85
= .85= .85 = .85= .85
Internal Consistency Internal Consistency ReliabilityReliability
Dr. Shahram Yazdani
18
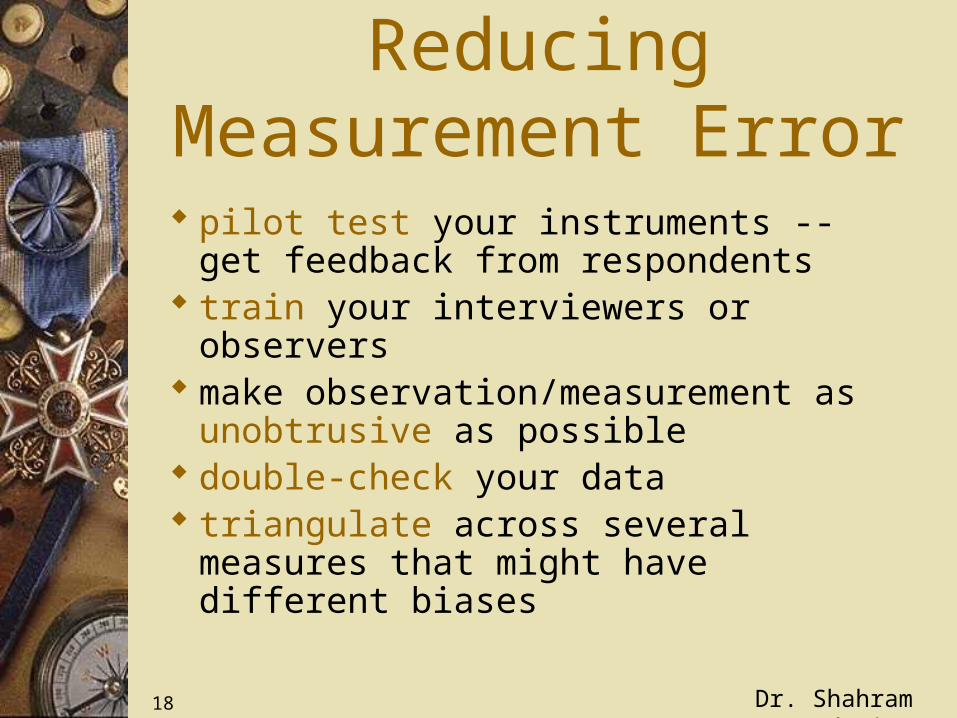
Reducing Measurement Error
pilot test your instruments -- get feedback from respondents
train your interviewers or observers make observation/measurement as
unobtrusive as possible double-check your data triangulate across several measures
that might have different biases
Dr. Shahram Yazdani
19
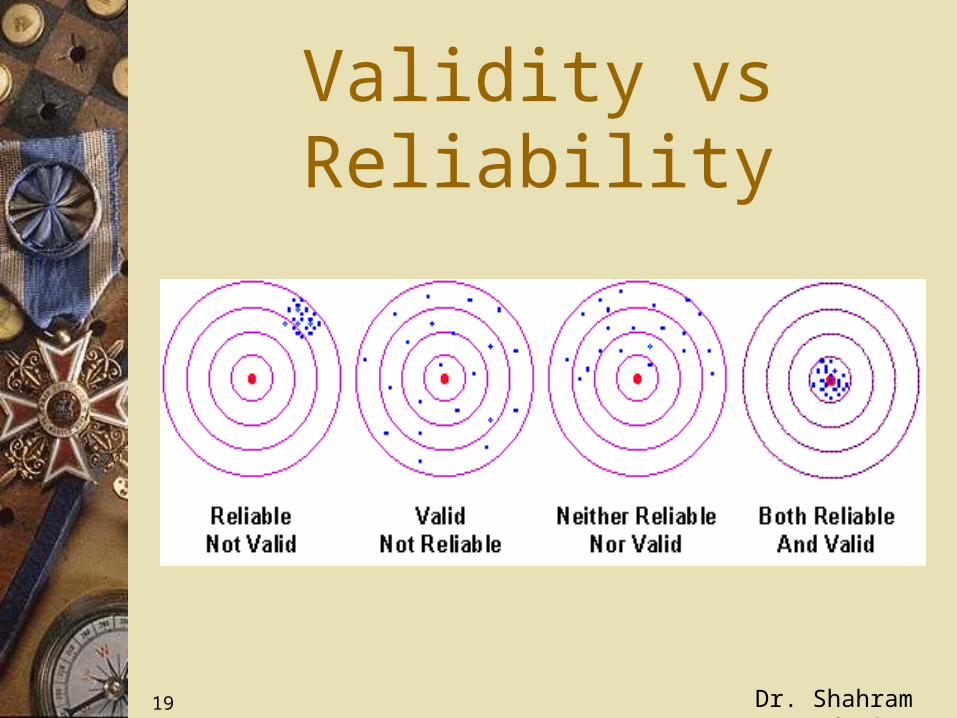
Validity vs Reliability

Dr. Shahram Yazdani
20
Thank you !
Any Question ?
Related Documents